mu-mimo and the user experience - qualcomm and the user experience quantifying the benefits of more...
TRANSCRIPT

On behalf of Qualcomm, Signals Research Group conducted third-party testing of 802.11ac. The comparative tests, which focused largely on video appli-cations, included 2x2 versus 1x1 antenna configurations, 80 MHz versus 20 MHz channel allocations, and MU-MIMO versus SU-MIMO.
As the sole authors of this study, we stand fully behind the results and analysis that we provide in this paper. In addition to providing consulting services on wireless-related topics, including performance benchmark studies, Signals Research Group is the publisher of the Signals Ahead research newsletter (www.signalsresearch.com).
www.signalsresearch.com
MU-MIMO AND THE USER EXPERIENCEQUANTIFYING THE BENEFITS OF MORE ADVANCED 802.11AC FEATURES
February 2016
Prepared bySignals Research Group
Paper developed for Qualcomm
Page 2February 2016
www.signalsresearch.com
MU-MIMO and the User ExperienceQuantifying the benefits of more advanced 802.11ac features
Executive SummaryAlthough 802.11ac offers compelling data rates to individual users, its real potential reveals itself with the inclusion of more advanced features that deliver even higher individual data rates under a wide range of network conditions, not to mention increased network capacity. From a consumer’s perspective, these benefits are obvious when it comes to typical applications, such as video streaming.
MU-MIMO (Multi-user Multiple Input, Multiple Output) is a recently introduced Wave 2 feature that increases overall Wi-Fi system capacity by enabling the Wi-Fi access point (AP) to transmit simultaneously to several compatible Wi-Fi Stations (STAs), essentially duplicating the use of available spectrum resources. The predecessor to MU-MIMO, SU-MIMO (Single User MIMO), limits the AP’s transmission to a single STA at any given moment, without any reuse of the radio channel.
A 2x2 antenna configuration in the STA is another advanced feature, which can meaningfully improve the user experience. Although it is not unique to 802.11ac, a 2x2 antenna configuration allows a Wi-Fi AP to transmit two data streams to a STA. This feature, which is called spatial multiplexing, can result in a near doubling in the user data rate. Other indirect benefits are also possible, based on our findings.
Signals Research Group (SRG) recently conducted a third-party analysis of 802.11ac perfor-mance with a particular focus on the incremental benefits that these more advanced 802.11ac features have on the user experience. The Qualcomm QCA9980 powered the Wi-Fi APs that we used in our tests and the Wi-Fi STAs, which included a mix of commercial smartphones, test phones, and commercial notebook PCs, leveraged the Qualcomm QCA 6174A WiFi-Bluetooth Combo SoC. Based on the results of our study, we offer the following observations, which we support with test results and analysis in subsequent sections of this whitepaper.
A 2x2 antenna configuration nearly doubles the data rate at all levels of signal strength and it can dramatically improve the user experience by reducing video freezes and frame impair-ments. We measured the data rates of a STA with a 2x2 antenna configuration (STA 2x2) and a STA with a 1x1 antenna configuration (STA 1x1) over a full range of downlink pathloss values. STA 2x2 achieved 89% higher throughput over the entire test compared with STA 1x1 and it was able to maintain a data connection with an additional 6 dB of pathloss. In tests involving a congested Wi-Fi network, STA 2x2 streamed a video with hardly any video freezes or impair-ments. Conversely, STA 1x1 had a considerable number of video freezes to the point that we doubt most consumers would continue watching the video. We also documented reduced latency and jitter, not to mention lower packet loss with the 2x2 antenna configuration.
A Wi-Fi AP with MU-MIMO capabilities delivers significantly more network capacity, which benefits all users, including those users with a STA that does not support MU-MIMO. We conducted numerous tests with the Wi-Fi AP configured to support either MU-MIMO or SU-MIMO. With MU-MIMO enabled, the total capacity increased by up to 112%. The additional network capacity should be obvious to any user in the network. Besides higher data rates, the consumer would easily notice that streamed videos would play nearly flawlessly while with SU-MIMO there would be frequent stalls while viewing the video. Interestingly, STAs without support for MU-MIMO also benefited indirectly from the additional capacity that MU-MIMO delivered.
MU-MIMO is a Wave 2 feature that increases overall
Wi-Fi system capacity.

Page 3February 2016
www.signalsresearch.com
MU-MIMO and the User ExperienceQuantifying the benefits of more advanced 802.11ac features
The more advanced 802.11ac features and the benefits that they offer are critical to deliver a great user experience, especially in multi-tenant buildings where multiple Wi-Fi systems exist. When 802.11ac products first appeared, consumers and the industry lauded them for the dramatic capacity gains that they offered over legacy Wi-Fi technologies. In the subsequent years, the performance has gone from what some might have considered overkill to being barely adequate. Consumer behavior has changed, user expectations have become more demanding, and popular applications, such as video, require substantially higher bit rates in order to deliver a great user experience. Further, Wi-Fi systems using the unlicensed 5 GHz spectrum are far more prevalent, meaning that multi-tenant buildings likely have multiple Wi-Fi APs in a close proximity to each other, including APs that share the same radio channel. When this situation occurs, the available capacity on both Wi-Fi systems suffers since the two APs are competing for channel access time. All of these factors pave the way for Wave 2 features and a more advanced antenna configuration in STAs, not to mention wider channel allocations (i.e., 80 MHz versus 20 MHz).
The following sections provide results and analysis from several test scenarios, which support these observations. We also include a Test Methodology section, which documents how we used the Spirent Communications’ Chromatic test platform and other test and measurement systems to conduct the tests. This section also includes a brief explanation of some of the video performance metrics that we used in this report. Lastly, we include an Appendix, which contains additional figures and results from tests that we did not include in the main body of this paper.
We used the Spirent Communications’ Chromatic test platform and other test
and measurement systems to conduct the tests.

Page 4February 2016
www.signalsresearch.com
MU-MIMO and the User ExperienceQuantifying the benefits of more advanced 802.11ac features
A 2x2 antenna configuration delivers substantially higher throughput and a much better user experience in a congested networkOne of the more surprising observations from our work over the last six months with Wi-Fi-related benchmark studies is we’ve noticed that a rather large percentage of smartphones do not have a 2x2 Wi-Fi antenna configuration. This is even more surprising given that Wi-Fi has supported MIMO since 802.11n, or back to the previous decade. MIMO is also a critical part of the HSPA+ and LTE cellular standards since it can meaningfully improve user data rates as well as increase overall network capacity. To the best of our knowledge, it is virtually impossible to purchase an LTE smartphone without MIMO while MIMO is also very common in HSPA+ smartphones. For reasons that we cannot explain, the same trend does not exist with Wi-Fi.
With single-user MIMO and a 2x2 antenna configuration in the STA, the Wi-Fi AP is able to transmit two data streams – also called spatial multiplexing – to a STA. Since each stream is comprised of unique data, it is possible to achieve a theoretical doubling of the potential data rate under ideal conditions compared with a 1x1 antenna configuration that is limited to a single data stream. Under very challenging situations, the 2x2 antenna configuration provides some additional performance improvements due to the diversity gain of the two antennas, even though the Wi-Fi AP is only transmitting a single data stream.
As shown in Figure 1, a Wi-Fi STA with a 2x2 antenna configuration (STA 2x2) can achieve a near doubling in data speeds compared with a STA that only has a 1x1 antenna configuration (STA 1x1). Under more ideal conditions with low pathloss, STA 2x2 achieved a data rate of nearly 700 Mbps in an 80 MHz channel. Conversely, the data rate for STA 1x1 was approximately 375 Mbps. With high pathloss, STA 2x2 was also able to maintain a data connection for an additional 6 dB beyond what was possible with STA 1x1. Over the entire range of pathloss values, STA 2x2 outperformed STA 1x1 by 89%.
STA 2x2 outperformed STA 1x1 by 89% over the entire
range of pathloss values.
2x2 Config Performance Advantage (%)
2x2 Config Performance Advantage (%)
0%
20%
40%
60%
80%
100%
120%
0
100
200
300
400
500
600
700
800
Throughput (Mbps)
44 48 52 56 60 64 68 72 76 80 84 88 92 96 100 104 108 112 116 120
Downlink Pathloss (dB)
1x1 Config
2x2 Config
Figure 1. Throughput as a Function of Downlink Pathloss – 2x2 versus 1x1 antenna configurations (Test 65-66)
Source: Signals Research Group
Page 5February 2016
www.signalsresearch.com
MU-MIMO and the User ExperienceQuantifying the benefits of more advanced 802.11ac features
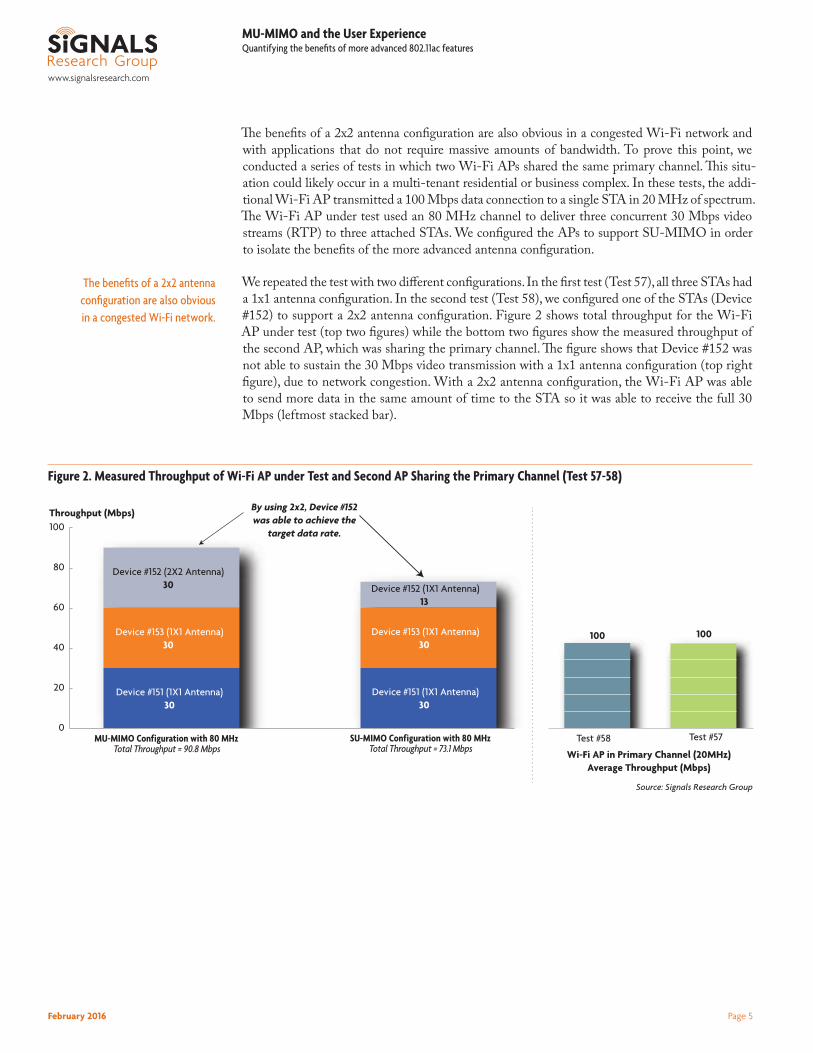
The benefits of a 2x2 antenna configuration are also obvious in a congested Wi-Fi network and with applications that do not require massive amounts of bandwidth. To prove this point, we conducted a series of tests in which two Wi-Fi APs shared the same primary channel. This situ-ation could likely occur in a multi-tenant residential or business complex. In these tests, the addi-tional Wi-Fi AP transmitted a 100 Mbps data connection to a single STA in 20 MHz of spectrum. The Wi-Fi AP under test used an 80 MHz channel to deliver three concurrent 30 Mbps video streams (RTP) to three attached STAs. We configured the APs to support SU-MIMO in order to isolate the benefits of the more advanced antenna configuration.
We repeated the test with two different configurations. In the first test (Test 57), all three STAs had a 1x1 antenna configuration. In the second test (Test 58), we configured one of the STAs (Device #152) to support a 2x2 antenna configuration. Figure 2 shows total throughput for the Wi-Fi AP under test (top two figures) while the bottom two figures show the measured throughput of the second AP, which was sharing the primary channel. The figure shows that Device #152 was not able to sustain the 30 Mbps video transmission with a 1x1 antenna configuration (top right figure), due to network congestion. With a 2x2 antenna configuration, the Wi-Fi AP was able to send more data in the same amount of time to the STA so it was able to receive the full 30 Mbps (leftmost stacked bar).
The benefits of a 2x2 antenna configuration are also obvious in a congested Wi-Fi network.
Figure 2. Measured Throughput of Wi-Fi AP under Test and Second AP Sharing the Primary Channel (Test 57-58)
100 100
0
20
40
60
80
100Throughput (Mbps)
Device #152 (2X2 Antenna) 30
Device #153 (1X1 Antenna)30
Device #151 (1X1 Antenna) 30
Device #152 (1X1 Antenna)13
Device #153 (1X1 Antenna)30
Device #151 (1X1 Antenna)30
Wi-Fi AP in Primary Channel (20MHz)Average Throughput (Mbps)
MU-MIMO Configuration with 80 MHz Total Throughput = 90.8 Mbps
SU-MIMO Configuration with 80 MHz Total Throughput = 73.1 Mbps
Test #58 Test #57
By using 2x2, Device #152 was able to achieve the
target data rate.
Source: Signals Research Group
Page 6February 2016
www.signalsresearch.com
MU-MIMO and the User ExperienceQuantifying the benefits of more advanced 802.11ac features
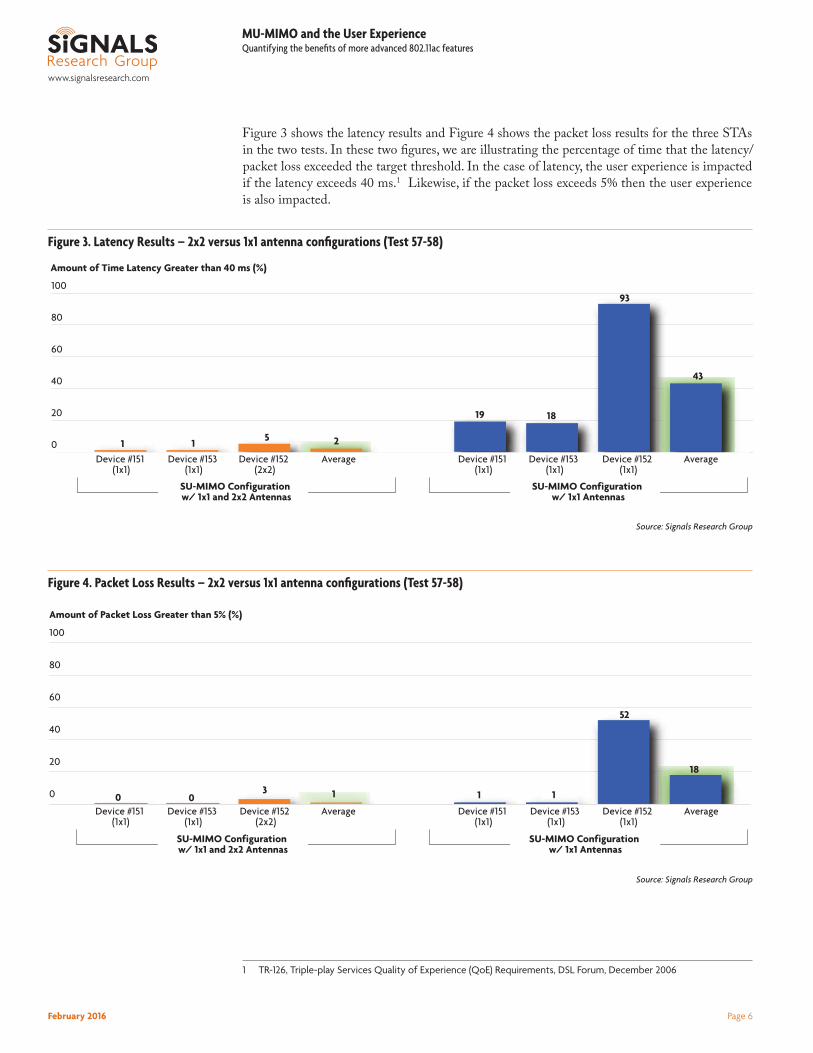
Figure 3 shows the latency results and Figure 4 shows the packet loss results for the three STAs in the two tests. In these two figures, we are illustrating the percentage of time that the latency/packet loss exceeded the target threshold. In the case of latency, the user experience is impacted if the latency exceeds 40 ms.1 Likewise, if the packet loss exceeds 5% then the user experience is also impacted.
1 TR-126, Triple-play Services Quality of Experience (QoE) Requirements, DSL Forum, December 2006
Figure 3. Latency Results – 2x2 versus 1x1 antenna configurations (Test 57-58)
1 1 5 2
19 18
93
43
0
20
40
60
80
100
Amount of Time Latency Greater than 40 ms (%)
SU-MIMO Configuration w/ 1x1 and 2x2 Antennas
SU-MIMO Configuration w/ 1x1 Antennas
AverageDevice #152 (1x1)
Device #153 (1x1)
Device #151 (1x1)
AverageDevice #152 (2x2)
Device #153 (1x1)
Device #151 (1x1)
0 03 1 1 1
52
18
0
20
40
60
80
100
Amount of Packet Loss Greater than 5% (%)
AverageDevice #152 (1x1)
Device #153 (1x1)
Device #151 (1x1)
AverageDevice #152 (2x2)
Device #153 (1x1)
Device #151 (1x1)
SU-MIMO Configuration w/ 1x1 and 2x2 Antennas
SU-MIMO Configuration w/ 1x1 Antennas
Figure 4. Packet Loss Results – 2x2 versus 1x1 antenna configurations (Test 57-58)
Source: Signals Research Group
Source: Signals Research Group

Page 7February 2016
www.signalsresearch.com
MU-MIMO and the User ExperienceQuantifying the benefits of more advanced 802.11ac features
As shown in the two figures, Device #152 with the 2x2 antenna configuration delivered a much better user experience compared with the 1x1 antenna configuration. With the 1x1 antenna configuration, the latency exceeded the target latency threshold of 40 ms for 93% of the time, but with the 2x2 antenna configuration, it was only 5% of the time. Likewise, the packet loss rate resulted in a poor user experience for 52% of the time with the 1x1 antenna configuration, but only 3% of the time with the 2x2 antenna configuration. Put another way, the amount of time that the latency and packet loss values exceeded their target thresholds was reduced by approximately 95% with the use of a 2x2 antenna configuration.
The study also reveals another interesting finding. The use of the 2x2 antenna configuration in Device #152 actually benefited the other two STAs, as evident by the two devices exceeding the latency threshold for a lower percentage of time when Device #152 had the 2x2 antenna configu-ration. We attribute this result to the increased spectral efficiency associated with the use of spatial multiplexing. Since the Wi-Fi AP was able to send the necessary video content to Device #152 in a shorter amount of time, it was able to free up more resources (time allocations) to serve the remaining two STAs.
The appendix includes two additional figures (Figure 25 and Figure 26) from this test, which provide additional insight into the latency and jitter results. We also include a complete set of results from another series of tests involving the use of 2x2 and 1x1 antenna configurations.
The 2x2 antenna configuration dramatically improved the user
experience by reducing the amount of time the latency and packet loss
exceeded the acceptable thresholds.

Page 8February 2016
www.signalsresearch.com
MU-MIMO and the User ExperienceQuantifying the benefits of more advanced 802.11ac features
A Wi-Fi AP with MU-MIMO delivers a much better user experience and higher overall throughput when network congestion existsIn order to better understand and appreciate the results presented later in this section, it is helpful to have a basic understanding of MU-MIMO and how it performs. A traditional SU-MIMO access point can only transmit to one Wi-Fi STA at any given moment. This limitation means that if the AP transmits data to five STAs, it would need to schedule them in some sort of a round robin fashion. This approach leads to inefficiencies, while each STA would also need to wait for data packets while the AP was serving other STAs. With MU-MIMO, the AP can transmit data concurrently to multiple STAs as long as there is some degree of physical separa-tion between the STAs.
Figure 5 illustrates the differences between MU-MIMO and SU-MIMO. In our tests, we used a Wi-Fi AP that could transmit three orthogonal data streams, meaning that it could transmit data to three STAs at any given moment. Alternatively, if one of the STAs had a 2x2 antenna configu-ration then it could transmit two data streams to that STA (spatial multiplexing) and a third data stream to a second STA. The figure on the left shows an MU-MIMO AP configuration. In the first time interval (T1), the AP transmits to three STAs that support MU-MIMO. In the second time interval, the AP transmits to two STAs with one of the STAs receiving two data streams. The process repeats in subsequent time intervals (T3, T4, etc.). In effect, with MU-MIMO the AP is able to “dedicate” the entire channel to up to three STAs instead of a single STA.
The figure on the right shows an SU-AP MIMO configuration. In each time interval, the AP can only transmit to a single STA, although if the STA supports a 2x2 antenna configuration then it can transmit two data streams to that STA. This situation occurs in the T5 interval.
An SU-MIMO AP can only transmit to one Wi-Fi STA at any given
moment while an MU-MIMO AP can transmit to multiple STAs.
Figure 5. MU-MIMO versus SU-MIMO
MU-MIMO(1x1)
MU-MIMO(1x1)
MU-MIMO(2x2)
MU-MIMO(1x1)
MU-MIMO(1x1)
802.11ac AP(MU-MIMO)
SU-MIMO(1x1)
SU-MIMO(1x1)
SU-MIMO(2x2)
SU-MIMO(1x1)
SU-MIMO(1x1)
802.11ac AP(SU-MIMO)
TransmittedData (T1/T3/T5)
TransmittedData (T1/T3/T5)
TransmittedData (T1/T3/T5)
TransmittedData (T1)
TransmittedData (T2)
TransmittedData (T4)
TransmittedData (T5)
TransmittedData (T5)Transmitted
Data (T3)
TransmittedData (T2/T4)
TransmittedData (T2/T4)
TransmittedData (T2/T4)
Source: Signals Research Group

Page 9February 2016
www.signalsresearch.com
MU-MIMO and the User ExperienceQuantifying the benefits of more advanced 802.11ac features
The figure and the accompanying text should help explain why MU-MIMO benefits overall network efficiency and capacity, even if the peak data rates for a single STA remain unchanged. We now turn to some actual results that help quantify the performance gains of MU-MIMO. We will demonstrate that overall network throughput increases and that this improvement in network efficiency directly translates into an improved user experience.
In the first series of tests, we start with the basics and show the total throughput of a Wi-Fi system consisting of an AP and three connected STAs (1x1), each receiving a full buffer transmission in order to load the network. As shown in Figure 6, the total throughput was 336.7 Mbps with SU-MIMO, while with MU-MIMO, the total throughput was 715 Mbps, resulting in an overall network capacity gain of 112%. It is also evident that the average data rate for each STA increased with MU-MIMO.
Although it is foreseeable that a single Wi-Fi AP could experience this much loading, a more likely scenario is one in which two Wi-Fi APs share the same primary channel. In this situation, each AP can only use the channel for approximately 50% of the time compared with having access to the channel the entire time. The actual amount of time that each AP uses the channel can vary since it is based on how aggressive / conservative the two APs are when accessing the shared channel. Additionally, each STA that transmits data to an AP also takes channel access time, which further reduces the amount of time that the AP can transmit data to the STAs connected to it.
For these tests, we assigned a second Wi-Fi AP to the same primary channel that the Wi-Fi AP under test used. We configured this AP to transmit 50 Mbps in a 20 MHz channel to a single STA. Figure 7 shows the resultant throughput for the Wi-Fi AP under test as well as the throughput associated with the additional Wi-Fi AP. When the Wi-Fi AP under test supported MU-MIMO, its throughput was 343.3 Mbps, compared with only 207.1 Mbps with an SU-MIMO configu-ration, representing a 66% increase in throughput due to the MU-MIMO configuration. It is
With MU-MIMO, the total throughput increased by 112%.
Figure 6. MU-MIMO and SU-MIMO Throughput in an 80 MHz Channel with Three STAs (Test 50-51)
Throughput (Mbps)
Device #153262
Device #152202
Device #151250
Device #153116
Device #152104
Device #151117
SU-MIMO Configuration with 80 MHzTotal Throughput = 336.7 Mbps
MU-MIMO Configuration with 80 MHzTotal Throughput = 715.0 Mbps
0
200
400
600
800
Source: Signals Research Group

Page 10February 2016
www.signalsresearch.com
MU-MIMO and the User ExperienceQuantifying the benefits of more advanced 802.11ac features
also evident that MU-MIMO benefited some STAs more than other STAs. This outcome is not entirely surprising and it could be due, in part, to their location relative to the AP and to each other.
Another implied result from this study is that a neighboring Wi-Fi AP can dramatically reduce the available capacity of nearby Wi-Fi systems. In normal circumstances, SU-MIMO may provide sufficient capacity with most usage models. However, when there are nearby Wi-Fi APs sharing the same channel, these APs reduce the amount of available capacity. MU-MIMO helps mitigate this impact by allowing the AP to use the channel more efficiently when it is available.
When two APs share the same primary channel it can have a dramatic impact on the user experi-ence. To prove this statement we conducted a series of tests involving two APs. We configured one AP to operate in an 80 MHz channel with either MU-MIMO or SU-MIMO enabled. The second Wi-Fi AP used a 20 MHz channel and shared the same primary channel as the Wi-Fi AP under test. This AP attempted to maintain a 100 Mbps connection with a single STA (1x1). The Wi-Fi AP under test served three STAs (1x1) with each STA receiving a 20 Mbps video transmis-sion – we generated two video transmissions with the IXIA Chariot test platform while we used a Windows Media Server to generate the third video transmission. We used Spirent’s Chromatic test platform to measure the performance of the video that the Windows Media Server streamed to one of the STAs.
Figure 7. MU-MIMO and SU-MIMO Throughput in an 80 MHz Channel with Three STAs and a Second AP in the Primary Channel (Test 52-53)
MU-MIMO dramatically improved the data rates for
each STA as well as the overall system throughput.
Throughput (Mbps)
Device #15284
Device #153 152
Device #151107
Total Throughput = 343.3 Mbps
Device #152: 29
Device #153 93
Device #15185
SU-MIMO Configuration with 80 MHz0
50
100
150
200
250
300
350
400
MU-MIMO Configuration with 80 MHz
Total Throughput = 207.1 Mbps
50 50
Test #52 Test #53Wi-Fi AP in Primary Channel (20MHz)
Average Throughput (Mbps)
Source: Signals Research Group

Page 11February 2016
www.signalsresearch.com
MU-MIMO and the User ExperienceQuantifying the benefits of more advanced 802.11ac features
As shown in Figure 8, the video performance was dramatically better with MU-MIMO than with SU-MIMO. In the baseline test (Test 60), in which we only streamed a single 20 Mbps video through the Windows Media Server, the video score was 91 out of a possible 100 points. The high score was largely due to very few video freezes or impairments, as detected by the Chromatic test platform. We then repeated the test with the two additional 20 Mbps video streams and the additional Wi-Fi AP generating a 100 Mbps transmission in the primary channel. For this test (Test 61), we configured the Wi-Fi AP under test to operate in SU-MIMO mode. As shown in the figure, the video score dropped to only 29 out of 100 while there was also a dramatic increase in the video impairments, due to either video freezes or impaired frames. According to our analysis, the video was impaired for 37% of the time during the six-minute test.
Lastly, we repeated the test a third time, but in this test (Test 62) we configured the Wi-Fi AP under test to operate in MU-MIMO mode. In this test, the video performance was almost flaw-less and as good as the results from the baseline test. The video metrics shown in the figure help quantify a user experience that is somewhat subjective since each individual’s perception of what defines a good user experience is somewhat different. However, we seriously doubt that anyone would tolerate watching a video that was constantly freezing or dropping frames, as was the case with SU-MIMO. While conducting the tests and in our subsequent analysis of the data, we watched the videos. We would not have tolerated the video freezes. 2
2 Although we are not able to insert video clips into this whitepaper, we have created a presentation that includes short video clips from these two tests and which show the dramatic differences in how the videos played.
With SU-MIMO, the video was impaired for 37% of the time
during the six-minute test.
With MU-MIMO, the video was impaired for only 1.9% of the
time during the six-minute test.
Figure 8. Key Video Metrics (Test 60-62)
Weighted Average Score
Impaired Video Performance (%)
No. of Freeze Periods
Freeze Time (%)
No. of Impaired Periods
Impaired Time (%)
115
22.3
91.1
37.5
29.0
1.9
93.02.2
153
34.01.7
16
21
0.13.5
0.2
Test #62 - MU-MIMO (80 MHz)Test #61 - SU-MIMO (80 MHz)Test #60 - Baseline (80 MHz)
Source: Signals Research Group

Page 12February 2016
www.signalsresearch.com
MU-MIMO and the User ExperienceQuantifying the benefits of more advanced 802.11ac features
Figure 9 shows the throughput generated by the other two videos running through the Chariot test platform as well as the throughput from the additional Wi-Fi AP. By itself, the figure does not reveal much about the user experience. However, one could infer a poor user experience if a STA is playing a 20 Mbps video being streamed over Wi-Fi but only receiving an average data rate of 14 Mbps. We will prove this statement in some following figures.
Figure 9 MU-MIMO and SU-MIMO Throughput in an 80 MHz Channel with Multiple Video Transmissions (Test 61-62)
Device #15320
Device #15120
Throughput (Mbps)
0
10
20
30
40
Device #15314
Device #15120
SU-MIMO Configuration w/ 1x1 AntennaTotal Throughput = 33.7Mbps
MU-MIMO Configuration w/ 1x1 AntennaTotal Throughput = 40.5 Mbps
Test #62 Test #61
Primary Channel Interfering Source (20 MHz)
99 100
Source: Signals Research Group
Page 13February 2016
www.signalsresearch.com
MU-MIMO and the User ExperienceQuantifying the benefits of more advanced 802.11ac features
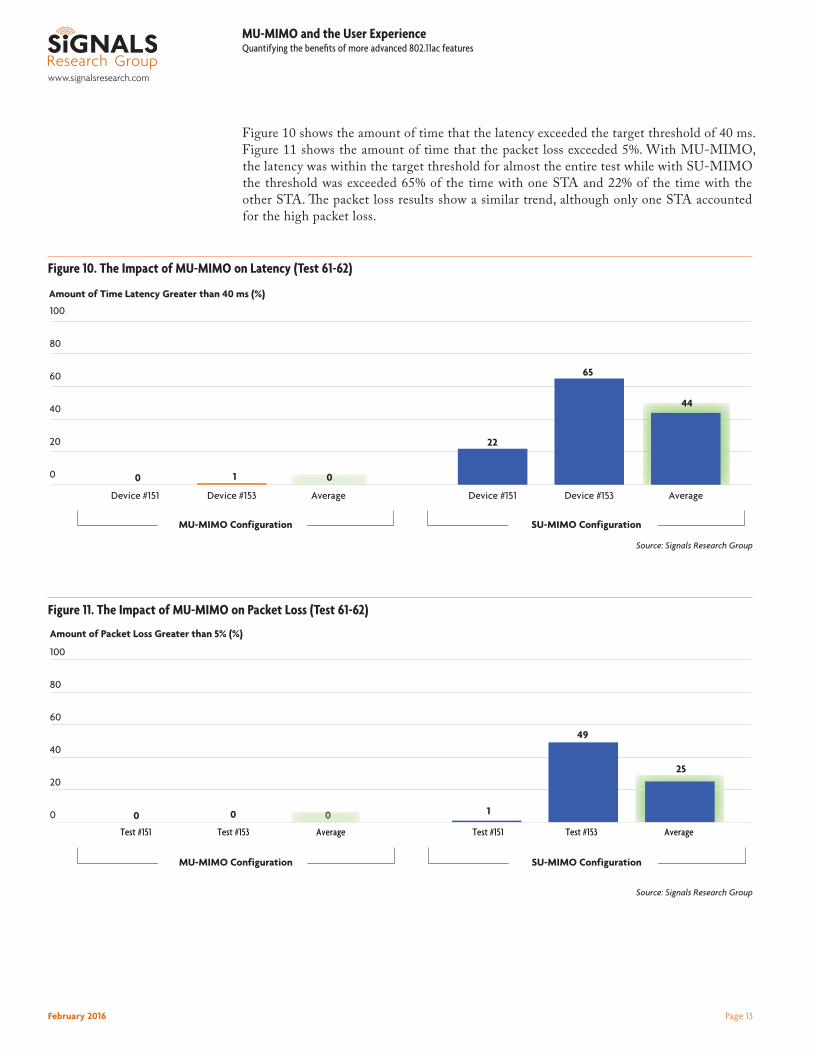
Figure 10 shows the amount of time that the latency exceeded the target threshold of 40 ms. Figure 11 shows the amount of time that the packet loss exceeded 5%. With MU-MIMO, the latency was within the target threshold for almost the entire test while with SU-MIMO the threshold was exceeded 65% of the time with one STA and 22% of the time with the other STA. The packet loss results show a similar trend, although only one STA accounted for the high packet loss.
Figure 11. The Impact of MU-MIMO on Packet Loss (Test 61-62)
0 0 0 1
49
25
0
20
40
60
80
100
Amount of Packet Loss Greater than 5% (%)
MU-MIMO Configuration SU-MIMO ConfigurationMU-MIMO Configuration SU-MIMO Configuration
Test #151 Test #153 Average Test #151 Test #153 Average
Source: Signals Research Group
Figure 10. The Impact of MU-MIMO on Latency (Test 61-62)
0 1 0
22
65
44
0
20
40
60
80
100
Amount of Time Latency Greater than 40 ms (%)
MU-MIMO Configuration SU-MIMO Configuration
AverageDevice #153Device #151AverageDevice #153Device #151
Source: Signals Research Group

Page 14February 2016
www.signalsresearch.com
MU-MIMO and the User ExperienceQuantifying the benefits of more advanced 802.11ac features
We include two additional figures stemming from these tests in the appendix. These figures provide additional information about the observed latency (Figure 29) and jitter (Figure 30).
We also ran a series of comparative tests involving MU-MIMO and SU-MIMO with the STAs supporting either 2x2 or 1x1 antenna configurations. In these tests, we had 4 video transmissions as well as a separate 20 Mbps uplink transmission. We streamed two 10 Mbps videos from the Windows Media Server to two STAs – one STA (2x2) and one SA (1x1). We also used Chariot to stream two 20 Mbps videos (RTP) to a pair of commercially available laptop computers. One laptop computer used a 2x2 antenna configuration and one laptop computer used a 1x1 antenna configuration. Test 42 and Test 43 differed from the previous study where all of the devices used a 1x1 antenna configuration, while we also used a 20 MHz channel in these tests instead of an 80 MHz channel.
As shown in Figure 12, the video performance was substantially better when the AP supported MU-MIMO. With MU-MIMO, the video scores associated with the Windows Media Server were close to perfect and there were hardly any video impairments. With SU-MIMO, the video scores were sub-par, due largely to video freezes and other impairments. The figure also shows that in the SU-MIMO test, the 2x2 antenna configuration meaningfully reduced the frequency of video impairments, although in this case the net effect still didn’t result in a great user experience (i.e., the video was still frozen for 38.5% of the time, but much lower than 93.1% of the time).
Figure 12. Key Video Performance Metrics (Test 42-43)
Weighted Average Score
Impaired Video Performance (%)
No. of Freeze Periods
Freeze Time (%)
No. of Impaired Periods
Impaired Time (%)
40
12
41.028.0
97.0 97.0
42.4
93.1
0.1 0.2
38.5
39
93.10.00.0
00
51
3.90.0.01.02
Device #2- MU-MIMO w/ 1x1 AntennaDevice #1- MU-MIMO w/ 2x2 Antenna
Device #2 - SU-MIMO w/ 1x1 AntennaDevice #1 - SU-MIMO w/ 2x2 Antenna
Source: Signals Research Group

Page 15February 2016
www.signalsresearch.com
MU-MIMO and the User ExperienceQuantifying the benefits of more advanced 802.11ac features
Figure 13 and Figure 14 show additional detail, which help demonstrate the benefits of MU-MIMO and a 2x2 antenna configuration. Figure 13 shows the observed frames per second, as captured by the Chromatic test platform, for the Windows Media Server videos playing on the STAs. In the case of MU-MIMO, the observed frames per second was very close to the target 24 fps throughout the entire test. With SU-MIMO, the observed frames per second frequently dropped to 0 fps, indicating a video freeze. With a 1x1 antenna configuration and SU-MIMO (Figure 14), the amount of time that the observed frames per second was 0 fps was much higher than it was with a 2x2 antenna configuration and SU-MIMO. Comparing the two MU-MIMO results, there isn’t an obvious difference in the observed frame rate between the 2x2 and 1x1 antenna configurations.
Figure 13. Observed Frames per Second with 2x2 Antenna Configuration (Test 42-43)
0 25 50 75 100 125 150 175 200 225 250 275 300 325 3500
5
10
15
20
25
30
35
Time (sec)
FPS
MU-MIMO – Device #1 (2x2)
SU-MIMO – Device #1 (2x2)
Figure 14. Observed Frames per Second with 1x1 Antenna Configuration (Test 42-43)
FPS
MU-MIMO – (1 x 1) SU-MIMO – (1 x 1)
0
5
10
15
20
25
30
35
0 25 50 75 100 125 150 175 200 225 250 275 300 325 350Time (sec)
Source: Signals Research Group
Source: Signals Research Group

Page 16February 2016
www.signalsresearch.com
MU-MIMO and the User ExperienceQuantifying the benefits of more advanced 802.11ac features
The video performance on the laptop computers was similar to what we observed with the STAs. Figure 15 shows the percentage of time that the latency exceeded the target threshold and Figure 16 shows comparable information for the packet loss. In both cases, the results were much worse with SU-MIMO. Likewise, in the SU-MIMO tests the 2x2 antenna configuration had a profound impact by reducing the packet loss and the latency, although the latency still exceeded the target threshold for 42% of the time. We note that in these tests, all STAs were located in a room at one end of the house while the AP was at the other end of the house.
In the SU-MIMO tests, the 2x2 antenna configuration had a
profound impact by reducing both the packet loss and the latency.
Figure 15. The Impact of MU-MIMO on Latency (Test 42-43)
0
20
40
60
80
100
1216 14
42
100
71.1
Amount of Time Latency Greater than 40 ms (%)
MU-MIMO Configuration SU-MIMO Configuration
Average (SU-MIMO)
Notebook PC w/1x1 Antenna
Notebook PC w/2x2 Antenna
Average (MU-MIMO)
Notebook PC w/1x1 Antenna
Notebook PC w/2x2 Antenna
Figure 16. The Impact of MU-MIMO on Packet Loss (Test 42-43)
0
20
40
60
80
100
Amount of Time Packet Loss Greater than 5% (%)
06 3
0
99
49.4
MU-MIMO Configuration SU-MIMO Configuration
Average (SU-MIMO)
Notebook PC w/ 1x1 Antenna
Notebook PC w/ 2x2 Antenna
Average (MU-MIMO)
Notebook PC w/1x1 Antenna
Notebook PC w/2x2 Antenna
Source: Signals Research Group
Source: Signals Research Group

Page 17February 2016
www.signalsresearch.com
MU-MIMO and the User ExperienceQuantifying the benefits of more advanced 802.11ac features
We include two additional figures stemming from these tests in the appendix. These figures provide additional information about the observed latency (Figure 31) and jitter (Figure 32). We also include some additional test results, which we did not include in the main body of this paper (Figure 36 through Figure 42).

Page 18February 2016
www.signalsresearch.com
MU-MIMO and the User ExperienceQuantifying the benefits of more advanced 802.11ac features
A Wi-Fi AP with MU-MIMO can indirectly improve the user experience for a consumer with a SU-MIMO deviceOne might suspect that MU-MIMO creates a “chicken and egg” scenario if the benefits of an AP with MU-MIMO functionality cannot occur without MU-MIMO also enabled in the STA. Fortunately, this belief is not correct as the results presented in this section illustrate. As long as there are at least a few STAs that support MU-MIMO in the network then other STAs that do not support MU-MIMO can also benefit.
In these tests, we configured the AP (20 MHz channel) to support either MU-MIMO or SU-MIMO. We used five STAs in these tests – two notebook computers (2x2 and 1x1) streamed a 20 Mbps video, two STAs (2x2 and 1x1) streamed a 10 Mbps video from the Windows Media Server, and the remaining STA transmitted 20 Mbps in the uplink direction to the AP. All STAs playing video supported MU-MIMO with the exception of STA (2x2), which was streaming the 10 Mbps video from the Windows Media Player. This STA only supported SU-MIMO.
In Test 38, we configured the AP to support SU-MIMO. Consequently, the user experience with the video applications was poor with all four STAs, although it was better with STA (2x2) than with STA (1x1). In Test 39, we configured the AP to support MU-MIMO. As one might expect, the STAs that supported MU-MIMO delivered the best video experience – fewer video freezes and impairments, lower latency and packet loss, etc. Although seemingly counter-intuitive at first glance, we also observed that STA (2x2) delivered a better video experience even though it did not support MU-MIMO. Since the STA did not support MU-MIMO, the AP could only send data to the STA by itself without concurrently transmitting data to other STAs. However, since the other STAs supported MU-MIMO, the Wi-Fi AP was able to schedule them more efficiently. This increased efficiency freed up more channel access time for the AP to serve the single STA that did not support MU-MIMO – STA (2x2), not to mention more channel access time for the STA transmitting in the uplink direction.
An AP that supports MU-MIMO can indirectly benefit a STA that
does not support MU-MIMO.
A Wi-Fi AP can group together and serve STAs that support MU-MIMO, thus freeing up additional channel access time to serve STAs
that only support SU-MIMO.

Page 19February 2016
www.signalsresearch.com
MU-MIMO and the User ExperienceQuantifying the benefits of more advanced 802.11ac features
Figure 17. Key Video Performance Metrics (Test 38-39)
Weighted Average Score
Impaired Video Performance (%)
No. of Freeze Periods
Freeze Time (%)
No. of Impaired Periods
Impaired Time (%)
110
11
0.0 0.0
97.0 97.0
55.7
82.9
0.2 0.1
55.0
39
01
65.70.10
61
0.717.2
.01.01
Device #2 – MU-MIMO w/1x1 AntennaDevice #1 – SU-MIMO w/2x2 Antenna
Device #2 - SU-MIMO w/1x1 AntennaDevice #1 - SU-MIMO w/2x2 Antenna
Source: Signals Research Group
Figure 17 shows the key video performance metrics for the two tests. Among other things, the figure shows that STA (2x2), which did not support MU-MIMO, still delivered a better user experience when the Wi-Fi AP supported MU-MIMO.
Figure 18 shows the observed frames per second for STA (2x2) when the AP supported MU-MIMO (orange line) and when the AP supported SU-MIMO (blue line). Although the STA did not support MU-MIMO, it is evident that the STA indirectly benefited from the AP supporting MU-MIMO.
Figure 18. Observed Frames per Second with 2x2 Antenna Configuration (Test 38-39)
Source: Signals Research Group
FPS
0
5
10
15
20
25
30
35
0 25 50 75 100 125 150 175 200 225 250 275 300 325 350Time (sec)
MU-MIMO AP - Device #1 (SU-MIMO - 2x2)
SU-MIMO AP - Device #1 (MU-MIMO - 2x2)

Page 20February 2016
www.signalsresearch.com
MU-MIMO and the User ExperienceQuantifying the benefits of more advanced 802.11ac features
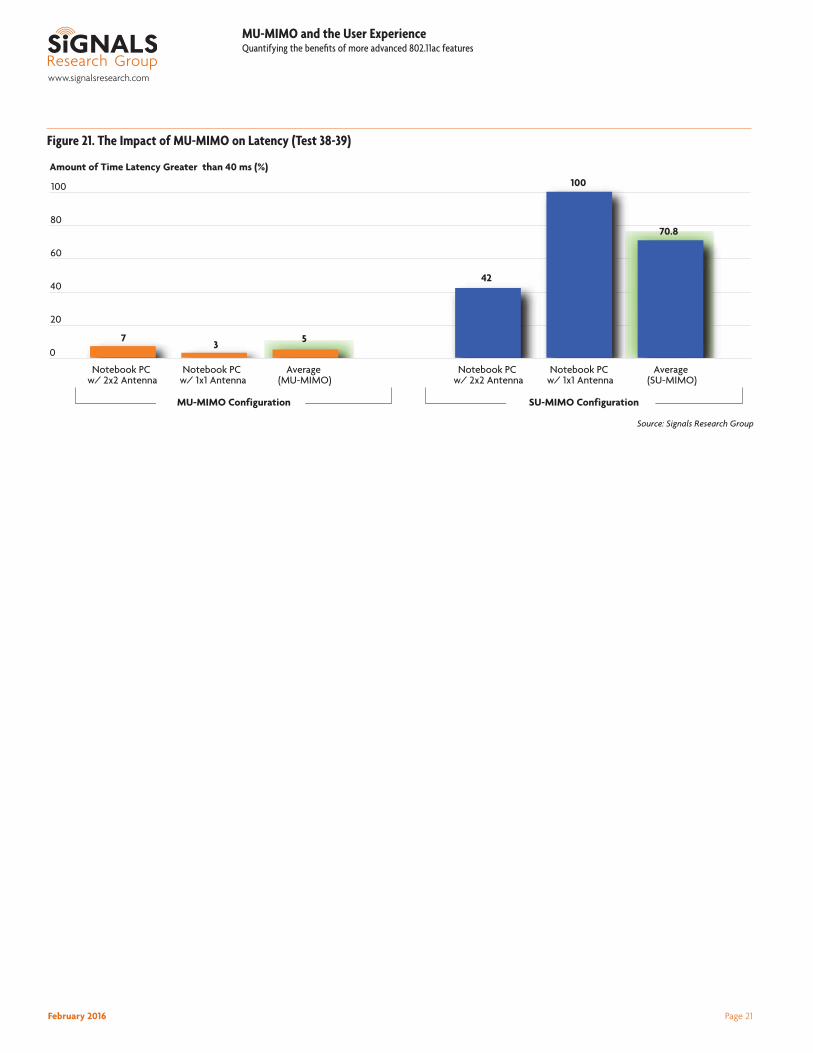
The last three figures in this section show some additional results from these tests. Although they do not necessarily capture how MU-MIMO indirectly benefits STAs that only support SU-MIMO, they do illustrate the benefits of MU-MIMO on the user experience. Figure 19 (MU-MIMO) and Figure 20 (SU-MIMO) show the instantaneous throughput of the three STAs connected to the Chariot test platform. Recall, two laptop computers were streaming a 20 Mbps video and one STA was transmitting 20 Mbps in the uplink direction to the Wi-Fi AP. Figure 21 shows the percentage of time that the latency exceeded the 40 ms threshold in the two tests.
In the appendix, we include Figure 33 through Figure 35, which provide additional insight into the results from these two tests.
Figure 19. Instantaneous Throughput with MU-MIMO (Test 39)
Time (sec)
Throughput (Mbps)
0
10
20
30
40
50
0 50 100 150 200 250 300 350 400 450
Notebook PC #1 w/2x2 Antenna Notebook PC #2 w/1x1 Antenna Device #10 - Uplink Transmission
Source: Signals Research Group
Figure 20. Instantaneous Throughput with SU-MIMO (Test 38)
Time (sec)
Throughput (Mbps)
Notebook PC #1 w/2x2 Antenna Notebook PC #2 w/1x1 Antenna Device #10 - Uplink Transmission
0
10
20
30
40
50
0 50 100 150 200 250 300 350 400 450
Source: Signals Research Group
Page 21February 2016
www.signalsresearch.com
MU-MIMO and the User ExperienceQuantifying the benefits of more advanced 802.11ac features
Figure 21. The Impact of MU-MIMO on Latency (Test 38-39)
0
20
40
60
80
100
73 5
42
100
70.8
Amount of Time Latency Greater than 40 ms (%)
MU-MIMO Configuration SU-MIMO Configuration
Average (SU-MIMO)
Notebook PC w/ 1x1 Antenna
Notebook PC w/ 2x2 Antenna
Average (MU-MIMO)
Notebook PC w/ 1x1 Antenna
Notebook PC w/ 2x2 Antenna
Source: Signals Research Group

Page 22February 2016
www.signalsresearch.com
MU-MIMO and the User ExperienceQuantifying the benefits of more advanced 802.11ac features
An 80 MHz Wi-Fi channel is essential to support multiple Wi-Fi usersIt is generally recognized and appreciated that a Wi-Fi system with an 80 MHz channel delivers more capacity than a Wi-Fi system with a 20 MHz channel. However, for completeness sake, we are documenting the benefit with a particular focus on the user experience.
We configured a Wi-Fi system to support three STAs, with each STA transmitting 15 Mbps in the uplink direction to the AP. Additionally, a single STA streamed a 20 Mbps video from the Windows Media Player. We repeated the test with an 80 MHz and with a 20 MHz channel bandwidth. Both tests took place with the STAs and the AP located in opposite sides of the house – the measured RSSI was approximately -65 dBm. The results shown in Figure 22 indicate that with a 20 MHz channel the video froze for a considerable amount of time (55.8%), resulting in a video score of 0 out of 100 – clearly a very poor user experience. With an 80 MHz channel, the video played nearly flawlessly, resulting in a score of 96.
With a 20 MHz channel, the video froze for a considerable amount of
time while with an 80 MHz channel the video played nearly flawlessly.
Figure 22. Key Video Performance Metrics (Test 45-46)
97
Impaired Video Performance (%)
Test #46 – 20 MHz Channel Test #45 – 80 MHz Channel
0.0
Weighted Average Score
96.0
0.0
0
No. of Impaired Periods
Impaired Time (%)
12.6 17
6.9
0.0
62.7
0.7
0.0
0No. of
Freeze Periods
Freeze Time (%)
55.8
Source: Signals Research Group

Page 23February 2016
www.signalsresearch.com
MU-MIMO and the User ExperienceQuantifying the benefits of more advanced 802.11ac features
Finally, Figure 23 shows the uplink throughput for the three STAs in the two tests. It is evident that the combined throughput from the three STAs failed to reach the target 45 Mbps (3x15) with a 20 MHz channel while the STAs met the target data rate with the 80 MHz channel.
Figure 23. Uplink Throughput (Test 45-46)
10
20
30
40
50
Throughput (Mbps)
Device #152 - UL 15
Device #155 - UL 15
Device #154 - UL15
Device #152 - UL: 6 Mbps
Device #155 - UL17
Device #154 - UL15
MU-MIMO Configuration with 80 MHz Total Throughput = 45 Mbps
0MU-MIMO Configuration with 20 MHz
Total Throughput = 38 Mbps
Source: Signals Research Group
Page 24February 2016
www.signalsresearch.com
MU-MIMO and the User ExperienceQuantifying the benefits of more advanced 802.11ac features
Test MethodologySRG conducted the tests at two different locations in Northern California. We conducted most of the video-related tests at a residential home in Atherton, California. This 3,000 square foot single-floor home consisted of multiple rooms, which we used to place the Wi-Fi STAs during the tests. We also conducted a few over-the-air tests (Test 50 through Test 59) in an RF shielded room at Qualcomm’s San Jose facilities. Likewise, we performed the conducted tests involving the 1x1 versus 2x2 antenna configurations (Test 60 through Test 64) at the same facilities where we had access to an attenuation box.
Although we measured throughput as part of this study, the major focus of our efforts pertained to video performance. For the video tests, we primarily used Spirent Communications’ Chromatic test solution. We have used Chromatic numerous times in the past when analyzing the video delivery capabilities of LTE, including IR.94. Chromatic is a vision-based measurement tool that leverages the video and audio feeds through an HDMI output on the Wi-Fi STA to capture and analyze the streaming video, which the smartphone is simultaneously playing on its screen. By using video with special markers and audio tones, it is possible to quantify how well the Wi-Fi system delivers the video and audio content to the mobile device (STA).
Analyzed parameters include the following:
➤➤ Video Freezes – the percentage of time and the number of instances in which the video was frozen
➤➤ Impaired Video Frames – the percentage of time and the number of instances in which the delivered frame was impaired
➤➤ Impaired Video Performance – the percentage of time that the video was frozen OR impaired (the sum of the video freeze time and impaired video time)
➤➤ Frames per Second – time series plot of the observed frames per second (fps) – done in order to show variations in the observed fps during the test period
➤➤ Weighted Average Video Score – quantifies the overall video delivery experience using a combination of the video freezes and impairments, as well as variations in the fps
➤➤ Video Target Thresholds – done for latency (40 ms), jitter (40 ms) and packet loss (5%). These thresholds are based on published third-party information
For the video tests, we primarily used Spirent Communications’
Chromatic test solution.

Page 25February 2016
www.signalsresearch.com
MU-MIMO and the User ExperienceQuantifying the benefits of more advanced 802.11ac features
Figure 24 shows the test set-up that we used in the residential home. We used a Windows Media Server to stream the video – normally a 20 Mbps video – to one or more Wi-Fi STAs. In most of these tests, we also used IXIA Chariot to generate additional Wi-Fi traffic, which served to load the Wi-Fi system. Since Chariot can simulate a video transmission (RTP traffic), we also used some of its reporting capabilities to analyze video performance, while we also used other Chariot reports to analyze basic throughput in most of the tests. In some tests, we also used a second Wi-Fi AP, which operated in the primary channel of the Wi-Fi AP under test. By generating additional Wi-Fi traffic on this AP, we were able to simulate a likely real-world scenario in which two APs share the same channel. We used iPerf to generate the traffic on the second AP.
For the tests involving the comparison between a 1x1 and a 2x2 antenna configuration with varying pathloss (Test 60 through Test 64), we used a conducted mode of testing. We placed the Wi-Fi STA in an attenuation box and then connected it via cable to the Wi-Fi AP, which was located outside of the attenuation box. By using the conducted mode and an attenuation box, we were able to adjust precisely the attenuation to reflect increasing pathloss between the Wi-Fi AP and the STA.
We used a Wi-Fi AP reference platform with the Qualcomm QCA9980 chipset. By using a refer-ence platform, we were able to configure quickly and easily the AP to support different modes of operation (e.g., SU-MIMO versus MU-MIMO). For the Wi-Fi STAs, we used a mix of commer-cial brand name smartphones, commercial brand name laptops, and Qualcomm MTPs (Mobile Test Platform). All STAs used the Qualcomm QCA6174A chipset.
In some tests, we used a second Wi-Fi AP, which operated in the primary channel of
the Wi-Fi AP under test.
Figure 24. Test Methodology
Captured Audio
Wi-Fi STAs (Chariot Background/DUT)
Wi-Fi STAs (Chariot Background/DUT)
802.11ac AP
Captured Audio
IXIAChariot
Captured Video
Captured Video
Chromatic
Chromatic Test Video with Markers
WindowsMediaServer
Source: Signals Research Group
Page 26February 2016
www.signalsresearch.com
MU-MIMO and the User ExperienceQuantifying the benefits of more advanced 802.11ac features
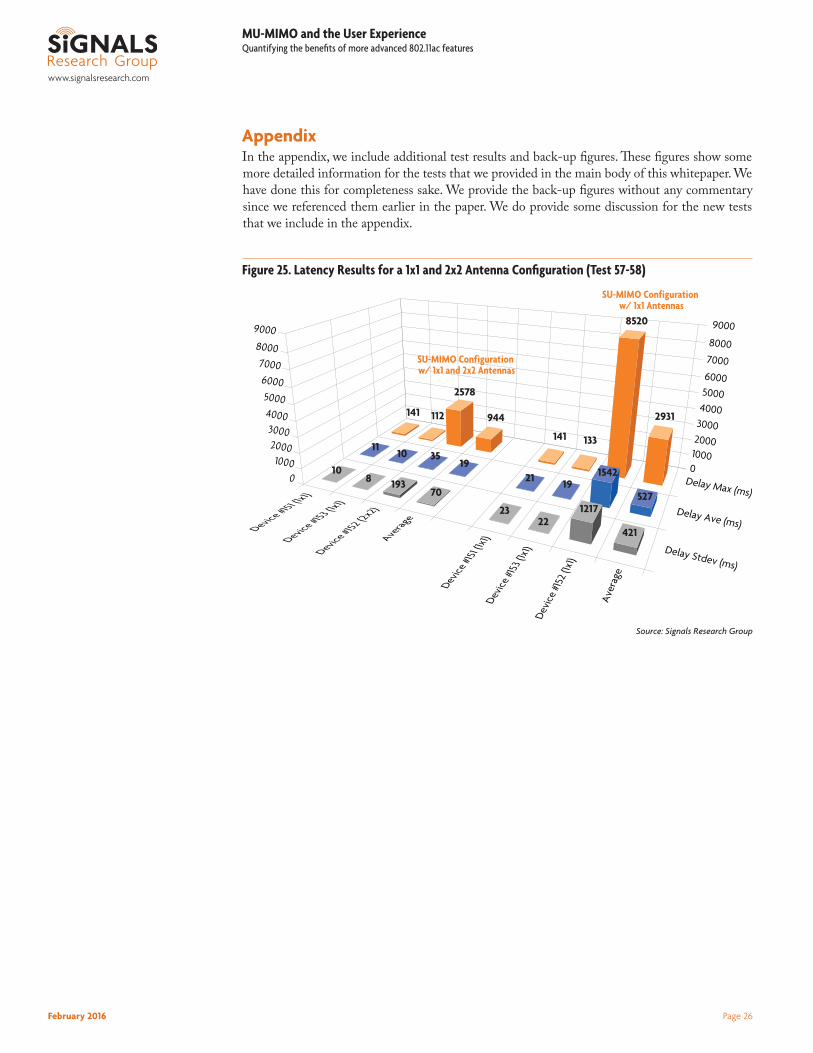
AppendixIn the appendix, we include additional test results and back-up figures. These figures show some more detailed information for the tests that we provided in the main body of this whitepaper. We have done this for completeness sake. We provide the back-up figures without any commentary since we referenced them earlier in the paper. We do provide some discussion for the new tests that we include in the appendix.
Figure 25. Latency Results for a 1x1 and 2x2 Antenna Configuration (Test 57-58)
900080007000600050004000300020001000
001000
2000
3000
4000
5000
6000
7000
8000
9000
Delay Max (ms)
Delay Ave (ms)
Delay Stdev (ms)
Device #151 (1x
1)
Device #153 (1x
1)
Device #152 (2x2)
Averag
e
Device
#151
(1x1)
Device
#153
(1x1)
Devic
e #15
2 (1x
1)
Aver
age
141 112
2578
944
141 133
8520
2931
1110 35
19 21 19
1542
527
108 193
70
2322
1217
421
SU-MIMO Configuration w/ 1x1 Antennas
SU-MIMO Configuration w/ 1x1 and 2x2 Antennas
Source: Signals Research Group

Page 27February 2016
www.signalsresearch.com
MU-MIMO and the User ExperienceQuantifying the benefits of more advanced 802.11ac features
160
140
120
100
80
6040
20
00
20
40
60
80
100
120
140
160
Jitter Max (ms)
Jitter Ave (ms)
Jitter Stdev (ms)
Device #151 (1x
1)
Device #153 (1x
1)
Device #152 (2x2)
Averag
e
Device
#151
(1x1)
Device
#153
(1x1)
Devic
e #15
2 (1x
1)
Aver
age
8 5
57
23
107
155
57
2 32 23
33 8
4
11
21
11 14
5
SU-MIMO Configuration w/ 1x1 and 2x2 Antennas
SU-MIMO Configurationw/1x1 Antennas
Figure 26. Jitter Results for a 1x1 and 2x2 Antenna Configuration (Test 57-58)
Source: Signals Research Group

Page 28February 2016
www.signalsresearch.com
MU-MIMO and the User ExperienceQuantifying the benefits of more advanced 802.11ac features
In Test 17 and Test 19, we loaded the Wi-Fi system with seven STAs. The STAs supported a mix of RTP and TCP traffic. In Test 17, all STAs supported a 1x1 antenna configuration while in Test 19, we reconfigured two STAs to support a 2x2 antenna configuration. Figure 27 shows that the two STAs with the 2x2 antenna configuration observed a meaningful increase in their data rates. Figure 28 shows that the introduction of the 2x2 antenna configuration also improved the video performance, as exemplified by Device #152 exceeding the 40 ms latency threshold for a shorter period of time with the 2x2 antenna configuration. Device #151 was supporting TCP traffic in the two tests so we do not have latency results for this STA.
Figure 27. The Impact of a 2x2 Antenna Configuration on Throughput (Test 17 and Test 19)
Device #151 2x227
Device #155: 8
Device #154: 11
Device #161: 13
Device #157: 5 Device #156: 4
Device #152 2x2: 20
Throughput (Mbps)
SU-MIMO ConfigurationTotal Throughput = 66.6 Mbps
Device #151: 16
Device #155: 10
Device #154: 7
Device #161: 14
Device #157: 6 Device #156: 4
Device #152: 10
SU-MIMO Configuration w/2x2 Antenna (2 devices)Total Throughput = 88.4 Mbps
0
20
40
60
80
100
Figure 28. The Impact of a 2x2 Antenna Configuration on Latency (Test 17 and Test 19)
17
85 87
63
37
85 85
69
0
20
40
60
80
100
Amount of Time Latency Greater than 40 ms (%)
MU-MIMO Configurationw/Partial 2x2 Antenna
SU-MIMO Configuration(All 1x1 Antenna)
Average Device #157Device #156Device #152Average Device #157Device #156Device #152 –2x2
Source: Signals Research Group
Source: Signals Research Group

Page 29February 2016
www.signalsresearch.com
MU-MIMO and the User ExperienceQuantifying the benefits of more advanced 802.11ac features
Figure 29. Latency Results for MU-MIMO and SU-MIMO (Test 61-62)
900080007000600050004000300020001000
001000
2000
3000
4000
50006000
70008000
9000
Device #151
Device #153
Average
Device #1
51
Device
#153
Averag
e
MU-MIMO Configuration
SU-MIMO Configuration
13 217 115 1314
8296
4805
4 44
29 600315
17
4
61 1169
615
Delay Max (ms)
Delay Ave (ms)
Delay Stdev (ms)
Figure 30. Jitter Results for MU-MIMO and SU-MIMO (Test 61-62)
SU-MIMO Configuration
250
200
150
100
50
00
50
100
150
200
250
Jitter Max (ms)
Jitter Ave (ms)
Jitter Stdev (ms)
Device #151
Device #153
Average
Device #1
51
Device
#153
Averag
e
3 1610 51
226
139
1 2 1
47
5
11
12 16
9
MU-MIMO Configuration
Source: Signals Research Group

Page 30February 2016
www.signalsresearch.com
MU-MIMO and the User ExperienceQuantifying the benefits of more advanced 802.11ac features
Figure 31. Latency Results for MU-MIMO and SU-MIMO (Test 42-43)
900080007000600050004000300020001000
001000
2000
3000
4000
50006000
70008000
9000
Delay Max (ms)
Delay Ave (ms)
Delay Stdev (ms)
Notebook PC w/
2x2 Antenna
Notebook PC w/
1x1 Antenna
Average
(SU-MIMO)
Noteboo
k PC w/
2x2 Ante
nnaNote
book P
C w/
1x1 Ant
enna
Averag
e (SU
-MIMO
)
24 414219
26 1167596
23 93 5843
3882
1963
296
5594
2945
366
8746
4556
MU-MIMO Configuration
SU-MIMO Configuration
Figure 32. Jitter Results for MU-MIMO and SU-MIMO (Test 42-43)
250
200
150
100
50
00
50
100
150
200
250
Jitter Max (ms)
Jitter Ave (ms)
Jitter Stdev (ms)
Notebook PC w/
2x2 Antenna
Notebook PC w/
1x1 Antenna
Average
(SU-MIMO)
Noteboo
k PC w/
2x2 Ante
nnaNote
book P
C w/
1x1 An
tenna
Averag
e (SU
-MIMO
)
22
4
1 158
2 43
4 1211
13
241
127
13
143
78
MU-MIMO Configuration
SU-MIMO Configuration
Source: Signals Research Group

Page 31February 2016
www.signalsresearch.com
MU-MIMO and the User ExperienceQuantifying the benefits of more advanced 802.11ac features
Figure 33. Instantaneous Latency with MU-MIMO (Test 39)
Time (sec)
Delay (ms)
Notebook PC #1 w/2x2 Antenna Notebook PC #2 w/1x1 Antenna
0
1000
2000
3000
4000
5000
6000
7000
0 50 100 150 200 250 300 350 400 450
0
50
100
150
200
0 100 200 300 400 500
Figure 34. Instantaneous Latency with SU-MIMO (Test 38)
Time (sec)
Delay (ms)
Notebook PC #1 w/2x2 Antenna Notebook PC #2 w/1x1 Antenna
0
1000
2000
3000
4000
5000
6000
7000
0 50 100 150 200 250 300 350 400 450
050100150200
0 100 200 300 400 500
Source: Signals Research Group
Source: Signals Research Group

Page 32February 2016
www.signalsresearch.com
MU-MIMO and the User ExperienceQuantifying the benefits of more advanced 802.11ac features
In Test 54 and Test 55 we compared the total throughput of SU-MIMO and MU-MIMO with two STAs – one STA used a 2x2 antenna configuration and one STA had a 1x1 antenna configura-tion. Figure 36 provides the results, which show both the overall throughput gain of MU-MIMO (59% higher) as well as the higher data rate achieved by the STA with the 2x2 antenna configura-tion (59% higher in Test 54 and 71% higher in Test #55).
Figure 35. Latency Results for MU-MIMO and SU-MIMO (Test 38-39)
6000
5000
4000
3000
2000
1000
00
1000
2000
3000
4000
5000
6000
Delay Max (ms)
Delay Ave (ms)
Delay Stdev (ms)
Notebook PC #1 w/
2x2 Antenna
Notebook PC #2 w/
1x1 Antenna
Average (M
U-MIMO)
Noteboo
k PC #1 w
/ 2x2
Antenna
Noteboo
k PC #
2 w/
1x1 Ant
enna
Averag
e (SU
-MIMO
)
183994
589658
5855
6257
1919 19
44
3724
188417 52
35
53 674
364
MU-MIMO Configuration
SU-MIMO Configuration
Figure 36. MU-MIMO and SU-MIMO Throughput with Two STAs (Test 54-55)
Throughput (Mbps)
Device #152: (2X2)453
Device #151: (1X1)284
MU-MIMO Configuration with 80 MHzTotal Throughput = 737.4 Mbps
0
200
400
600
800
Device #152: (2X2)293
Device #151: (1X1)171
SU-MIMO Configuration with 80 MHzTotal Throughput = 464.3 Mbps
Source: Signals Research Group
Source: Signals Research Group
Page 33February 2016
www.signalsresearch.com
MU-MIMO and the User ExperienceQuantifying the benefits of more advanced 802.11ac features
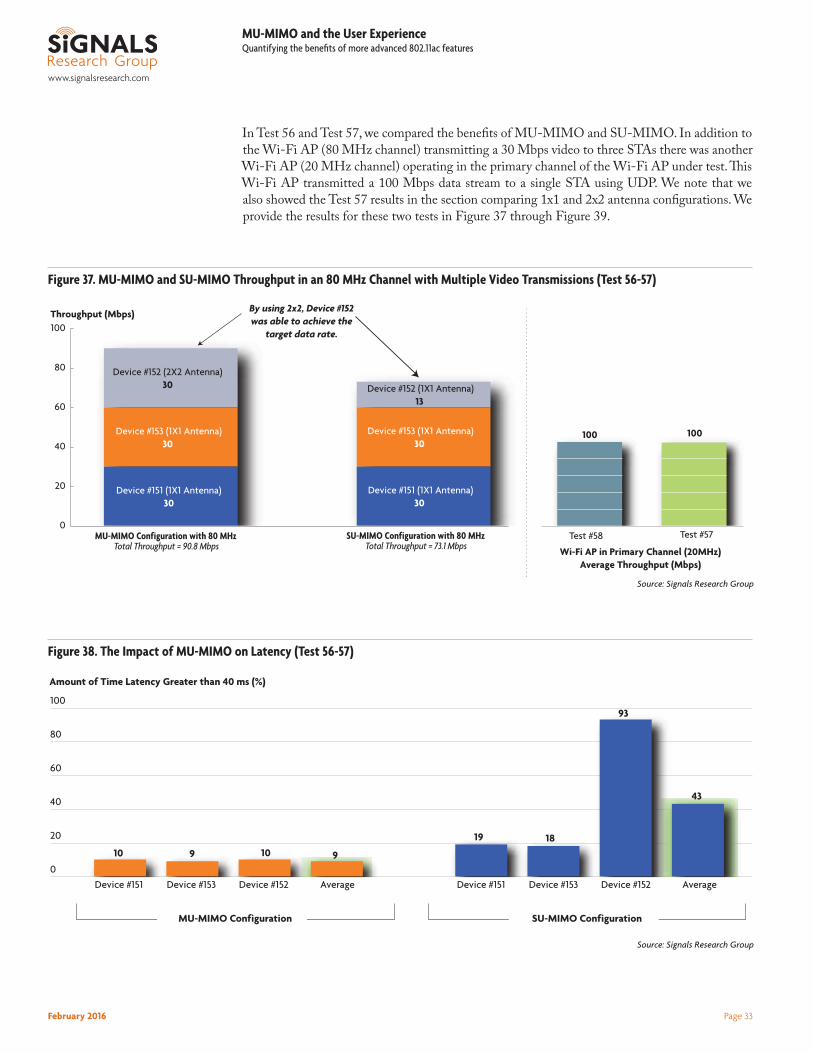
In Test 56 and Test 57, we compared the benefits of MU-MIMO and SU-MIMO. In addition to the Wi-Fi AP (80 MHz channel) transmitting a 30 Mbps video to three STAs there was another Wi-Fi AP (20 MHz channel) operating in the primary channel of the Wi-Fi AP under test. This Wi-Fi AP transmitted a 100 Mbps data stream to a single STA using UDP. We note that we also showed the Test 57 results in the section comparing 1x1 and 2x2 antenna configurations. We provide the results for these two tests in Figure 37 through Figure 39.
Figure 37. MU-MIMO and SU-MIMO Throughput in an 80 MHz Channel with Multiple Video Transmissions (Test 56-57)
100 100
0
20
40
60
80
100Throughput (Mbps)
Device #152 (2X2 Antenna) 30
Device #153 (1X1 Antenna)30
Device #151 (1X1 Antenna) 30
Device #152 (1X1 Antenna)13
Device #153 (1X1 Antenna)30
Device #151 (1X1 Antenna)30
Wi-Fi AP in Primary Channel (20MHz)Average Throughput (Mbps)
MU-MIMO Configuration with 80 MHz Total Throughput = 90.8 Mbps
SU-MIMO Configuration with 80 MHz Total Throughput = 73.1 Mbps
Test #58 Test #57
By using 2x2, Device #152 was able to achieve the
target data rate.
Figure 38. The Impact of MU-MIMO on Latency (Test 56-57)
10 9 10 9
19 18
93
43
0
20
40
60
80
100
Amount of Time Latency Greater than 40 ms (%)
MU-MIMO Configuration SU-MIMO Configuration
AverageDevice #152 Device #153 Device #151 AverageDevice #152 Device #153 Device #151
Source: Signals Research Group
Source: Signals Research Group

Page 34February 2016
www.signalsresearch.com
MU-MIMO and the User ExperienceQuantifying the benefits of more advanced 802.11ac features
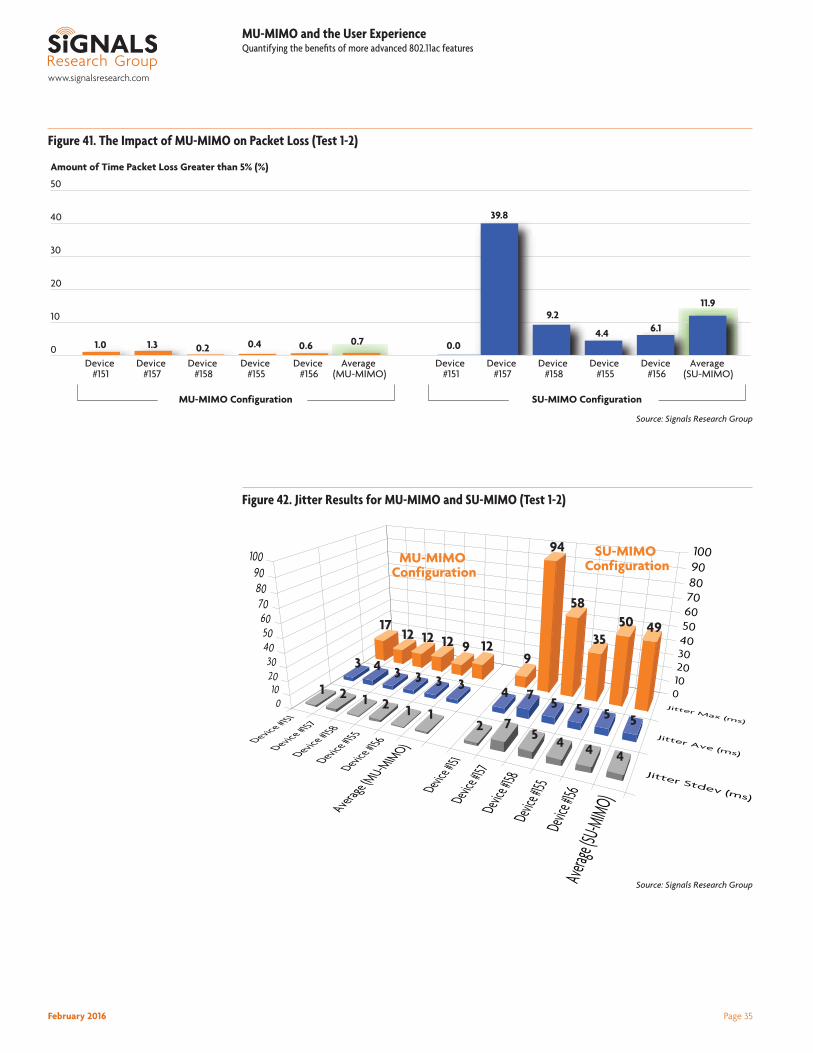
Finally, in Test 1 and Test 2 we compared MU-MIMO and SU-MIMO by using five STAs streaming a 15 Mbps video through Chariot and two additional STAs streaming a 6 Mbps video through the Windows Media Server. Due to the relatively low bit rate associated with the 6 Mbps video streams, the impact of MU-MIMO was relatively modest. However, the benefit of MU-MIMO on the other five video streams was quite meaningful, as shown in the last few figures.
Figure 39. The Impact of MU-MIMO on Packet Loss (Test 56-57)
1 1 1 1 1 1
52
18
0
20
40
60
80
100
Amount of Packet Loss Greater than 5% (%)
MU-MIMO Configuration SU-MIMO Configuration
AverageDevice #152 Device #153 Device #151 AverageDevice #152 Device #153 Device #151
Figure 40. The Impact of MU-MIMO on Latency (Test 1-2)
0
10
20
30
40
50
3.6 3.1 4.3 5.6 4.8 4.3
15.8
44.9
34.1
19.9
28 28.5
Average (SU-MIMO)
Device #156
Device #155
Device #158
Device #157
Device #151
Average (MU-MIMO)
Device #156
Device #155
Device #158
Device #157
Device #151
Amount of Time Latency Greater than 40 ms (%)
MU-MIMO Configuration SU-MIMO Configuration
Source: Signals Research Group
Source: Signals Research Group
Page 35February 2016
www.signalsresearch.com
MU-MIMO and the User ExperienceQuantifying the benefits of more advanced 802.11ac features
Figure 41. The Impact of MU-MIMO on Packet Loss (Test 1-2)
0
10
20
30
40
50
1.0 1.3 0.2 0.4 0.6 0.7 0.0
39.8
9.2
4.4 6.1
11.9
Amount of Time Packet Loss Greater than 5% (%)
Average (SU-MIMO)
Device #156
Device #155
Device #158
Device #157
Device #151
Average (MU-MIMO)
Device #156
Device #155
Device #158
Device #157
Device #151
MU-MIMO Configuration SU-MIMO Configuration
Figure 42. Jitter Results for MU-MIMO and SU-MIMO (Test 1-2)
1009080706050403020100
0102030405060708090100
Jitter Max (ms)
Jitter Ave (ms)
Jitter Stdev (ms)
Device #151
Device #157
Device #158
Device #155
Device #15
6
Average (M
U-MIMO)
Device
#151Devi
ce #157
Device
#158Dev
ice #155
Device
#156
Averag
e (SU-M
IMO)
MU-MIMO Configuration
SU-MIMO Configuration
1712 12 12 9 12
9
94
58
3550 49
3 4 3 3 3 3 4 75 5 5 5
1 2 1 2 1 12 7
5 4 4 4
Source: Signals Research Group
Source: Signals Research Group

Page 36February 2016
www.signalsresearch.com
MU-MIMO and the User ExperienceQuantifying the benefits of more advanced 802.11ac features
www.signalsresearch.com