mu gas-condensed phase interactions: flame- surface heat exchange john e. adams, tamas szabo, and...
Post on 21-Dec-2015
218 views
TRANSCRIPT
MU
Gas-Condensed Phase Interactions: Gas-Condensed Phase Interactions: Flame-Surface Heat ExchangeFlame-Surface Heat Exchange
John E. Adams, Tamas Szabo, and Ali Siavosh-Haghighi
Department of ChemistryUniversity of Missouri-Columbia
Columbia, MO 65211-7600
MURI Review, Picatinny Arsenal, October 27, 2004

MU
Context: Burning Rates
• Continuum modeling of two-phase and three-phase combustion processes– One-dimensional– Homogeneous– Conserve mass, atomic species, energy within each phase– Match species, energy fluxes at interfaces– Surface regression through single-component evaporation– Multi-ingredient mixtures treated using a
phenomenological pyrolysis law (CYCLOPS code)
MU
Simplifications, Difficiencies
• Multi-component evaporation– Adsorbed/absorbed combustion products– Products of condensed-phase reactions
• Liquid-phase diffusion• Real gases• Complex liquid-phase behavior in a mixture• Direct gas-surface reactions• Missing experimental data

MU
Simulations
• Gas-liquid surface collisions– Equilibrate liquid sample– Create interface(s) by expanding the
simulation cell
• Analysis– Energy transfer to the surface– Trapping of colliding species– Evaporation at the liquid surface
– Ts dependences
MU
Structureless Model System
• Lennard-Jones potential model– Generalizable via corresponding states
• “Light” gas, “heavy” surface species(ratio = 0.35)
• Hot gas, “cold” surface

MU
Surface Contours
0
0.005
0.01
0.015
0.02
0.025
0.03
0.035
0.04
-35 -25 -15 -5 5 15 25 35
z ()
Nu
mb
er D
ensi
ty
T*=0.923
T*=0.756
T*=0.719

MU
Final Energies (Ei = 92 kJ/mol)
5 15 25 35 45 55 66 75 85 95 105
Scattered
All
0
200
400
600
800
1000
Fre
qu
ency
Final Energy (kJ/mol)
ScatteredAll
MU
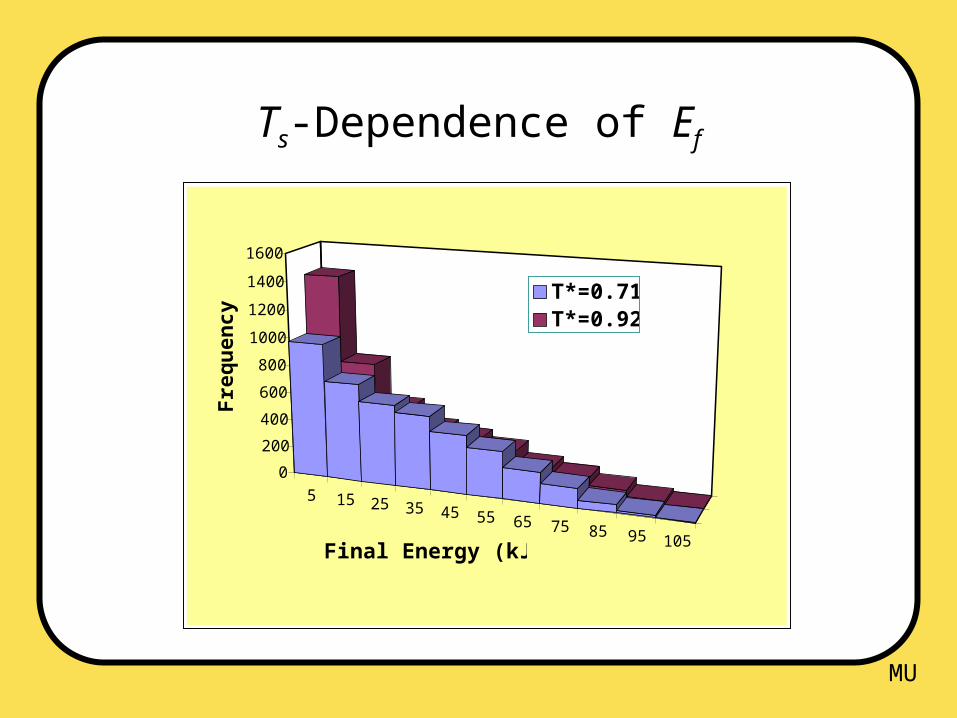
Ts-Dependence of Ef
5 15 25 35 45 55 65 75 85 95 105
T*=0.719
T*=0.923
0
200
400
600
800
1000
1200
1400
1600
Fre
quen
cy
Final Energy (kJ/mol)
T*=0.719T*=0.923

MU
Ts-Dependence of Trapping
15
20
25
30
35
40
45
0.7 0.75 0.8 0.85 0.9 0.95
Reduced Surface Temperature (T* )
Per
cen
t tr
app
ed s
pec
ies
55
30
0
MU
Real Energetic Material: Nitromethane
• Prototypical CHNO material• Potential model from Agrawal, Rice, and
Thompson• Structureless impinging species (2/3 of
CH3NO2 mass)
• High-energy incident species, Ts = 360 K

MU
Surface Contour
Nitromethane, 360K
0
0.002
0.004
0.006
0.008
0.01
0.012
-35 -30 -25 -20 -15 -10 -5 0 5 10 15 20 25 30 35
z (angstroms)
Num
ber
dens
ity

MU
Final Energies (Ei = 92 kJ/mol, i = 55°)
515
2535
4555
6575
8595
105non-trapped
all
0
0.1
0.2
0.3
0.4
0.5
0.6
0.7
0.8
0.9
Fra
ctio
n
Final Energy (kJ/mol)

MU
Next Steps
• Extend database of vapor densities as a function of T
• Evaluate dependence of energy transfer and trapping on the inclusion of internal degrees of freedom
• Describe system in terms of reactive potentials• Investigate dynamics in the presence of
temperature gradients