mti overview - minerals tech - an overview.pdf · of mti. product lines . 8. the above figures...
TRANSCRIPT
M I N E R A L S T E C H N O L O G I E S I N C . A p r i l 2 0 1 8
MTI OVERVIEW

SAFE HARBOR STATEMENT
2
This presentation may contain “forward-looking statements” within the meaning of the Private Securities Litigation Reform Act of 1995 which describe or are based on current expectations. Actual results may differ materially from these expectations. In addition, any statements that are not historical fact (including statements containing the words “believes,” “plans,” “anticipates,” “expects,” “estimates,” and similar expressions) should also be considered to be forward-looking statements. The company undertakes no obligation to publicly update any forward-looking statement, whether as a result of new information, future events, or otherwise. Forward-looking statements in this document should be evaluated together with the many uncertainties that affect our businesses, particularly those mentioned in the risk factors and other cautionary statements in our 2017 Annual Report on Form 10-K and in our other reports filed with the Securities and Exchange Commission.
Also, this presentation will include certain financial measures that were not prepared in accordance with generally accepted accounting principles. Reconciliations of those non-GAAP financial measures to the most directly comparable GAAP financial measures can be found in our Current Report on Form 8-K dated February 1, 2018, and in our other reports filed with the Securities and Exchange Commission, available on our website at www.mineralstech.com in the "Investor Information -- SEC Filings" section.
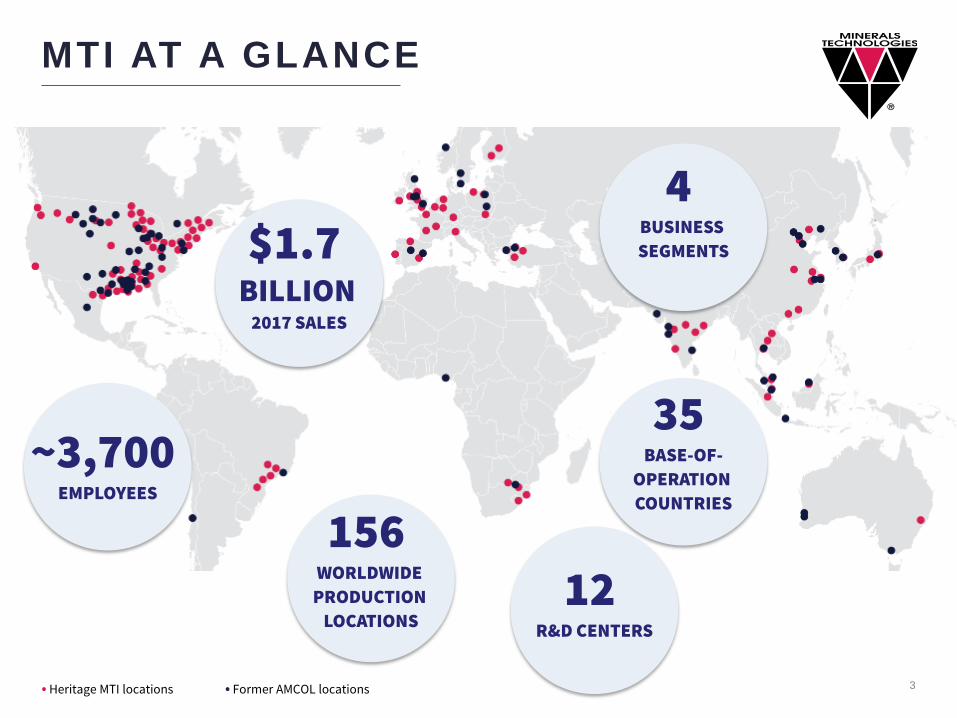
• Heritage MTI locations
MTI AT A GLANCE
• Former AMCOL locations
~3,700 EMPLOYEES
156 WORLDWIDE
PRODUCTION LOCATIONS
12 R&D CENTERS
35 BASE-OF-
OPERATION COUNTRIES
4BUSINESS SEGMENTS$1.7
BILLION2017 SALES
3

FULL YEAR2017 HIGHLIGHTS
Record EPS and Operating Income; Continued Strong Operating Margins of 15.7% and Strong Cash Flow
6% Productivity Improvement
Over 6,000 Kaizen Events; 53,000 Employee Suggestions –~70% Implementation Rate
Strengthened the Balance Sheet$110 Million of Term Load Repaid; Net Leverage Ratio at 2.2X
Greater Capital Deployment Opportunities
4
R E V E N U E O P E R AT I N G I N C O M E
E AR N I N G S P E R S H AR E
% Year-Over-Year Change
P E R F O R M AN C E H I G H L I G H T SG R O W T H H I G H L I G H T S
The above figures reflect the Company’s operating income, operating margin, and EPS, excluding special items, such as acquisition-related costs, restructuring, gains/(losses) on asset sales and impairment costs and related tax effects, for all periods presented. These are non-GAAP measures that the Company believes provide meaningful supplemental information regarding its performance.
$4.59+3%
$1,676+2%
$263+2%
7% Growth in the 2nd Half of 2017
7% Growth in Asia; 12% Growth in China
Organizational Changes
Geographic Expansion: 2 PCC Satellite Contracts; +245,000 tons of Capacity; Expansions to Support New Products
Innovation: 81 New Products Commercialized in the Last 5 Years
$ Millions, Except Per Share Amounts
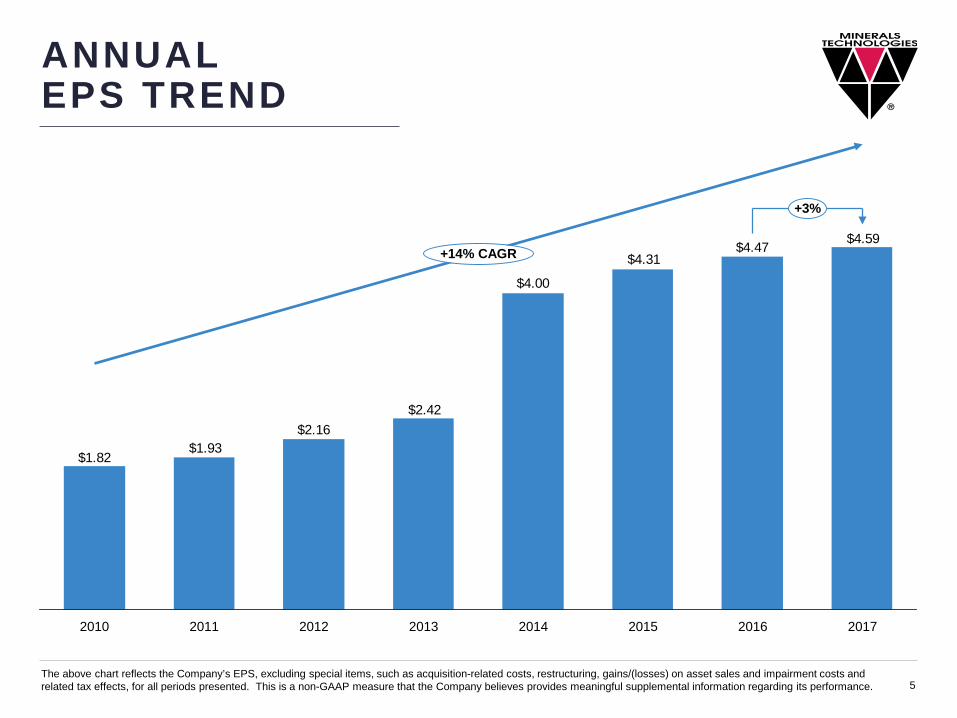
ANNUALEPS TREND
The above chart reflects the Company’s EPS, excluding special items, such as acquisition-related costs, restructuring, gains/(losses) on asset sales and impairment costs and related tax effects, for all periods presented. This is a non-GAAP measure that the Company believes provides meaningful supplemental information regarding its performance. 5
$4.59$4.47$4.31
$4.00
$2.42$2.16
$1.93$1.82
2014 20172013201220112010
+14% CAGR
2016
+3%
2015

Operational Excellence (“OE”) Foundation
Employee SuggestionsThousands
Kaizen EventsThousands
Structured Business System
6
DRIVINGSHAREHOLDER VALUE
The above charts reflect the Company’s operating margin, EBITDA, and ROC, excluding special items, such as acquisition-related costs, restructuring, gains/(losses) on asset sales and impairment costs and related tax effects, for all periods presented. These are non-GAAP measures that the Company believes provide meaningful supplemental information regarding its performance.
Engaged Employees Solid Financial Position
2017
6.2
2016
4.0
2015
3.0
2014
1.9
2013
1.9
2012
1.2
17.8
2013
15.4
2012
9.8
2017
53.1
2016
45.1
2015
39.7
2014
20.6%EBITDA Margin
Strong Values and Culture
Accountability
OrganizationalAlignment
Innovation
Speed of Execution
2.2XNet
Leverage
$415Million of Liquidity
ProductivityYear Over Year Improvement
6%7%6%5%6%9%
201720162015201420132012
15.7%Operating
Margin
9.2%ROC
Product Lines
7The above figures reflect the Company’s operating income, operating margin, and EBITDA, excluding special items, such as acquisition-related costs, restructuring, gains/(losses) on asset sales and impairment costs and related tax effects, for all periods presented. These are non-GAAP measures that the Company believes provide meaningful supplemental information regarding its performance.
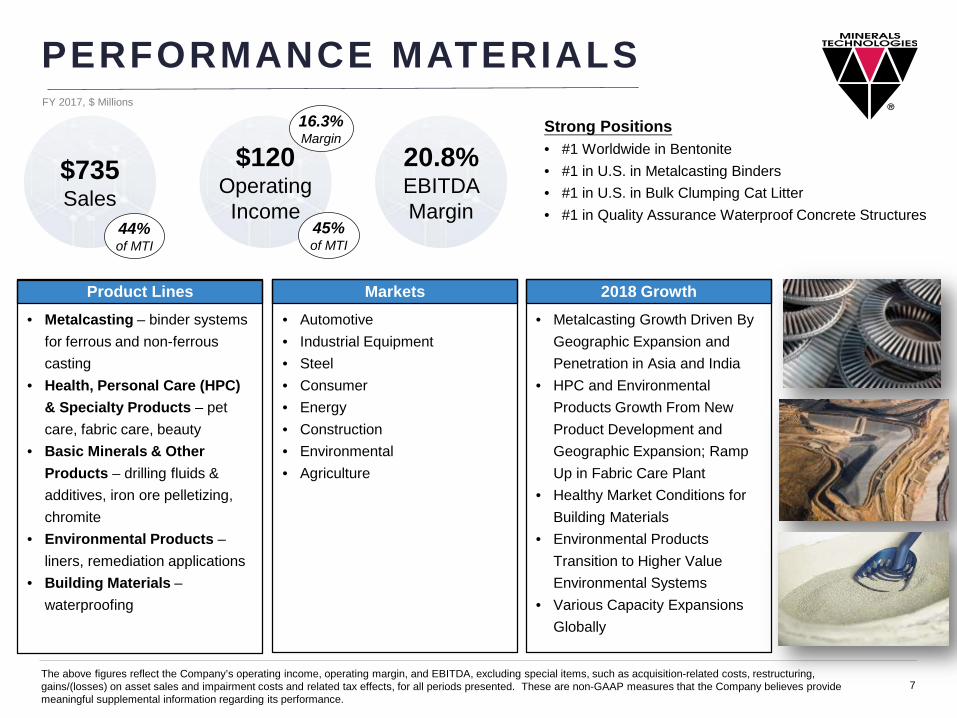
20.8%EBITDA Margin
$735Sales
$120Operating Income
PERFORMANCE MATERIALSStrong Positions• #1 Worldwide in Bentonite• #1 in U.S. in Metalcasting Binders• #1 in U.S. in Bulk Clumping Cat Litter• #1 in Quality Assurance Waterproof Concrete Structures
• Metalcasting – binder systems for ferrous and non-ferrous casting
• Health, Personal Care (HPC) & Specialty Products – pet care, fabric care, beauty
• Basic Minerals & Other Products – drilling fluids & additives, iron ore pelletizing, chromite
• Environmental Products –liners, remediation applications
• Building Materials –waterproofing
• Automotive• Industrial Equipment• Steel• Consumer• Energy• Construction• Environmental• Agriculture
• Metalcasting Growth Driven By Geographic Expansion and Penetration in Asia and India
• HPC and Environmental Products Growth From New Product Development and Geographic Expansion; Ramp Up in Fabric Care Plant
• Healthy Market Conditions for Building Materials
• Environmental Products Transition to Higher Value Environmental Systems
• Various Capacity Expansions Globally
Markets 2018 Growth
16.3%Margin
FY 2017, $ Millions
44%of MTI
45%of MTI

Product Lines
8The above figures reflect the Company’s operating income, operating margin, and EBITDA, excluding special items, such as acquisition-related costs, restructuring, gains/(losses) on asset sales and impairment costs and related tax effects, for all periods presented. These are non-GAAP measures that the Company believes provide meaningful supplemental information regarding its performance.
23.4%EBITDA Margin
$585Sales
$101Operating Income
SPECIALTY MINERALSStrong Positions• #1 Worldwide in Precipitated Calcium Carbonate• #1 in North America in Specialty PCC
• Paper PCC – printing and writing paper
• Ground Calcium Carbonate (GCC) – construction, automotive, consumer
• Specialty PCC – polymers for auto/construction, adhesives, food, pharmaceuticals
• Talc – ceramic applications, paints and coatings, polymers
• Paper and Packaging• Automotive• Consumer• Construction
• PCC Capacity Expansions and New Satellites (+245K metric tons in 2018)
• Customer Driven New Products and Capacity Expansions in Talc and Specialty PCC
• Innovations in Packaging to Expand Product Portfolio
Markets 2018 Growth
17.3%Margin
FY 2017, $ Millions
34%of MTI
39%of MTI
Product Lines
9The above figures reflect the Company’s operating income, operating margin, and EBITDA, excluding special items, such as acquisition-related costs, restructuring, gains/(losses) on asset sales and impairment costs and related tax effects, for all periods presented. These are non-GAAP measures that the Company believes provide meaningful supplemental information regarding its performance.
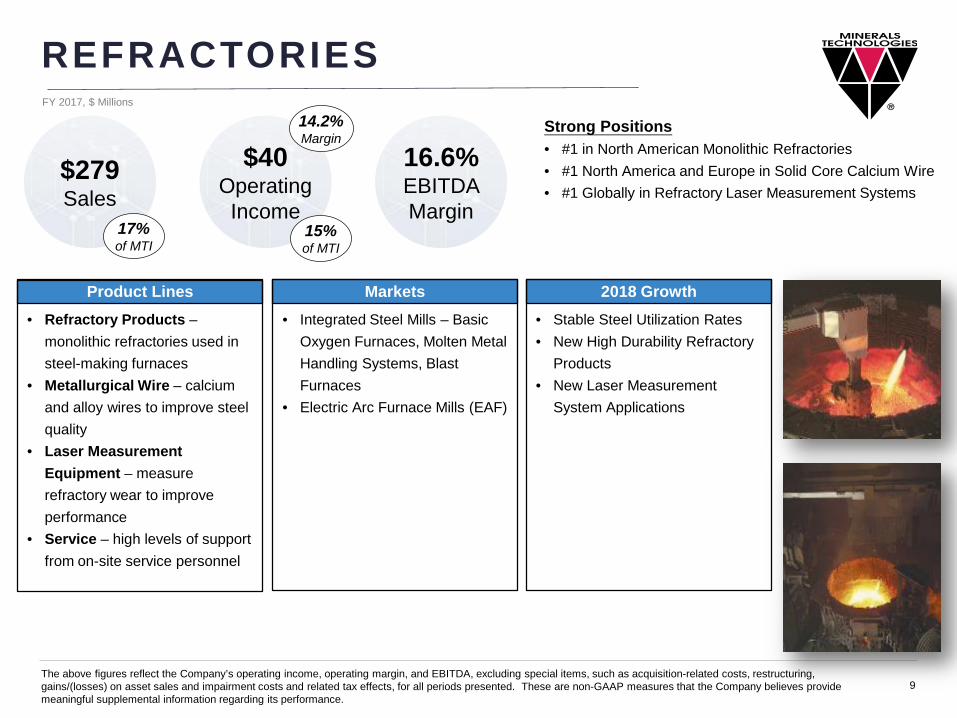
16.6%EBITDA Margin
$279Sales
$40Operating Income
REFRACTORIESStrong Positions• #1 in North American Monolithic Refractories• #1 North America and Europe in Solid Core Calcium Wire• #1 Globally in Refractory Laser Measurement Systems
• Refractory Products –monolithic refractories used in steel-making furnaces
• Metallurgical Wire – calcium and alloy wires to improve steel quality
• Laser Measurement Equipment – measure refractory wear to improve performance
• Service – high levels of support from on-site service personnel
• Integrated Steel Mills – Basic Oxygen Furnaces, Molten Metal Handling Systems, Blast Furnaces
• Electric Arc Furnace Mills (EAF)
• Stable Steel Utilization Rates• New High Durability Refractory
Products• New Laser Measurement
System Applications
Markets 2018 Growth
14.2%Margin
FY 2017, $ Millions
17%of MTI
15%of MTI
Product Lines
10The above figures reflect the Company’s operating income, operating margin, and EBITDA, excluding special items, such as acquisition-related costs, restructuring, gains/(losses) on asset sales and impairment costs and related tax effects, for all periods presented. These are non-GAAP measures that the Company believes provide meaningful supplemental information regarding its performance.
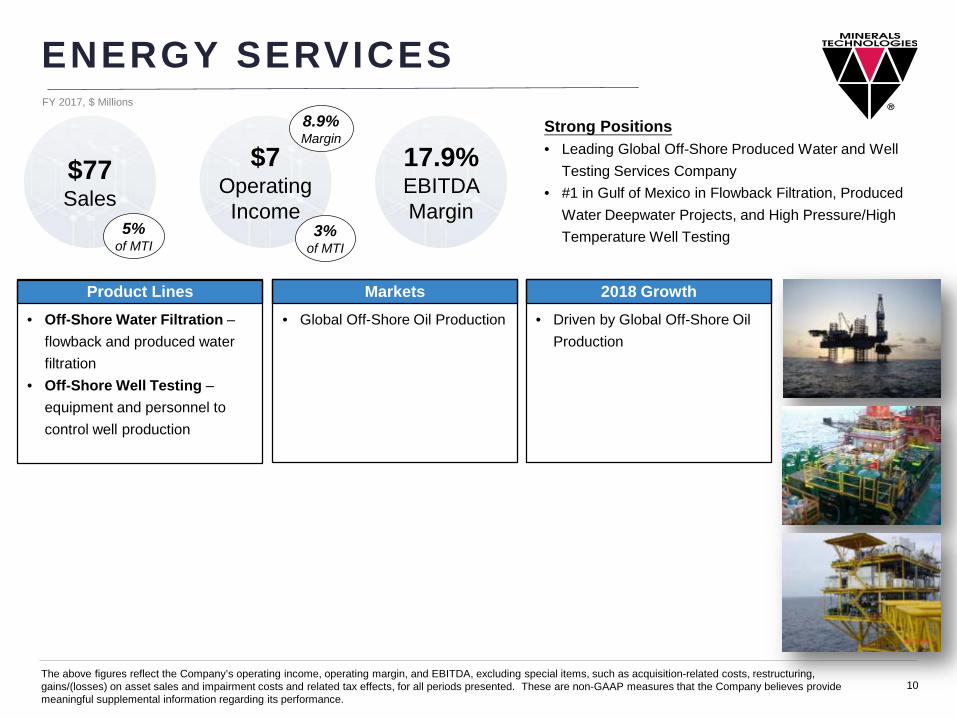
17.9%EBITDA Margin
$77Sales
$7Operating Income
ENERGY SERVICES
• Off-Shore Water Filtration –flowback and produced water filtration
• Off-Shore Well Testing –equipment and personnel to control well production
• Global Off-Shore Oil Production • Driven by Global Off-Shore Oil Production
Markets 2018 Growth
8.9%Margin
FY 2017, $ Millions
Strong Positions• Leading Global Off-Shore Produced Water and Well
Testing Services Company• #1 in Gulf of Mexico in Flowback Filtration, Produced
Water Deepwater Projects, and High Pressure/High Temperature Well Testing5%
of MTI3%
of MTI

DEBT AND LIQUIDITY HIGHLIGHTS
• $590M of Term Loan Debt Repaid Since 2Q’14• Total Liquidity of $415M; $215M Cash & Cash Equivalents, $200M Revolver
11
9701,0031,0321,0641,0831,1281,177
1,2271,2651,334
1,3831,4251,4611,5211,558
2.22.32.52.52.52.62.72.82.82.93.0
3.2
3.8
4.2
4.5
2Q1Q4Q3Q2Q1Q 4Q3Q2Q1Q4Q3Q4Q3Q2Q
Net Leverage RatioTotal Debt
2014 2015 2016 2017
$ Millions
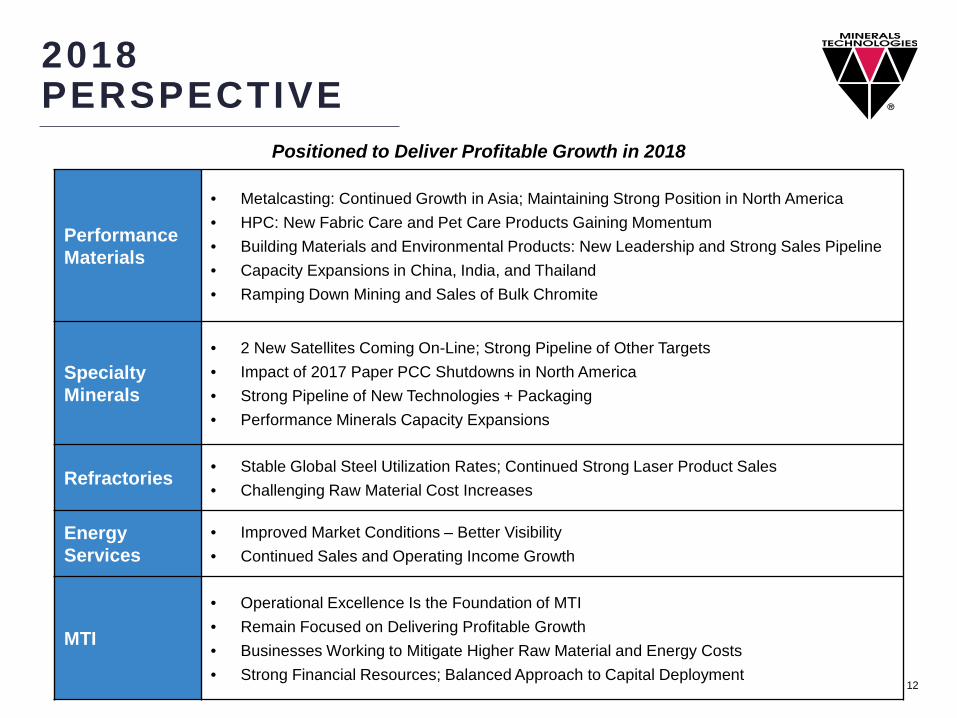
2018PERSPECTIVE
12
Positioned to Deliver Profitable Growth in 2018
Performance Materials
• Metalcasting: Continued Growth in Asia; Maintaining Strong Position in North America• HPC: New Fabric Care and Pet Care Products Gaining Momentum• Building Materials and Environmental Products: New Leadership and Strong Sales Pipeline• Capacity Expansions in China, India, and Thailand• Ramping Down Mining and Sales of Bulk Chromite
Specialty Minerals
• 2 New Satellites Coming On-Line; Strong Pipeline of Other Targets• Impact of 2017 Paper PCC Shutdowns in North America• Strong Pipeline of New Technologies + Packaging• Performance Minerals Capacity Expansions
Refractories • Stable Global Steel Utilization Rates; Continued Strong Laser Product Sales• Challenging Raw Material Cost Increases
EnergyServices
• Improved Market Conditions – Better Visibility• Continued Sales and Operating Income Growth
MTI
• Operational Excellence Is the Foundation of MTI• Remain Focused on Delivering Profitable Growth• Businesses Working to Mitigate Higher Raw Material and Energy Costs• Strong Financial Resources; Balanced Approach to Capital Deployment
FOURTH QUARTER 2017HIGHLIGHTS
13
M I N E R A L S T E C H N O L O G I E S I N C .
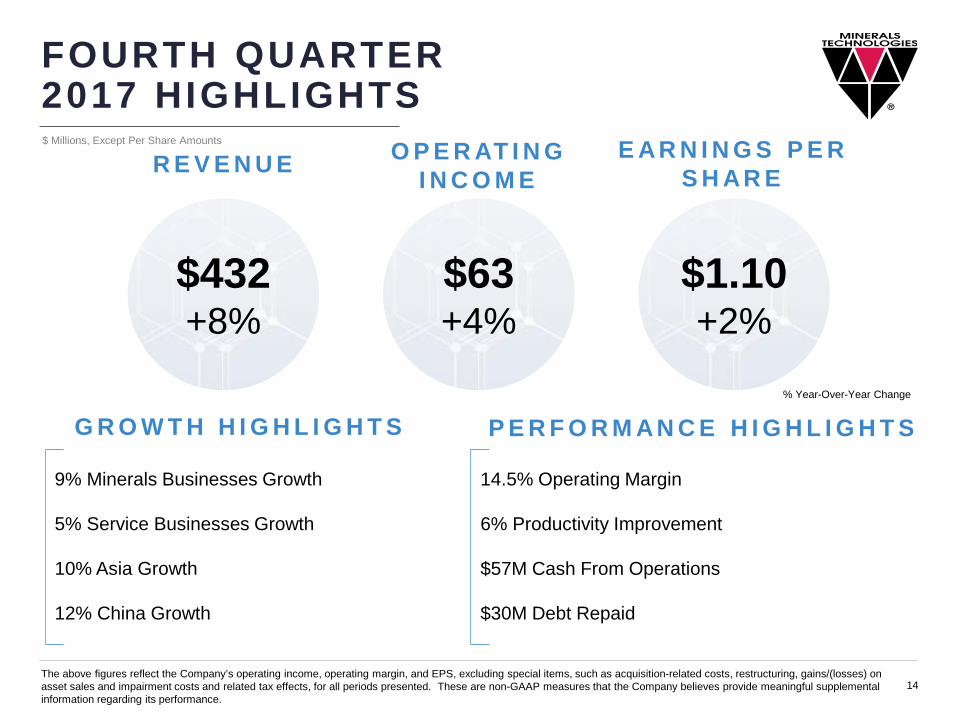
FOURTH QUARTER 2017 HIGHLIGHTS
14.5% Operating Margin
6% Productivity Improvement
$57M Cash From Operations
$30M Debt Repaid
14
R E V E N U E O P E R AT I N G I N C O M E
E AR N I N G S P E R S H AR E
% Year-Over-Year Change
P E R F O R M AN C E H I G H L I G H T SG R O W T H H I G H L I G H T S
The above figures reflect the Company’s operating income, operating margin, and EPS, excluding special items, such as acquisition-related costs, restructuring, gains/(losses) on asset sales and impairment costs and related tax effects, for all periods presented. These are non-GAAP measures that the Company believes provide meaningful supplemental information regarding its performance.
$1.10+2%
$432+8%
$63+4%
9% Minerals Businesses Growth
5% Service Businesses Growth
10% Asia Growth
12% China Growth
$ Millions, Except Per Share Amounts
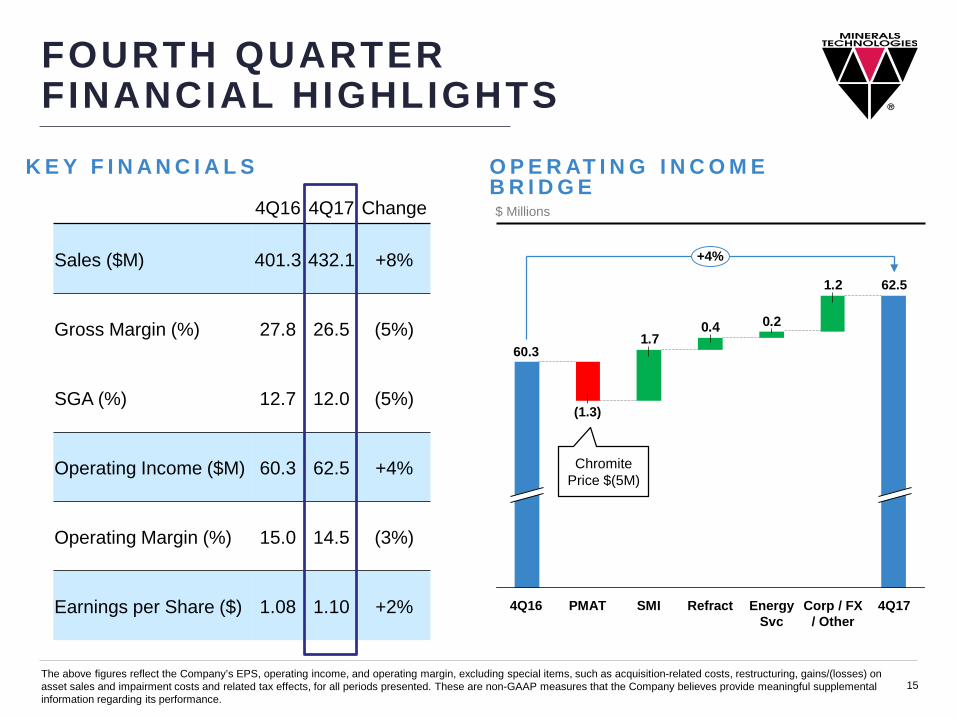
4Q16 4Q17 Change
Sales ($M) 401.3 432.1 +8%
Gross Margin (%) 27.8 26.5 (5%)
SGA (%) 12.7 12.0 (5%)
Operating Income ($M) 60.3 62.5 +4%
Operating Margin (%) 15.0 14.5 (3%)
Earnings per Share ($) 1.08 1.10 +2%
FOURTH QUARTER FINANCIAL HIGHLIGHTS
15
$ Millions
K E Y F I N A N C I A L S O P E R AT I N G I N C O M E B R I D G E
The above figures reflect the Company’s EPS, operating income, and operating margin, excluding special items, such as acquisition-related costs, restructuring, gains/(losses) on asset sales and impairment costs and related tax effects, for all periods presented. These are non-GAAP measures that the Company believes provide meaningful supplemental information regarding its performance.
1.2
0.20.41.7
RefractSMI 4Q17
+4%
62.5
Corp / FX / Other
Energy Svc
PMAT
(1.3)
4Q16
60.3
Chromite Price $(5M)
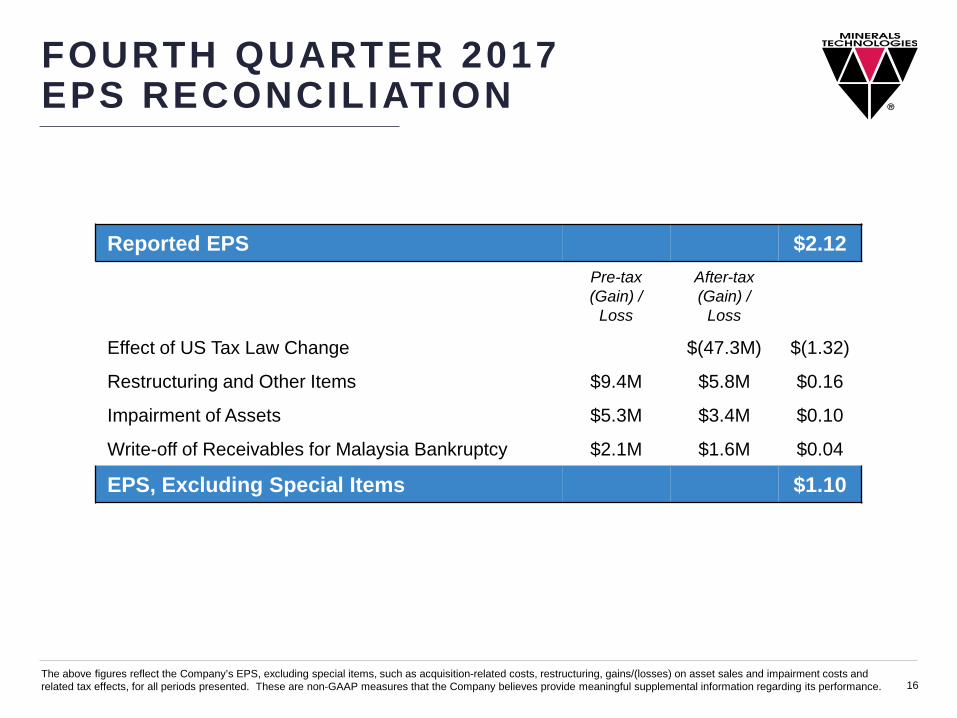
FOURTH QUARTER 2017EPS RECONCILIATION
16The above figures reflect the Company’s EPS, excluding special items, such as acquisition-related costs, restructuring, gains/(losses) on asset sales and impairment costs and related tax effects, for all periods presented. These are non-GAAP measures that the Company believes provide meaningful supplemental information regarding its performance.
Reported EPS $2.12Pre-tax (Gain) /
Loss
After-tax (Gain) /
Loss
Effect of US Tax Law Change $(47.3M) $(1.32)
Restructuring and Other Items $9.4M $5.8M $0.16
Impairment of Assets $5.3M $3.4M $0.10
Write-off of Receivables for Malaysia Bankruptcy $2.1M $1.6M $0.04
EPS, Excluding Special Items $1.10

MINERALS BUSINESSESHIGHLIGHTS
• Performance Materials– Metalcasting Sales +17%; China +22%– Building Materials Sales +21%– Household, Personal Care & Specialty +16%
• Specialty Minerals– PCC Sales +4%– Ground Calcium Carbonate Sales +9%
• Operating Margin at 15.1%
S A L E S O P E R AT I N G I N C O M E
$ Millions
F O U R T H Q U A R T E R H I G H L I G H T S M I N E R A L S P R O D U C T L I N E S
17Specialty Minerals42% ($144M)
PerformanceMaterials
(Bentonite-based)
SpecialtyMinerals
(Carbonate-based)
339.7313.0
336.5
4Q16
+9%
4Q173Q17
51.457.2
51.0
+1%
4Q173Q174Q16
6%5%
14%
23%
28%
10%
6%4%4%
Building MaterialsEnvironmentalHPCMetalcasting
Basic MineralsPaper PCCSpecialty PCC
GCCTalc
$340M
Performance Materials58% ($196M)
18
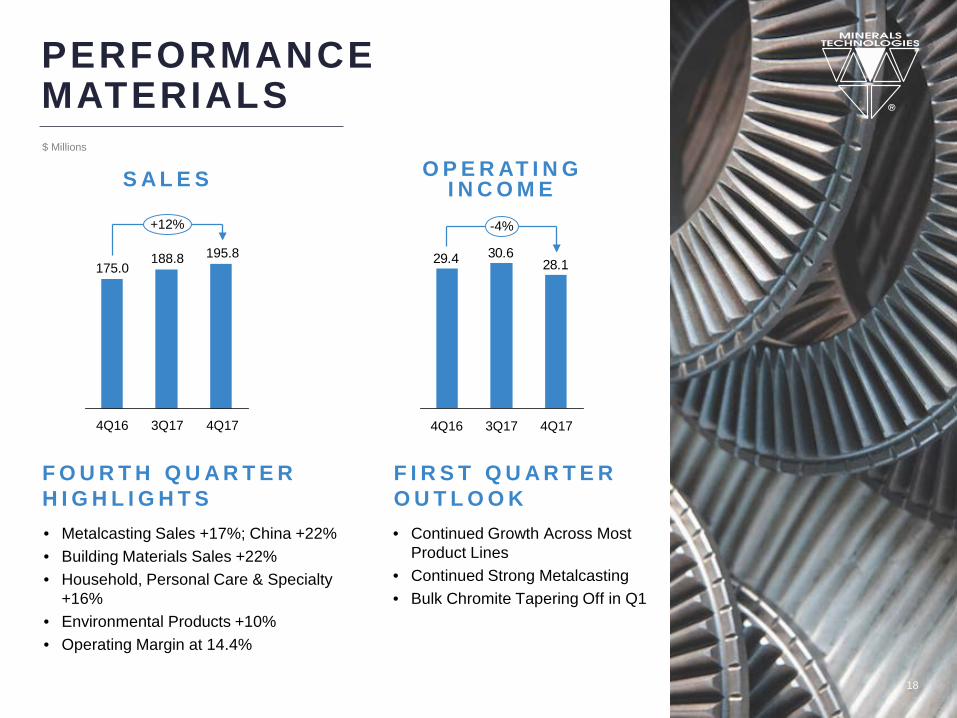
PERFORMANCE MATERIALS
• Metalcasting Sales +17%; China +22% • Building Materials Sales +22%• Household, Personal Care & Specialty
+16%• Environmental Products +10%• Operating Margin at 14.4%
$ Millions
• Continued Growth Across Most Product Lines
• Continued Strong Metalcasting• Bulk Chromite Tapering Off in Q1
S A L E S O P E R AT I N G I N C O M E
F O U R T H Q U A R T E R H I G H L I G H T S
F I R S T Q U A R T E R O U T L O O K
+12%
4Q17
195.8
3Q17
188.8
4Q16
175.0 28.130.629.4
4Q17
-4%
3Q174Q16
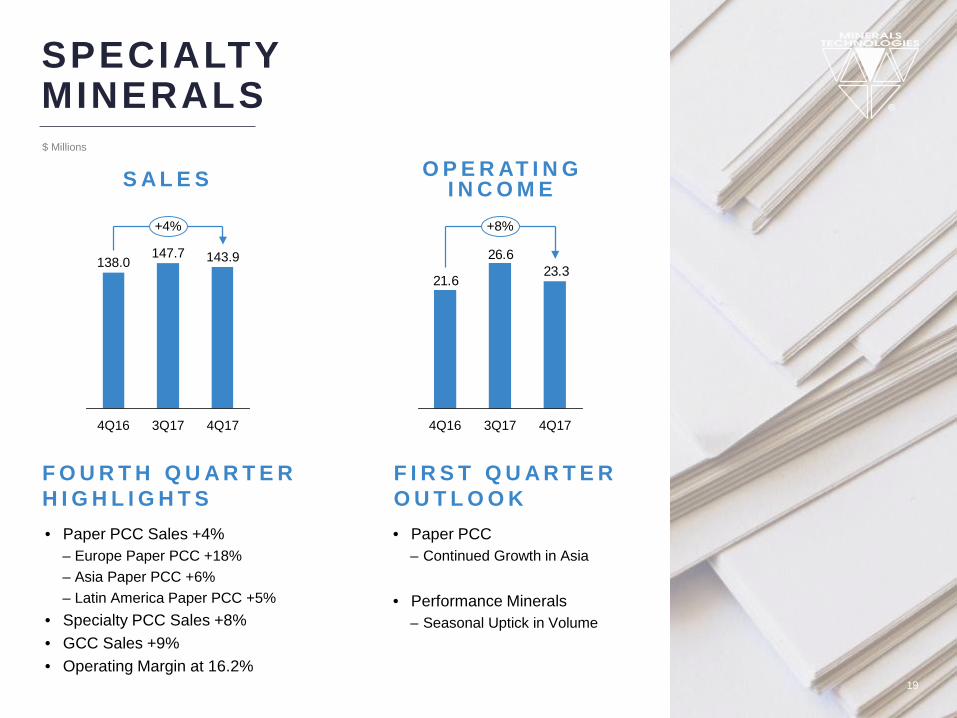
SPECIALTY MINERALS
• Paper PCC Sales +4%– Europe Paper PCC +18%– Asia Paper PCC +6%– Latin America Paper PCC +5%
• Specialty PCC Sales +8%• GCC Sales +9%• Operating Margin at 16.2%
$ Millions
F O U R T H Q U A R T E R H I G H L I G H T S
F I R S T Q U A R T E R O U T L O O K• Paper PCC
– Continued Growth in Asia
• Performance Minerals– Seasonal Uptick in Volume
19
+4%
4Q173Q17
147.7138.0 143.9
4Q16
23.326.6
21.6
+8%
4Q173Q174Q16
S A L E S O P E R AT I N G I N C O M E

SERVICE BUSINESSESHIGHLIGHTS
• 5% Sales Growth– Refractories Segment +5%– Energy Services +4%
• Operating Margin at 13.4%
20
23%
15% 62%Energy ServicesMetallurgicalRefractory
$92M
$ Millions
F O U R T H Q U A R T E R H I G H L I G H T S S E R V I C E P R O D U C T L I N E S
92.487.988.3
3Q174Q16
+5%
4Q17
12.411.511.8
4Q16
+5%
4Q173Q17
S A L E S O P E R AT I N G I N C O M E
21
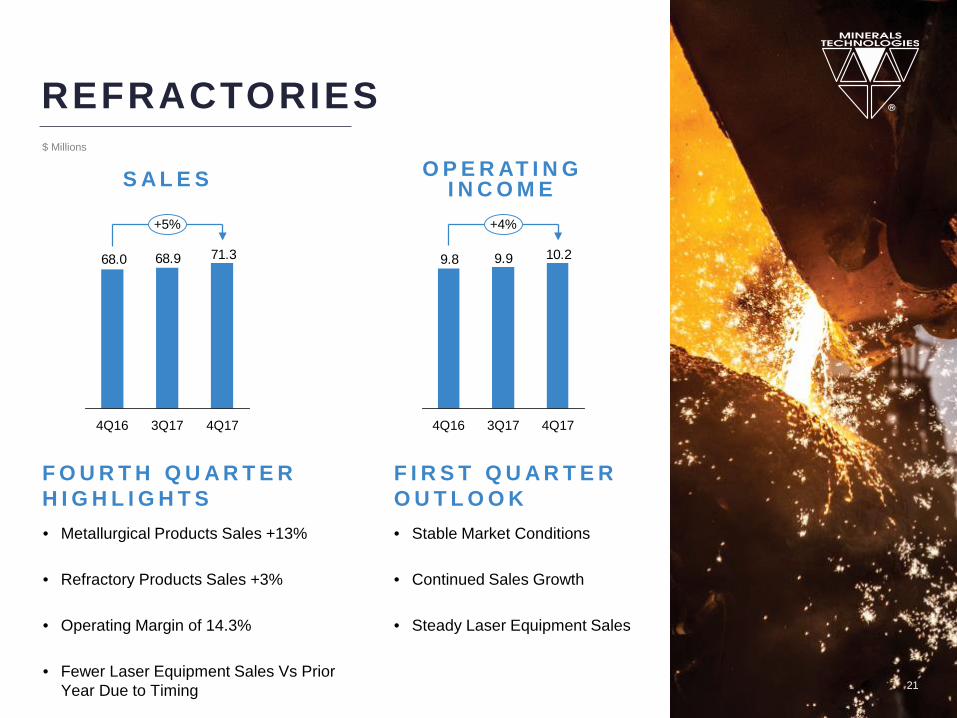
REFRACTORIES
• Metallurgical Products Sales +13%
• Refractory Products Sales +3%
• Operating Margin of 14.3%
• Fewer Laser Equipment Sales Vs Prior Year Due to Timing
$ Millions
• Stable Market Conditions
• Continued Sales Growth
• Steady Laser Equipment Sales
F O U R T H Q U A R T E R H I G H L I G H T S
F I R S T Q U A R T E R O U T L O O K
71.368.968.0
+5%
4Q173Q174Q16
10.29.99.8
4Q17
+4%
3Q174Q16
S A L E S O P E R AT I N G I N C O M E

22
ENERGY SERVICES
• Sequential Quarter Sales +11%
• Sequential Quarter Operating Income +38%
• Operating Margin of 10.4%
$ Millions
• Similar Level of Offshore Service Activity
• Lower Filtration in Q1
F O U R T H Q U A R T E R H I G H L I G H T S
F I R S T Q U A R T E R O U T L O O K
21.119.020.3
4Q173Q174Q16
+11%
2.2
1.6
2.0
+38%
4Q173Q174Q16
S A L E S O P E R AT I N G I N C O M E
