mti b3tr55 --~a:a-cr-167891
TRANSCRIPT

n f\ sl\ Cf\ - 1 ~ I J C;q J
NASA CR·167B91 . MTI B3TR55
: --~A:A-CR-167891 JI
I 19830025623
l~ ___ -------NI\SI\.
T55 POWER TURBINE ROTOR MULTIPLANE-MULTISPEED BALANCING 'STUDY
bV Michael R. Martin
MECHANICAL TECHNOLOGY INCORPORATED
Prepared for
NATIONAL AERONAUTICS AND SPACE ADMINISTRATION
NASA Lewis Research Center Contract NAS3·1940B
LIBRARY COpy SEP 291983
lA~GLEY RESEARCH CENTER LIBRARY, NASA
HAMPTON, VIRGINIA

1. Report No. 2. Government Accession No.
NASA CR-167891 4. Title and Subtitle
T55 POWER TURBINE ROTOR
MULTIPLANE-MULTISPEED BALANCING STUDY
7. Author(s)
Michael R. Martin
3. Recipient's Catalog No.
5. Report Date
February 1982 6. Performing Organization Code
8. Performing Organization Report No.
MTI83TR55
t---------------------------------~ 10. Work Unit No. 9. Performing Organization Name and Address
11. Contract or Grant No.
12. Sponsoring Agency Name and Address
National Aeronautics and Space Administration Washington, DC 20546
14. Sponsoring Agency Code
15. Supplementary Notes
Project Manager, David P. Fleming, Structures and Mechnaical Technologies Division, NASA Lewis Research Center, Cleveland, Ohio
16. Abstract
A rotordynamic analysis of the T55-L-IIC engine was used to evaluate the balancing needs of the power turbine and to optimize the balancing procedure. As a result, recommendations were made for implementation of a multiplane-multispeed balancing plan.
Precision collars for the attachment of trial weights to a slender rotor were designed enabling demonstration balancing on production hardware. The quality of the balance was then evaluated by installing a high speed balanced power turbine in an engine and running in a test cell at the Corpus Christi Army depot. The engine used had been tested prior to the turbine change out and showed acceptable overall vibration levels for the engine were significantly reduced, demonstrating the ability of multiplane-multispeed balancing to control engine vibration.
17. Key Words (Suggested by Author(s))
Balancing
High Speed Balancing
Rotordynamics
19. Security Classif. (of this report)
Unclassified
18. Distribution Statement
Unclassified - Unlimited
20. Security Classif. (of this page)
Unclassified
21. No. of Pages 22. Price-
* For sale by the National Technical Information Service, Springfield, Virginia 22151
. (\ ~ '"0 -~ ~3gLr~

TABLE OF CONTENTS
SECTION
1.0 SUMMARY
2.0 INTRODUCTION
2.1 Critical Speeds and Mode Shapes
2.2 Rotor Response to Unbalance
2.3 Testing
3.0 DISCUSSION
3.1 TASK 1 DEVELOPMENT OF CRITERIA FOR MULTIPLANE-MULTISPEED
BALANCING ......................... .
3.2 TASK 2: EVALUATION OF BRECISION COLLAR FOR ATTACHING TRIAL
WEIGHTS
3.3 TASK 3 MULTIPLANE-MULTISPEED BALANCING DEMONSTRATION OF T55
POWER TURBINES
3.3.1
3.3.2
3.3.3
3.3.4
3.3.5
3.'3.6
3.3.7
3.3.8
3.3.9
3.3.10
3.4 TASK 4:
3.4.1
3.4.2
3.4.3
3.4.4
Introduction
Balancing Summary
Drive System and Test Rig
Rotor No.1
Rotor No.2
Rotor No.3
Rotor No.4
Rotor No.5
Consolidation of Influence Coefficients
Documentation of Balancing Times
REVISION & CORRELATION OF THE ANALYTICAL MODEL
Background
MTI Rig Analysis
Engine Analysis
Correlation of Experiment with Analysis
i
. ...
PAGE
1
3
3
4
5
6
6
7
10
11
12
13
14
15
15 .
15
16
17
18
19
19
20
21
22

3.5 TASK: 5 EFFECTIVENESS OF THIRD TURBINE STAGE BALANCING
CORRECTIONS
3.5.1 Fourth Turbine Stage Sensitivity
3.5.2 Randomly Distributed Unbalance
3.6 TASK 6: VERIFICATION OF POWER TURBINE BALANCE QUALITY
3.7 TASK 7: EXPERIMENTAL STUDY OF SPLINE DYNAMICS
3.7.1 Introduction
3.7.2 Test Set-Up
3.7.3 Testing Procedures
3.7.4 Data Analysis
3.7.5 Results
4 . 0 CONCLUS IONS ..... .
4.1 General Conclusions
REFERENCES
5.0 RECOMMENDATIONS
ii
24
24
24
26
27
·27
28
29
29
30
32
33
34
35

1.0 SUMMARY
This report relates the work accomplished under NASA contract NAS3-l9408. The
scope of work comprised seven technical tasks with initial efforts beginning in
1975 .. All wQrk involved the Avco Lycoming T55-L-llC engine. The following
items highlight the major areas of work accomplished:
• A Rotordynamic Analysis of both the T55 engine power turbine and gas
generator rotor-bearing systems was performed. Lateral critical speeds
were calculated for both systems and unbalance distributions in the
rotating. elements, determined from manufacturing tolerances, were used
to investigate the sensitivity of the power turbine to .residual
unbalance. Standard engine balancing and assembly procedures were
reviewed and recommendations were made for implementation of a multi
plane-multispeed balancing procedure.
• Precision balance collars for addition of temporary weights to uniform
shafts were designed and tested. A flexible rotor was balanced with the
use of two collars for operation through and above two critical speeds.
Rotor balance remained satisfactory after equivalent weights were added
to the rotor and the collars were removed.
• The ability of multiplane-multispeed balancing procedures to balance
production hardware was demonstrated. An existing balancing system was
used to acquire and store power turbine response data, calculate influ
ence coefficients and calculate size and location of the required
correction weights.
• The analytical model used to calculate the critical speeds and mode
shapes was updated based on observations made during the testing. The
refined mathematical model was then used to analytically evaluate shaft
end and third turbine stage balance planes.
• The quality of the balance achieved in the high speed balancing rig was
evaluated by running two power turbine rotors in a test cell engine, and
monitoring engine case vibration. The first power turbine was high speed
1

balanced only prior to testing. It was installed in an engine that had
run acceptably with a different (low speed balanced) turbine. The engine
was then rerun with the high speed balanced turbine installed and showed
a significant decrease in overall vibration, confirming the conclusion
of the analytical phase - that high speed balancing is more effective at
controlling vibration at the design speed than low speed balancing tech
niques.
• The effect of drive shaft to power shaft spline fit on the rotordynamic
response was experimentally determined. The spline showed no signs of
instability or tendency for a dynamic offset.
2
2.0 INTRODUCTION
Shaft speeds in many gas turbine designs are above one or more critical speeds
at which bending of the shaft elastic axis is expected. Such designs are very
sensitive to unbalance. This is particularly true when rolling element bearings
are utilized because of low system damping. Excessive vibration arises because
the rate at which vibration energy is produced is not adequately counterbalanced
by the rate at which it is dissipated in the engine. The science which permits
this energy balance to be understood and controlled in a complex structure such
"as a gas turbine is rotordynamics. A rotordynamic analysis of the T55-L-llC
engine performed under this contract was used to evaluate the balancing needs of
the T55 power turbine and to optimize the procedure. The analytical evaluation
of the benefits of high speed "balancing as adapted to T55 power turbines formed " "
the basis for the second phase of the program in which the balancing procedures
were tested in the laboratory on actual engine hardware which was then given a
final evaluation by running in a T55 engine.
The obj ective of the program was to evaluate both analytically and exper
imentally the benefits of high speed balancing over low speed balancing as
applied to T55 power turbines. The following sections describe the basic tech
niques used during the analytical and test efforts of this contract.
2.1 Critical Speeds and Mode Shapes
The objective of task 1 was to use a rotordynamic analysis to evaluate power
turbine sensitivity to unbalance and to analytically investigate balancing
techniques, including the choice of speeds, planes & sensors. After gathering
the necessary engine design data (including rotor and bearing assemblies and
detailed drawings) a rotor is analytically modeled to depict its mass and elas
tic characteristics. The analytical effort for the T55-L-IIC included identifi
cation of lateral critical speeds, unbalance response and balance plane
evaluation. A rotor lateral critical speed is the condition in which the rotor
speed matches the natural frequency of the rotor bearing system. At such a
frequency, the system's mass and elastic properties combine to form a resonant
condition in which relatively large amplitudes are possible at low input energy
levels.
3

When the rotor speed is near one of its critical speeds, the rotor will vibrate
with amplitudes in a particular mode of vibration. The shape of the elastic
axis of the rotor at the critical speed is calculated in terms of relative
amplitudes to examine the rotor displacement. This analysis shows the amount of
rotor bending, which is an indication of rotor flexibility ..
2.2 Rotor Response to Unbalance
While the information obtained from the undamped critical speed map is very
useful for evaluating the dynamic behavior of a rotor bearing system, the calcu
lated mode shapes and critical speed map are only intermediate results in a
comprehensive vibration analysis. Actual engine vibration results ·when the
rotor is subjected to excitational forces. These forces may be aerodynamic,
magnetic, mechanical, etc. By far the most common of such excitations are the
unbalarice forces present in the rotor, which are distributed along and about the
rotor axis based on machining tolerances and rotor assembly procedures. Rota
tion of the unbalance masses at the speed of the rotor gives rise to forces
acting radially outward from the rotor's axis which are proportional to the mass
of the unbalance, and to the square of the rotor speed. As a result of these
forces, the rotor whirls about the bearing axis. By analyzing the rotor's
response to unbalance, these forces and their corresponding bearing loads can be
analyzed as the rotor increases in speed. Rotor deflections can be calculated
as critical speeds are traversed.
Just as deflections can be calculated for unbalances by this approach, effec
tiveness of correction weights can also be evaluated. This is done by. analyzing
the reduction in amplitudes achieved when calculated correction weights are
mathematically installed in the model. To mathematically evaluate alternative
balancing techniques for the T55, a random distribution of unbalance was
included all along the rotor model. The unbalance was modeled using random
numbers representing both magnitude and phase. Different methods of calculating
the correction weights can be compared:
1. A simple summing of unbalances (which simulates a low speed balance
machine)
2. The influence coefficient technique
4
To calculate T55 influence coefficients using the unbalance response program, a
series of rotor" response runs was made which sequentially placed a 71.8 gm.cm.
(1 in. oz.) unbalance as a trial weight at each balancing plane. The amplitudes
and phase at each vibration sensor location and at each balance speed were the
input for the influence coefficient program. Once the influence coefficients
were determined, amplitude and phase data from the response program were input
to the balancing program which calculated the balance correction weights. The
calculated balance weights were then added to the unbalance model and their
effectiveness evaluated by the corresponding decrease in rotor response ampli
tudes.
2.3 Testing
The " analytical results discussed in this report are only useful when they dupli
cate both experimental hardware and actual engine characteristics. During the
demonstration balancing" phase of the project, rotor response data was taken to
determine actual rotor critical speeds and mode shapes. This information was
then used to tune the mathematical model.
For the balancfng demonstration, the power turbine modules were operated in a
test rig consisting of a two speed constant speed electric motor, eddy current
(variable speed) clutch, step-up gearbox and associated couplings and spindles.
Precision collars were utilized for temporary weight addition enabling the
development of influence coefficients. A known trial weight was installed
successively in each balance plane to determine the sensitivity to unbalance at
each plane. The sensitivity or influence coefficients are complex numbers,
representing both phase and magnitude. Once they have been determined, balance
corrections can be calculated from a single run of the rotor.
T55-LIIC rotors were balanced, demonstrating the
Five candidate
ability of
multiplane-multispeed balancing to balance production engine hardware.
The following section presents the detailed results of the rotordynamic evalu
ation and the balancing experiments.
5

3.0 DISCUSSION
This section relates the results of work accomplished in each technical task
authorized under this contract.
3.1 TASK 1 DEVELOPMENT OF CRITERIA FOR MULTIPLANE-MULTISPEED BALANCING
In Task 1, an analytical study was conducted of the dynamics of the T55 engine
power turbine and gas generator rotor bearing system. Details of the,mathemat
ical model used in the analys is are presented on Figures 3.4. 1 thru 3.4.3.
Lateral critical speeds were calculated for both systems. Unbalance distrib
utions, determined from manufacturing tolerances, were used to investigate the
sensitivity of the power turbine to residual unbalance. Combined support stiff
ness (bearing in series with structure) of 1.75 x 10 7 N/M (100,000 lb/in) was
used for each of the ball bearings between the power turbine stages, and 1.75 x
10 8 N/M (1,000,000 lb/in) was used for the roller bearing.
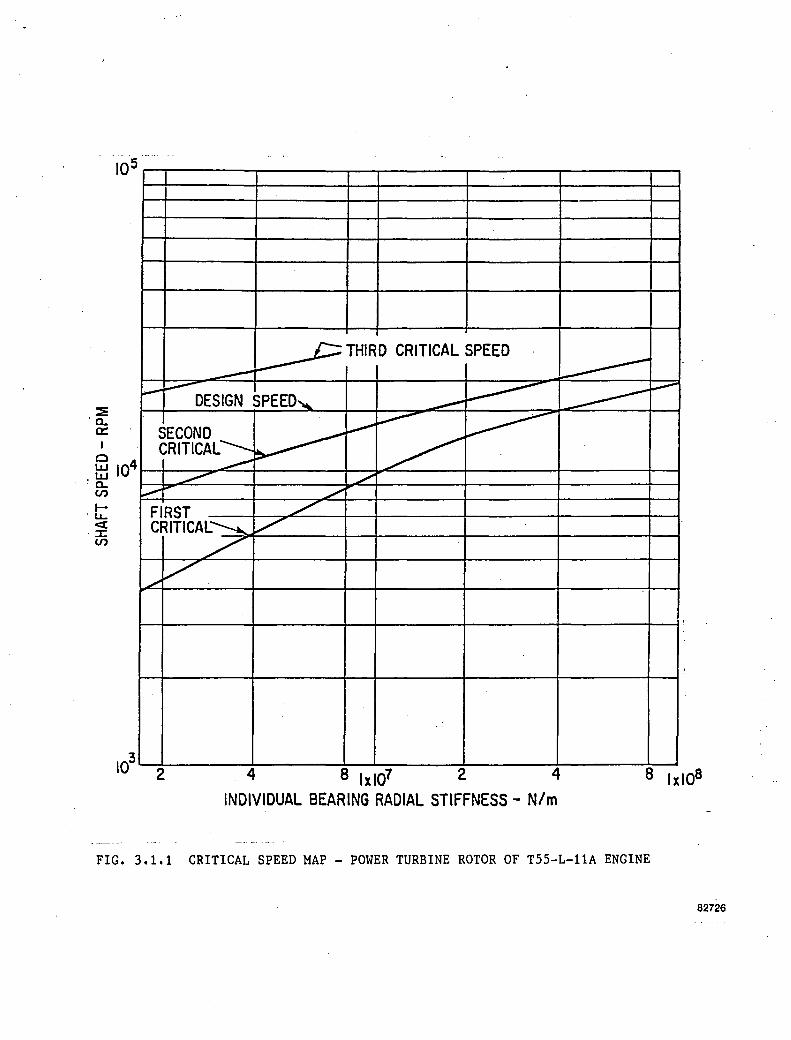
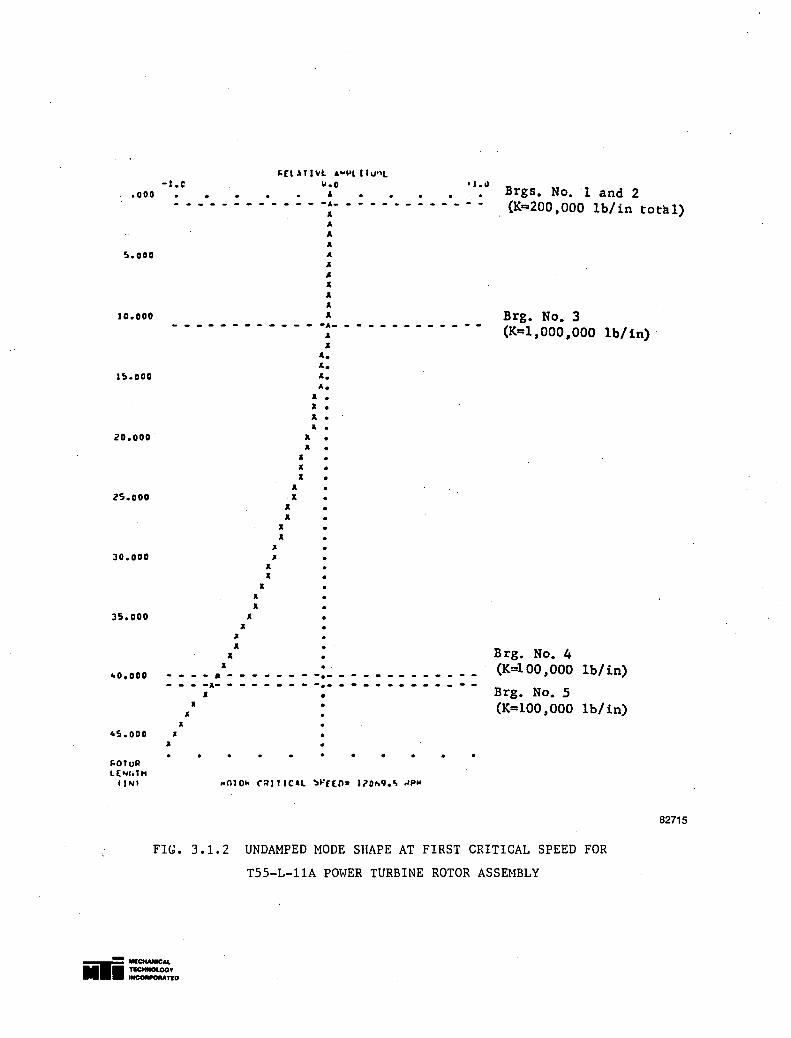
The first critical speed was calculated at 12,070 RPM and the second critical
speed at 21,090 RPM. The critical speed map is shown in Figure 3.1.1 and the
calculated mode shapes of the power turbine rotor at the first and second crit
ical speeds are presented in Figures 3.1.2 and 3.1.3. At the first critical
speed the rotor exhibits maximum amplitudes at the fourth turbine stage. The
mode shape for the second critical speed shows significant bending with peak
amplitudes at the rotor midspan.
The sensitivity of the power turbine ,rotor was next investigated using unbalance
combinations derived from manufacturing tolerances. Resulting calculated maxi
mum rotor amplitudes are shown for the power turbine on Figure 3.1.4.
The unbalance distribution used was determined using an 0.05mm radial eccentric
ity ?etween shaft section and bearing centerline, and with .05 mm wall thickness
variations. The resulting unbalance masses were then distributed with random
phase angle. Next,' it was assumed that standard two plane balancing was
performed on each rotor segment, and calculated correction weights for these
unbalances were applied to the balancing locations. Unbalance representing the
6

fourth stage residual unbalance was included to simulate assembly of that stage
in the final configuration.
Rotor mode shapes derived from the response calculations for the two critical
speeds and for the operating speed are shown in Figures 3.1.5 through 3.1.7.
The modes shapes in Figures 3.1. 5 and 3.1. 6 are associated with the first and
second critical speeds, respectively. At those resonances considerable ampli
tudes are indicated because essentially no damping was modeled at the bearings.
The rotor mode shape at operating speed (Figure 3.1. 7) indicates a maximum
amplitude of approximately 0.2 mm (peak-to-peak) at the rotor mid-span location.
Such predicted amplitude appears reasonable, considering ~he likelihood that
·most power turbine shafts will probably be of better machined quality than that
assumed.Cat tolerance limits) for this study. A reduction ~o half of the eccen
tricity limits used in the calculations would yield a like reduction in rotor
amplitudes. It may be noted that the calculated rotor mode shape at its operat
ing speed· resembles that of the second critical speed. It is apparent, from the
result shown in Figure 3.1.4 that the assumed rotor support stiffness is very
nearly optimum. Thus, if the actual value is greater than assumed, vibration
amplitudes at the design speed would be larger than those predicted because of
an upward shift i~ the first critical. Similarly, softer supports would bring
the second critical down closer to the operating speed.
The proximity of the power turbine rotor operating speed to two critical speeds
with distinctly different mode shapes influences the selection of the most
effective balancing procedure. Should it prove feasible to traverse the first
critical speed with an initially unbalanced rotor Cwhich depends on manufactur
ing tolerances) a two speed two plane balance procedure would suffice. Alterna
tively, if large initial amplitudes are encountered at the first critical, the
two speed balancing step should be preceded by a single plane step aimed at
reducing rotor amplitudes associated with the first critical speed.
3.2 TASK 2: EVALUATION OF PRECISION COLLAR FOR ATTACHING TRIAL WEIGHTS
The experimental evaluation of two precision collars for the attachment of trial
weights to a slender rotor had three objectives:
7

1. Design of a precision collar suitable for high speed operation typical
of modern·turboshaft engine power turbine rotors.
2. Evaluation of balancing requirements of the collar itself and its
effect upon the state of balance achievable in a balance sensitive
rotor.
3. Evaluation of general handling characteristics of the collars such as
ease of installation, susceptability to misapplication, alignment and
holding problems, etc.
The design evaluation of the removable collar concept led to a two-piece config
uration machined from solid material and held together by two high strength
socket . head screws. Precise axial alignment between the'two halves. is guaran
teed by two precision locating pins. Two collars fabricated for evaluation on
the engine rotor simulator are shown in Figure 3.2.1. ·Clear1y visable on each
of the collars in Figure 3.2.1 are four tapped holes which are intended to
accept the trial weights during multiplane-multispeed balancing.
Low speed balancing of the individual collars was accomplished through single
plane balancing on a commercial balancing machine. Each collar was balanced on
a pre-balanced drill-rod shaft. The roundness tolerance of the shaft which was
determined to be approximately 0.003 to 0.005 mm was probably the determining
factor of the minimum residual unbalance remaining with each collar. There were
no further or special attempts made to reduce residual unbalance levels.
Experience with handling of the collars showed that mounting and dismounting of
the collars could be improved by shortening of the alignment pins. No other
problems were experienced in repeated balancing operations to 31,000 RPM. A
general view of the engine rotor simulator, which served as the test rig for the
collar evaluation, is shown in Figure 3.2.2 and a close-up view of both collars
mounted on the shaft is given in Figure 3.2.3. The location and numbering. of
displacement sensors on the rotor is shown in Figure 3.2.4. A detailed
description and dynamic analysis of this rig may be found in Reference 1.
Balance planes available on the rig include threaded holes, for the addition of
8

weights allowing the rotor to be balanced (or unbalanced) indepen,dent of the
collars being tested.
When this rig is operated, large undamped rotor vibration can be observed near
the second critical speed which occurs at 21,500 RPM. Rotor response sensitiv
ity at the second critical speed is much higher than that observed at the first
critical speed (around 8,000 RPM); and previous balance steps were halted
intentionally to leave significant rotor amplitudes at the second' critical
speed. In evaluation of the balancing collar, emphasis in the experimental
tests was on rotor operation through and beyond the second system critical
speed.
Test rig rotor amplitudes were recorded as a means of demonstrating that:
• The addition of the two collars to the rotor will not significantly
affect rotor balance.
• The intentionally unbalanced test rig rotor can be balanced through two
critical speeds with two collars used for the addition of trial weights.
• The rotor will remain satisfactorily balanced when permanent corrections
are made and the trial weight collars removed.
Abstracted test results are presented here as before and after amplitudes
recorded from displacement sensors located on the rotor (see Figure 3.2.4).
Only vertical amplitudes are presented, since rotor orbits were generally circu
lar.
The residual balance condition of the test rig and the change due to the addi
tion of the collars was first investigated. The results are shown in Figure
3.2.5 in which rotor amplitudes at the turbine location are plotted with no
collars on the shaft (curve A) with both collars installed (curve B). Addition
of the collars increased rotor amplitudes slightly at the critical speed. The
difference in amplitudes between test runs with and without balance collars are
not considered significant and both conditions were acceptable. Additional
9
tests indicated the rotor response at the undamped critical speed is not
completely repeatable regardless of the presence or absence of the trial weight
collars. After these tests the rotor was deliberately unbalanced.
With collars in place, the rotor was balanced twice by the multiplane-multispeed
method. For the first balancing run, four balancing planes were utilized on the
rotor (Nos. 1, 3, 4, and 5) with data obtained from three sensors (Nos. 1, 4 and
6) at two rotor speeds (19800 and 20500 RPM) by the addition of trial weights in
the temporary collars. The obtained rotor balance was satisfactory (Curve B,
Figure 3.2.6). and showed some deterioration when the trial collars were removed
(Curve C, Figure 3.2.6). The results from this test series serve very well the
·purpose of demonstrating the maximum expected range of deviation that may appear
to be the result of removing the trial weight collars. Variations in shaft and
bearing temperatures· can cause amplitude variations at resonance that exceed
those shown in Figure 3.2.6.
A second independent balance run was conducted from the same initial balance
condition, this time using three balance planes (Nos. 3, 4, and 5) with data
obtained from probes 3, 4 and 6 at one speed (20500 RPM). The effectiveness of
this balance run, shown in Figure 3.2.7, is attributable to the selection of
balancing planes, probe locations and balance speed, all of which were chosen as
optimum for balancing at the second critical. Upon removal of the balance
collars practically no deterioration of rotor balance was observed.
The experimental evaluation of the precision collars intended for temporary
weight placement on slender or .thin walled shafts during balancing operations
has proven the concept practial and convenient to apply. Rotor balancing has
been successfully demonstrated with the help of two collars for operation
through and above two critical speeds. Rotor operation remained satisfactory
after removal of the two collars.
10

3.3 TASK 3 MULTIPLANE-MULTISPEED BALANCING DEMONSTRATION OF T55 POWER TURBINES
3.3.1 Introduction
The objectives of this task were: to multiplane balance. T55 power turbine
rotors for operation to the maximum service speed, record rotor influence coef
fi~ients, to calculate mean and standard deviation for each influence coeffi-
cient, and document times required for various stages of balancing.
Five' power turbines were available for testing purposes. Three of the modules
were composed of components that were prebalanced as subassemblies. Components
of the remaining two were not prebalanced.
The power turbine modules were operated in a specially designed test rig.
Vibration was measured by displacement probes located along the length of the
power turbine module and associated drive couplings and components. Special
balance collars (developed in Task 2) were installed along the length of the
power shaft. These collars permitted trial and correction weights to be easily
added to the rotor without grinding. An MTI owned Multiplane-Multispeed Balanc
ing System was used to calculate the amount and angular location of balancing
weights. All vibrations signals were also tape recorded for later playback,
analysis, and plotting.
11

I
I
3.3.2 Balancing Summary
Five power turbine modules were operated in the test' rig. Various degrees of
success were 'achieved with each module. These results are outlined as follows:
Serial Results Rotor No. Number Prebalanced (max synchronous amplitude, peak to peak)
?
.064 mm reduced to .051 mm
1 U00257 yes 2.5 mils reduced to 2.0 mils
.051 mm reduced to .038 mm
2 268922 yes 2.0 mils reduced to 1.5 mils
.089 mm reduced to .038 mm
3 268975 yes 3.5 mils reduced to 1.5 mils
• 254 mm reduced to .114 mm
4 265503 no 10 mils reduced to 4.5 mils
• 254 mm reduced to . 114 mm
5 U00559 no 10 mils reduced to 4.5 mils*.
Sections 3.3.4 through 3.3.8 discuss the results of the balancing tests iI1
detail.
The marked influence of the test rig on the vibration signals (see Section
3.3.3) and variability in the vibration signals hindered efforts to combine
influence coefficient data from the balancing runs to determine combined influ
ence coefficients. Section 3.3.9 contains a detailed discussion of these
efforts.
*Seal failure in test rig and prior commitments of the high-speed balancing
facility to other NASA projects halted testing.
12

Extraneous effects from the test rig and drive system also hindered attempts to
define various times for balancing. However, some estimates have been made and
are presented in Section 3.3.10.
3.3.3 Drive System and Test Rig
The high speed drive system consists of a two speed (1800/3600 RPM) constant
,speed electric motor, eddy current (variable speed) clutch, step,":up gearbox
(1:5.5 increase) and associated couplings and spindles. The drive system is
fully described in Reference 2.
Although not used during these tests, the facility is capable of 900 Nm (8,000
lb-in) of torque. The drive shaft and couplings are, therefore, very much over
sized for use in the T55 application. The large masses of these components
proved to be a hindrance to effective high speed balancing of the dynamically
sensitive T55 power turbine.
The locations of spin up hardware instrumentation, used to measure vibration,
are shown in Figure 3.3.1. Sensors 7 thru 12 were used to measure vibration on
drive system components. Balance planes 4 and 5 were used to reduce unbalance
vibrations in these components.
The balancing tests were conducted in two phases. Rotor number 3 was run in the
first phase. Although the balancing effort for this rotor was successful a
number of rig related problems were encountered. Prior to beginning the second
phase of balancing tests, the rig hardware was revised to eliminate one spline
connection and simplify the drive system. However, problems in the test rig and
drive system continued to plague the balancing efforts. Al though in retrospect,
many of the phenomena witnessed during the tests can be attributed to the rig
and drive system, it was very difficult to extract true rotordynamic data from
the overall vibration signature while the actual tests were bei~g run. Although
much time and effort was expended deciphering the rather confusing data, it is
the intent of this report·to document only the results as they relate to the task
requirements.
13

Overheating i~ the drive system clutch limited operation to 10,000 RPM during
the second phase of the balancing test. It is suspected that insufficient cool
ing water to the clutch caused the clutch to overheat. Schedule restraints ·and
prior commitments of the test facility to other NASA projects·prohibited inves
tigation and correction of the heating problem. However, the results obtained
in the first phase of the balancing efforts demonstrated that effective high
speed balancing at the 7,500 RPM critical speed also reduced vibration at the
16,000 RPM operating speed. Therefore, the modules balanced at 7,500 RPM in the
second phase should be expected to perform acceptably at operating speeds as
well.
3.3.4 . Rotor No.1
Initial unbalance response plots for this power turbine (Serial Number U00257)
are shown in Figures 3.3.2 and 3.3.3 for vertical probes at both ends of the
turbine module.
Initial trial weight runs indicated that unbalance at the drive coupling was
very high, especially in the horizontal direction. Further investigations
concluded that unbalance in the coupling caused the entire turbine module to
respond. Effective correction weights were applied to the drive coupling.
Trial weights were next· installed on the spline end of the output shaft to check
for any influence of unbalance at this location on a possible spline shift or
other turbine rotor behavior. No appreciable changes were detected. It should
be noted however, that because of the large mass of the output shaft (rig hard
ware) or the transmission shaft (engine hardware), any eccentricity or
wear-related unbalance can significantly affect vibration of the power turbine.
Analysis of test data gathered to this point showed that the vibration data from
the horizontal probes indicated a large amount of variability and·unexpected
vibration signatures. These phenomena were perhaps due to non-uniform rig·
stiffness in the horizontal direction or possibly a probe bracket resonance,
although these possibilities have not been analyzed in detail. It was concluded
that balancing efforts would be conducted using vibration data from vertically
mounted sensors only.
14

Attention was next directed towards the original goal of balancing the power
turbine. A correction weight (calculated from data at 7500 and 8500 RPM) of
21.6 gm-cm at plane 3 and 20.1 gm-cm at plane 1 resulted in the residual response
shown·in Figures 3.3.4 and 3.3.5.
3.3.5 Rotor No.2
This power turbine rotor module (Serial Number 268922) showed initial response
as indicated in Figure 3.3.6. Note that these curves relate displacement sensor
data that have been compensated for run-out. Thus they represent only net, or
truly dynaillic rotor vibration. Runout compensation was required for these plots
due to the larger than normal runouts measured along the rotor. A correction
weight (calculated at 8700 RPM) of 13.0 gm-cm at plane 3 resulted in the resi
dual response shown in Figure 3.3.7.
3.3.6 Rotor No.3
Curve "A" on Figures 3.3.8 and 3.3.9 show the as-received balance condition of
this rotor (Serial Number 268975). This rotor was operated prior to the clutch
damage that limited operation to 10,000 RPM. High speed balancing at 7800 RPM
resulted in the unbalance response shown by curve "B" on these figures. It
should be noted that unbalance response at the operating speed was sigificantly
reduced by balancing at a lower speed, near the rotor's critical speed.
3.3.7 Rotor No.4
This power turbine module (Serial Number 265503) was the first module tested
that had not been previously low speed balanced. The initial spin-up of this
rotor showed substantial vibration which increased with speed. The rotor could
not be run above 9000 RPM without excessive vibration levels. Figure 3.3.10
shows the as-received vibration response. Although the same trend in vibration
was detected in successive accels, the amplitudes and phase angles of vibration
were not considered to be repeatable enough to assure accurate balancing.
Initial trial and correction weights confirmed that rotor nonrepeatability
limited the use of routine methods of data gathering and weight calculation:
15
Engineering judgement was used in scaling and applying calculated correction
weights. It soon" became apparent that this rotor would require larger
correction weights than had been used on the modules that had been previously
low speed balanced. Installing a large trial weight resulted in the calculation
of an effective 99 gm-cm correction at plane 3. Applying this correction
resulted in a dramatic improvement and permitted a speed increase to 10,000 RPM.
Rotor nonrepeatability continued to prevent strict adherence to a routine
balancing procedure. A combination of calculated influence coefficients, engi
neering judgement and analysis of on-the-spot test data resulted in weight addi
tions of 94 gm-cm at" plane 1 and an additional 12.7 gm-cm at plane 3. The
results of these balancing efforts are presented in Figure 3.3.11.
It was concluded that this rotor was balanced to an acceptable degree, especial
ly given the large amount of initial unbalance. The cause of the nonrepeatable
nature of this rotor response was not investigated but may have been attribut
able to excessive wear, shifting components in the turbine or drive train, or
perhaps as yet undetected damage to the labyrinth vacuum seal at the sp1ined end
of the power shaft (see discussion in next section).
3.3.8 Rotor No.5
This power turbine module (Serial Number U00559) was the second module tested
which had not been previously low speed balanced. Initial spin up of this rotor
showed high vibrations which limited speed to 7800 RPM. Figure 3.3.12 shows
as-received vibration plots for this rotor.
This rotor also showed a degree of nonrepeatability. As a result, a combination
of computer calculations, engineering judgement and data analysis resulted in
installing correction weight of 43.2 gm-cm at plane 1 and 25.4 gm-cm at plane 3.
Unbalance vibration was significantly reduced, permitting operation through the
critical speed to 9,000 RPM. Figure 3.3.13 shows the" results of this balance.
Data was being gathered for a trim balance when overcurrent in the test facility
drive motor aborted the test. Initial investigations disclosed both magnetic
and non magnetic metal filings in the test rig lubricant. Teardown of the rig
16

revealed a damaged rig labyrinth vacuum seal at the splined end of the power
shaft. It was concluded' that contact between the seal and runner probably
caused thermal expansion and further rubbing of the seal. The increased fric
tion destroyed the seal and caused the overload to the drive motor.
Prior scheduling of the test facility for other NASA projects precluded any
attempts to repair the test rig. The power turbine was removed from the test rig
and the test fixture was disassembled.
In later balancing runs using the high speed balancing facility developed under
NASA contract NAS3-20609, this rotor was balanced to 16,000 RPM and was then
successfully run in an engine at CCAD. Consistent data was acquired with no
repeatability problems. This information supports the liklihood that the prob
lems at this phase of the program were related to the balancing test fixture.
3.3.9 Consolidation of Influence Coefficients
Because of the wide variability in response characteristics, rotor nonrepeati
bility and the necessity to depart from routine balancing procedures, a compre
hensive set of influence coefficients could not be obtained for all five rotor
modules.
Since most of the balancing efforts occurred at two distinct speed ranges (7000
and 9000 RPM), the influence coefficient data has been grouped accordingly.
Figure 3.3.14 shows the spread of the consolidated influence coefficient data
and the mean and standard deviation of each data .set.
Because of the limitations outlined above, extrapolating these influence coef
ficients to T55 power turbine modules in general is' not recommended. The small
data sample further limits. their meaningfulnes. As a result, it can be
concluded that, although influence coefficient balancing was effective in
reducing unbalance vibration, establishing a comprehensive set of influence·
coefficients requires a larger data sample drawn from rotor modules with similar
dynamic performance. This was demonstrated under NASA contract NAS3-20609 in
which a comprehensive set of influence coefficients were developed which were
17

effective in balancing T55 power turbines without the need for trial weight
runs.
3.3.10 Documentation of Balancing Times
Many of the problems discussed in previous sections of this report also
prevented the formulation of accurate estimates of times for various stages of
balancing.
It was initially envisioned that estimates of balancing times would be estab
lished in the following categories:
• Rotor Installation - after basic rig set-up and debug
• Trial Weight Data Gathering - including "as is" and all trial weight rtmS
• Correction Weight Calculation & Installation
• Check Run
• Rotor Removal
However, during the actual balancing effort, the drive system and test rig anom
alies, rotor variabilities and nonrepeatabilities and other phenomena as
described in this report affected the balancing times in each of the above cate
gories.
Rotor Installation 'and Removal times were almost entirely contingent upon the
"ease of access" of the balancing fixture. The present test rig is very cumber
some and was not designed for quick change-out of power turbine modules. Align
ment checks and vacuum sealing also compounded the complexity of rotor
installation and removal. Estimates of installation times varied from 20 to 60
manhours per rotor while removal times ranged from 2 to 20 manhours per rotor.
Times estimates for trial weight data gathering were very difficult to extract
from the considerable amounts of time spent in resolving the extraneous
vibration and equipment-related difficulties. Although total manhours expended
in this phase of testing range from 60-120 manhours per rotor, actual time spent
gathering useful trial weight data is estimated to have been less than 5 percent
of this amount, or 3-6 manhours per rotor.
18

Correction weight calculation and installation typically constituted the small
est amount of balancing time. Computer-assisted calculations only require
several seconds. Installation of correction weights took somewhat more time,
but· was facilitiated by use of the special balance collars attached to the power
shaft. The largest time segment involved the engineering judgement and
on-the-spot data analysis used to place weights for the nonrepeatable rotors
discussed in sections 3.3.7 and 3.3.8. Estimates of manhours expended in calcu
lating and installing correction weights ranges from 2-8 manhours per rotor.
True check runs of the balanced rotors involved only a small amount of' time.
However, because more than. one balance was required for each rotor, ma.ny of the
check runs actually became trial weight or "as is" runs for additional balancing
efforts. These runs amounted to approximately 4-20 manhours per rotor, with
true check runs amounting to less than 1 manhour per rotor.
Extrapolating these estimates of balancing time to T55 power turbines in general
is not recommended. Access to the test rig, rig and drive train vibration and
other extraneous influences have caused the demonstration balancing tests to
consume much more labor than would be expected under more production-oriented
balancing conditions. For example, using the prototype balance rig developed
for balancing T55 and T53 power turbines under NASA contract NAS3-20609 a typi
cal installation time for T55 power turbine was only 20 minutes and removal time
only 15 minutes. Similar reductions were also seen in balancing times.
3.4 TASK 4: REVISION & CORRELATION OF THE ANALYTICAL MODEL
3.4.1 Background
The objective of task 4 was to tune the mathematical model used for the rotordy
namic analysis due to the dissimilarity between observed test rig behavior and
orig~na1 rotordynamic analysis. This was accomplished by adding the effect of
engine static structure and bearing support flexibility to the existing power
turbine model and revising the bearing and spline stiffness based on observation
made during the experimental work of task 3.
These topics were addressed by creating four mathematical models:
19

ROTOR #1 - Engine Casing Model
ROTOR #2 - Engine Rotor Model
ROTOR #3 Balancing Rig Model, previous
ROTOR 114 Balancing Rig Model, current
Detailed drawings were made for the four rotor systems identifying rotor mechan·
ica1 and dynamic properties at each modeling station. (see Figures 3.4.1 -
3.4.3).
The entire engine static structure is represented in Figure 3.4.1. The gas
producer rotor is included in the static structure mass since the objective was
to analyze power turbine behavior.
The previous version of the test rig is shown irt Figure 3.4.2. The drive train
(not shown) provides torque to a coupler, a spindle s~pported on bearings 1 and
2, the aircraft transmission shaft on bearings 3 and 4, and the engine power
turbine rotor on bearings 4 and 5. Modeling stations for the balancing rig are
denoted by circles. Triangles indicate positions where the geometric model is
indentical to locations within the engine.
The current version of the test rig is shown in Figure 3.4.3. Positions to the
left of station 21 and right of station 47 (these stations are denoted by
circles) are the same as the early test rig (Figure 3.4.2). Positions 21 thru 46
(denoted by hexagons) reflect changes made to the early test rig for current
tests.
Materials typically used in turbine engines were assumed where actual types were
not known. Support stiffnesses and damping were based on previous experience.
All other values were calculated. Splined joints were modeled either as a rigid
connection or as a hinge having no lateral moment generating capability.
3.4.2 MTI Rig Analysis
The previous rig rotordynamics analysis is presented in Table 3.4.1. The first
lateral critical speed is a disk end, conical mode of the power turbine at 9500
20

RPM. The second lateral critical speed is a bending of the shaft at 23000 RPM.
Spline flexibility"has only a small effect on critical speeds of the rotor. A
critical response of the drive spindle appears at 20400 RPM for a "rigid" spline
and at 18700 RPM for a "hinged" spline. There is no cross talk between rig and
drivetrain. Therefore, any beginning traces of the rig critical at the 16000
RPM maximum rotor speed should not affect turbine vibration.
The current rig rotordynamics analysis is also presented in Table 3.4.1. Chang
es in the hardware included elimination of the spline joint in plane A as well as
the inclusion of a coupler for parallel and angular misalignment. The analysis
predicted that critical speeds should be essentially the same as the previous
rig.
A comparison of the mode shapes for previous and current rig models also indi
cated similarities in rotordynamic behavior. Figures 3.4.4 through 3.4.9 show
the mode shapes for the hinged spline case. It is important to note that there
is no cross-mode influence between the rig mode and the rotor modes.
The critical speed map in Figure 3.4.10 shows the calculated sensitivity of the
turbine mode critical speed as a function of bearing stiffness._ The rig crit
ical speed is relatively insensitive to change in support stiffness at the power
turbine.
3.4.3 Engine Analysis
The T55 engine was analyzed using a two level model to determine relative motion
between the engine case (static structure) and the power turbine rotor, as well
as case/inertial ground motion. Figure 3.4.11 is a schematic representation of
rotor interconnection modeling details. Since the objective of this task was to
gain insight into power turbine behavior only, the gas producer rotor mass was
included in the static structure mass.
The engine rotordynamics analysis is presented in Table 3.4.2 for an assumption
of no hinges (locked spline joint). The casing and turbine are considered sepa
rately in order to identify which rotor is responsible for total engine
vibration. The engine is predicted to have casing related vibration response at
21

about 900 RPM, 4500 RPM, and 8800 RPM. Vibration at about 11000 RPM is due to
the turbin.e disk conical mode. Vibration at the 16000 RPM service speed is
caused by proximity to the 23000 RPM rotor flexible critica1 speed.
The mode shape analYsis.for each critical speed provides further insight. The
905 RPM casing response (Figure 3.4.12) indicates a rigid casing driven by the
turbine disks. The 4461 RPM casing response (Figure 3.4.13) shows casing bending
driven by the disks. The 8804 RPM casing response (Figure 3.4.14) reveals
forward casing motion driven by the forward end of the turbine. The cause for
the discontinuity at the transmission shaft is unknown but is believed to be
caused by an anomaly in the modeling technique. The 11007 RPM engine vibration
(Figure 3.4.15) is caused by the power turbine disk mode. The 22087 RPM engine
vibration (Figure 3.4.16) is above the service speed of the engine. The casing
shows no response to rotor bending at this speed. Although this calculated
critical speed is well. above the rotor's 16,000 RPM service speed, it is impor
tant to note that some amount of rotor bending is detected within the rotor
operating speed range.
3.4.4 Correlation of Experiment with Analysis
The previous analysis was conducted with the belief that the rigorous identifi
cation of mechanical parameters would result in the prediction of observed
behavior, i.e., bimodal turbine response below 10000 RPM. When the result of
the analysis showed only the single turbine "bounce"mode another explanation was
sought. The shaft orbits (Figure 3.4.17) showed a mode shape with motion at
both the forward (spline) and aft (disk) end at about 9000 RPM, although the
analyses predicted only disk end whirl. The mode near 8000 RPM was not
predicted at all. Also note that the orbits were strongly elliptical. The
analysis predicted only circular orbits as symmetric bearings were assumed.
Several possibilities for lack of experimental/analytical correlation were
evaluated. Bearing/support stiffness was strongly implicated because of the
spline end motion as well as orbit ellipticity. A simplified "desk-top" analy
sis was used to estimate the support stiffness required to produce forward
turbine whirl. Observed amplitudes and speeds were used as input. The
"desk-top" solution for support stiffness was input to the rotordynamic model
22

for the Current MTI Rig and the resulting mode shapes determined. For a forward
support stiffness of 1,925,000 N/M (11000 lb/in) and an aft support stiffness
29,750,000 N/M of (170000 lb/in) the model did predict spline end motion at 7879
RPM and 8712 RPM with some motion at the turbine (Figure 3.4.18).
Even closer agreement of test and analytical data was achieved when assymetric
support stiffnesses were used in the model. The forward bearing was selected at
1,400,000 N/M (8000 lb/in) and 1,925,000 N/M (11000 lb/in) with 1,137.5 N sec/m
(6.5 lb sec/in) damping. The aft bearing was selected at 21,000,000 and
35,000,000 N/M (120000 and 200000 lb/in) with 17.5 N secim (0.1 sec/in) damping.
The'mode shape was cylindrical at 9280 RPM with 70° phase difference from one
end of the rotor to the other. The mode shape at 9305 RPM had' the turbine end
amplitude twice that of the spline end and 100° phase difference end-to-end.
The actual data from the rig in Figures 3.4.19 & 3.4.20 indicates an excellent
comparison with the analysis, but the existence of such a soft support did not
seem possible. The rig was instrumented to determine static case deflection
when known amounts of force were applied. The result was essentially uniform
stiffness in excess of 87,500,000 N/M (500,000 lb/in) for both forward and aft
casing. The forward measurement included structure up to the bearing housing.
Although not examined in detail, any of a nu~ber,of phenomena could result in
the large difference in support stiffness between the amount indicated by static
measurement and the amount needed to result in agreement with test data. One
possiblility is the presence of localized resonances in the test-rig which react
with the driving force 'to create a "dynamic" stiffness that' is significantly
lower than the measured "static" stiffness. Oth~r phenomena capable of gene rat
ing the observed bimodal behavior include the following:
• Spline shift (However, there is no abrupt increase in amplitude at the
forward end.
• Clearance in the forward bearing. (Unlikely because the clearance was
measured at .076 mm (3 mils)'and peak-to-peak rotor deflections exceeded
.127 mm (5 mils) peak-to-peak for a balanced condition)
23
• Coupler and transmission shaft weight exceeded 15.9 kg (35 1bs). (Howev
er, vibration never exceeded .051 mm (2 mil) peak-to-peak and reached a
maximum consistently at 8850 RPM, while the unexplained vibration was
always below 8000 RPM).
These and other possibile causes of the difference between statically measured
and analytical/test data were not further explored because of funding limita
tions.
3.5 TASK: 5 EFFECTIVENESS OF THIRD TURBINE STAGE BALANCING CORRECTIONS
The objective of this task was twofold. The first objective was to analytically
evaluate the T55 rotor sensitivity to fourth turbine stage unbalance and deter
mine if this unbalance can be effectively corrected at the third turbine stage.
The second objective was to analytically subject the power turbine rotor to a '. random unbalance and optimize the balancing method to effectively reduce rotor
amplitudes throughout the speed range. At its 16000 RPM design speed, the rotor
exhibits a significant
balancing at low speed.
degree of bending that cannot be compensated for by
High speed mu1tip1ane balancing is capable of reducing
these vibrations to an acceptable level.
3.5.1 Fourth Turbine Stage Sensitivity
Tables 3.5.1-3.5.3 present a summary of the rotor response analysis concerning
fourth turbine stage unbalance and the effects of third turbine stage
corrections on power turbine vibration levels. Table 3.5.1 shows power turbine
amplitudes at various stations along the shaft for a 71.8 (1 in oz.) unbalance
at the 4th stage and for a 3rd stage correction. At the 11500 RPM first
critical, which is a rigid rotor mode, the introduction of the couple substan
tially reduced the peak amplitude. However, at the 16000 RP~1 design speed the
rotor is no longer rigid, and the couple resulted in drastically increased
vibration levels.
24

3.5.2 Randomly Distributed Unbalance
The second phase of the analysis concerned a random distribution of unbalance
along the ·rotor. The unbalance was modeled using random numbers representing
both magnitude and phase angle. The range of values chosen was 0 - 10 grams at 0
- ·360° phase at each of" the 50 stations. The resulting net rotor unbalance was
99gm em (1.38 in. oz). at -83.2°.
A two plane low speed balance was evaluated by calculating static correction
weights at the third turbine stage and one of three arbitrarily chosen balance
planes on the output shaft (stations 29, 33, 36). This was accomplished by
solving a force and moment equation simultaneouly to give correction weights
~ which were then included in the model for rotor response runs. Table 3.4 summa
rizes the results at 11500 RPM and at 16000 RPM for the static correction
weights. The balance plane furthest away from the third stage turbine (station
29) was the only one that showed any reduction in amplitude at 16000 RPM. For
the other two cases correction weights resulted in increased vibration at the
16000 RPM design speed due to the flexible nature of the shaft.
The final balancing technique.evaluated was a two speed influence coefficient
balance. For computational ease, four balance planes were initially chosen
since this resulted in a square matrix. These were then combined to simulate a
two plane balance for the rotor response. The two balance planes coincided with
the existing balance plane on the output shaft and the third stage turbine. The
probe locations for data acquisition were chosen at stations showing peak ampli
tudes at each of the balancing speeds.
The input for the influence coefficient program was obtained from a series of
rotor response runs that sequentially placed one inch ounce unbalance as a trial
weight at each of the balancing planes. The amplitude and phase at each probe
location for 11500 and 16000 RPM were input to the influence coefficient
program. Table 3.5 presents the results for this balancing method.
Figure 3.5.1 shows the mode shapes at the 11500 RPM first critical speed and at
the 16000 RPM design speed for the random unbalance. Also shown on this figure
is the reSUlting amplitudes after the addition of correction weights at the
25

existing balance planes on the output shaft and the third stage turbine for
static correction· weights and for the influence coefficient balancing
technique. The influence coefficient balance effectively reduced the peak
amplitudes at both speeds. The results of this analysis indicate that the pres
ently established balance planes are sufficient to reduce unbalance vibration.
3.6 TASK 6: VERIFICATION OF POWER TURBINE BALANCE QUALITY
The objective of task 6 was to evaluate the quality of the high speed balancing
by running two of the. rotors balanced in task 3 in engines at Corpus Christi Army
Depot (CCAD).
With the concurrence of the NASA program manager, the high speed baiancing of
two power turbine rotors for operation in an engine was conducted utilizing
facilities developed under NASA contract NAS3-20609. Rotor SN268922 (prebal
anced at low speed) was high speed balanced using precision balance collar on
the shaft foward end and by attaching safety wires to third stage turbine
blades. The initial top speed of 14000 RPM allowed balancing data to be gath
ered at 8265, 12000, and 14000 RPM. The balance weights were installed
permitting operation to 16000 RPM where additional balance data was acquired for
trim balancing which further reduced the vibration response Figure 3.6.1 shows
the final balance condition for this rotor.
Rotor SNU00559 (not preba1anced at low speed) was installed and run to the 16000
RPM service speed. Trim balancing data was gathered at 8265, 15000, and 16000
RPM. The balance condition after the trim balancing is shown in Figure 3.6.2.
Permanent correction weights were ground into both rotors and the trial weight
balance collars removed. This completed the preparation of these two rotors for
engine testing at CCAD.
The first of the two power turbines was successfully run in an engine during a
visit to CCAD by MTI personnel. The engine had been run in the test cell earlier
in the week and then the power turbine was replaced with one incorporating high
speed balancing (SNU00559). This power turbine was not low speed balanced. The
engine test showed a decrease in overall vibration as measured by the case
26

mounted sensors after the turbine changeout (see Figure 3.6.3) and was consid
ered by the operators to be extremely smooth running engine.
Figure 3.6.4 represents a vibration spectrum plot taken from the engine test
with the high speed balanced power turbine operating at 15600 RPM (97.5%). It
is clear from this plot that the contribution of the compressor rotor (Nl) now
dominates the overall engine vibration. Any further reduction in the vibration
levels measured by test cell instrumentation (which measure overall vibration)
would require improving the balance on the compressor rotor to a level compara
ble with the high speed balanced power turbine. It is important to note that the
high speed balanced turbine now contributes very little to the engines vibration
signature.
The reduction in overall engine vibration achieved by the installation of the
high speed balanced power turbine (SNU00559) clearly shows the ability of high
speed balancing to improve operation at design speed. The engine vibration
levels were significantly reduced from a level already below the vibration
criteria prior to turbine changeout.
MTI personnel were not present at CCAD for the testing of the second power
turbine in the test cell due to scheduling delays at CCAD. CCAD personnel indi
cated a suspected faulty waterbrake caused high vibration during the test. Test
data forwarded to MTI supports this conclusion. Table 3.6. presents the test
data for this run as recorded by standard test cell instrumentation. The high
vibration is predominantly on the V3 sensor which in on the waterbrake. Unfor
tunately the test was not rerun with a repaired or alternate waterbrake.
3.7 TASK 7: EXPERIMENTAL STUDY OF SPLINE DYNAMICS
3.7.1 Introduction
Previous studies of rotor vibration response have identified spline joints as a
potential source of excessive vibration. Balancing experiments in previous
tasks of this contract showed a significant change in vibration response as a
function of engagement position of the power shaft spline to the transmission
shaft spline. Test cell operation of an AVCO Lycoming T53 under NASA Contract
27

NAS3-20609 showed a large increase in engine vibration as a result bf dynamic
spline offset. During test cell qualification of engines, it is common practice
to re-index spline joints in an effort to reduce vibration. This information
formed the basis of the work accomplished under this task.
The primary objective of this task was to experimentally study the dynamic envi
ronment of the power shaft-transmission shaft spline on the AVCO Lycoming T55
engine. Spline fits for the units tested were documented and correlation made
between spline fit, observed dynamic response and balance achieved.
The existing NASA owned Drive rrain Test Facility at MTI was used for the exper
imental tests. The balancing rig used for previous tasks was modified to permit
detailed monitoring of shaft motion across the spline joint.
Vibration response tests were conducted for two power turbine modules. Shaft
amplitudes and phase angle were monitored for a number of spline indexes.
3.7.2 Test Set-Up
The test facility used for the vibration test was constructed at MTI under NASA
Contract NAS3-16824 (Ref 2). Designed to accomodate rotors up to 20 feet long
to speeds of 20,000 RPM, the system is well suited for the spline study.
The test rig used for the vibration tests had been designed and constructed
under previous tasks of this contract. The. facility was set up as shown in
Figure 3.7.1. The vacuum enclosure incorporated engine hardware to provide
bearing support and also provided low ambient pressure for reduced windage loss
es. Eight non-contacting displacement probes permitted observation of orbits in
three turbine planes and one drive shaft plane. Probes 5 and 7 were oriented in
a vertical plane and were located to span the spline joint. Thermocouples were
used to insure a proper temperature environment for the probes. An optical
tachometer sensed the rotational speed of the high speed spindle for phase
determination. A synchronous tracking filter and phase meter were connected to
probe outputs for real time display of shaft vibration. A special design drive
shaft minimized drive line elements and permitted the use of a lightweight 339
gm (12 oz) coupler. The coupler could be easily removed, thus permitting spline
28
indexing without altering alignment of the rotating system. Spline clearance
measurements were made in place with the rig in an operable condition.
3.7.3 Testing Procedures
Because of its importance in measuring any effects of spline dynamics, the test
procedure for the vibration test emphasized gathering of repeatable data. A
vacuum of 71 cm (28") Hg was supplied by a continously running vacuum pump. A
warm-up run and starting temperature of 49°C (120° F) were established.
Constant drive torque was applied by setting the speed controls for top speed
and allowing the drive system to accelerate at its own rate (about 90 rpm/sec).
If top speed was not a.chieved when probe temperatures reached 149°C (300 0 r) , the
run was terminated. Synchronous vibration amplitude response was generated
during the acceleration and was used to verify playback of information recorded
on magnetic tape. Drive shaft indexing included positions of 0°, 90°, 180°,
270°, and 0°. The index was made by backing off the light weight coupler allow
ing indexing of the spline without requiring any motion of the drive system or
power turbine and therefor not affecting shaft alignment.
Spline clearance measurements were made by moving the transmission shaft back
and forth and noting the change in position with a dial indicator. Motion was
checked for several positions.
Spline fit measurements were based on over-the-pi~s measurements of the internal
and external splines. Two precision diameter pins were placed 180° apart
between spline teeth. A micrometer was used to check the dimension over the two
pins.
3.7.4 Data Analysis
Data recorded on magnetic tape was used to compile vibration response informa
tion. Synchronous vibration amplitude and phase for each of the eight probes
was plotted. Plots from each index position were overlayed to determine differ
ences irt response. The repeat data at the 0° index position was compared with
the four overlays to assess data repeatability.
29

Spline fit data was generated from over-the-pins measurements of the splines.
The external spline measurements (transmission shaft) were displaye~ in sche
matic form as the runout of a pitch circle. The internal spline data (power
shaft) was subtracted from journal measurements and a similar pitch circle 'sche
matic created. By overlaying the internal and external.pitch circle schematic,
the point of closest approach of the pitch circles was identified. The external
spline schematic was placed so that closest approach points were equally spaced.
This is shown in figs. 3.7.2 and 3.7.3 for four index positions. The centerline
seperation (parallel misalignment) of. the two splines was noted. It was
expected that a larger misalignment would impose a larger unbalance force on the
turbine shaft giving a larger at speed vibration.
Actual spline clearance data was noted after the rotating hardware was installed
in the test rig. With the spline shafts in a ready-to-run condition, the drive
shaft was' moved laterally and the displacement recorded. This was repeated for
each index condition.
3.7.5 Results
As expected, power turbine vibration response magnitude and phase did vary as a
function of spline engagement position (see Figures 3.7.4 to 3.7.9). No dynamic
offset or shift in the spline joint was observed and the spline did not show any
signs of instability. The high and low vibration test results, however, did not
agree well with predictions based on the measured spline data. For turbine SN
265503 the spline vertical probes vibration was generally highest at 270° and
lowest at 0°. This data is shown in Figures 3.7.4 & 3.7.5*. Using the pitch
circle techniques outlined above, essentially equal vibration was predicted at
90°. 180Q, 270° with somewhat lower vibration at 0° (see Figure 3.7.2). For
turbine SN U00257 the power shaft vibration was generally higher at 0° and lower
at 180° (see Figures 3.7.7 & 3.7.8). Pitch circle measurements predicted high
vibration for the 270° position and uniformly lower vibration at 0°, 90°, and
180° (see Figure 3.7.9). The probable cause for this lack of correlation is
*The vertical probes were considered to be most representative because the hori
zontal probes direction has historically acted as if it were softly sprung.
30
nonrepeatability. The change in response from one run to the next with no
change in spline index were in some cases as large as the change in response
observed after indexing the spline.
Table 3.7.1 presents the spline clearance measurements made after each index.
Comparing those measurements with vibration data did not result in a direct
correlation between available clearance and vibration response. It should be
noted, however, that the variation in spline clearance was typically .05 mm
(.002 in) or less. Measurement error, along with the inconsistent repeatability
between 0° check runs, may have combined to obscure whatever changes may have
been related to the change in spline clearance.
The vibration response for the two modules tested was compared to their response
when previously run in the Task 3 balancing demonstration .. As Figure 3.7.10
shows, the response of SN U00257 is very comparable, while SN 265503 showed some
change in response. Possible reasons for the differences in SN 265503 include:
• Intentional change in unbalance - After the Task III balancing.demon
stration, both rotors were trim balanced in the High Speed Balance Facil
ity developed under NASA Contract NAS3-20609. This balance was necessary
because during Task III the test facility top speed was limited to 10,000
rpm even though balancing was required through 16,000 rpm.
• Degradation in rotor mechanical condition - In the interim between Task
III test and the current spline evaluation, it is possible that a turbine
disk has become loose or some inadvertent damage has occured. Similar
response peaks were detected on this module when it was operated in the
high speed balance facility under NAS3-20609. A loose disk or damage
bearing are possible causes for the non-repeatable vibration observed
for this rotor. No disassembly checks or other inspections were made to
determine the cause of this change in vibration.
• Differences in the demonstration rig between tests - Changes to the
mechanical configuration of the rig were made between Task III and the
current work in order to make spline indexes without disrupting
31

alignment. A lighter drive shaft, lighter coupler, and new alignment
were the most significant changes.
32

4.0 CONCLUSIONS
The evaluation of the rotordynamic analysis of the two rotor system in the
T55-L11C concluded that the multiplane-multispeed balancing procedure could be
effectively applied to the power turbine rotor. The mode shape at the 16,000
RPM service speed has the shape of the second system critical and exhibits
significant bending of the rotor.
Experimental evaluation of a precision collar intended for temporary trial
weight placement on slender or thin-walled shafts during balancing operation has
proven the concept practical and convenient to apply.
Five T55 power turbine modules were balanced using the multiplane - multispeed
technique in a specially designed test rig. Balance collars were installed to
permit trial and correction weights to be easily added to the rotor without
grinding. An existing multiplane-multispeed balancing system was used to calcu
late balance weights. It is concluded that multiplane-multispeed balancing
techniques are effective in reducing unbalance caused vibration in T55 power
turbine modules.
The effect of engine static structure and bearing support flexibility were
included in an engine analytical model. The power turbine rigid critical speed
causes engine vibration at 11,000 RPM. The power turbine bending critical speed
at 23,000 RPM is beyond the 16,000 RPM service speed. Vibration at 900 RPM,
4,500 RPM, and 8,800 RPM, is peculiar to the engine because of casing resonant
response.
The effect of the test rig static structure was included in a revised rig
analytical model. The power turbine rigid critical speed mode shape at 9,500
rpm compares well with the engine critical speed at 11,000 rpm. The rotor bend
ing critical speed at 22,000 rpm compares well with the engine critical speed at
23,000 rpm.
At the 16,000 rpm service speed, the T55 power turbine rotor exhibits a signif
icant degree of bending. For this reason a single plane correction in the third
turbine stage to compensate for fourth turbine stage unbalance is ineffective at
33

design speed. Similarly, two plane low speed balance results in either a minor
decrease in vibration. or a significant increase in vibration at 16,000 RPM
depending on the location of. the balance planes. The multiplane-multispeed
influence coefficient balancing technique effictively reduces the peak ampli
tudes at both the 11,500 RPM critical speed and the 16,000 RPM design speed.
The effectiveness of the multispeed-multiplane balancing procedure was
confirmed when a high speed balanced power turbine rotor was run in an engine at
the Corpus Christi Army Depot. The engine showed a significant decrease in
overall vibration levels when its power turbine was replaced with one that was
high speed balanced. A frequency spectrum plot of the overall vibration for the
run with the high speed balanced power turbine installed showed conclusively
that the contribution from the compressor rotor dominated the overall vibration
level. To improve vibration levels futher it would be neccessary to balance the
compressor rotor to a level comparable with the high speed balanced power
turbine rotor.
The spline dynamics study concluded that the power shaft-transmission shaft
spline connection showed no signs of instability, nor was there a tendency for a
dynamic offset or shift to occur in the spline joint.
4.1 General Conclusions
The following conclusions are more of a generic nature and are applicable to
oth~r turbine engines as well as other rotating equipment that operates near a
bending critical speed.
• Low speed balancing techniques become decreasingly effective as the
transition from rigid rotor to flexible rotor is made. In the flexible
regime low speed balancing can adversely effect the vibration levels at
operating speed.
• It is essential to run the rotor to be high speed balanced in the test
fixture before final formulation of the balance plan in order to optimize
the balance speeds used based on actual response.
34

5.0 RECOMMENDATIONS
Additional analysis of engine vibration as measured in the overhaul faciltiy
test cells is needed for the T55 and other engines. Presently only overall
vibration is measured which gives CCAD personnel little information on which to
base corrective measures on. In addition, better understanding of the vibration
measurements would enable CCAD engineers to detect any weakness in the balancing
procedures used during overhaul that might be resulting in rejected engines.
High speed balancing needs to be introduced into the overhaul cycle due to the
continuing development of more flexible shaft engines. On the T55, an engine
developed more than 25 years ago, improvements can be achieved with high speed
balancing but the technique is not essential fo acceptable engines. If current
design trends continue toward more horsepower with lighter engines high speed
balancing will become a required procedure for the overhaul centers to produce
smooth running engines.
35

REFERENCES
1. Cundiff,. R.D.; Badgley, R.H; and Reddecliff, J. "Pneumomechanical
Critical Speed Control for Gas Turbine Engine Shafts", Air Force Aero
Propulsion Laboratory, Technical Report AFAPL-TR-73-101, November
1973.
2. Dai:low, M., and Smalley, A.; "Design and Application of a Test Rig for
Super Critical Power Transmission Shafts", NASA Contractor Report
3155,.1979 ..
36
:E 'a.. a: I
c w 104
,w . a.. en t-
o u... ~ o~
en
----l----£== THIRD CRITICAL SPEED
~ ~ ~ ~ --------DESIGN SPEED~ ---
SECOND V l.--"'" ~ CRITICAL ---~ ~ .........-~ ./
k /
FIRST ./ CRITICAL-............ ./"
/ ~
V
4 8 Ixl07 2 4 INDIVIDUAL BEARING RADIAL STIFFNESS - N/m
FIG. 3.1.1 CRITICAL SPEED MAP - POWER TURBINE ROTOR OF TSS-L-11A ENGINE
po
,
82726
-I.e .000
j;,[l AT JIll,. .... ' I "J"l 11.0 , Brgs. No. "I and 2
- - - - - - -A_ - - - - - - -A " (K=200.000 lb/in total)
!o.ooo
,. ,. ,. A
.II A A .II A
10.000 .II Brg. No.3 (K=l.OOO~OOO lb/in)
1!o.OOo
20.000
zs.oOo
30.000
3S.0oo
.. 0.000
j;,OTUR L(N"tH CJ~I
- - - - - - - - - - - - -A- - - - - - - - - - - - -
J
A
JI JI A
I II
A
II
JI JI
a x
x
a
A .l
JI. A. A. JI.
A • a a • II •
I • A
. - - - - -.-- -A- - - - - - -.- -
J • I •
Brg. No.4 (K=1 00 ~ 000 lb/ in)
Brg. No.5 (K=100.000 lb/in)
FIG. 3.1.2 UNDAMPED MODE SHAPE AT FIRST CRITICAL SPEED FOR
T55-L-11A POWER TURBINE ROTOR ASSEMBLY
82715

5.000
~.O '1.0 • I - - - - - -.- . - - - - - - - - -
• 1 .x
1I It
.c
It I It
• II
Brgs. No. 1 and 2 (K=200,000 1b/in total)
10.000 It Brg. No. 3 (,K=1,000,000 lb/in)
15.000
ZO.OOG
Z5.000
JO.O(lO
J5.000
100.000
1o!>.OOO
POlOR L£Nr.T"
liNt
- - - - - - -.- - -A-.- - - - - - - - - - - - -
II .II 11 II II
-
11 )I
II
• I II
1 It
II 11
11 It II
l II
l 11
It 11
1 It
)I
11
II
II 11
It
l 1 •
•
•
• •
•
•
• ---------- ~ -.- - - - - - - - - - -- _ _ _ _ - - - - - - - A.- _ - - _ - - - - - -
.1
• 11 • • • II • •
I
WOTOR CWITICIL ~PEED. Zl089.~ RPM
Brg. No. 4 (K=lOO·,OOO Ib/ in) Brg. No. 5 (K=10Q,000 Ib/in)
FIG. 3.1.3 UNDAMPED MODE SHAPE AT SECOND CRITICAL SPEED FOR
TSS-L-11A POWER TURBINE ROTOR ASSEMBLY
82714

E E I
lJJ o ~
25.0
2.5
,~ .25 a.. :E <t llL. <t :::I: en ::E ~ ::E x <t :E .025
.002 5 o
__ -iiiii;IIt!CHANlCA&.
M •• ::':"O:~D
1
I
II
/ I
/ 7
Z J l ....... V'
/ j
r ) (,...,
II II
I i't , :r. /
/ ~ / ~
II ~
/ I'-'
10,000 20,000 SHAFT SPEED - RPM
FIG. 3.1.4 CALCULATED MAXIMUM ROTOR AMPLITUDES
FOR T55-L-11A POWER TURBINE ROTOR
. '
82725

E E
w 0 ::l t-:J a. :: <t t-LL. <t :I: en
1.00
0.75
0.50
0.25 I"-JBEARING5,
0
0.25
V \ "K3= 1.75 x lOB N/m -. -Ai • -:----.. IlA KI =K2= 1.75 x 10⁷ N/m """'-r-. K4 = KS = 1.75 x 10⁷ N/m I- .......... ,
........... ........
i'-.. .......
0.50 " ~ ~" 0.75
~ ~ ~
~
10 20 30 40 50 60 70 80 90 100 110 120 POWER ROTOR LENGTH - em
82724
FIG. 3.1.5 CALCULATED AMPLITUDES FOR T55-L-llA POWER TURBINE
ROTOR ASSEMBLY AT 12,070 RPM (FIRST CRITICAL SPEED)
='1.-: IRCHAHtCAI.
••• .. _00. IIIC000000TEO

·0.75 . I
0.50
~ 0.25 I' J3EARINGS\ / I
w 0 :::J t-::i a. ~ <t t-I.L. <t :c en
O
0.25
8 ".... '7 ""'~ K2= 1.75 X 10 N/m If } II J ~= K2= 1.75 x 10⁷ N/'t. ~=K5= 1.75 x 10⁷N/m' I
1\ / ~ L
0.50 1\ I '\ I ~ J
0.75 '~ /
/ " r..... V -
o 10 20 30 40 50 60 70 80 90 100 110 120 POWER ROTOR LENGTH - em
FIG. 3.1.6 CALCULATED AMPLITUDES FOR T55-L-11A POWER TURBINE
ROTOR ASSEMBLY AT 21,000 RPM (SECOND CRITICAL SPEED)
=-i:::- .. CHANlCAL
••• ncHNCK.OQY INCOfIIIIORATl:O
82723

I. AoIl
Ir a§1 a .125
I I I I I J I
SHAFT SPEED: 16,000 RPM
.100
.075
E .050 E I .025
w 0
~ 0
V ~ -~ V
v· " '" ~ V ~"
BEARINGS / j
"\~ I \ / 1/ \ V 8 , V. K3: 1.75 X 10 N/m " " ~ '--'"'" V • .~.. "
.....J ~ .025 f-K 1: K2: 1.75 X 10⁷ N/m K4 : K5 : 1.75 X 10⁷ N/m ~ <l: t- .050 l1.. <l: ~ .075
.100
.125
Q. 10
,
20 30 40 50 60 70 80· 90 POWER ROTOR LENGTH - em
FIG. 3.1.7 CALCULATED AMPLITUDES FOR T55-L-11A POWER TURBINE
ROTOR ASSEMBLY AT 16,000 RPM (OPERATING SPEED)
.-
I
1 I
100 110 120
82713

FIG. 3.2.1 PRECISION BALANCING COLLARS FOR ENGINE ROTOR SIMULATOR
MTI.,.16457
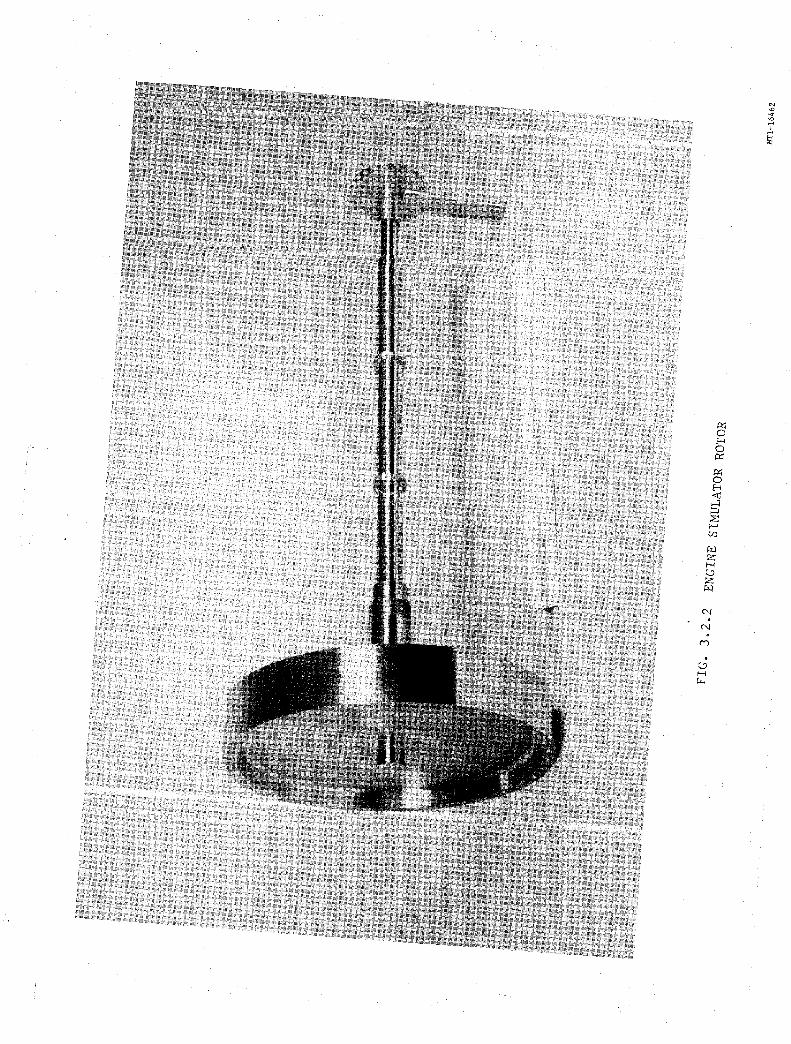

FIG. 3.2.3 CLOSE-UP VIEW OF BALANCING COLLARS MOUNTED ON TEST RIG SHAFT M:II-16458

..---REFERENCE SIGNAL SENSOR LOCATION
®
®
)
TRIAL WEIGHT COLLARS
BALANCING PLANE LOCATIONS
FIG. 3.2.4 PROBE AND BALANCING PLANE LOCATIONS ALONG TEST ROTOR
USED FOR PRECISION BALANCING COLLARS EVALUATION
82712

I. .125
in ~gn ;;I .. ~ a
A- NITIAL ROTOR AMPLI rUDE WITHO )T TRI ~L WElt: HT COLLAf S)
.100 n Reffift fAMrLi:' luf>r-YI "7'"
u In TRIAL ~EIGHT COLLA ~S
::IE IN PLAI E ::E
~ « w a.. .075
I g I ~ « w a.. ~
w c
.050 :::> t-
r -- In(R(1IC( IGIIAl 5(1ISOII l IaTaI
! PRO ~"PROOE 1101 STAT DIS I <D, a ~ ® I
) I!> .11
( J1
rot 81! IXl ql Il
~. ["RIAl " P
~] ~ ,),J. d
-1 a.. ::E
( l- t> ~A
AMAX BAlAM:1G 1'\." lOCATIOItS
« a:: 0 t-O .025 a:: 8 .
r- ~
~\ ..." lJ-A ~ .. ,.
~ ~ -lAo. J.. .-.....,
-- -O2 4 6 8 10 12 14 16 18 20
ROTOR SPEED (RPM i t01 22 24 26 28 30
82711
FIG. 3.2.5 ROTOR AMPLITUDES AT STATION 4 - WITH AND WITHOUT COLLARS ON SHAFT

I. .l25 Iii ~§r:
0
.100
-::E ::E
~ « w .075 0..
I
g I ~ « w 0..
W 0
.050 ~ :J 0.. :E « a:: 0
b .025 a::
~ O2
\
\ I I - I t:
I'
A- ~NBALt NCED I OTOR MPLIT DE
B- ~OTOR AMPLI' UDE Af TER 0 E 3AlAN( ING Rl N WIn- TRIAL NEIGH"' COLLI RS IN I LACE
C- ~OTOR ~MPlIT ~DE AF ER ON BALAN( ING RU ~ WITH TRIAL ",EIGHT COLLA ~S REM OVED ~FTER BALAN ING
t--.. r( .. 1ICl SIGIUl S(IISCIII OCAllCII
'.: III"'" CIII SlAlOlS
(j), ( @ ® , <D ~ t C1l{r ~
I '\00 I[ IdI " ~
~ \-p.
~1 . [
~.:. m
1/ III.lJIClCfl >II IDtAl .. ,
'/ V B
I I A B
A V P:5C
~ /
d? ~ I ~ -/' W ""'fJ;J ~
4 6 8 10 12 14 16 18 20 22 24 26 ROTOR SPEED (RPM ~ 101
FIG. 3.2.6 ROTOR AMPLITUDES AT STATION 4 - INITIAL CONDITION AND AFTER ONE BALANCING RUN, WITH AND WITHOUT COLLARS ON SHAFT
\ \
,
I
~ .".
-28 30
82722

.125
I. ~;;:! onn
"U i!"n
.100 =h ;;: .. a
-:I: ::E -~ « w
.075 a.. 1
g 1
~ W a.. .. w 0 . 050 i= .~ a.. ::E « 0:: 0 t-O .025 0::
i.lA... !'V"
O2 4
A- UNBAl ANCED ROTOR AMPLI UDE B- ROTO~ AMPLI TUDE ~ FTER ( NE
BALAN CING R UN WIT f-I TRIA -WEIGH T COlL ARS IN PLACE
C- ROTOR AMPLI UDE A TER 0 ~E BAlA~ CING R IN WIT ~ TRIAL WEIGH COll \RS RE ~OVED AFTE~ BAlAt CING A
Y f~f
Roa SIGIIAl ~_1I5OR lOCAl UI
PROXIIIITY .~ ~ ROTOR STAl
i) , ()
-r: (!
) <J) IJl evl / ,00 01 II 001
~ ~ . r~ fP ~j u...., RIAl." s: ~ :a: ru1s
( ~ SAUII NIl PlAIE !DCA OIS
/ B ('
I B C A B \ ( ~'B V ~ I II- i --~ ~ ..--r ~ ~--;:~ ~ ~
..........
6 8 10 12 14 16 18 20 22 24 26 ROTOR SPEED (RPM X 101
FIG. 3.2.7 ROTOR AMPLITUDES AT STATION 4 - INITIAL CONDITION AND AFTER ONE BALANCING RUN (REPEAT), WITH AND WITHOUT COLLARS ON SHAFT
8.
J. 28 30
82710

I. ~ii11
II" ii1§1 o
Driver
Spindle Coupling
Coupling
0) Balancing .. Planes
Shaft
8
~rrI Vacuum Enclosure
Engine Power Turbine
Horizontal Displacement
Sensors
2 I Vertical Displacement
Sensors 000
FIG. 3.3.1 SPIN-UP HARDWARE & INSTRUMENTATION LOCATIONS - T55 POWER TURBINE
791699

~
I I I I I I I I I I .10 4 r I I I I I I I I I I I
r I I --I I I I I I
3 I I I I
I I r I I I I I l- I
.05 :s:: 2 < l1J 0..
I- I I I I I I I - """" hi ,~ ~ i I I ,-
I g I I
:s:: <
.!G l1J
I I I lY J l~1 ItJ1 I \I .... ~ ~ t I r\ f I
C1l 0.. aJ
~ 0 0..
0 ~ ,----1-1
~i .!G C1l .10 l1J 14 OJ ~ ,
0.. l1J ,
~ ~' 0..
3 Z5
- , ~, I I
I I I
- I I I I I I I , , I
.05 2 - I I I I I I
c-
'",17 I - I I J J1
.-. ~ I t-I ~ 1-V II I VI "'I J
I \ ." '\ ~ .. U~ V .J"...I./ "j'"
r I""" I I I I o 1000 2000 3000 4000 ~OOO 6000 7000 8000 90c.0 10000
ROTATIONAL SPEED. RPM
82708
FIG. 3.3.2 ROTOR 1 - AS RECEIVED - PROBES 2 & 5

.!:<: co
.10
.05
~ .10
.05
I I "'-II.... 1-~ 2r-+-+-+-~~~--~~-+-+-+-4~~~L-~~~t~~
~ , " I""'\. I II ~ ~I ~ ~ ~ -'--~ f ~\ f I ~ ~ 1""" \,.11 \17 I ~ r-+-+-+-~4-~~~~-+-+-+4JH-~~~~.+-~~
~ O~~~~~~'~~~~.~···~~~~~~~~~~~ ~ ~ I
r-+-+-+-~4-~~~~-+-+-+~~~~~~+-~
!Z ~ I I I I ~ 4r-+-+-+-4-4-~~~~-+-+-+-4~~~~r-+-~
~ ~~~~~~I ~~~~~~I~~I~I~ i 3~~~+-+-~1~~1-+~~~+-~~-+-+~~~
~ I I I I I
I Y I ~ iI' , , , ,
o 1000 2000 3000 4000 ~ooo 6000 7000 8000 9000 10000
ROTATIONAL 5nED, RPM
FIG. 3.3.3 ROtOR 1 - AS RECEIVED AND AFTER
HIGH SPEED BALANCE - PROBES 2 & 5
82709

~ co (1)
0..
.25
.20
o .15 '"'
.10
.05
10rr-''-'-~I~~~~~~~~~~~~~I--~
I 9 _ I I ~_~~r+I~I~1 +I~~~~~~~I~
~8r;-+1-r~+-~1~-+1~4-+-~-+1~~1-+~~
'f. r I I I I I ~ 7r;-T1-r~+-1~-+1-r~1~~1-+~4-+-~1~~
t:J I I I I ~ 6 _ I I I I I I I I ~ ~~I~I~I-~II~I~I~~~I~~~ ~ 5r+~1~~1~1~1 ~I~+I~I~I~~I+I~
~. I I I I ~ 4r-~~-+-+~1~-r~1~-4-+~1-~!, ~~~+-~
~ ~ I I I i I ~ 3 t--f--f--+I--!--+-, -+-~-!--II~I--LI--I---1 PROBE 5 ,
I V (SHAFT) "m--I-~---l r I I PROBE 2 i ~ I
2 ~ I I / j(TURBINE)\ II I r I 1...1~~ I ~ /~ I
It,~ I I· I I~~~J ttl It l&- \ I t-~;..u .411'11"4.. It I "~.nr~l ... ~ I .~
"1 r",? :V~''''''''''I ,......,; 'I I I ')V"; , 1(,'
1 2 . 3 4 5 6 .7 8 9 10
ROTATIONAL SPEED, RPM x 10-3
82705
FIG. 3.3.4 ROTOR 2 - AS RECEIVED - PROBES 2 & 5
- IIt:CHANlCAL • 1. fECHNO&.oay fNCOftPOftATED

.25 1 0 -9
I I -
.20 ~ < ~ p.. I
0 E-t
- I I 8 I I I I I I I I 7 I . I I I I
l- I I I I I I I
~ .15 ~ co ~ <1l p.. 0..
6 I I I . I I I I I
I I I I I I I 0 en
,.J w ~
~ ~ co .. <1l 0.. Eo<
Z
~ .10 ~
~ ~
sa ,.J p.. en H ~
• 05'
f- I I I I 5 I I I I I I I I I I 4
I I I I I l- I I I I I PROBE 2
I I PROBE 5 I I (TURBINE)
I- (SHAFT) 3 f- I ; I ... I 1\ I I I 2 _
I \J I I 1 I \ ,. I~ I ',AI
I
~ I I t-J ~ 1,1 ~ 'k""r~M., ~ J!i "...
~~, \J 11'>-~ -.~ 1/ .::-b(1 ~ r '-.. It-''"'' ~ v 1;"'1: - ~ ,
1 2 9 10 3 4 5 6 7 -3 8 ROTATIONAL SPEED, RPM x .10
82704
FIG. 3.3.5 ROTOR i-AFTER HIGH SPEED BALANCE - PROBES 2 & 5

0.100 4~-----,.......----...... ------r------t------.,......------.
ii; A- POWER TURBINE SHAFT BEFORE
E ::! BALANCING (REAR)
E 0.07~ ::! 3 B- POWER TURBINE SHAFT AFTER
x x BALANCING (REAR) ~ c(
POWER TURBINE SER. NO. MZ6897~·91~47 .... .... c.. c.. 6
. 0
l- I-
:.:: . x
~ o.o~o ~ 2 .... c.. c..
.... &oJ C C :;) :;) l- I-::i :J A c.. c.. ::!
0.O2~ ::!
~ c(
cr cr 0 0 l- I-0 0 cr cr
0 0 0 31( 61( 91( 121( I~K 18K
ROTOR SPEED (RPMl
82703
FIG. 3.3.6 ROTOR 3 - BEFORE & AFTER HIGH SPEED BALANCE - PROBE 2

0.100 4,-------'T-----...-------,,------""T""-----..------.
e 'in ..J - POWER TURBINE S'IAFT BEFORE e 0075 :i :3 -BALANCING (FRONll --
x x B - POWER TURBINE SHAFT AFTER
'" '" BALANCING (FRONT) t.I t.I CL CL
POwER TURBINE SER. NO. 268975-91547 6 6 l- t-X
, x
~ 0.050 '" 2 t.I
CL Q.
t.I t.I 0 0 ::::I ::::I l- t-~ ~ CL CL :::ll
0.025 :::ll
'" '" a: II: 0 0 B l- I-0 0 a: a:
0 0 0 :3K 6K 9K 12K 15K 18K
ROTOR SPEED (RPM)
82702
FIG. 3.3.7 BEFORE & AFTER HIGH SPEED BALANCE - PROBE 5
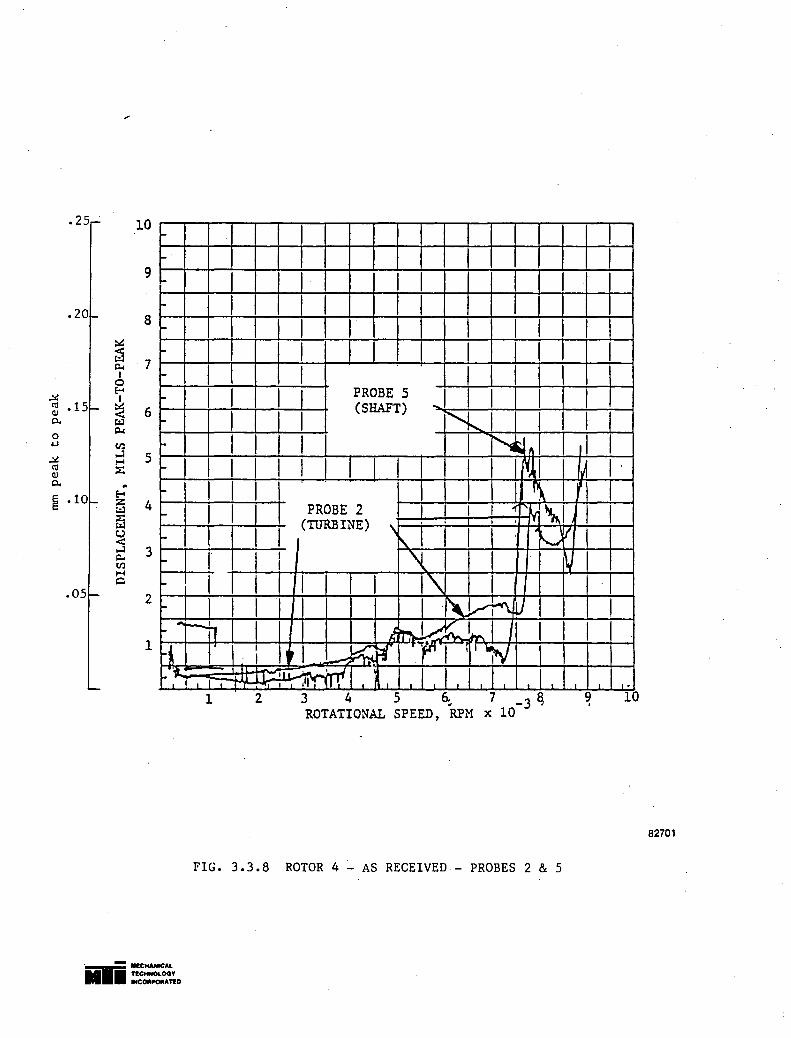
.25 . 10 l- I l-
9 i- I I I
.20 8 I I I I I
l- I I I I I I ~ <: t:l
7 c::... I
0
l- I I I l- I 1 I I
~ £-I I
~ .15 ~ 6 0.. t:l
0 c::...
~ en ~
oJ 5 ~ C1l ::c (l)
l- I I I PROBE 5 .. I I I I I
(SHAFT) i' ~I I I I
l- I I I I b§l1 I l- I I I 1 I 1 I ~J I IV I '
0.. .. ~ .10 £-I
:z: 4 ::l ;:c t:l U < oJ 3 ~ en ~ ~
.05 2
I I I I f\1 I I PROBE 2 I I I . ,,\1 I I (TUREINE) \
I ,
I- I I I I Nil ~ l- I \ I ~ I I- I I I 1 \
I ." vM~ I 1
... it "f~~~ I I I- :m
r-i I , I ~ f' .'Ti/f I -I ,I _'1!i i ,:.......-.:;: , -'I. '
r-... ~ r f I
1 2 3 4 5 6:. 7 -3 & ROTATIONAL SPEED, RPM x 10
9 10 .
82701
FIG. 3.3.8 ROTOR 4 - AS RECEIVED - PROBES 2 & 5
.~~- IHCHANICA&. .1. Tl!CHNO<.OG' tNCOIItPORATED

o w
.!<: ~ C1)
0..
e
.25
.20
e .10
.05
I I I I I I I I I 1
7~-~1~1~~1 ~I~I~I~~I~I~I~I ~I~I~I~ f- I I I I I I
5 I I 1 I 1 I I I I I I I I f- I I I 1 I 1 I . I
~ 4 1 I I I I 1 I 1 P(RSHAFOBET5) 1 I -A I
~ t-f--tl-+-+-I --+--+1--+1 --+-1 --,1f--+_ "'~,.. .. ~ j f- f I 1 I I ! I I I I I ,I I~Jr~( Ifi ~ 3~. I I I ; I I I' I Col .-~......:!---+ I I I PROBE 2 I 1 I' I
(TURBINE) \."~~-+---+--+---4+-~ 2 f---+---+---"I---!--'-I ~ '\ I 1\ I 1 1~-~~~~1~1-+~~1-+_~11_\~~~1 ~I~~~I ~/~I~
~ I I I I I I 1'~ll I I ~ ~ #J~ If M
1 2 3 4 5 6 7 8 9 10
ROTATIONAL SPEED, RPM x 10-3
82700
FIG. 3.3.9 ROTOR 4 - AFTER HIGH SPEED BALANCE - PROBES 2 & 5
. iiIi- IIICHANfCA&. TICHNOLOGY
• • INCOIIPO .... TED

.25 10 - I 9
- I I
.20 8 I roo . I
~ < 7 ::l ~ I
0 ~ e--co .15 I 6 Q) ~ 0.. <
::J
'- I I I I PROBE 5 I I I (SHAFT) --: ........... :-...,.1- I I I
I I I I I r I I I I I I I I I I I I I I I I I .
0 ~ ~
tr.I 5 ~ ..l co ~ Q) ::0:: 0.. .. ~ .10 E-< 4 :z:
::J ::0::
I I I I I I I I I I I I I I I I
- I I I I I I I I I -,-I I I I i
- I I I I I I I I i t:J U :s 3 ::... tr.I
- I I I I I I I I I I I I I I
~
.05 a
2
1
- : I Ilf I I I-I I' PROBE 2
f- I I ».Jj'., .... ..I ...... W K'\. (TURBINE)
roo '-..... .r I o. j j'-/'-J\J
~ I ... J, ~ , I I I t _1- ;0--
1 2 3 4 5 6 7 -3 8 ROTATIONAL SPEED, RPM x 10
10 9
82699
FIG. 3.3.10 ROTOR 5 - AS RECEIVED - PROBES 2 & 5
=-F-- _CHANlCAL
•• 1 ncHNOLOOY INCOIIPOOIAnD

·20
~ ell .15 (1)
a. o ~
.05
7~~~1~~1 ~I~I~~~~~I~I~~I~I~I~ I I I I I !, I I I I PROBE 5 I I
6 1-. -+--+--+-I---+----..;.-~I ~I - (SHAFT):-,t-t-=;::::, ~1~,::jj-r~11
~ 5 I I I I I I I " I I I I
I I I I I '" I ! r+-1-IrIi-1 _-+-' ~ ~ .4~·~~+-~~I~II~~I-+I-+~!~I_:~~!~~.~I-+H,~~ ~ r~~~+-~~I-+~~4-+-~~1 ~I~IH+I~I/~~ g3~-+-+-r~I~I-+I~~4-+-~~~I~\-+T~I~I~
~ I ~ I I I A"1I I I
2 t-ir--t--r-+-i-~~-+--+--I-+-..;--+-t--:H/L4~ 'lJ PROBE 2 . I I I ~ / (TURBI~E)
I JII i~ , ,
1 2 3 4 5 6 7 89 ROTATIONAL SPEED, RPH x 10-
3 10
82698
FIG. 3.3.11 ROTOR 5 - AFTER INITIAL HIGH SPEED BALANCE - PROBES 2 & 5

:c < 0 c:: ~ PLANE 3 PLANE 1 - 3 0. (SPLINE (DISK 0.
..J END) END) .... :c MEAN: 2.28 NOT e- STD DEV: 0.65 AVAILABLE 0 z ~ ....
2 0 CJ .... t.. 0 t.. ~ 0 CJ,
:z:I U z· ~ 1 ~ s:: z ....
, , I ,
1 2 3 4 5 6 7 8 9 10 o .. PLANE 3
ROTOR SPEED, RPM x 10-3 6- • Pu.~ 1
0.75
~ ~ - PLANE 3 l'LANE 1 0 0. 0. ( SPLI~E (DISK
§ ..J 0.5 END) END) ..... :c
MEA.~: 0.43 0.29 e-
STD DEV: 0.29 0.08 15 6-.... CJ
€= ..... t.. t.. :z:I 0 0.25 u ~ u
i... z ~
0 :3 t.. Z ....
, I I
1 2 3 4 5 6 7 8 9 10
ROTOR SPEED, RPM x 10-3
----_. __ . 82721
FIG. 3.3.12 CONSOLIDATED INFLUENCE COEFFICIENT DATA
- 1III!c:tWUCA&.
.11 ::C:'O:~D
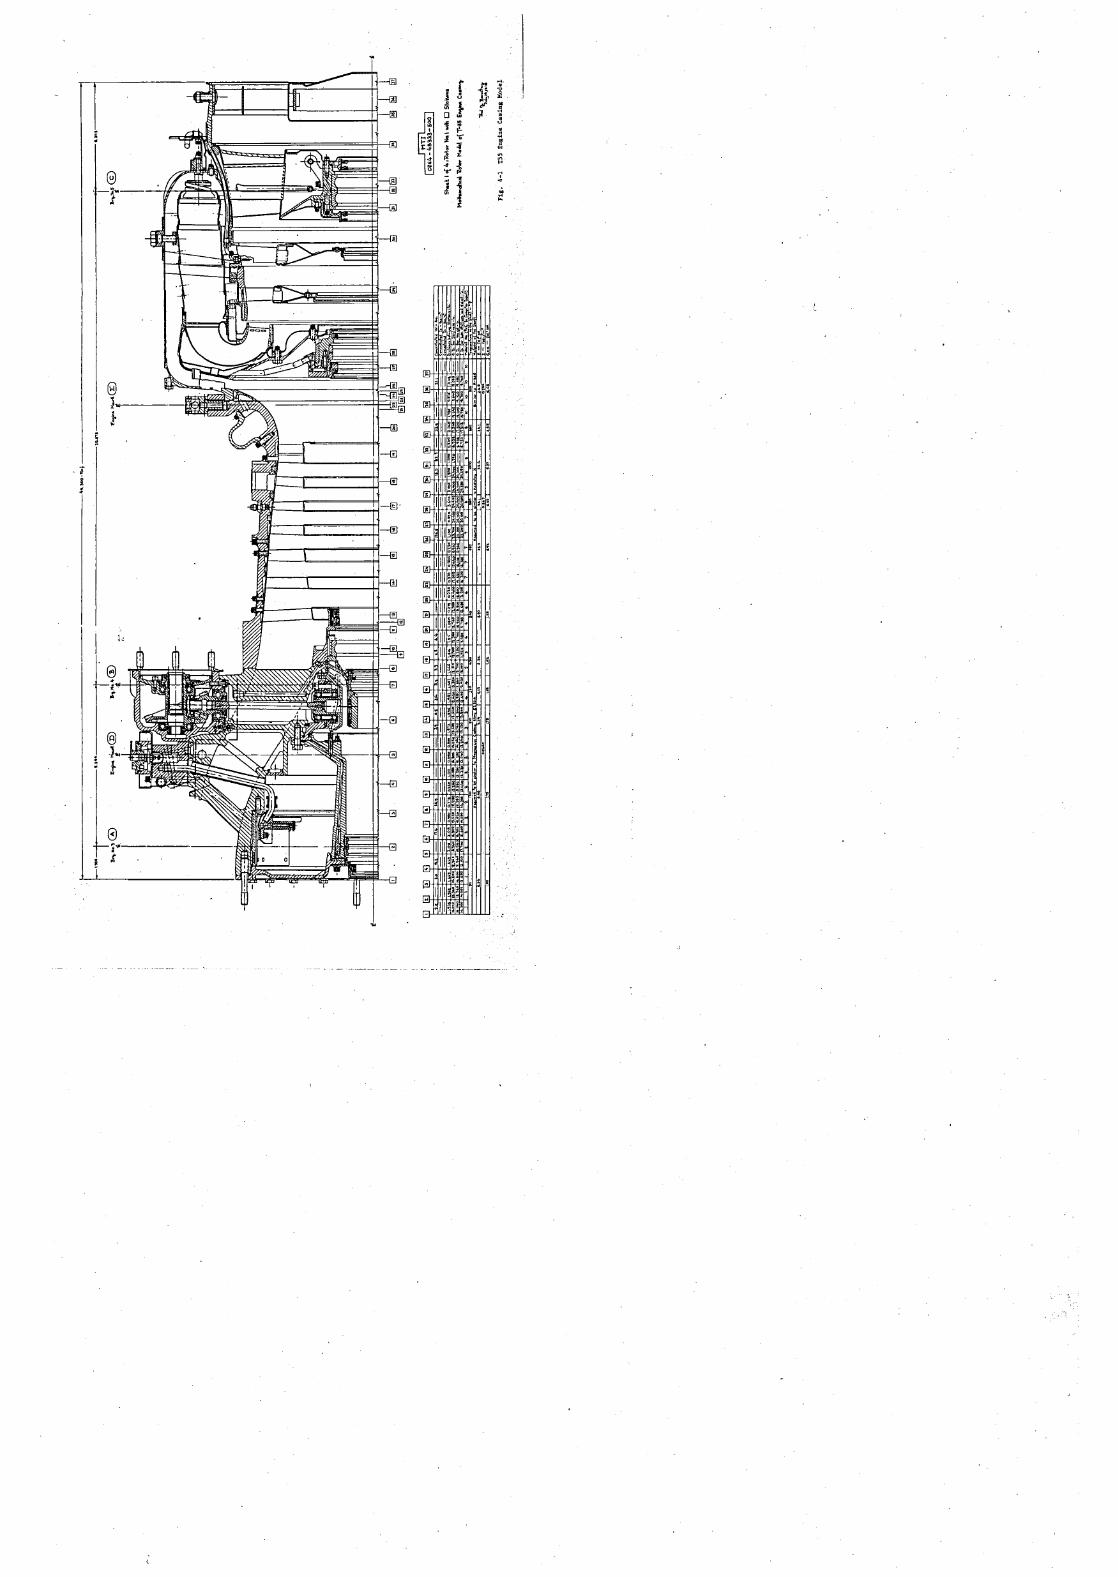

t:====--~~--------~--------------------------------------------------~----------------------~------------------------------fl5~S-~l'--------------------------~~--------------------------------------------------------------------------------~ s.". I I I ,,.< I I '.'00
~r _ . . _ 'r' ~'I~' 'r 4
... 1· .... ·
. ~I"l- l~_ -,- T ~ II I I I I
K~~
n
q
I I ~ ~ -.tit
t f ! lfiH1!lTItHT f f ~) ! CD 0 ~ ~ CD (9 ,) 0 ~ ~ ::;l ® "i) ~ riP ~ ~ <i:> <i:> ~ $ ~ ~ ~ (\il ~ ~ ~ ® ® $ ~ IJ! ® ® ~ .. (ji> $ ~ IS! 'iI e (.~ .. ® ~ ?I ~ ® e ~ ® (~ ® ® @I ~ e e ~ '? e e ~ ® ® ~ ® ~~ ® :p
1ft "'... o,O!o o.n 0.,1 • o.s,," t.!!..' :11" c-... t .... 'W_1Io ..
"''''10.'' 0.4' 1.'" "1'" 1).0, 0.\' 0.0<. 0.' Cl !." I." '-'" ., ~.4 c_ 44. -_ ... U 0." 0.101 J.'" 1'" CoO," .11 00.5 C.Q 0. US 0." 0..5 lU.l ."0..1 ... .l - _.
o.""TS' 0." o.,S" O. I" l"'-G a. U o.s ... Q. '701 \,1"10 0. SO 0..150 05001 0.' S Q.1"15 ~"" 0." o.~ 0.."1'11 O.lll 0..\ o. -ao 0.1 o..'S 0.'''' o.1.~ 0.110 1.1"" 0.115 o.~!o 0..10(.1 c." c.a' IUO .10 0.11'" 0.1.0.0 0.]1 C. 0._ II. 0.\ o.;'IS 11._ 0." l 0..,., 0."'3 "0. 1.."'100 ,oee 1..1' 1." 1.. ~l c..II<lO 0.1040 0.'" '" 0.51.0. o.:T""> ... "" t." Lne o.'!IC ".110 0."" c.~o ro._ ...... _ 1.,1Q '50 2.'''' LUG .~ ~ s._ _.$CO 1S_ 3._ 3 __ t.~" 1.'Y;i.O l.UO 2."0 3.ISO .,... 0.)<0& 1. .• 3' 1.1.00 I.UO \.4'0 l_ L"o. 1.1.50. L'1.DO 'l.ne 1. •• 2.1.0. \4'0 \'<'50 t'!liloO I.'J_ 1."-.0 1."50 l"SO 1."0 1."0 .""10 1.4i.O IUO lUO ~.0511> t.ISO 2.160 a.oco t.uo 2.1.tO t ..... 1.'!I"" t.,,,,, .~cCI. t ... o t._ 2."""l t.'l'" t.'!I .... l"l<lO t._ ~o"" 3."" l..-<o'oo 2..150 lU<> .S"O 2.,SO 1.4"1<> 1.""1<> 2.")20 1100 0.1). 51 Io.Uo '-no 3.''-0 ~ 1eo 3'ao OCI l.OO "1500 1SOO l.SOC 1 3.'-010 -no 4.&040 .,6<1 _:atO .. '-So 0 ."lOG" QOO QOO -.. i. 1..140 .• "" I."SO I. SO .,0 L_ 1."0 I."SO L so ''''0. 1."0 L 0 2..UQ 1.oso 1.Q!lO 1. SO .5,"" LIDO Z.UO 2.110 "1'500 .'!IOO OCI '!laO 0.'JcIo .,,",0 .'t00 "1.*><>0 2.'lOQ 1.\00 .'lClO 1.0'0 1"'0 I. 0 ."\S"Q \I'" ." l.S5O .... "10 1. ~ t.nD 1.' 0. "' ..... 2.. 0 \UO .OQQ 1.01)1) .00<> 1.000 1..000 1.000 l_ 1.000 lOCO 1.000 LOOO lOCO 1.0tt0 L'tO 2 ... " I.ISO C. 00 1."'0 L'" 1"-0 1.5QO 0.' 0. so 0. 0. ... o. 10 o.,~o O. 0.' II. 10 '0 0.10 0.1.0 0._ I.'R> I "10 I 0 .,... 1.1:2.0 ,so a."s .51 5' '<'I 1.50'5 2.1'5 t. IS 1.." .11' ."llo i.<l$O \.50 I.SSO 1550 loU .. I.S$O 1..'50 .S~ l5S0 \5'" liS'S .t!...5\' _ ... '
\ I I I I I I I I I I • 1 OJ: .. .. .. ,,10 !'"I ..... Me. .. C-100 01) -- ..... ~ -
A __ oI, ................ 1"-0 " 10 ... , •• -tow •• U. "1'." 1.... . aI.
0.1" _.' .. H "1 • "IS"'" G"O{- (
4A~~~~~44~4~~4~~~44~~~~4~4444~~44444~4 ~~~~~~~4~~4~ I I • I I I I I I .. S • 1.(.
.. <> ~ ..... '''0 ........ , .... 1 __ ..... - u. ... ........ oIt .. _p"-~w._ •• -__ ,.....1-0
~--'-~. :a.: ~.~".~ o.ln e: .. ~ b.. a.n Q.1jc .. ~ •. .,~ 00 Ie"",
.. ~ .... l.ooo,COII 1.0
1,000.,000 1.0
200,000
~ r02'4-4S33~-500 I
Shu. 'Z 0{ 4 ~ "Rota.. No."2. WI"", ~ St.Hot'Il "Ro'\or No.1 .... "" 0 St.\'-Io
""Q\M",a~CI\ MooI,.I. o~ T·SS 1"0 ..... T~bin .. ~-cw., "R., "Rotar A .. t...la.l~
"P..l'i."B~ ~I •• ''''''
Fig. 4-2 t55 Bdancing Rig Rotor and Engine Rotor ~e18

t
~ __________________ ~ ________________ ",n_ •• , _________________________ ~ __________ --~
'I :..ll!!. I ''''0 J I 16.130 I 9.344 I :.S!!1! I.£!!g.
T r '")@ •• ,@ "r ~fO T' T I I --I . r .
.j'-01 Hi"pB
---iT ~~~ ~ .\ t-'-'SQ
,00 3.1,... 500 150 500 1500 I I I
IUo O.~'S 3.,50 1S0 4.100
'so ","SOO sao 3.500 3.500 I I I
4'1.05
0;;"0 0.31.0 o.~ 0.3!15 0-10 1.'4$ 0.500 0.3 5 0."30 Q.3~O L~'!SO '.650 L'50 t.,50 I.e,o '2..000 2..'2.00 't."1.gO '2.100 1900 .340 2.3 Z. ,-'So t,.ooo LOCO 2.500 2..5" a.JOO. 1 . .,00
I \50-
.... ,. ... ~ .... I.,'to AtSI .10')40-( ... ToT o.ru &:ii"
~"'·sf"l
.S41. 0:-50 0.'2.1.$ 0.32.'5 1.'$" L650 L"SO L'o.So 1.(.50 1."50 I.UO LUG 1,11050 \.~5Q 2..o~o a..050
~ I oZ64-45333-500 I
Sh .. t 3 ~ 4, iI.to. No.4 ",I" 0 S1at,o""
Mo~'n"",Q,tico' Mode.l 0\ T-ss ~w .... Tu,bine.
Mod'~.d 1I0Ion<""it 1?i~ 1M.. ~ss ... \'I~
1'-l'i;~:,~
"
FIg. 4-3 T55 Modified Balancing Rig Rotor Hodel
IE

~ELATIVE AM~LITUOE -1.0 0.0
l. 0.000
10.000
20.000
30.000
40.000
50.000
60.000
70.000
ROTOR LENGTH
(IN)
- III!CHANICAL . TecHNOLOGY
••• INCORItORATlD
X X
- - - - - - - - - - - - -x- - - - - - - - - - - - - BRG. NO. 1 X (K= .lSE·07 La/IN)
--- - - -- -X X
-x- - - - - - - - - - - - -x X X X X X X X X X - - - - .0. ______ -x- ___________ _ x X x x
aRG. NO. 2 (K; ,lSE.07 La/IN)
aRG. NO. 3 (K= .10E.07 LS/IN,
- - - - - - - - - - - - -x- - - - - - - - - - - - - eRG. NO • . 4 .X (K= ,10E·07 LS/IN'
- - - - -- ---- - -
.' X
.'
.'
.'
.'
.'
.0
.' .' .' .' .' .' .' .' -,.-.' .' .' .'
x x x x
x x x x
X x x x x x
- - - - - - - - w
ROTOR CMITICAL S~~~O= 9452.3 RP~
x x
x x
aRG. NO. 5 (K= .20E.06 LB/IN'
82686
FIG. 3.4.4 POWER TURBINE FIRST CRITICAL (CASE 4)

0,000
10.000
20.000
30.000
40.000
50.000
60,000
70.000
ROTOR LENGTH
( IN)
:- MICHAH.CAL TeCHNOLOGy .11 INCORPORATeD
-1,0
-- - -
----
-- - -
X ;(
X X X
X X
X
-- - -
- ----
-- ---
-- - - -
X x
X
X X
X
-----
J;ELA TIVe: A"'PLITUOE
-.
-
X -
--
- -
- ..
0.0 X X X
-x-X X X
-X-X X X X X .,. .' X .' X .X X
-X-
X X
X:. X.'
• -X-.• -x .' ,
.' ,
.'
.' ,
.' .
.'
.' , .
.'
.'
.' - - 11 •• -
.'
.'
.'
.'
·1,0
-- - - - -- - - --- SRG. NO. 1 (1(= .lSE·07 LS/IN!
-- - .. - - - - - --- SRG. NO. 2 (1(= ,lSE·07 LB/IN!
-.. - .. -- .. - - - - - SRG. NO. J
---- - - -- - --- SRG. "10. 4 (1(2 .10e:.07 LS/IN!
- - - - - - - .. - - SRG. NO. 5 X (1(2 ,20e:.06 LS/IN!
X
x
ROTOR CRITICAL SP"FO= 2224\,3 RPM
82687
FIG, 3.4.5 POWER TURBINE SECOND CRITICAL (CASE 4)

-1.0 0.000
10.000
20,000
:30.000
40.000
50.000
60.000
ROTOR LENGTH
lIN)
- MeCHANICAL
••• TlCHNO\.OOY
INCOfiU'ORATED
----X
--
- -
- -
----
X
x
--
--
- -
~ELATIVE AIo04PL I TUDE 0.0
o· o· X
o· X ----- --- -.,-- -x- -- -o· X .X
X • - -x- - -,,- - - --- - ---X
o' x o· o' 0' o· X 0' 0
M .• - -------- -X. x X x x -- - - ---- -x- - -- - - - - --X x x X X X :II(
X x x x x x x X X - - ------ -x- - -- -- - - --X x x x
ROTOR CRITICAL SPEeO=- 1a702,7 RPM
FIG. 3.4.6 RIG CRITICAL (CASE 4)
·1 •. 0 . X
--- eRG. NO. 1 II(=- .15E·07· LanNI
- - - eRG. NO. z 11<- .15E·07 La/IN)
--- eRG. NO. J O(=- .10E·07 LS/INI
- - - BRG. NO. 4 O(=- .10E·07 La/IN)
- -- eRG. NO. 5 II(=- .20E·06 La/IN)
82695

0.000
10.000
20.000
30.000
40.000
50.000
60.000
ROTOR LENGTH
I INI
-i.o RELATIVE AMPLITUOE
0.0 % X X
- - - - - - - - - • - - -x- -- . - --- -- BRG. NO.
X X X
~ - • - - - - - - - - - -x- - - - - - - - - - • - - BRG. NO. 2 X IK~ .15E·07 LB/IN) X X X X X
- - - - - - - - - - - - -x-X X X X X
- - - - - - - BRG. NO. j IK~ .10E.07 La/IN)
- - - - - - - - - - - - -x- - - - - - - - - - - - - eRG. ~O. 4 ~X IK= .10E·07 La/INI ,. .. ,. ,. .. ,. ,. ,. ,. " ,. " ,. " ,.
-.- -.. ,. "
X X
X X.
X X
X X
X X
X X
X X
X --- - - - - --~-x
ROTOR CRITICAL S?~~O= 9452.4 RPM
x x
X
BRG. NO. 5 IK=.20E·06 LB/IN'
FIG. 3.4.7 POWER TURBINE FIRST CRITICAL (CASE 6)
82697

RELATIVE AMPLITUDE -1.0 0.0
I X X
0.000
10.000
20.000
30.000
100.000
- - - - - - - - - - - - -x- - - - - - - - - - - - - BRO_ NQ. 1 X (K= .15E·07· L9/IN) X X
BRG. NO. 2 (Ka .15E.07 LB/IN)
- - - - - - - - - - - .- -x- - - - - - - - - - -. - -X X X X X X
- - - - - - - - - - - - -x- - - - - - - - - - - - - 9R~. NQ. J X CKa .10E·07 LB/IN) X
!-X.' x.
- - - - - - - - - - - -x-.- - - - - - - - - - - - - BRG. NO. '"
X X X
x x
X X
x
X .' (K= .10E·07 LB/IN) .' · .' .' •
· .' 50.000 X
60.000
ROTOR LENGTH
lIN)
~~~-~ MeCHANIC ....
M •• Tl!CHNOt.OOY INCOfIPORATED
X .' X .'
X • X .'
X " X •
-!--.' X
- - - - - - - - BRG. ~o. 5 (KS .20E.06 LB/IN)
.' X
.' x • X
ROTOR CRITICAL sp~ros 22252.2 RPM
82696
FIG. 3.4.8 POWER TURBINE SECOND CRITICAL (Case 6)

0.000
10.000
40.000
50.000
60.000
70.000
ROTOR LENGTH
(IN)
-1.0 RELATIV~ AMPLITUDE
0.0 .' .' .'
X x ---- - - ------ -.. - -X-
.' x
.' X x .' - -.. - - - ------- - - -
.'
.'
.'
.'
.'
.'
.'
.'
.' X "
-.X- ---- - - ----. -
BRr.. No.1, (K= .15E.07 LB/IN)
eRG. NO. 2 (K= .lSE.07 LB/IN)
BRG. NQ. 3 (K= .10E.07 La/INI ,.X
.' X " X .' X - - - -- - - --- - - -.~ - - - - - - - - - eRG. NO. 4
.' X " X " X " X • X :. X " X " X " X " X ,.X
.' X .X X X
- - - - - - - - - - - - -x- - - - - - - - - - - - -
X x 'f.
X,.
ROTOR c~rTICAL SP~~O= 20539.7 RP~
FIG. 3.4.9 RIG CRITICAL (CASE 6)
(K= .10E·07 LS/INI
SRG. NO. 5
82688
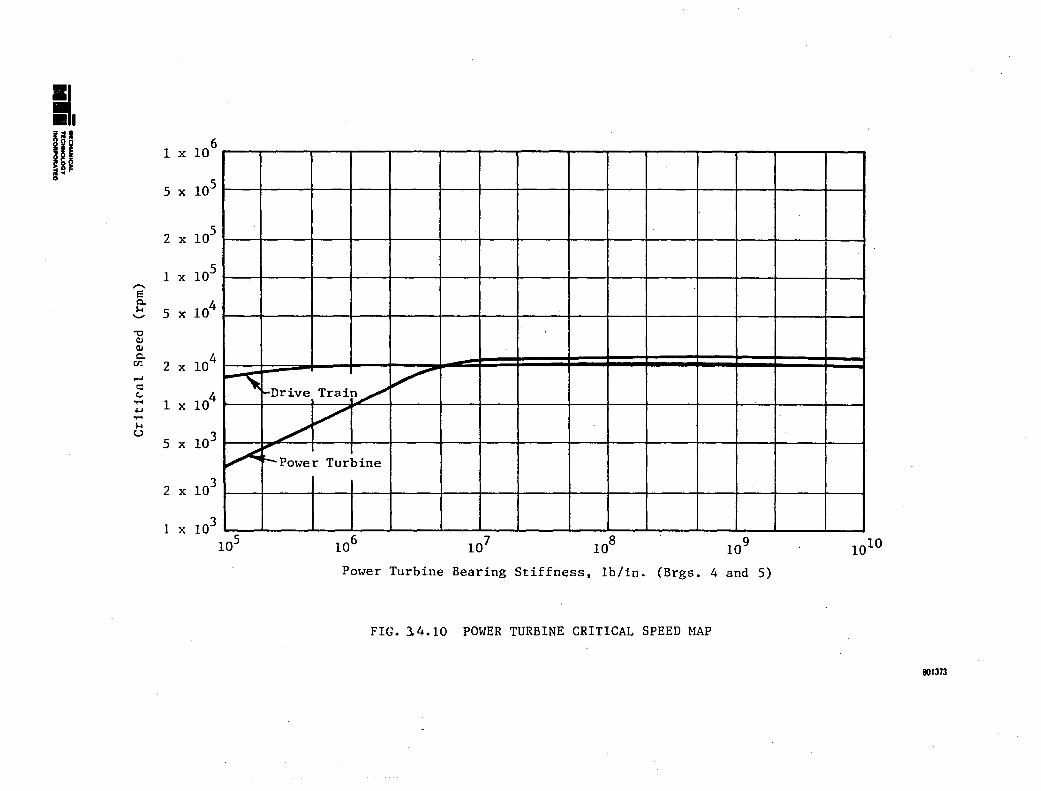
I. ~OII if" ~gl OI .. ~ 0
,...,. E: ~
'"' ........
"'0 CJ <I.i 0-
rr..
-" c: c... ..... ... ..... '"' u
1 x 10⁶
5 x 10⁵
2 x 10⁵
1 x 10⁵
5 x 10⁴
2 x 10⁴ --, 1 x 10⁴
5 x 10³
~ 2 x 10³
1 x 10³
105
~Drive Train~ ~
V I
~ I
to"" ,
r-Power Turbine
I I
106 107 108
109 1010
Power Turbine Bearing Stiffness. 1b/in. (Brgs. 4 and 5)
FIG. 3. 4.10 POWER TURBINE CRITICAL SPEED MAP
801373
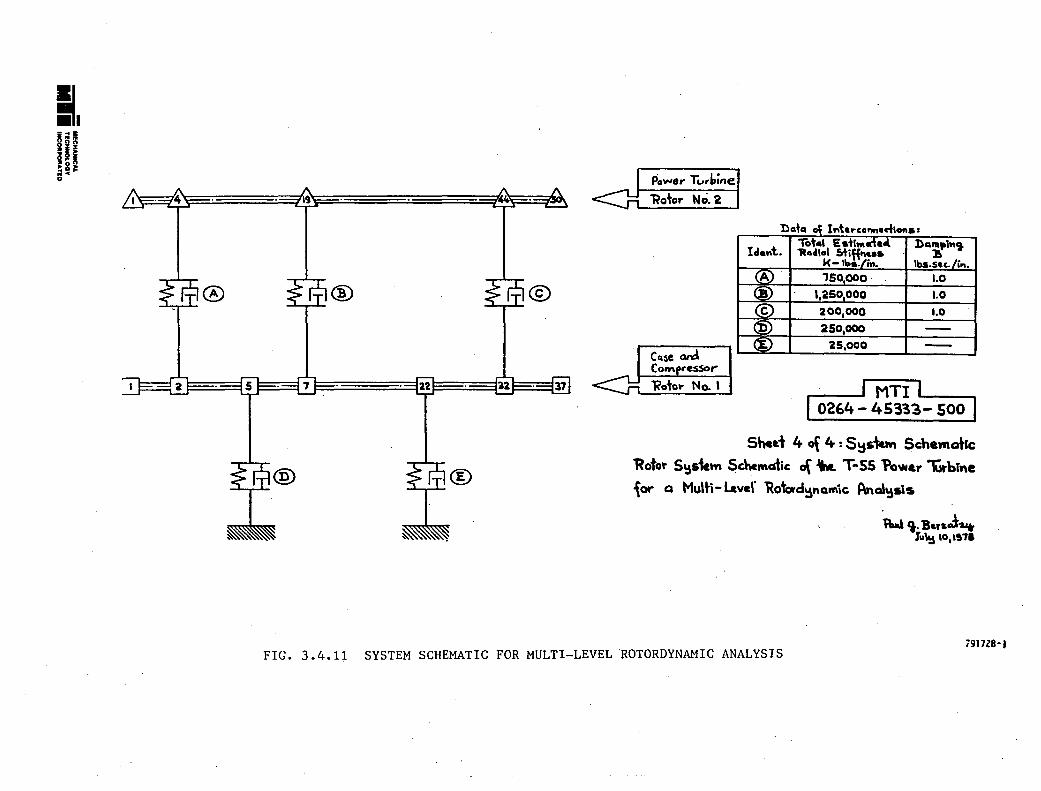
I. ~iU rn .II =§~ o
'19'
® ® ~®
F' ==t Sf--. -----ITJI= .............. =::. ========4
®
Power T",rb:ne
'Rotor No.2
lcI.",t.
(A) , @
© @ ®
. - ---- . -_ .... --.------Tot.1 E.~r",ct .... ])a .. pt.". ltd,.1 &ti~u. - :a
~-Ib.:/in. lbs.s&c-Li". 150,000 ' 1.0
1,250000 1.0
200,000 1.0
250,000 --15,000 -
She&t 4 of 4 : S~5tan Sche",O+Ic
'Rotor S~5fc." Schematic c(' _ T-S5 "o",,&r "iWbine
ior Q Multi-laver "Robd~nQ",ic P.nal~s's
iW 'a:.lh.yaJ-'2.It ru~ 'O,'~71
i'917Z8-1 FIG. 3.4.1~ SYSTEM SCHEMATIC FOR MULTI-LEVEL 'ROTORDYNAMIC ANALYSIS

I. Iii oI§~ o
Casing HOOf SHAPf... AOtOR H).
.[LA TI V[ '~PL IlUO[ -I.' •.• e.ol. .X
• I
5.0.' l. I. I.
.1.0
e _ .. _ ............ _ •• J. _ •••• - • .. .. .. .... SHG. NO. I
...... IS.'"
z •••••
zs.o ..
10.'"
)5.'00
4'.00'
'5.000
AOIOA L[HGIH
IINI
..
.' .. I I
I
- .. - .. - .. - .... - - - -,-
• I
I I
I I
• J J
•
IKa .ZS[.06 LIlIINI
I I -.- - - - - - - - BAG. 100. Z
• • • • • •
• • I
I J I
I.a .ZSr.oS LSIINI
AOION f~AI"CI.L $.P(I'O- tali.1 APM
Power Turbine Rotor HOO£ 511'''['' Al)10".,). 1
-1.0 Aft." YE &HPUIIJf\E
'.0 •• 000
5.000
11.'00
IS.'"
z .....
is ....
10.0.'
]5.010
••••••
.5.0.0
.' J I
I. . . I.
.1
.1
•• II
I
• • • • • • • • • • • I
I
• •
• • I
AOIOA L£HGIH
IIHI NOlO" ~"'IfICAl 5,(1'0- .15.' RPM
FIG. 3.4.12 ENGINE CRITICAL SPEED OF 905 RPM
• I
I I.
••••
82689

I. Aftll
III ~ .. ~ a
Casing 1r400( SHA",e.. Aol0A No.1
IEll1IV( A~PlIIUO( -1.0 '.0
•••• 0 • I
5.000
.1 II I
I. I'
I •
'1.0
.e_. __ ..... .. -.- ...................... -".000
IS ....
20 ....
l5.000
n.olO
lS.O"
.... 0 ••
.. s.oao
AOIOA UIIGlt.
tlHI
• I
. "
• I
I
I I
I I
.. .. .. .. - -.- .......................
A
POIO.A (AI ileAL spp:rO. "461.0 RPM
eAG. HO. t.- .25r.-06 ll'/INI
lAG. NO. l •••• 25[105 La/IN.
Power Turbine Rotor HODE SHAPE - pntOQ'M •
-1.0 0.000
5.00'
...... IS ....
ze ....
l5 ....
n ....
lS ....
•••• 00
'5.010
AOIO~
UHGIII
or LA" V[ IWPli lUO(
•••
I I
I
I I
I
I
I I I
.1 II
I. I .'
• • .. A •
I .1 . .
I »
I , I
• I I
I
• • • •
I I
I I
I
• I
tI"l Rlltp' :'I1ICJl Sprl:). 4461.0 APH
FIG. 3.4.13 ENGINE CRITICAL SPEED OF 4461 RPM
·a.o
I
•
82690

I. li~ =§I "
Casing HOD[ SHAPe.. ROTOII Iff).
~rLA TI V[ AMp\' ITUOE -I.' '.0
0.00'
5.011
......... ---........ ".-
...... IS ••••
zo •• ". ).
15.000 .1
I I
, ,
, • x
I
•
• •
I
• -x- -I
.1.0 I
X
BAG. "40. 1 eM- .2SE -06 LailNI
.. .. - .• - - .. - ...... .. M.- .......... - .. ... .. .. .... 8RG. "f0. I
)0 •• 10
15 ••••
40.000
45.000
AorOA l(NG'"
IIHI
• • eM- .lSE'IS lS/IN'
' . .. '. I. I. I.
It
. '
.1
.x .. . . Al)rOR CAfTICla:. SP(I"O- "IiIOl.1 RPM
Power Turbine Rotor
MOO[ SHIpE - ~OTOR NO.
HU TI V[ AMPlITUOE
'.011
5."0
...... 15 ....
1 .....
n ....
]0.000
)5 ••••
.... 00.
A5.0tl
AOJOA lC .. "H
-1.0 '.0
I a ... .' J
a • -.
• •
• • I
•
• I I I
•
"'" lIornq C111:eAl ';lIr"l1_ ,. ... l.A AP,I
FIG. 3.4.14 ENGINE CRITICAL SPEED OF 8804 RPM
• • • •
x • •
•••• I •
• ,
• I
1 Transmission
Shaft
82691

I. lOll
III 01 .. a
Casing "ODe SHiP( - AOIO' 'c.
A£L'" y[ ,"PL nUDE -I.' •..• ..... 5.... .
I. l.
.1 ••
... ... .. - ................ .... - ............. - ........ - eAG. NO. I I. ." •• 2S(.0' la.lIH. ..
I' ••• ' ., I,
I' .. I. I.
15.... •• I. I. I. X. .. z..... ..
n ....
I'.
• • • ..
- ...... - ............. .. -1- ........................ ..
]'.101 I.
]5 ....
••••••
• 5.'"
AOIOA LENGTII
IINI
. •
• I.
l
• • I
• • I.
AOIOI CAnlC>L snrD. lIon.1 A ....
eA~. t<O. l •••• 2S[ •• 5 UIINI
Power Turbine Rotor 'tOOl !t.U"P[.. ...OlOA HI.
-I.' •••••
1.011
.. .... IS ....
2 •••••
25 ....
31.0 ..
]5 ....
" •• 00
45 ••••
A[L" I Y£ AHPL nUO£
••• • • I I
• · . .. .. I •
'. '.
.. • •
l
• • • I I
• I I
l I
I
• I I
• I
• •
AOIOA LENGtH
IIfll AOIOA Cr.iIlCAL SP(FD. 11111.1 liP"
FIG. 3.4.15 ENGINE CRITICAL SPEED OF 11007 RPM
l
•
'1.0
• • • •
J Transmission
Shaft
82692
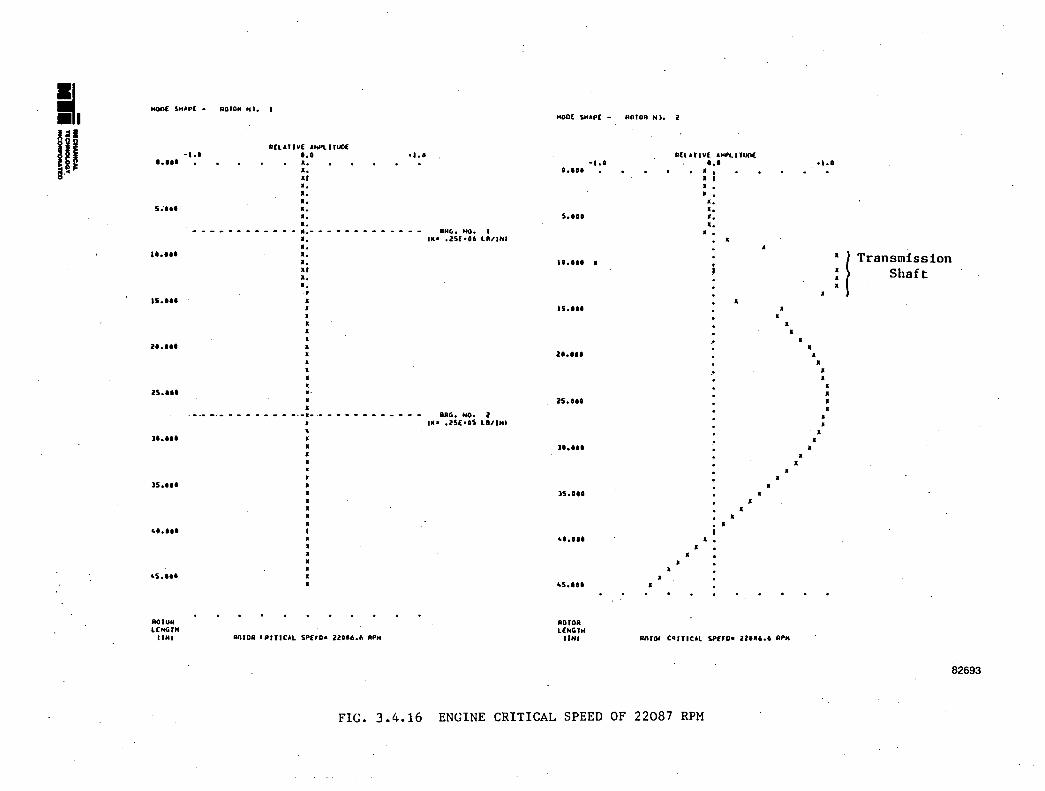
I. Ir ~J a
IOOQ( SHlp( - ROIOA ,".
8(UJlV( "'PlIJUO( -I.. '.0 _1.0 ••••• I.
5~'"
I .....
Ii ....
I .....
IS ....
]I ••••
]5 ....
4 •••••
.5 ••••
ROIIIA UNCilH
IIHI
x. II I.
I. X. I. I. I.
- .. - - - .... - - - - .... - .. - .. - .. - .. - - - .. - 8HG. NO. I I. ." •• 2SE -06 laVIN. I. I. I. I, I. I. ,
I
• I I I
• I-
I
I
---- --- - - - - - - - ---1- -- - - - - - - - - - - - 8RG. NO. I
• , I I
OlllOR '."ICAL SP(rOa n ..... I> RPH
IMa .15('05 LIIIHI
"oDE SHAP( - ROIOA HI.
A(U"V( A"PL"UII( -1.0 I.'
0.1.1 ••
5.UO
II .... I
15 ....
n ....
25 ••••
lO ....
]5 ....
".10'
.5 ....
AOIOR L(HGr ..
I I I • , .
I
I. I. I. I.
I
I I
IIHI AM ... C'''ICAL SPEro. n.u .• RPM
FIG. 3.4.16 ENGINE CRITICAL SPEED OF 22087 RPM
I I
_I.G
I I
I
I I
I I
. ! Transmission Shaft
82693

r-... Lt') ~
s:: ::s
0:::
r-... Lt') ~
s:: ::s 0:::
9000 rpm
8000 rpm
!DiSk End Measurement Plane
I 9300 rpm
7900 rpm
7350 rpm!
Measurement Plane [
Spline End
9300 rpm
I 8000 rpm HI mil
FIG. 3.4.17 EXPERIMENTAL NET ORBITS AT CRITICAL SPEEDS
MTI-19639

I. rl
JI "
..... I ••••
...... 15 ....
II ....
15 ....
l .....
n ....
ROTa. UHGIH
IIHI
-i •• I - -,- .....
A(LA II V[ AMPL nUD[ .~. -.- ..... -,- ..... -.-
• • i • 1 I
1 •
1
•
1 1
1
1
- I .. -,-
1 1 1
1
1 1
1 1 I
1
• • 1
-1.1 ... BAG, NO. I
• Iko .I\['OS lS/IH.
• 1 1
.. .. .. .. .. .. .. .. . .. -.- ...................... - lAG. NO. Z
• 1
•
1 1
1
. i 1
1
RaioA CAi IICAL SPEeD. Jar •• ' RPM
••• • 11('06 LaIJH •
..... s ••••
......
15 ....
zo ....
25 ....
l .....
)5.000
ROIDR LfHGIH
IIH,
-I •• I - -,- .....
A[LA i I V[ AHPL nUD[ . . ..• .1.1 -.- ..... -.- ..... -.- ... - -.- ...
• 1
• •
1
• • • •
• • • • •
• • •
1 1
• •
1
• •
1 1 1
•
.............. -...... .. -.- ...................... ..
1
• • 1
• • •
RaioA CAIIlCAL spno. I1Il.l RPM
FIG. 3.4.18 THEORETICAL MODE SHAPES IN A VERTICAL PLANE
Spline End lAG, NO. I
•••• 11['05 La/IH,
Disk End lAG. "'0, l
••• • Il['" U/lH •
82694

6 .15 f-
~ <t 5 L&J Q.
- PROBE 5.!SPUT END (FORWARD)
" ~
~ <Il Q)
I 0-0 .... • -4 ~ <t L&J Q.
CJ) 3 -I
:E .. .... Z L&J 2 :E L&J U « -I
- ~
\ f- RUN 158,
... .... /~ r- W", / I,' \ r j
, IJ r , V I
I
f- RUN 157, v~ I \ I
0 ~
.10 ~ <Il Q)
0-
§ ~
~ c:: Q)
e .05
Q)
u <Il
....... 0-til
'.-1 0
Q. CJ)
C P'-~-.., \ (
f- -- ~~ / ....
.'" ~J 1
... - J -' f\". -. ,/ ~ '\ ~I, 'J
r- I ... f-_'2I0Il V Y ~ 1', r; , .~ , ....".' I I , , , I
00 1,000 2,000 3,000 4,000 5,000 6,000 7,000 8,000 9,000 10,000
ROTATIONAL SPEED, RPM
6 .15 r
~ « 5 L&J Q. I
0 .. ~ 4 « L&J Q.
CJ) -I 3 :E .. .... Z L&J 2 :E L&J
PROBE 2~DtSk E~4D (AFT ~. \
t.. ,
f- I 1\ I \" r- RUN 158, I \ J ! \ r ~ 'V (
II 1"\ I /
~ <Il Q)
0-
0 ~
.10 ~ <Il Q)
0-
§ ~
~ c:: Q)
e .05
Q)
u <Il
....... 0-
U « -I ./ r ~ -/ \1
A til
'.-1 0
Q. CJ)
0 ~ ""'" ~ /
f-Jf / 'RUN 157 L ,""" oIL ~ ,-' , I , I I 'r !-t'" .. ~ 1-,-~~ '-,""" -, ...... , I , , , , , I
00 1,000 2,000 3,000 4,000 5,000 6,000 7,000 8,000 9,000 10,000 ROTATIONAL SPEED, RPM
FIG. 3.4.19 VARIATION IN VIBRATION RESPONSE - VERTICAL SENSORS
='11";-::: MaCHANICAL .1. nCHOIC)I.OQY INCQtIIHHtAnD
791744 -I

~ <t UI Q. I
0 t-
I ~ <t lAJ Q.
(I) ...J
2 .. t-Z l&J 2l l&J (.) <t ...J Q. (I)
C
~ <t l&J Q. I
0 .. ~ <t l&J Q.
(I) ...J -2l .. I-Z l&J 2l lAJ (.) <t ...J Q. (I)
c
6 .15 -
5 PROBE 6-'SPLINE END (_FORWARD) ~
-.. -
4 ,~ ~ ~ I \.
.10
3 I- RUN 158, ~ j ~\
1 / 't. r} ~~ l-
2 I- ~UN 157, " ~', I- '[\..., / \ ....
.05,
'\r V .... ,.... ". ~ / \ - ...,1' '-"\
,..." -' v ~) ~ ~ ~ '" \ I v'" J ~ ~ • " " .. .&.
~. I.,..""" "Y I- ,,, r. "T '~ .1 1 1 I I 1 I I I I I I 1 1 o o 1,000 2.,000 3,000 4,000,5,000 6,000 7,000 8,000 9,000 10,000
6
5
4
3
2
ROTATIONAL SPEED, RPM
roo
I- PROBE 1-0151( END (AFT)
l-
I-
..
..
.:.
-I---+-~-,----t--+-'-I--+---+--t---- '-I---+---~' ...
f~ , -,+---+--t---i .05
-1---+---+-+--+--I--'-+--+--f---I---I---+--+--1--r-:oft-+--ti--+--+--t--l
RUN 158, ~ /' _;\" ~/I~ --
1,000 2,000 3,000 4,000 5,000 6,000 7,000 8,000 9,000 10,000
ROTATIONAL SPEED I RPM
FIG. 3.4.20 VARIATION IN VIBRATION RESPONSE - HORIZONTAL SENSORS
- _CHANtCA&. TICNNOLOGV M •• INCOIIPOIIATlO 791743 .. 1
.!<: C'Ij (lJ
0..
0 .,;
.!<: C'Ij Q)
0..
~ ~
.,; c:: Q)
e Q) (J C'Ij
...-< 0.. til .....
0

II ~~E III ,,§1: o
TABLE 3.4.1
ROTOR DYNAMIC ANALYSIS FOR PREVIOUS AND CURRENT RIGS
TWO LEVEL MODEL (CASING & POWER TURBINE)
PREVIOUS RIG (FIGURE 3.4.2)
CRITICAL SPEEDS
1st Lateral (Rigid Conical @ Disk)
2nd Lateral (Rotor Bending)
Rig Critical (Rigid Spindle)
CURRENT RIG (FIGURE 3.4.3)
CRITICAL SPEEDS
1st Lateral (Rigid Conical @ Disk)
2nd Lateral (Rotor Bending)
Rig Critical (Rigid Spindle)
NO HINGES (CASE I)
9502
23531
20408
NO HINGES (CASE 5)
9505
23660
20546
SPEED IN RPM HINGE @ PLANE A HINGE @ PLANE B
(CASE 2) (CASE 3)
9500 9452
23461 22254
18703 20356
SPEED IN RPM HINGE @ PLANE B
(CASE 6)
9452
22241
20540
BOTH HINGED (CASE 4)
9452
22252
18703

I. - .... ~l!!1 II-~~~ o
TABLE 3.4.2 ROTOR DYNAMICS ANALYSIS FOR T55 ENGINE
ENGINE (FIGURES 3.4.1 & 3.4 • .2)
CRITICAL SPEEDS
1st Lateral (Rigid, Conical)
2nd Lateral (Rotor Bending)
Casing
NO HINGES TOTAL ENGINE CASING
CASE 8 CASE 9
11034
23255
909 4546 8845
1053 5119 9613
SPEED IN RPM
TURBINE CASE 10
9499
23385
HINGE @.PLANE B TOTAL ENGINE TURBINE
CASE 11 CASE 12
11007
22087
905 4461 8804
9452
22099
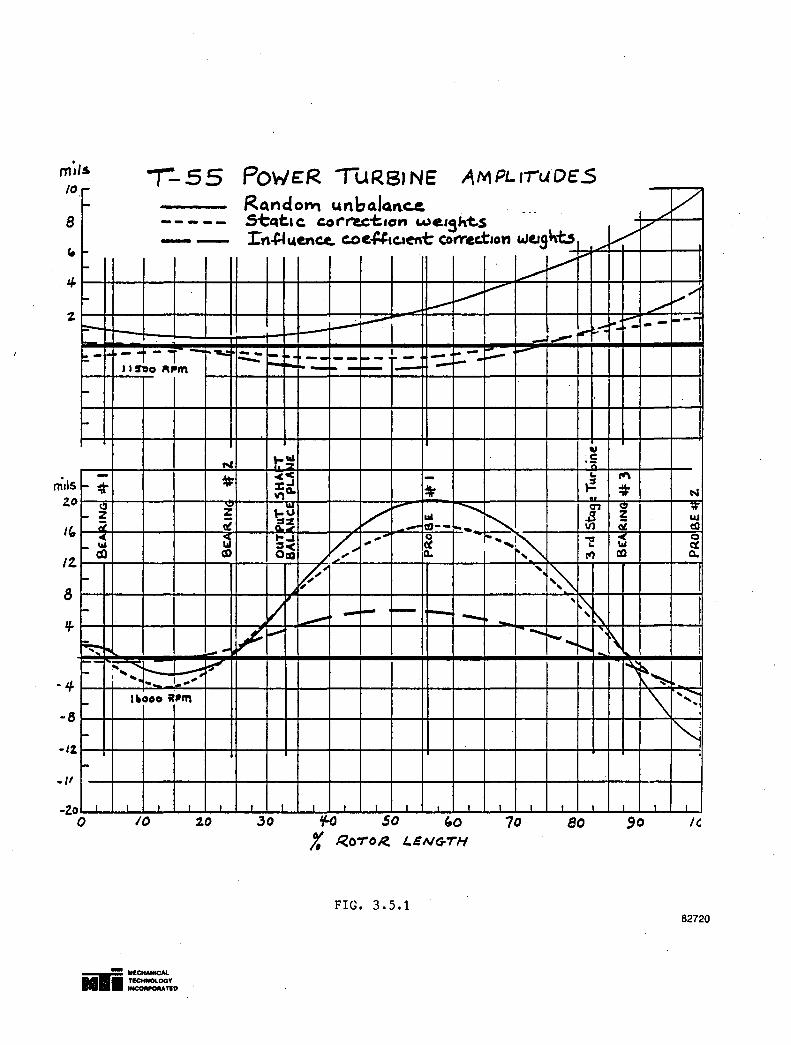
1-55 POWER. TURBJNE AI\1PLriuDES r-
I-
8 -------~
I-
~
~
~- I· -:r-' - ~-...:: .-J I~o "pm
-
-
-1-:;-
I- ~ ~
~ I-c:o
/2. I-
I-
t::.. ~r.. r-l-
I--8
I-
-/2.
l-
.1' -Zo
o I
N
~
Z -It ~
_ ... ... ......
"7= -:I' I ....... .... ... "" ...'
Iltooo it""
I I I I
10 2.0
Rando,." Unb4lQrlc..e. ... stcatlC cor-rect.,," we-ISht.s l:tl+t",~c.e. c.oe.-UIC:.uent CDt'rec.t.on weJS~-b ,./
"..,.V .....
..,....., V ~ -~~ "'v:: ..... ---: --" -- ~ . -- I-- -- - :.--~ --- I- -- --1-- I- - ~ -
" r.~ ·c ';;
-« - c. rt\ ::.J
~ ~ ~ ",a. ., \-~ V - ............. In ~ l3 III I'-. ~ ~ .- 11)-- --I-.J ):;, ,- 0 r-,,~ ~ is ::1< , OC Qua Do ttl ca
~~ ! '. ~ I 'l'\
---- --- - - -- r', ~
r ---- I I ......
~""'j" .... "; \ ... !~
I I J I I I I I I I
.30 ¥-O 50 "0 70 80 1. Ro-roR. LENG-TH
FIG. 3.5.1
./ /
V
./ "","
-- -_.
N ,. UJ d) 0 c:t Q.
I ~~ I \ '~
I"'-J .
, I
Ie.
82720

POWER TURBINE AMPLITUDES, MILS (PEAK)
UNBALANCE
Amount & Location Shaft End Brg. 1 Brg. 2 Midspan Brg. 3
71.8 gm em (1 in oz)
I .022 mm .024 mm .011 mm .132 mm .215 mm
• 86 mils .94 mils .43 mils 5.18 mils .
8.47 mils 4th stage
71.8 gm em (1 in oz)
J .014 mm .019 mrn .010 mm .164 mm .138 mm
1 .57 mils .76 mils .41 mils 6.64 mils 5.44 mils 3rd & 4th stage ,...
143 • 6 gm em (2 in oz) .029 mm .038 mrn .021 mm .337 mm .276 mm
- ] I 1.13 mils 1.51 mils .81 mils 13.28 mils 10.87 mils
3rd & 4th stage
11,500 RPM
71.8 gm em (1 in oz)
1 .003 mm .009 mrn .003 mm .297 mm .068 mm
.11 mils .35 mils .12 mils 11.71 mils 2.69 mils 4th stage
71.8 gm em (1 inyOZ) .005 mm .020 mrn - .648 mm .076 mm
1 .20 mils .80 mils .015 mils 25.5 mils 2.99 mils 3rd & 4th stage
143 . 6 gm em (2 in oz)
1 .010 mm .041 mm .001 mm 1.295 mm- .152 mm
1 .40 mils 1.61 mils .030 mils 51. mils 5.99 mils 3rd & 4th stage
16,000 RPM
T55 POWER-TURBINE SENSITIVITY TO FOURTH TURBINE STAGE
UNBALANCE
TABLE 3.5.1
Turbine
End
.269 mm
10.59 mils
.157 mm
6.17 mils
.313 mm
12.33 mils
.067 mm
2.62 mils
.087 mm
11. 62 mils
.590 mm
23.24 mils

T55 BEARING LOADS
UNBALANCE
Amount & Location Brg. 1 Brg. 2 Brg. 3
71.8 gm cm 3120 N 2376 N' 7531 N
(1 in oz) @ 701.5 1hf .534.2 1hf 1693. 1hf 4th stage
71.8 gm em 2521 N 2259 N 4836 N
(1 in oz) couple 566.7 1hf 507.8 1hf 1087.2 1hf 3rd & 4th stage
11 ,500 RPM
Brg. 1 Brg. 2 Brg. 3
71.8 gm cm 1169 N 66 N 2396 N
( 1 in oz) @ 262.8 1hf 14.9 1hf 538.7 1hf 4th stage
71.8 gm cm 2682 N 83 N 2663 N
(1 in oz) couple 603. 1hf 18.7 1hf 598.7 1hf 3rd & 4th stage
16,000 RPM
TABLE 3.5.2
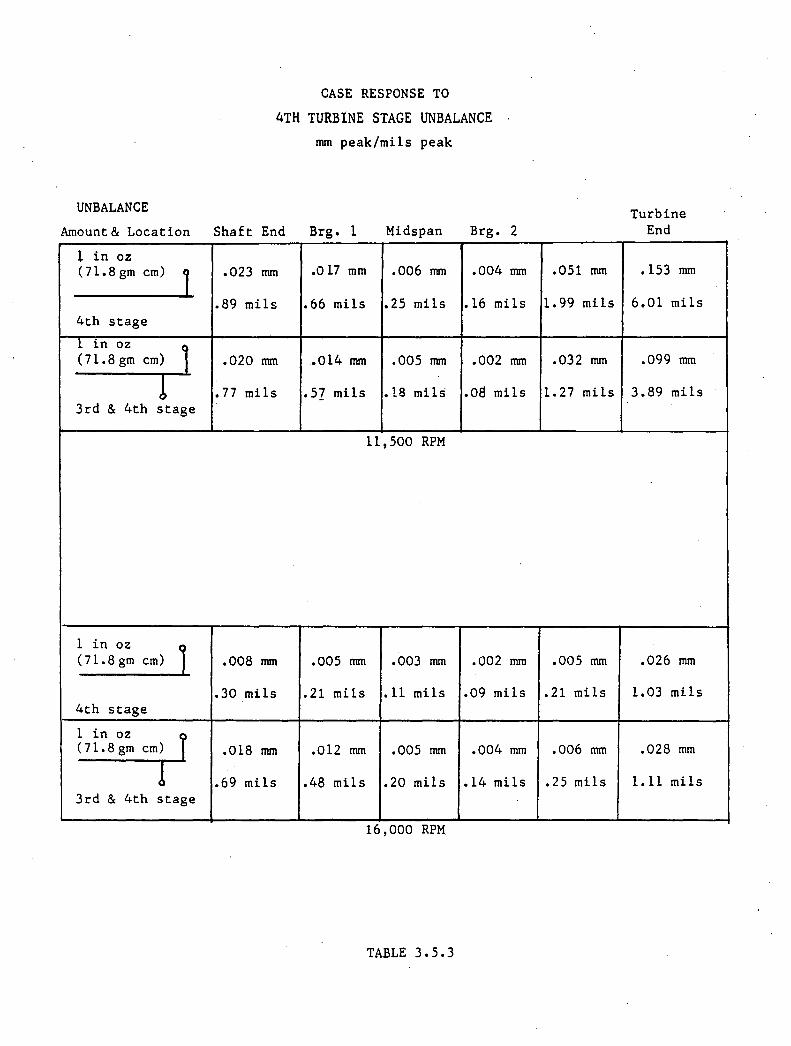
UNBALANCE
CASE RESPONSE TO
4TH TURBINE STAGE UNBALANCE mm peak/mils peak
Amount& Location Shaft End Brg. 1 Midspan Brg. 2
1 in oz (71.8 gm em) 1 .023 mm .017 mm .006 mm .004 mm
.89 mils .66 mils .25 mils .16 mils 4th stage
1 in oz
1 (71.8 gm em) .020 mm .014 mm .005 mm .002 mm
! .77 mils .57 mils • l8 mils .08 mils 3rd & 4th stage
11,500 RPM
1 in oz j (71.8 gm em) .008 mm .005 mm .003 mm .002 mm
.30 mils .21 mils .11 mils .09 mils 4th stage
1 in oz 1 (71.8 gm em) .018 mm .012 mm .005 mm .004 mm
! .69 mils .48 mils .20 mils .14 mils 3rd & 4th stage
16,000 RPM
TABLE 3.5.3
.051 mm
1. 99 mils
.032 mm
1.27 mils
.005 mm
.21 mils
.006 mm
.25 mils
Turbine End
.153 mm
6.01 mils
.099 mm
3.89 mils
.026 mm
1.03 mils
.028 mm
loll mils

UNBALANCE Shaft End
Random 1.25 mils Unbalance .032 mm
Corrected @ .77 mils ST. 29 & 3rd
Stage .020 mm
Corrected @ .68 mils ST. 33 &. 3rd
Stage .017 mm
Corrected @ .65 mils ST. 36 & 3rd Stage .017 mm
Random 1.55 mils Unbalance .039 mm
Corrected @ 1.52 mils ST.29 & 3rd Stage .039 mm
Corrected @ 1. 78 mils ST. 33 & 3rd Stage .045 mm
Corrected @ 1.90 mils ST. 36 & 3rd Stage .048 mm
POWER TURBINE AMPLITUDES
FOR STATIC CORRECTION WEIGHTS
(mm, peak/mils peak)
ST. 4 Brg. 1
1.09 mils .028 mm
.63 mils .016 mm
.55 mils .014 mm
.53 mils .013 mm
.92 mils .023 mm
.80 mils .002 mm
.60 mils .015 mm
.77 mils .020 mm
ST. 19 Brg. 2
.60 mils
.015 mm
.39 mils
.010 mm
.38 mils .010 mm
.37 mils .009 mm
11,500 RPM
.19 mils .005 mm
.17 mils .004 mm
.18 mils .005 mm
.19 mils .005 mm
16,000 RPM
TABLE 3.5.4
ST. 32 Midspan
1.91 mils .049 mm
.68 mils .017 mm
1.96 mils .050 mm
2.66 mils .068 mm
20.26 mils .515 mm
16.44 mils .418 mm
35.9 mils .912 mm
44.66 mils 1.134 mm
ST. 44 Brg. 3
6.95 mils .177 mm
.95 mils .024 mm
.82 mils .021 mm
.75 mils .019 mm
.51 mils .013 mm
.80 mils .020 mm
2.11 m11s .054 mm
3.07 mils .078 mm
Turbine End
9.99 mils .254 mm
1. 78 mils .045 mm
2.25 mils .057 mm
2.80 mils .071 mm
11.05 mils .281 mm
6.52 mils .166 mm
14.15 mils .359 mm
19.45 mils .494 mm

SHAFT END
Random 1.25 mils Unbalance .032 mm
2 Plane .16 mils Balance .004 mm
Random 1.55 mils Unbalance .039 mm
2 Plane .30 mils Balance .OOB mm
POWER TURBINE AMPLITUDES
FOR INFLUENCE COEFFICIENT BALANCE
(mm peak/mils peak)
Brg. 1 Brg. 2 MIDSPAN
1.09 mils .6 mils 1.91 mils .028 mm .015 mm .049 mm
.09 mils .48 mils 1.43 mils .002 mm .012 mm .036 mm
11,500 RPM
.92 mils .19 mils 20.26 mils .023 mm .005 mm .515 mm
.24 mils loll. mils 5.98 mils .006 mm .028 mm .152 mm
16,000 RPM
TABLE 3.5.5
Brg. 3 ROTOR END
6.95 mils 9.99 mils .177 mm .254 mm
1. 84 mils ·3.73 mils .047 mm .095 mm
.51 mils 11.05 mils .013 mm .281 mm
.96 mils 4.B2 mils .024 mm .122 mm

I. Iii =§i "
.127_ 5.0
.064r- 2.5
o
PROBE 6
PROBE 2
PROBE 1
5 10
SPEED, RPM x 10 -3
FIG. 3.6.1 T55 SN 268922 VIBRATION AFTER BALANCING
PROBE 5
.,-/-PROBE 1
/ ,-- - PROBE -6
15 16
82685

I. III ;;t .. a
5.0
2.5
o
PROBE 6
PROBE 2
PROBE 1
5 10
SPEED, RPM X 10 -3
FIG. 3.6.2 T55 SN U00559 VIBRATION AFTER BALANCING
PROBE 5
/ PROBE 6
-PROBE 1
15 16
82684

II ~;l1
III ;I§~ a
1.0
.9
. 8
.1
.b
.5
.4
.3
.1..
• I
- -- -- A·H:er losta"at,on 0+ -"'.9h speed ba \Qn ced tlArb~ne .
/ /
;~V4
,....0- -8/ /"
/8/
/" ./
~ fY. /"1 0-- - --{!}- -
15 80 85 90 95
% N' SP££D
FIG. 3.6.3
100
82683

Cl N ,.. N co

fUN: T02RJ30024Z GAS TURBINE ENGINE TEST LOG SHEE
SER.NO.LE19650 ·SEG.NO.0843.9088 REC NO.9 F/C SIN 68250 F/F DEVIAT CURVE TECH DATA SET* 11 LIMIT TECH DATA SET* 11 LIMIT MODIF1CATIO
.. ---...... - - _ ... -------.. .. .... . . ", . - _.
SIS START STOP START STOP START STOP MGT 1112 1230
---ET-l9·:0--:34.4-1o~9·-45-.-3-------------·--
TOD 1321 1323 1327 1400 OS GOV STOPS .%NI XN11 WF TEMP PB TOD ET ,.
: HIGH: -- --------LOW:
ACCEL CHECKS XNI SECS MGT DECEL SECS TOD ET
~
GI r FI TO Fl. TO
I 75.3 94. G .20 .20 1 .10 I 0 79.a 94.9 .10 .20 .9· :.----r.S~~lf:_2-- • rf)- --:20- -:9fr-
90.1 89.5 .10 .30 .90 90.·1 95.4 .10 .20 .90
---""'9'"'~ . .2 99. I • f e .3"t> :TG 93 .-0 10~. 3 .1 G .50 1 .10
4· OD EI .20 354 :04 .20
--.-:30 ----------. • 4 0:;'
.40 -:50· -
.80 ___ 9_4....,.-8 94.6 ._._~~._. _._ •. ~~. __ .. __ .•. ~G
SUF:GE CHEer, NOT at, .J_ .•. 2~_._ ..... ____ .. ________ .. _____ _
OIL conSUMPTION OK _. \:l-l~3_0.MEF; A~B~:I-tEJ.:t\ .. _ t'lQI_QK .... ___________ ._._. __ . __ .. ____________ _
BLEED BAND CLOSES AT .0 XN1
-----._-
. _ .. _____ .. _ .. ___ . ___ .. ___ ..FIG ... _.3...6 ... .2.._ ._. __ ..
Engine Test Data with High Speed Balanced Turbine ------_. ----------_ .. _._--_. ----... -- -_. __ .. _- - - ..... -- ----------- ._ ...
------------_.---------_ .. ----_._-----...;.---
----------------
--~ ---- ------_._._-----.

I. ~~E i~n tgl =.~ o
COUPLER
DRIVER
I
OPTICAL TACHOMETER
COUPLER
HIGH SPEED TRANSMISSION SPINDLE SHAFT
VACUUM ENCLOSURE
SPLIUE LOCATION
POWER SHAFT
FIG. 3.7.1 SPLINE TEST HARDWARE AND INSTRUMENTATION LOCATION
{
HORIZONTAL DISPLACEMENT SENSORS
{
VERTICAL DISPLACEMENT SENSORS
82682

00 INDEX POSITION
TURBINE' SHAFT &--'"7
DRIVE SHAFT &
-- DRIVE SHAFT PITCH CIRCLE
130 0 INDEX POSITION
90 0 INDEX POSITION
MEASUREMENT POINT. TYP 8 PLACES
MEASUREMENT
T1l1!BINE SIIAFI-'\." MEASUREMENT CIRC~
MEASUREMENT
270 0 INDEX POSITION
FIG. 3.7.2 PITCH CIRCLE SCHEMATICS FOR TURBINE SN 265503
- _CHANICAL TlCHNOI.OGY .1. INCOtI"""ATlD
83366
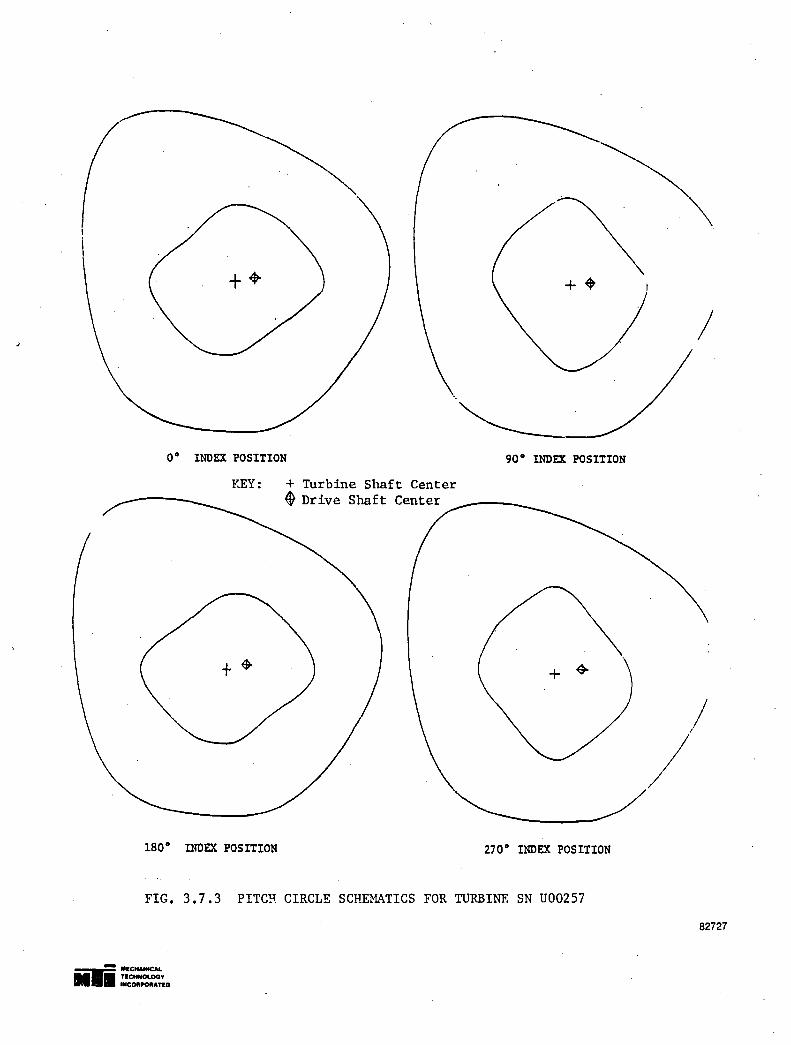
00 INDEX POSITION
KEY: + Turbine Shaft Center ~ Drive Shaft Center
180 0 INDEX POSITION
++
90 0 INDEX POSITION
270 0 INDEX POSITION
FIG. 3.7.3 PITC~ CIRCLE SCHEMATICS FOR TURBINE SN U00257
- IIICHANICAL TeCHNOLOGY
••• INCOIIPOIIATeD
/
/ I
/ /
82727

I. ~;:!
Ui =g~ -C/l ;: ..
WW a C/l~ :;1l' POW
t:I
-~ z~
~~ Uk: :3,..:1 Po
H ~~ t:I
360 I I. .J - I .Jo .. I.-
270+_-1-'1· .... ·1._ .. .-
180
9
o ' ......, . =r=:- - ~ J - .-- , U
8
7---6
I) +--+-·--t--.J--t---"--+--II~!I-1-i 1--1
0' • • DI •
5 •
4+----
3
:u-"-~~ ~~-~ frf ~ J __ B.~'
o 1 2
L..a....L&....a Ie • II
~~'. .. . 3 4 5 6 7 8 9 10 11 12 13 14
ROTATIONAL SPEED. RPM X 10-3
FIG. 3.7.4 POWER S!~FT VERTICM~ VIBRATION, PROBE 5, SN265503
15 16
KEY TO INDEX POSITION:
0° 900-----~
180° ••••••••••••••• 270°_. __ ._. __
82681
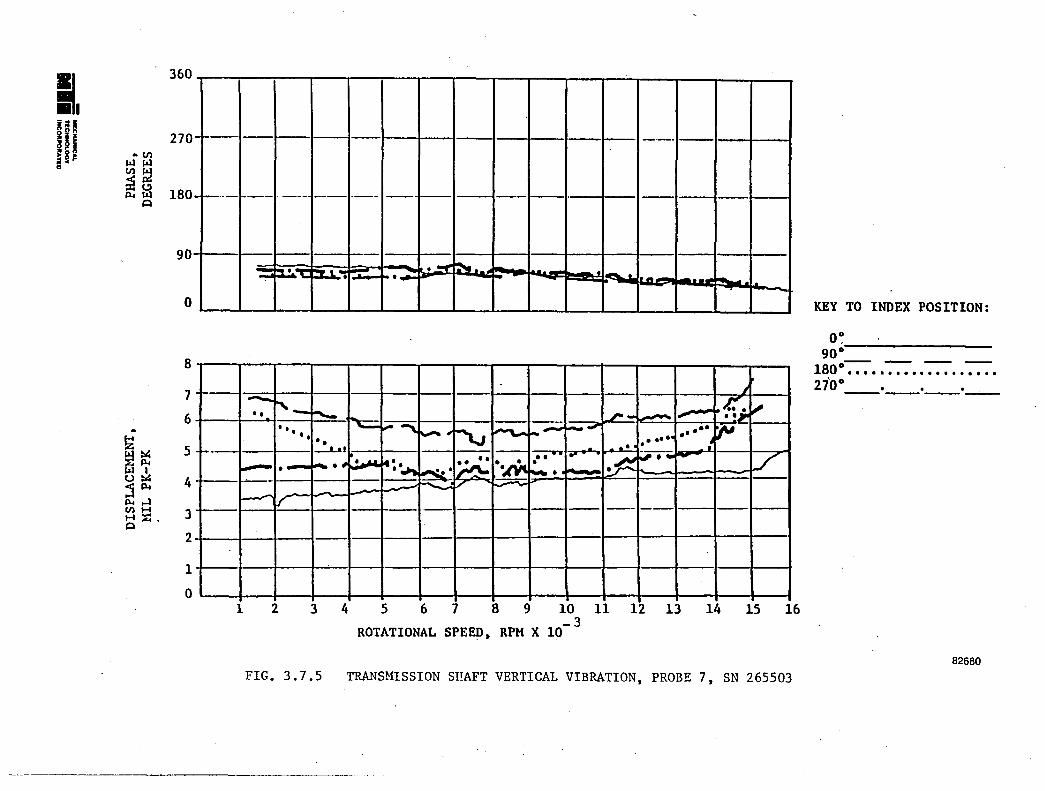
I. ~;a inn
dl ;;I .. o
"U) I>ll>l
360
270
U)~ ~(!) Po I>l 180 ~
90
o
8
7
6 .. ~
~~ 5
u~ 4 jPo Po~ U)H 3 H-~ -.
2
1
0
-f------- -- I--- _._ . . _- -
-f----- -- ---- ---- --- --I---
-= I=J.!. .... ~ 1.'"; r.:a:;....; .~ ~" ~ 1-'-~ -r- -.L
' .. - - -. I-.
------ i ---.~;
--.. ~- L.--I~ ~ """- ~- • • •• ----'--~~
~ ~ L-.... ." ." "JU •• ~, - ... - .' • •• '. ~ • t ---L. •• 1- ........ ~ ~ .. ~ V
f---~ ft: ..... I?j; .~ • ~ ~ • l.-. •
!-' -" . ""'" . X I-- -'-- - - I ...... ~ l.-V- ---- I- t-1--
.-
1 2 3 4 5 6 7 B 9 10 11 12 13 -3
14 15 16
ROTATIONAL SPEED. RPM X 10
FIG. 3.7.5 TRANSMISSION SI!AFT VERTICAL VIBRATION, PROBE 7, SN 265503
KEY TO INDEX POSITION:
O~ 90°-------------------180o~ •••••••••••••••• 2iOo • • • ------ ------ ------ ------
82680
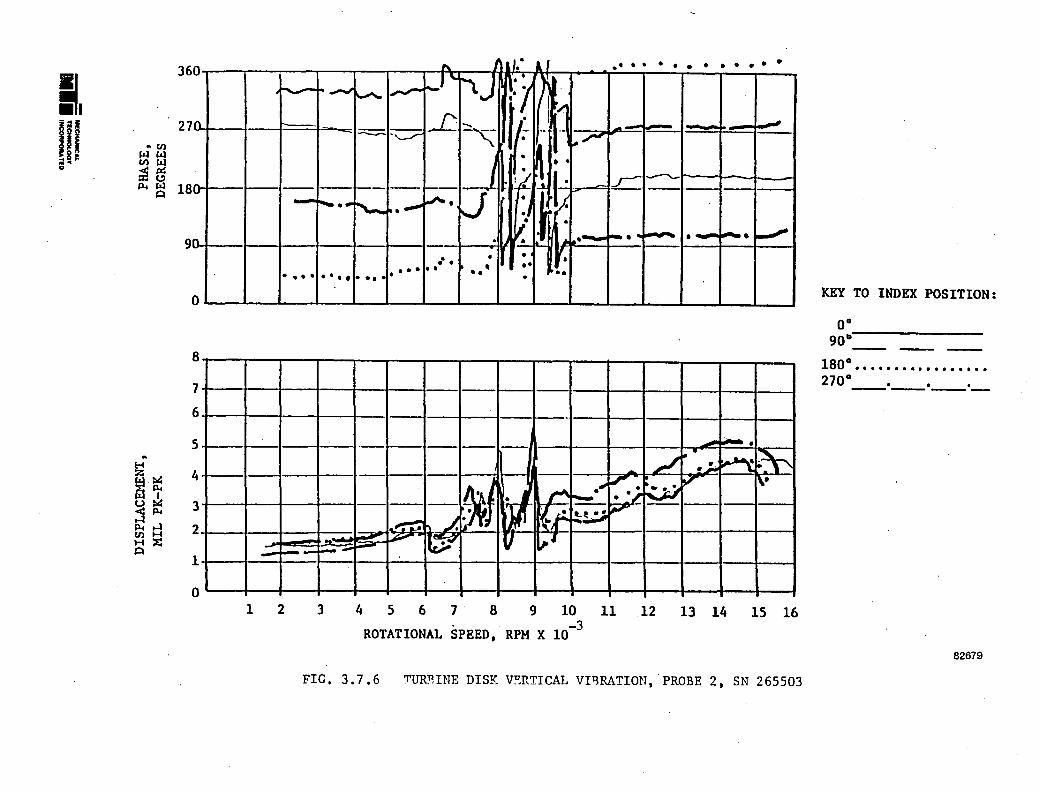
I. ~iE
'81
;;t .. ~
"
.. til WW tIl~ ;'it!)
36
27
Po. W 18 A
9
8
7
6
5 .. H Z 4 ~~ u~ 3 jPo.
Po.~ 2 tIlH H::C A
1
0 1 2
• • • • • • • • •
KEY TO INDEX POSITION:
0° 90"-------------
180 0 •••••••••••••••••
270° ___ 0_0
_0 __
3 4 5 6 7 8 9 10 11 12 13 14 15 16 . -3
ROTATIONAL SPEED, RPM X 10 -82679
FIG. 3.7.6 'T'lJR1'lINE DISK V~RTICAL VnRATION, . PROBE 2, SN 265503

II ~ii Ih til SoC .f.Il
f.IlliI tIl~
~~ Po.t:::I
-f-4 z
~~ u ~.
jPo. Po.,..:a tIlH H)! t:::I
360
270
180
90
0
_ I."'" 1 ~I I 1 " •• '. (! i II
~ I I 'I~: '. j.'~: "" -. -..... .. . .. , \ 1.
. I -J f~t~~ I. y~ 00
____ " ~o _.. 0.' • , JO.. .... •• ~. 0, '" " • :
.... ~:7j' .0 \. .. ". ." -~-....... 1-.1 _,,~I~~L· ... ~ I::::.: I ~
____ ~ - rr.:..1 -1- --I I ~"~ I
8
7
6
5
4
3
2
1
0
,-- I T
'-
I I 1 1
1-1
- ~
1 1 T-
--~
- 1--1-1 I I
-~
. I
1--I
- I T ~ .~I--I-
-I-
I I __ L" I-- -~I-I-- _ - --1-1- --'
J I
11 I_L-L -
I T-
.l-T- -II 1--1 1 ~ - -_ _I 1 12]
l-
•••• ~h--o- . • __ • /' -. --~ o.-v-/ • ~ ____ • ' h
"-..
1-+--.... _ .~. '~r L.-_ "'< 1......--- 1/. L? I • 1 -. - ..c.:. -- • • - ~ I I • _- -...... r:;::;: • •• .1--, .. ,.. -
1 I 'i~~;'~' r~ 1 1 t-'Io '. -r:- • I J ." '.- ~ ~ I I I 1 2 3 4 5 6 7 8 9 10 11 12 13 14 15 16
ROTATIONAL SPEED, RPM ~ 10-3
FIG. 3.7.7 POHER SHAFT VERTICAL VIBRATION, PROBE 5, SN U00257
KEY TO INDEX POSITION
0° -----------------90° ____ _
180° ••••••••••••••••• 270° __ , __ 0 __ 0 __ ,
82678

I. 36 0
~iE 27 i " CJ i 109" aU)
~ .. 1: WW 0 U)~
~(!)
0.
Po.~ 18 ~ 0 --:--- ---- --- ;- -
'. -9 .... t-- -\AoI j-I.' •• " ~, ... . .,~
. '---"- • [) • . -t- ~ - !-
Ioiiii. _ - -. - - ~
) KEY TO INDEX POSITION:
0°
8 90°:::-_---_---_
180° •••••••••••••••••
7 270° __ ._. __ • __
6 --- ---1-"
5 a
~ m~
4
u~ jPo. 3
u£. • •••• • • • ...... •• • • • • a.:.. ~ .. ~ ~ ... ., .. .~ ~ !LA..' • .. ,- ~ - - -r--" ----- .---- ~ ~ -, ~. .- -- ---- . • ~ .~ .-Po.~ 2 U)H
H~ ~
1
0 1 2 3 4 5 6 7 8 9 10 11 12 13 14 15 16
ROTATIONAL SPEED, RPM X 10- 3
82677
FIG. 3.7.8 TRANSMISSION SHAFT VERTICAL VIBRATION, PROBE 7, SN U00257
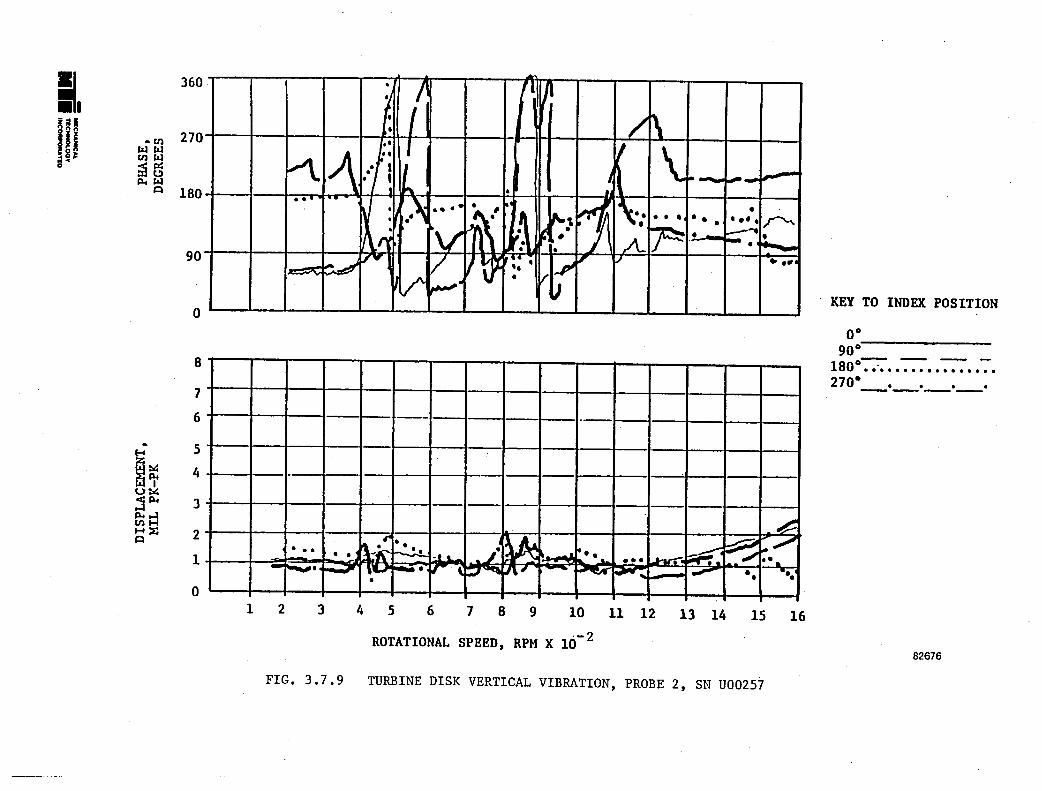
II 360
~~E if 270 a I -en "gn ~~ ~ .. ~ en~ 0 ;j~
P-.~ ~ 180
0
90
N-
•
I II fl 1- ~
/ ~ • .' I \ . .1\ ., I
,..,,-K. 1 l j l 1--__ r-"'"-.. , , ,
'" • ~,t
~~ 1\·,- -• • '. ..\ .' .. - , r- .. . . , I •• .. ' . ;--. ...
• ~~. I~ •
~ 1--""' .:.... ~ ,. r 1 __
\ri 'v r:.\ A r- I -""'~ •
• ,e' t/ t~ , "' . v'; I' ./
fo-~ !''''j I. ~
-- V ~. lJ KEY TO INDEX POSITION
0°
8 90°.-_--_---_---
180 0 • • ' •••••••••••••••
7 - 270°_. __ ,_0 __ ,
6
.. 5 H
~~ 4 U~
jP-. 3 P-....:I en~ ~~ 2 ~
1
0
---b-·r-.- / ,--4--.-t---lI--~I-- _I -'---r---L----t---- ---- -- £.
~~ ......... '. .,~ A.. "'~"~'" _~..rf:. :' ....... ~~ ...... j..., ••• 1_0 . .I ~ __ ..,.. "I • •• •• - ~ LlI..... - ~ ~ r I _ - I'" 'P "'<1 .... -# ~'~~-I- I
I
1 2 3 4 5 6 789 10 11 12 13 14 15 16
ROTATIONAL SPEED, RPM X 10-2 82676
FIG. 3.7.9 TURBINE DISK VERTICAL VIBRATION, PROBE 2, SN U00257

10
o
10
!I 7 r ~ . !I r i 5
Ii ::t 4
. ~ S
a
KEY:
VIBRATION AFTER TASK 3 HIGH SPEED BALANCEi-----,
VIBRATION DURI:NG----. SPLINE TESTS
PROBE 2. TURBINE SN 265503
saaa __ saaa _ 70CXI Iaaa taIO loaaa
PROBE 2. TURBINE SN U00257
10
PROBE 5. TURBINE SN 265503
10
,
• !I 7 r ~ . ~ i • • 4
~ S
o 1000 zaaa saaa __ saaa _ 70CXI .aaa taIO IDC
PROBE 5. TURBINE SN U00257
FIG. 3.7.10 VIBRATION RESPONSE AFTER HIQI SPEED BALANCE AND DURING SPLINE TESTS
•• i~=D 831750
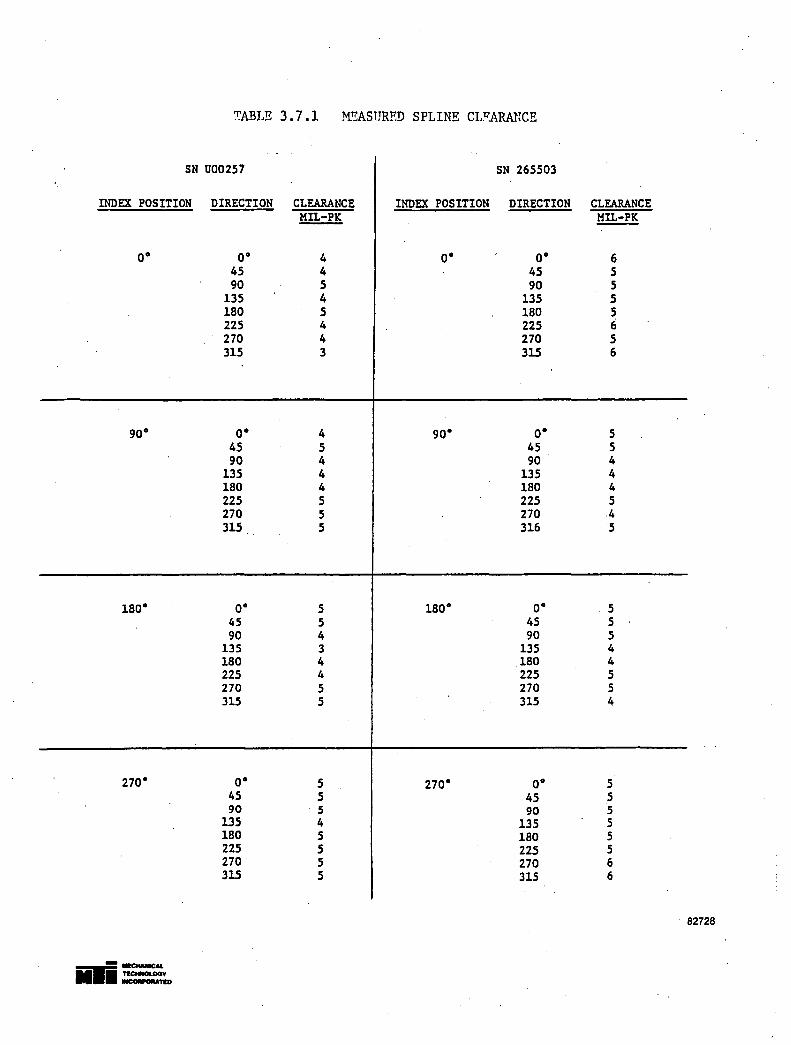
~ABLE 3.7.1 ~ASURF.D SPLINE Cr.:r<:ARANCE
SN U00257 SN 265503
INDEX POSITION DIRECTION CLEARANCE INDEX POSITION DIRECTION CLEARANCE MIL-PK MIL-PK
O· O· 4 O· O· 6 45 4 45 5 90 5 90 5
135 4 135 5 180 5 180 5 225 4 225 6 270 4 270 5 315 3 315 6
90· O· 4 90· O· 5 45 5 45 5 90 4 90 4
135 4 135 4 180 4 180 4 225 5 225 5 270 5 270 4 315 5 316 5
180· O· 5 180· O· 5 45 5 45 5 90 4 90 5
135 3 135 4 180 4 180 4 225 4 225 5 270 5 270 5 315 5 315 4
270· O· 5 270· O· 5 45 5 45 5 90 "5 90 5
135 4 135 5 180 5 180 5 225 5 225 5 270 5 270 6 315 5 315 6
" 82728
---••• ==:~

End of Document