mt417 – week 10 - department of geological and ... · mt417 – week 10 use of radar for ... •...
TRANSCRIPT
Mt417 – Week 10
Use of radar for severe weather forecasting

Single Cell Storms (pulse severe)
• Because the severe weather happens so
quickly, these are hard to warn for using radar • Main Radar Signatures: i) Maximum reflectivity core developing at
higher levels than other storms ii) Maximum top and maximum reflectivity co-
located iii) Rapidly descending core iv) pure divergence or convergence in velocity
data
Z
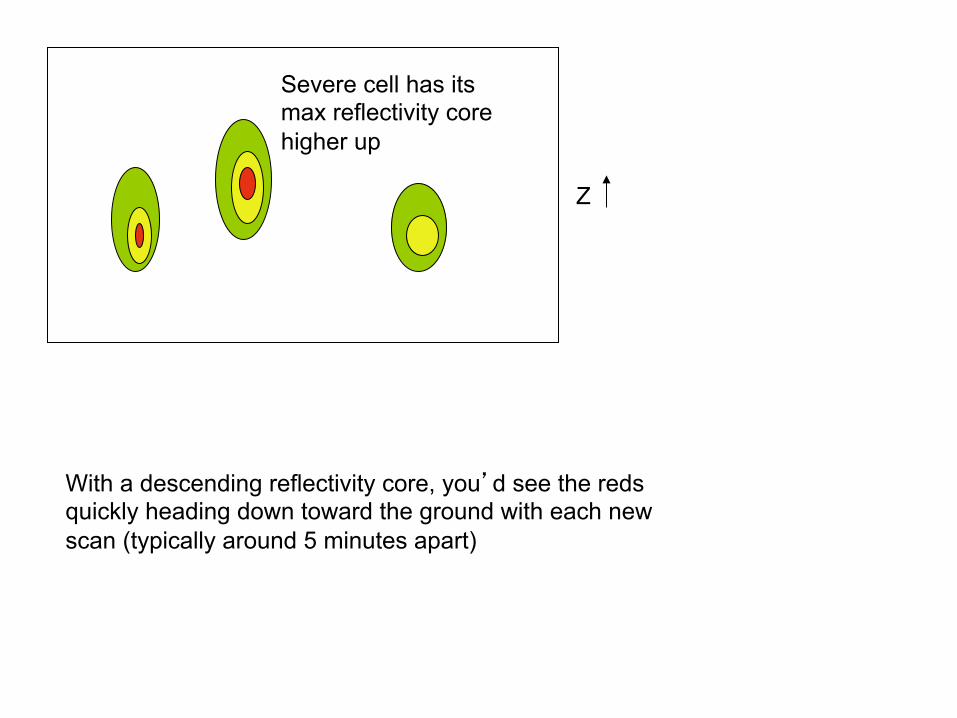
With a descending reflectivity core, you’d see the reds quickly heading down toward the ground with each new scan (typically around 5 minutes apart)
Severe cell has its max reflectivity core higher up

Small Scale Winds - Divergence/Convergence -
Divergent Signature Often seen at storm top level or near the
ground at close range to a pulse type
storm
Convergence would show
colors reversed
Note the position of the radar relative to the
velocity signatures. This is critical for proper
interpretation of the small scale velocity data.
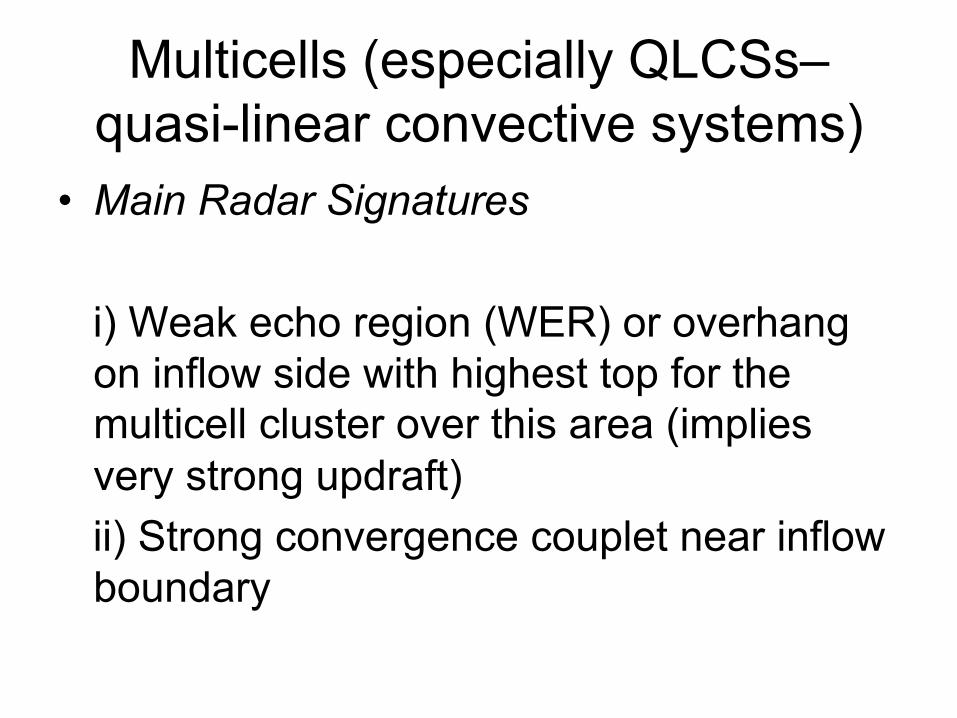
Multicells (especially QLCSs– quasi-linear convective systems)
• Main Radar Signatures
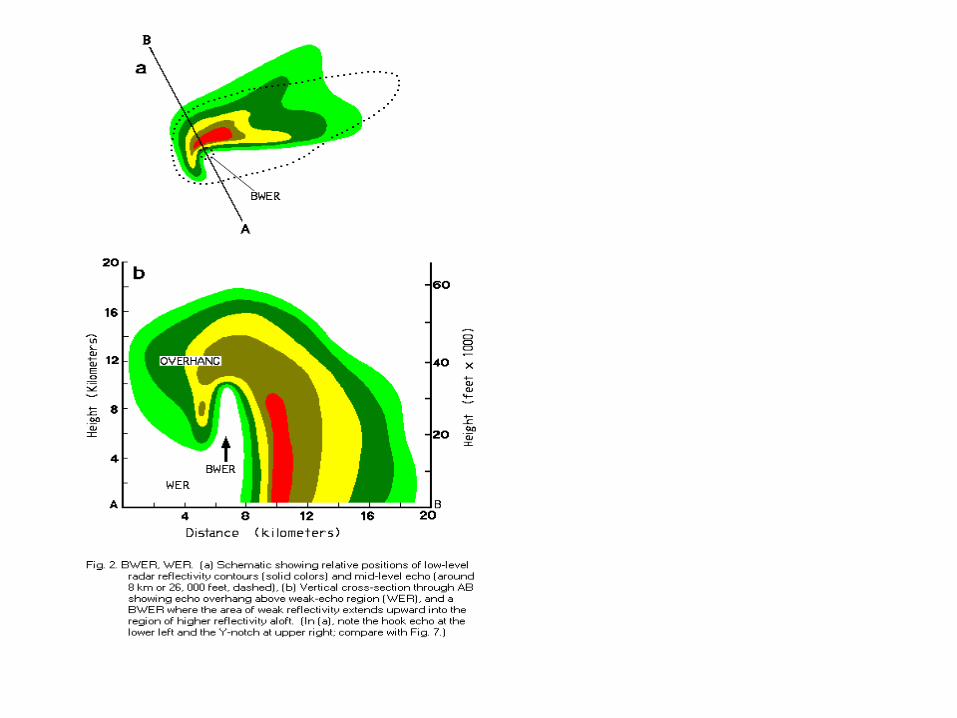
i) Weak echo region (WER) or overhang on inflow side with highest top for the multicell cluster over this area (implies very strong updraft)
ii) Strong convergence couplet near inflow boundary
Weak Echo Region
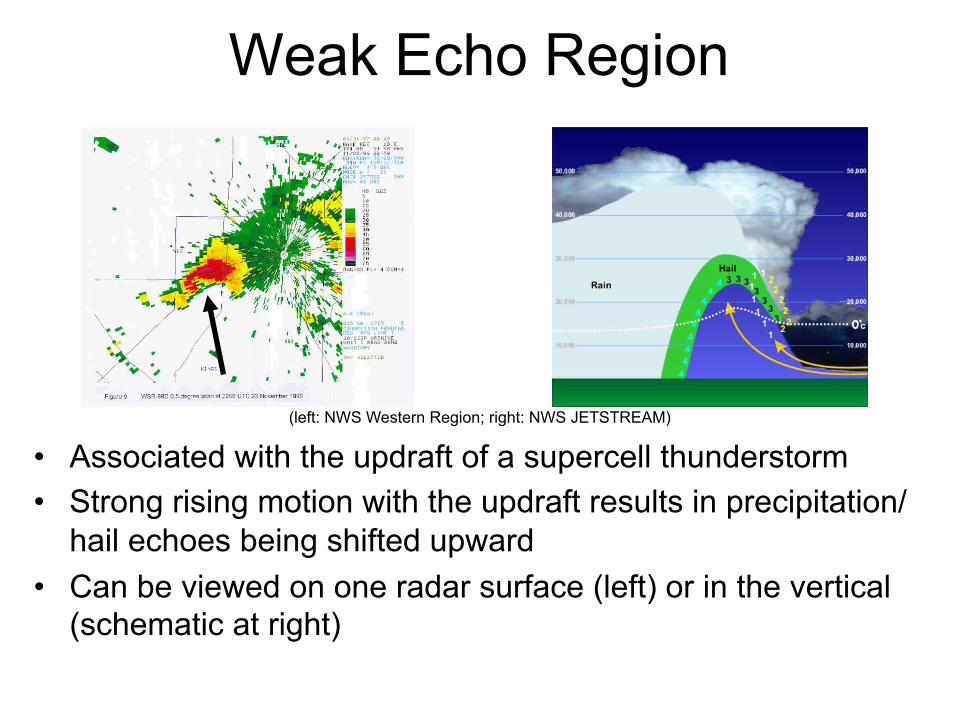
• Associated with the updraft of a supercell thunderstorm • Strong rising motion with the updraft results in precipitation/
hail echoes being shifted upward • Can be viewed on one radar surface (left) or in the vertical
(schematic at right)
(left: NWS Western Region; right: NWS JETSTREAM)

Crude schematic of a weak echo region
Strong updraft is responsible for keeping hydrometeors (hail,ice,rain) suspended aloft
Z
Derecho Main Radar Signatures i) rear-inflow notches in reflectivity images ii) rear-inflow jet in velocity data iii) Line Echo Wave Pattern (LEWP) where a segment of a squall line will suddenly accelerate iv) reflectivity in low-levels “eaten away” at rear by the rear-inflow jet
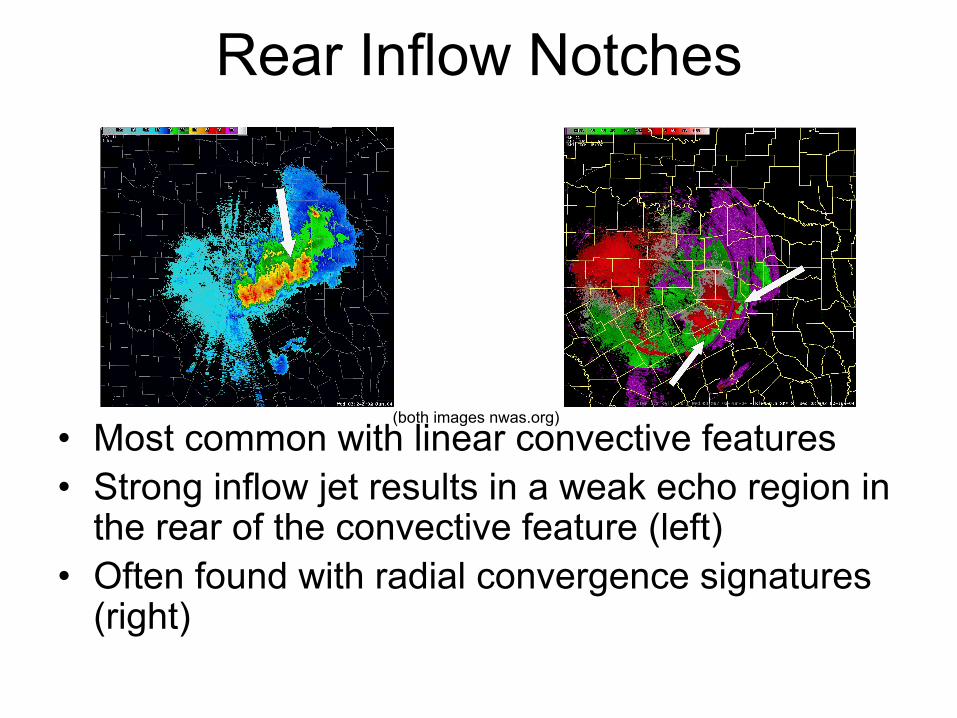
Rear Inflow Notches
• Most common with linear convective features • Strong inflow jet results in a weak echo region in
the rear of the convective feature (left) • Often found with radial convergence signatures
(right)
(both images nwas.org)
Bow Echoes
Main Radar Signatures i) cell becoming more linear and accelerating ii) rotating comma head and increasingly strong reflectivity gradient on leading edge iii) overhang near the head region with max top over overhang iv) rear-inflow notches

Rotating comma head
Worst non-tornado winds
Tornadoes may occur not only in comma head but all along leading edge of bowing part – must look closely at radar data for wiggles in reflectivity or tiny hook-like appendages sticking out
Threats in Multicells
• Remember that hail and severe wind are the primary threats in multicells
• But… up to 40% of tornadoes may also occur in multicells (with remaining 60% almost all from supercells)
• In multicells, it is difficult to warn for tornadoes – must look very closely at radar reflectivity and velocity to see evidence, usually with little reflectivity “tags” along front of line
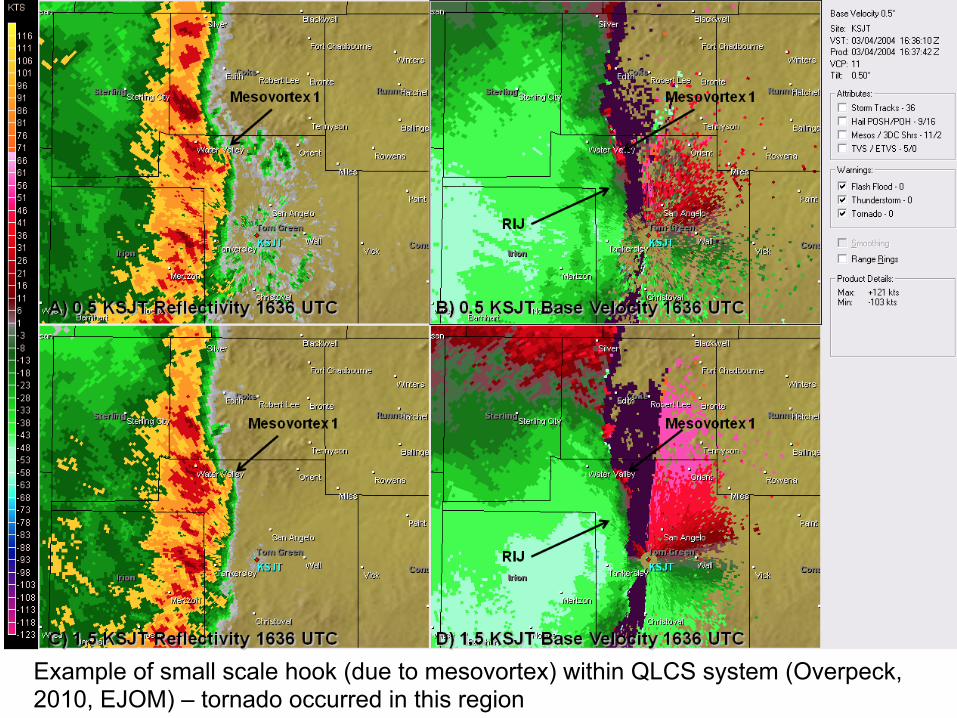
Example of small scale hook (due to mesovortex) within QLCS system (Overpeck, 2010, EJOM) – tornado occurred in this region
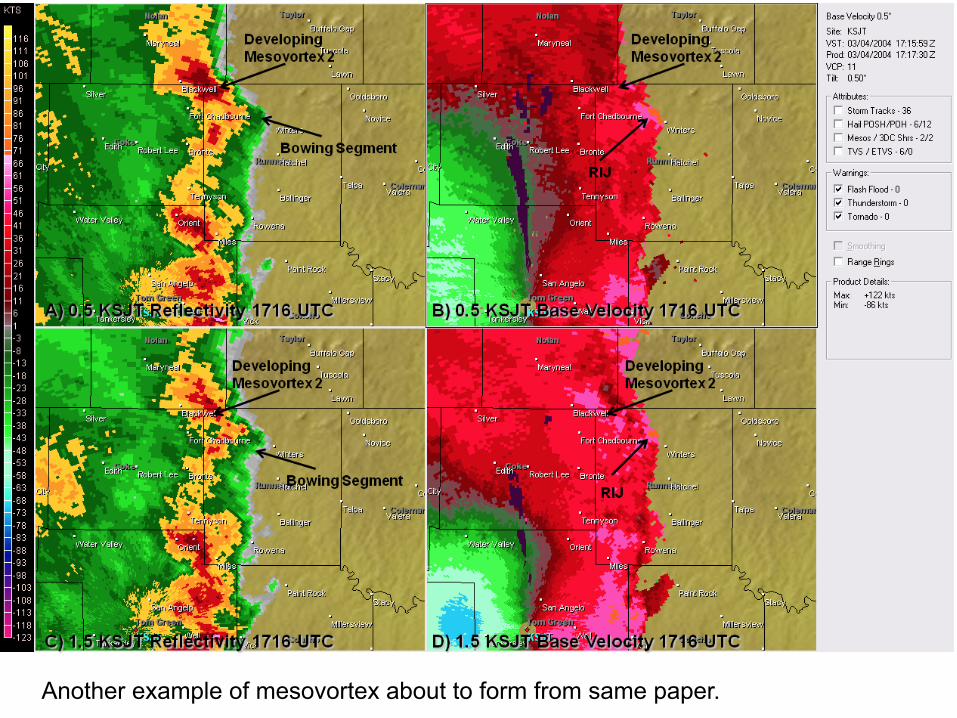
Another example of mesovortex about to form from same paper.
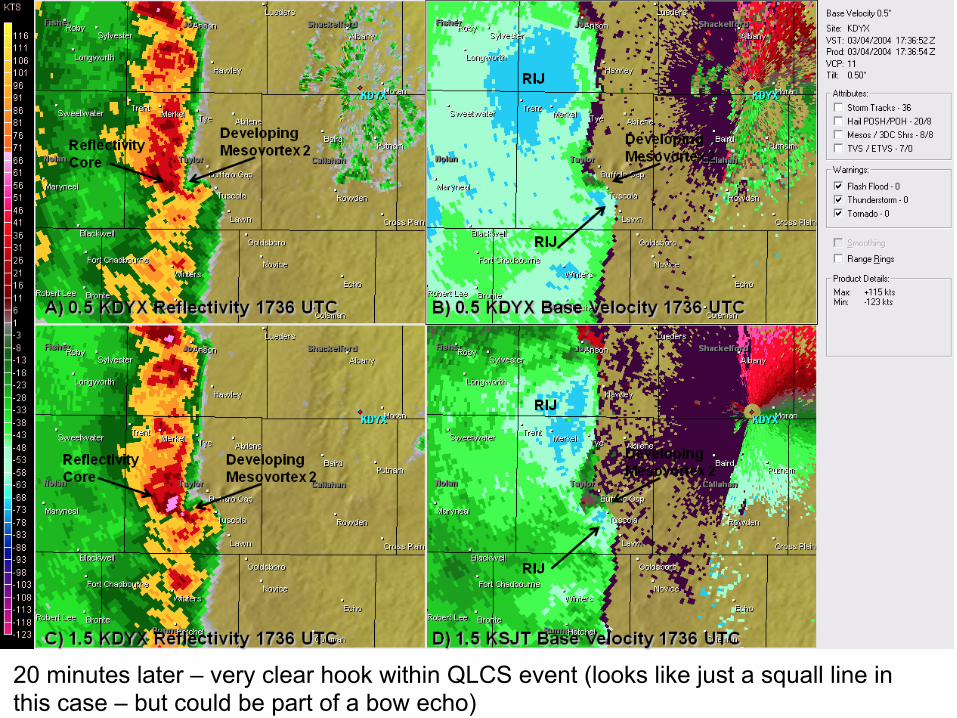
20 minutes later – very clear hook within QLCS event (looks like just a squall line in this case – but could be part of a bow echo)

Supercells • Main Radar Signatures • i) very strong reflectivity gradient on inflow side • ii) hook echo in low-levels (especially evident in
classic supercells) • iii) BWER (Bounded Weak Echo Region) • iv) max top over BWER • v) overhang on inflow side • vi) rotation in midlevels (mesocyclone) • vii) flanking line showing rear-flank downdraft
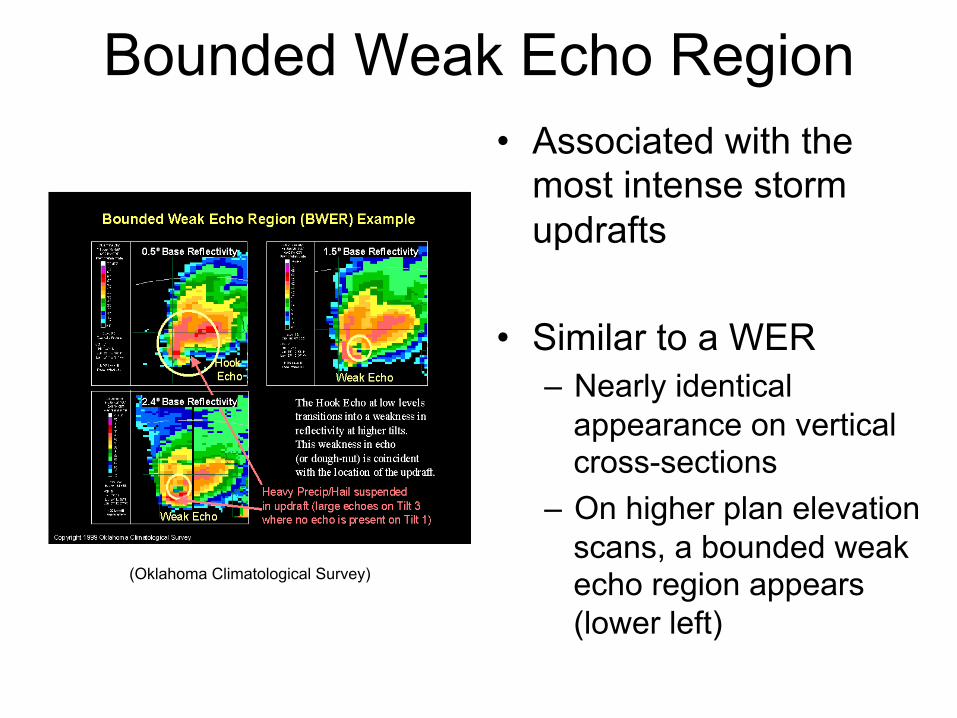
Bounded Weak Echo Region • Associated with the
most intense storm updrafts
• Similar to a WER – Nearly identical
appearance on vertical cross-sections
– On higher plan elevation scans, a bounded weak echo region appears (lower left)
(Oklahoma Climatological Survey)

Classic Bounded Weak Echo Region in a RHI scan (range-height indicator)
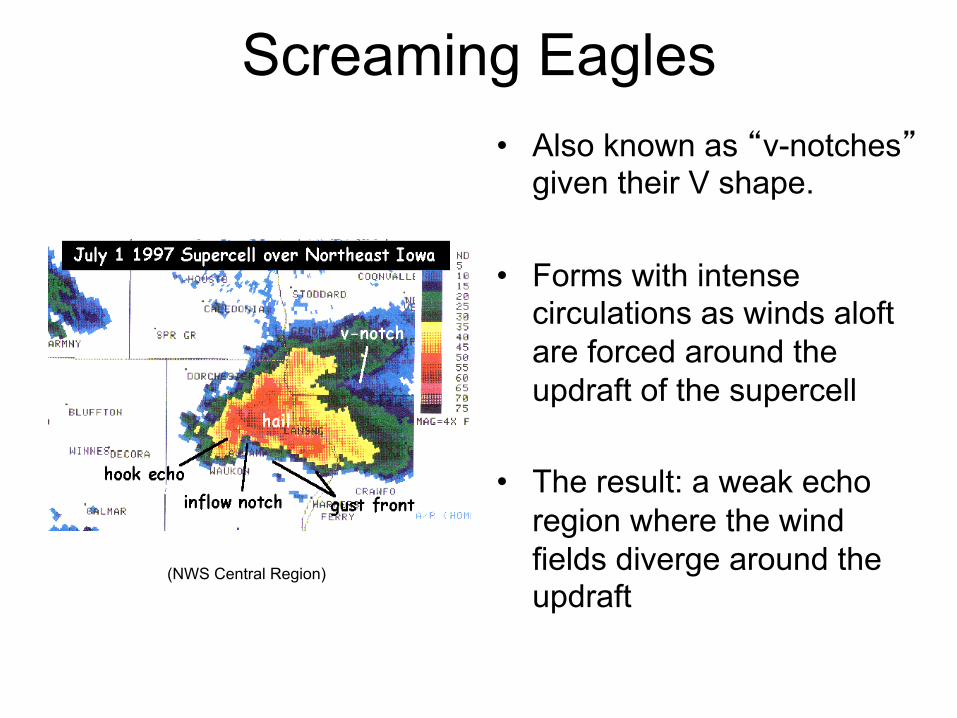
Screaming Eagles • Also known as “v-notches”
given their V shape.
• Forms with intense circulations as winds aloft are forced around the updraft of the supercell
• The result: a weak echo region where the wind fields diverge around the updraft
(NWS Central Region)
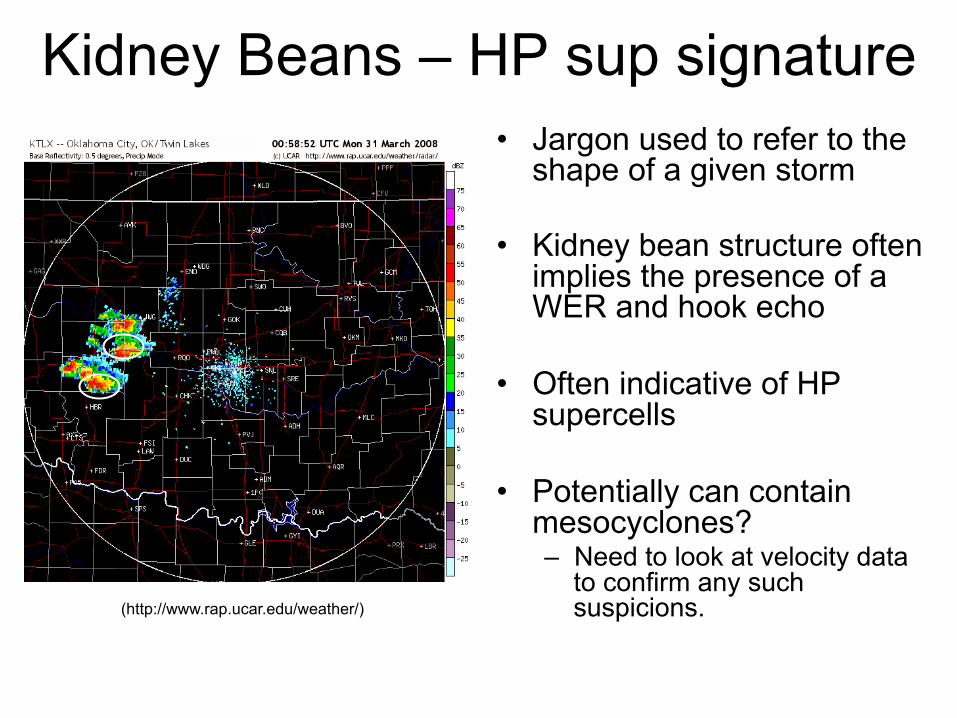
Kidney Beans – HP sup signature • Jargon used to refer to the
shape of a given storm
• Kidney bean structure often implies the presence of a WER and hook echo
• Often indicative of HP supercells
• Potentially can contain mesocyclones? – Need to look at velocity data
to confirm any such suspicions. (http://www.rap.ucar.edu/weather/)
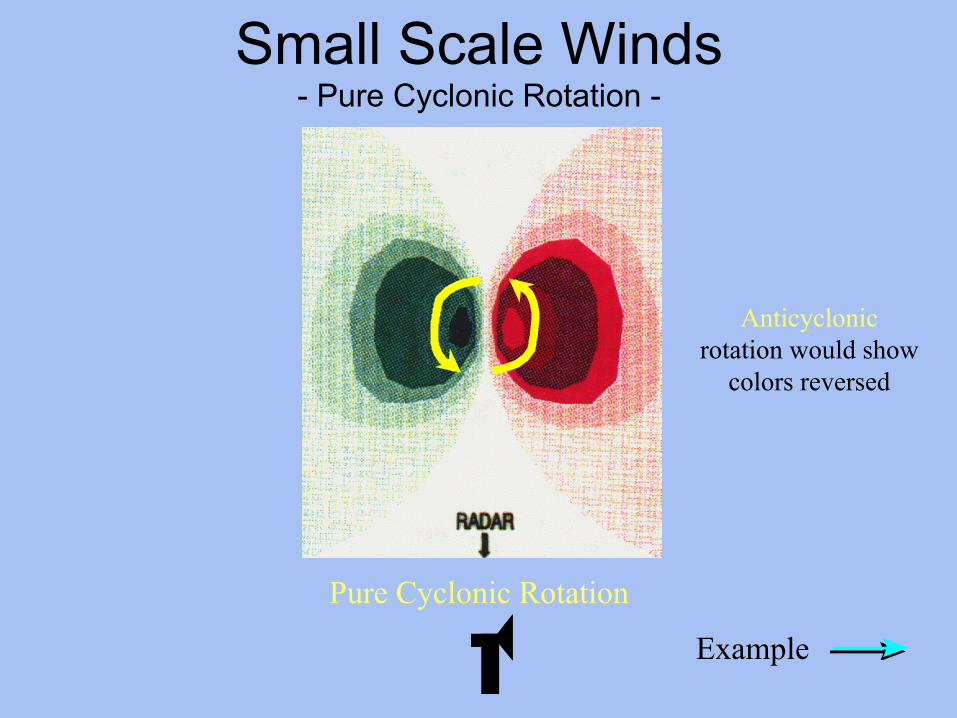
Small Scale Winds - Pure Cyclonic Rotation -
Pure Cyclonic Rotation
Anticyclonic rotation would show
colors reversed
Example
Range 0 120 nm(example)
''
'
'
Weak inbound, weak outbound
Rotation too small to be resolved
Stronger inbound than outbound
Strong inbound, strong outbound
Azimuth 3
Azimuth 2
Azimuth 1
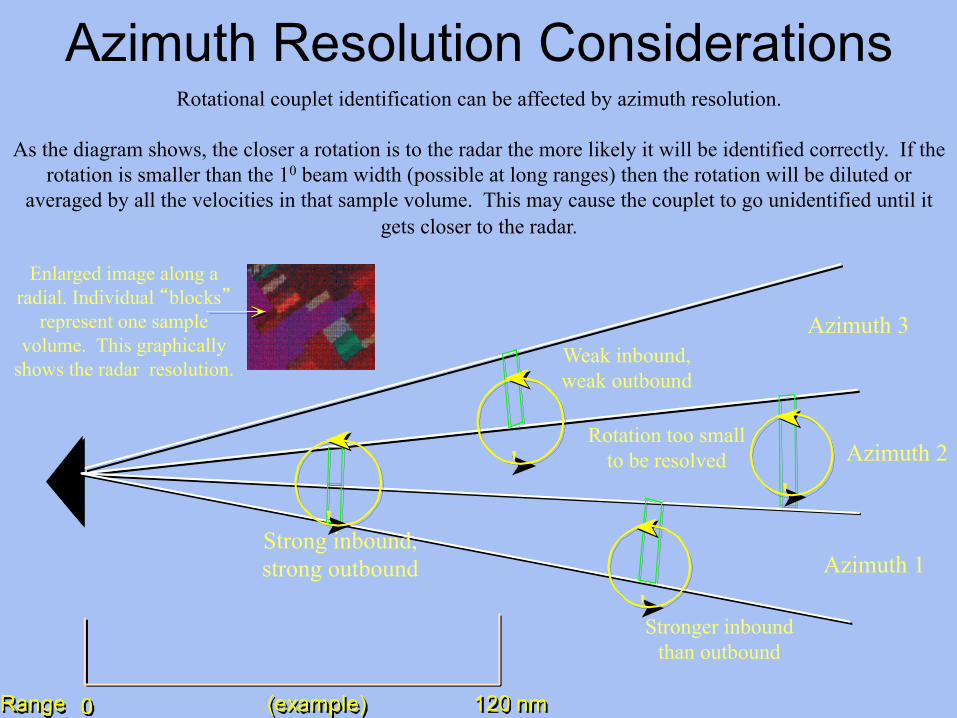
Enlarged image along a radial. Individual “blocks”
represent one sample volume. This graphically
shows the radar resolution.
Rotational couplet identification can be affected by azimuth resolution.
As the diagram shows, the closer a rotation is to the radar the more likely it will be identified correctly. If the rotation is smaller than the 10 beam width (possible at long ranges) then the rotation will be diluted or
averaged by all the velocities in that sample volume. This may cause the couplet to go unidentified until it gets closer to the radar.
Azimuth Resolution Considerations

WSR88D tools
• 1) Meso – somewhat weaker, broader scale rotation
• 2) TVS (tornado vortex signature) – more concentrated and intense rotation

SRV vs. Base Velocity - Strong Rotation -
Base Velocity Storm Relative Velocity
Persistent rotation from Big Flats Storm
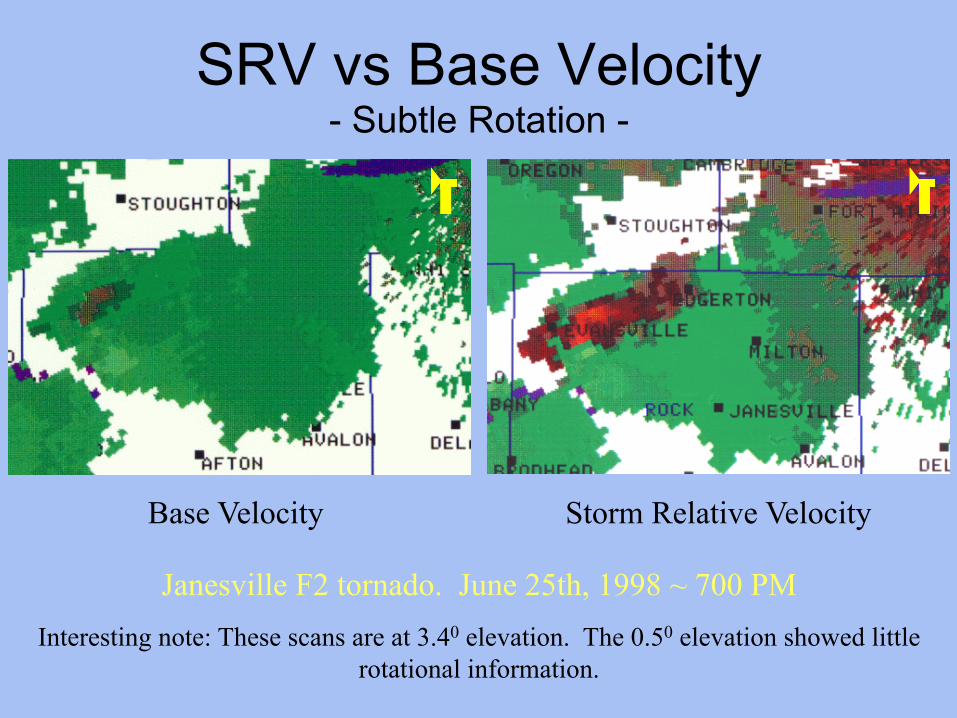
SRV vs Base Velocity - Subtle Rotation -
Base Velocity Storm Relative Velocity
Janesville F2 tornado. June 25th, 1998 ~ 700 PM Interesting note: These scans are at 3.40 elevation. The 0.50 elevation showed little
rotational information.

Tools to forecast hail
• For Hail – look for 3Body Scattering (hail spike) (sometimes called TBSS)
• -- echo overhang • -- strong storm-top divergence • -- very high reflectivity (if dBZ >
60, almost always means hail, but don’t really know if it is large stones or lots of small ones)

radar

Large Hail forecasting • Some new techniques try to predict large hail by
looking for some reflectivity values above some height. The Hail Detection Algorithm looks for 40 dBZ echo much higher than the freezing level, especially 50 dBZ higher than the -20 C level
• If freezing level is low (2 km), need 50 dBZ echo up to 5 km
• If freezing level is medium (3 km), need 50 dBZ echo up to 8 km
• If freezing level is high (4 km), need 50 dBZ echo up to 11-12.5 km.
• In general, the higher the 50 dBZ echo extends up into the sky, the bigger the hail
Tools to forecast severe wind
• strong mid-level convergence or deep convergence zone
• rear-inflow notches, rear-inflow jets, bowing echoes
Tools to forecast tornadoes
• Meso and TVS signatures in velocity data • echo collapse may be favorable (top
suddenly decreases in height) • hook echo (or other appendages on right
side of storm when viewed from behind) • NROT (normalized rotation) can also be a
good tool, especially when couplets of cyclonic rotation have anticyclonic rotation to the right (when viewed from upstream)
Dual-Pol Radar Clues
• ZDR (differential reflectivity) – ratio of horizontal to vertical axis offers clues about severe weather – Large raindrops have values > 0 (even > 3) – Hail is around 0 – Small drops are a little above 0 (0-1.5) – Snow has small values – Severe updraft will have big ZDR indicating large
drops at high levels (temps around -10C) – Tornado debris à ZDR nearly 0

Dual Pol clues (cont)
• Correlation Coefficient (CC) – 0.96 – 1.0 indicates uniform particles – 0.85 – 0.95 is a large diversity of precip types – < 0.85 likely tornado debris or non-
meteorological scatterers (use dBZ to figure this out)