msu retention profile: part ii. * includes full-time and part-time, associate and bachelor...
TRANSCRIPT
MSU Retention Profile:Part II
Fall 2007
Fall 2008
Fall 2009
Fall 2010
Fall 2011
62.0%
64.0%
66.0%
68.0%
70.0%
72.0%
74.0%
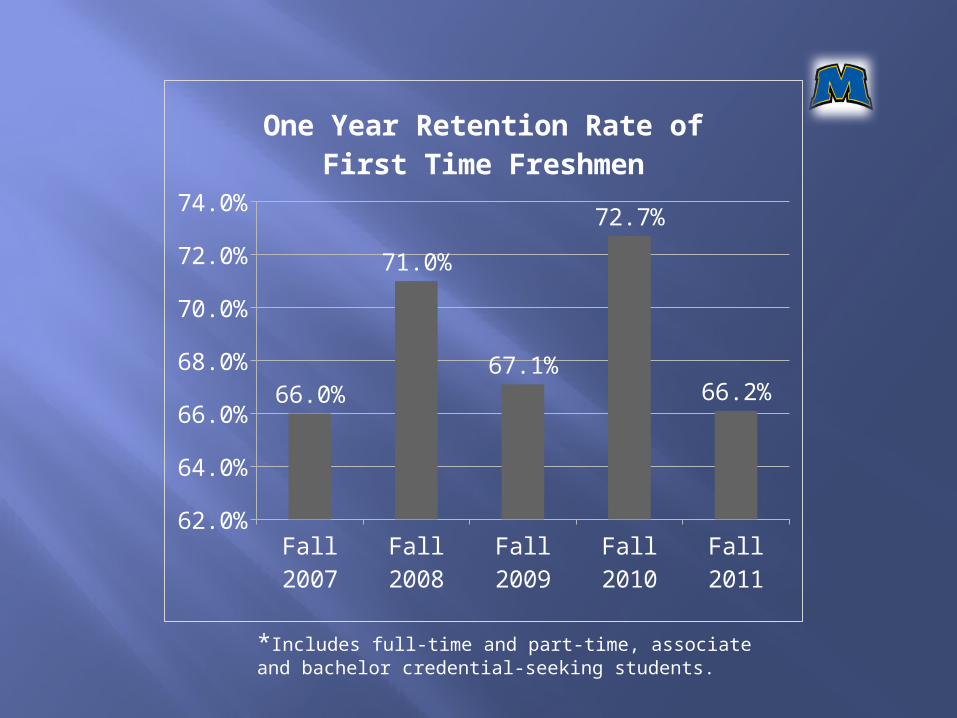
66.0%
71.0%
67.1%
72.7%
66.2%
One Year Retention Rate of First Time Freshmen
*Includes full-time and part-time, associate and bachelor credential-seeking students.

A review of what we know:
MSU’s retention of first-year students shows a pattern of up and down fluctuations on a two-year cycle.
Freshmen students do have assigned advisers MSU retains URM freshmen students at the
same rate as the general population of freshmen students.
For the fall 2011 freshmen cohort, there was a significant increase in attrition among residential students.
Provisional students are retained at a consistent annual rate; typically about 50% each year.

On-line classes do not negatively impact retention of freshmen; small number of participants.
Extended campus instruction does not negatively impact freshmen retention; small number of participants.
There was a 10% increase in the Y2Y attrition for the fall 2011 freshmen cohort having a HS GPA at 2.0 or higher.
Fall to spring retention rates are significantly stronger than fall to fall retention rates for both 2010 and 2011 freshmen cohorts.
A review of what we know:

Today’s focus:
· Hours Attempted vs. Completed· Impact of Financial Aid Changes· College/Department/ Program/Major· Residential vs. Non-Residential· ACT Sweet Spot (21-26 ACT) Students· Fall 2012 Student Profile

HOURS ATTEMPTED VS. COMPLETED

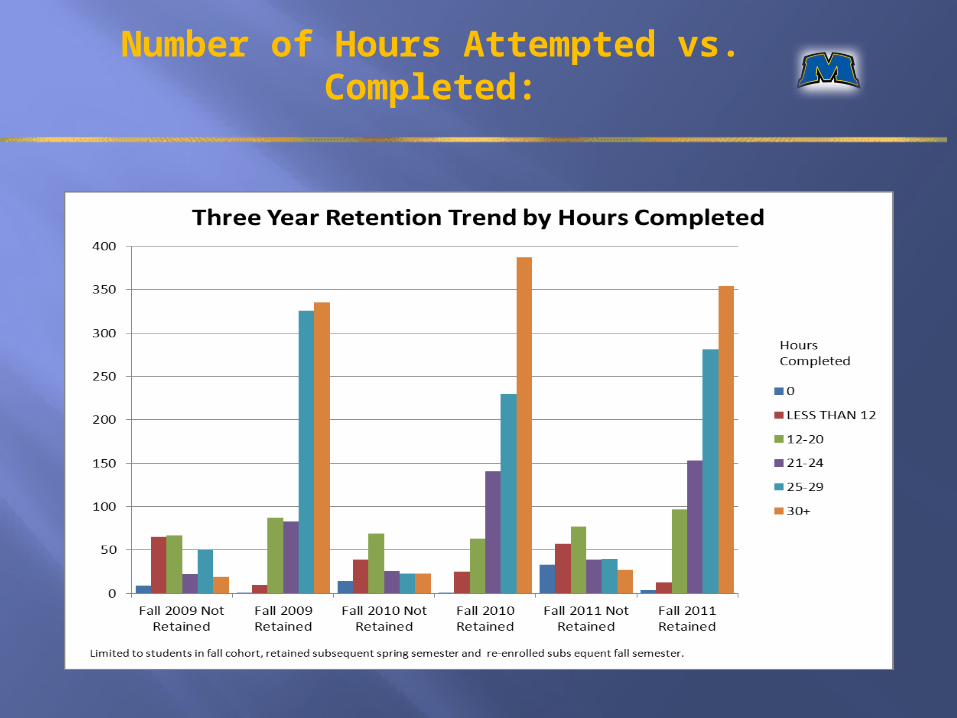
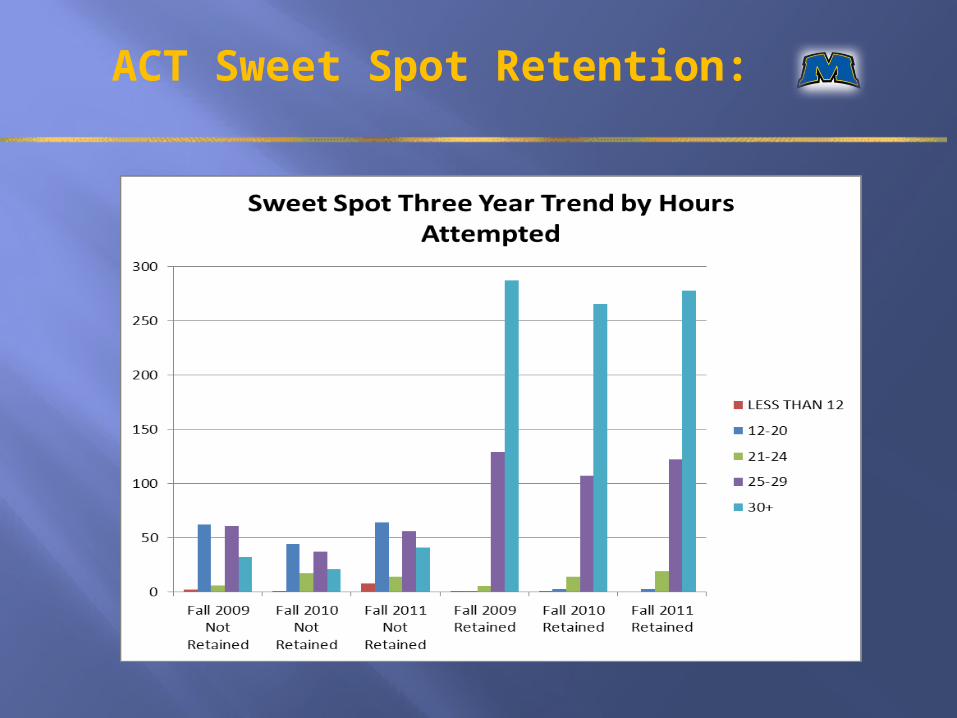
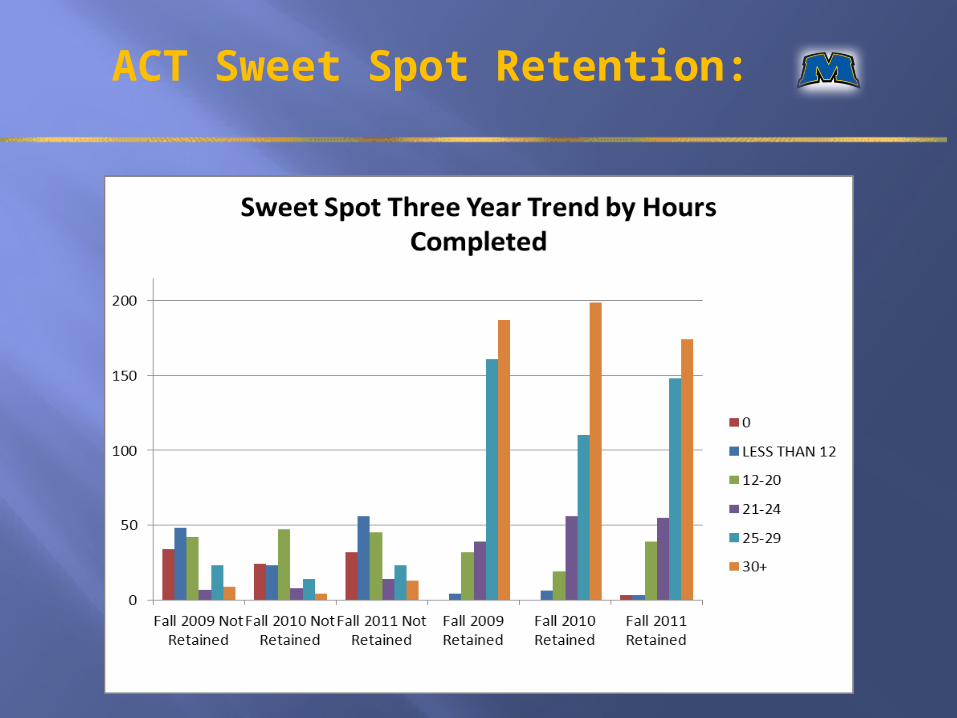
Number of Hours Attempted vs. Completed:
Number of Hours Attempted vs. Completed:

Number of Hours Attempted vs. Completed:
3 Year Trend
Retained MSU FTFR on average complete > 26 hrs. per academic year.
Non-retained MSU FTFR on average complete < 12 hrs. per academic year.

FINANCIAL AID
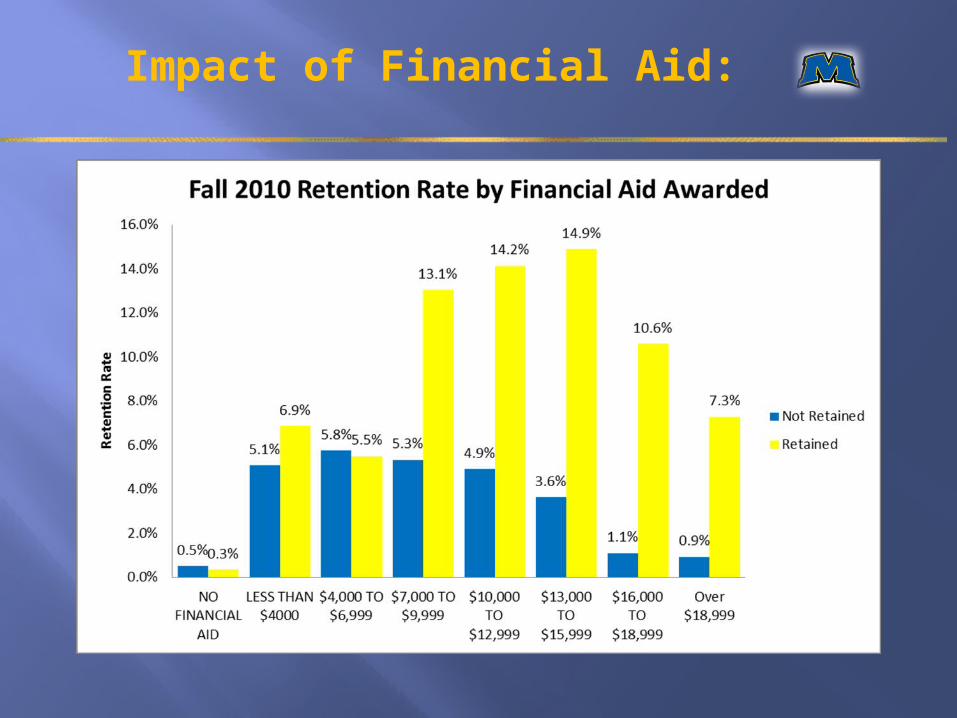
Impact of Financial Aid:
·
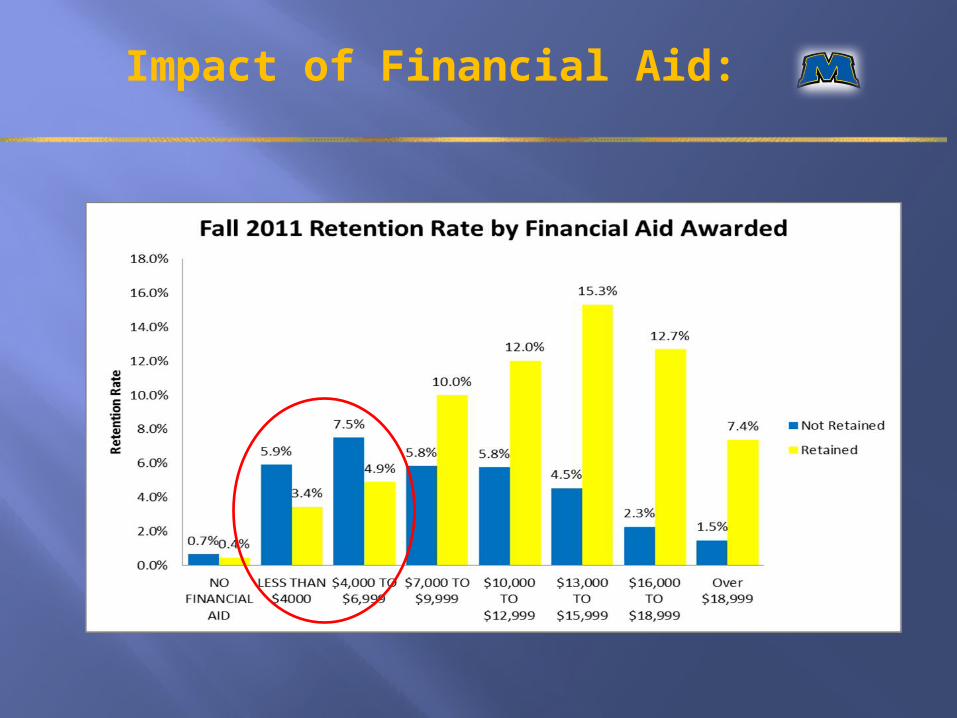
Impact of Financial Aid:
·

Impact of Financial Aid:
2007 2008 2009 2010 2011
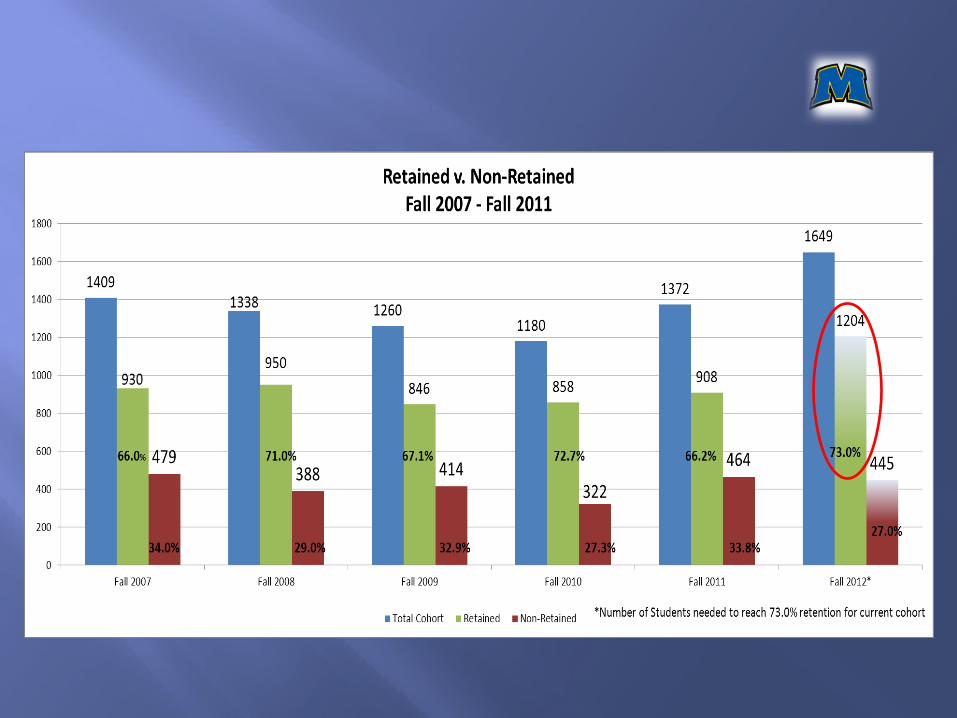
Cohort 1,418 1,338 1,260 1,180 1,372
Returners 930 950 846 858 908
Non-Returners 479 388 414 322 474
Percent Retained 65.5% 71% 67.1% 72.7% 66.2%
Financial Aid -RET↑FA 36.9 34.2 30.2 33.3 24.8NC 5.9 4.5 5 7.2 8.3
↓$1k -$5k 19.6 27.8 28.1 28.6 28.9↓$5k -$10k 2.7 3.6 3.7 3.2 3.8↓$10k-$15k 0.4 0.7 0.2 0.1 0.4
↓>$15k 0.1 0.1 0 0 0
Financial Aid - NRET↑FA 4.9 0.8 0.9 1 3.4NC 6.1 4 3.6 1.5 3.5
↓$1k -$5k 13 10.5 13.4 10.3 11.8↓$5k -$10k 8.3 10.8 11.1 11.9 11.6↓$10k-$15k 1.3 2.4 3.5 1.9 2.5
↓>$15k 0.2 0.5 0.4 0.5 1
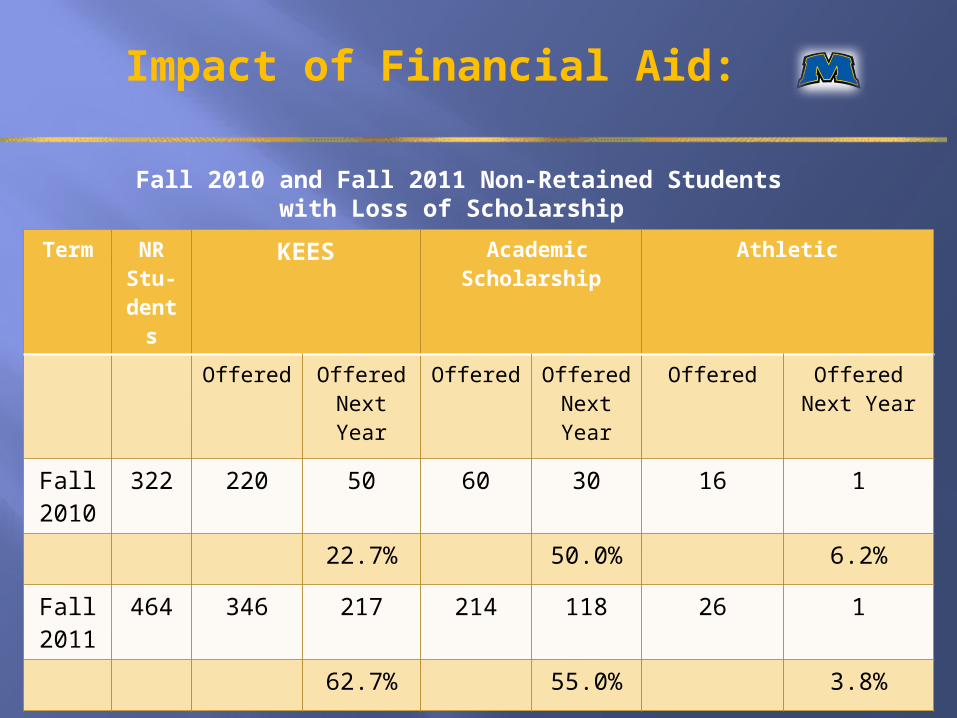
Impact of Financial Aid:
·
Term NRStu-dent
s
KEES Academic Scholarship
Athletic
Offered OfferedNext Year
Offered OfferedNext Year
Offered OfferedNext Year
Fall2010
322 220 50 60 30 16 1
22.7% 50.0% 6.2%
Fall 2011
464 346 217 214 118 26 1
62.7% 55.0% 3.8%
Fall 2010 and Fall 2011 Non-Retained Students with Loss of Scholarship

COLLEGE/DEPARTMENT(PROGRAM/MAJOR DATA
PROVIDED)

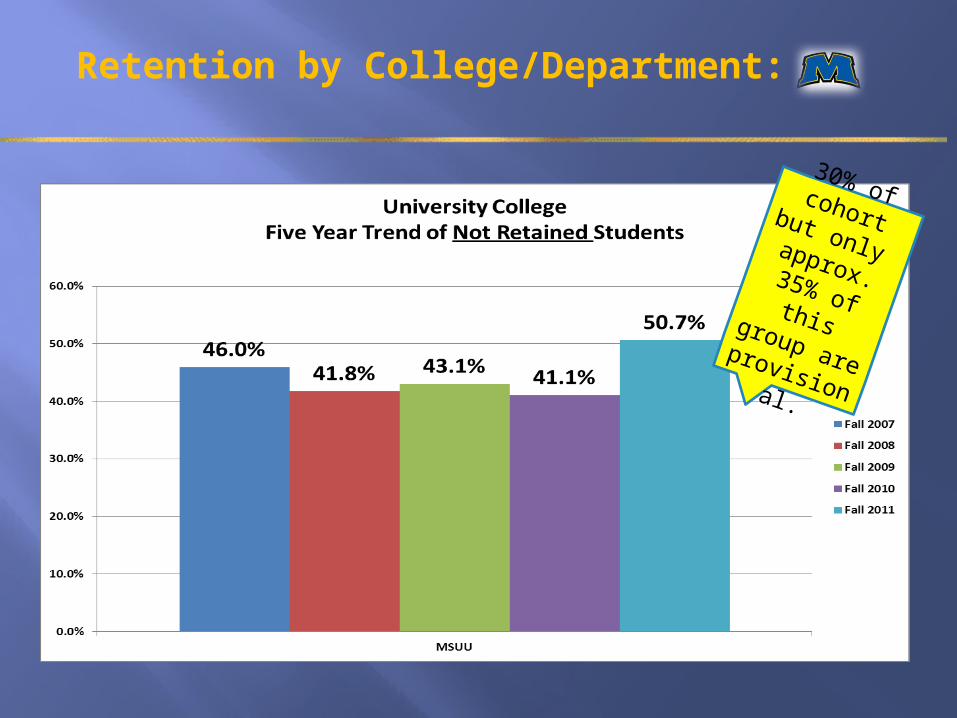
Retention by College/Department:

Retention by College/Department:

Retention by College/Department:

Retention by College/Department:
Retention by College/Department:
30% of cohort but only approx. 35% of this group are provisional.

RESIDENTIAL VS. NON-RESIDENTIAL

Residential vs. Non-Residential:
Term Cohort
NOT RETAINED RETAINED
OFF CAMPUS
ON CAMPUS
OFF CAMPUS
ON CAMPUS
# % # % # % # %
FALL 2007
1418 178 12.6% 301 21.4% 212 15.0% 718 51.0%
FALL 2008
1338 143 10.7% 245 18.3% 228 17.0% 722 54.0%
FALL 2009
1260 147 11.7% 267 21.2% 190 15.1% 656 52.1%
FALL 2010
1180 121 10.3% 201 17.0% 207 17.5% 651 55.2%
FALL 2011
1372 141 10.3% 323 23.5% 174 12.7% 734 53.5%

Residential Student Retention:
Housing Assignments of Non-Returning Students2007 2008 2009 2010 2011
Alumni Tower 90 27% 55 20% * * 2 1% 6 2%Butler Hall 15 5% 22 8% 38 13% 40 19% 46 13%Cartmell Hall 23 7% 12 4% 53 18% 80 37% 95 27%Cooper Hall 56 17% 44 16% 2 1% 1 0% 48 14%Eagle Lake Apt 2 1% 0 0% 0 0% 0 0% 0 0%East Mignon Hall 38 12% 33 12% 50 17% 31 14% * *Fields Hall 0 0% 2 1% 6 2% 6 3% 12 3%Gilley Apt 0 0% 0 0% 0 0% 0 0% 0 0%Normal Hall Apt 0 0% 0 0% 0 0% 1 0% 0 0%Nunn Hall * * * * 0 0% 2 1% 6 2%Mays Hall Apt. 0 0% 0 0% 0 0% 1 0% 2 1%Mignon Hall 52 16% 64 23% 74 25% 45 21% 87 25%Mignon Tower 45 14% 30 11% 72 24% * * 1 0%Grote-Thompson Hall3 1% 9 3% 6 2% 6 3% 15 4%University Farm 0 0% 1 0% 0 0% 0 0% 1 0%West Mignon Hall 5 2% 4 1% 0 0% 0 0% 31 9%
* Denotes year of renovation
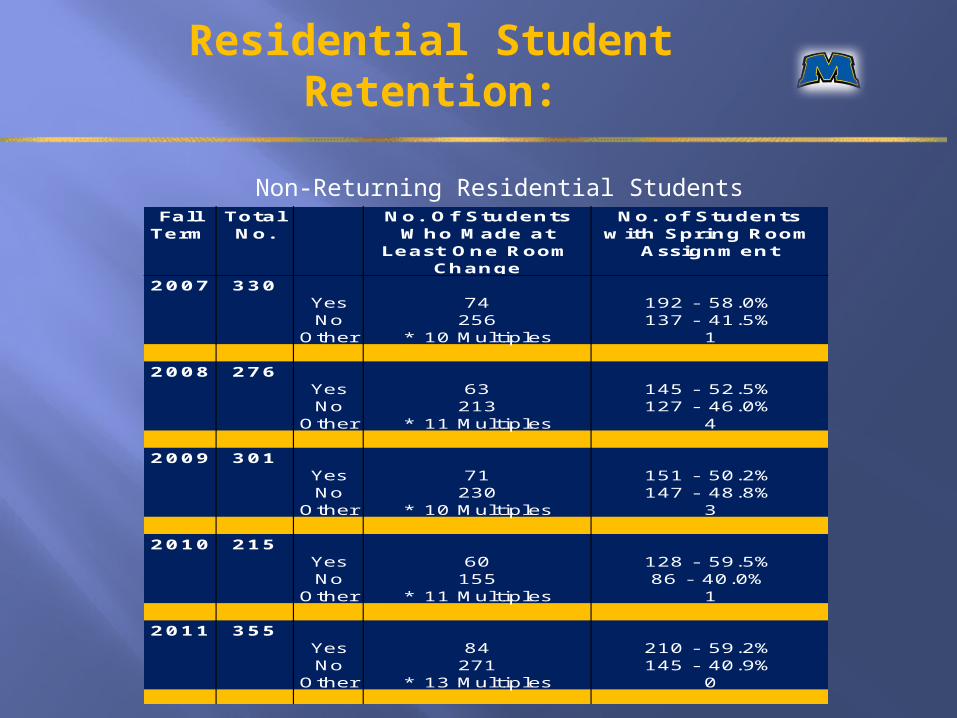
Residential Student Retention:
Non-Returning Residential StudentsFall
TermTotal No.
No. Of Students Who Made at
Least One Room Change
No. of Students with Spring Room
Assignment
2007 330Yes 74 192 - 58.0%No 256 137 - 41.5%
Other * 10 Multiples 1
2008 276Yes 63 145 - 52.5%No 213 127 - 46.0%
Other * 11 Multiples 4
2009 301Yes 71 151 - 50.2%No 230 147 - 48.8%
Other * 10 Multiples 3
2010 215Yes 60 128 - 59.5%No 155 86 - 40.0%
Other * 11 Multiples 1
2011 355Yes 84 210 - 59.2%No 271 145 - 40.9%
Other * 13 Multiples 0
NON-RETURNERS/TRANSFERS
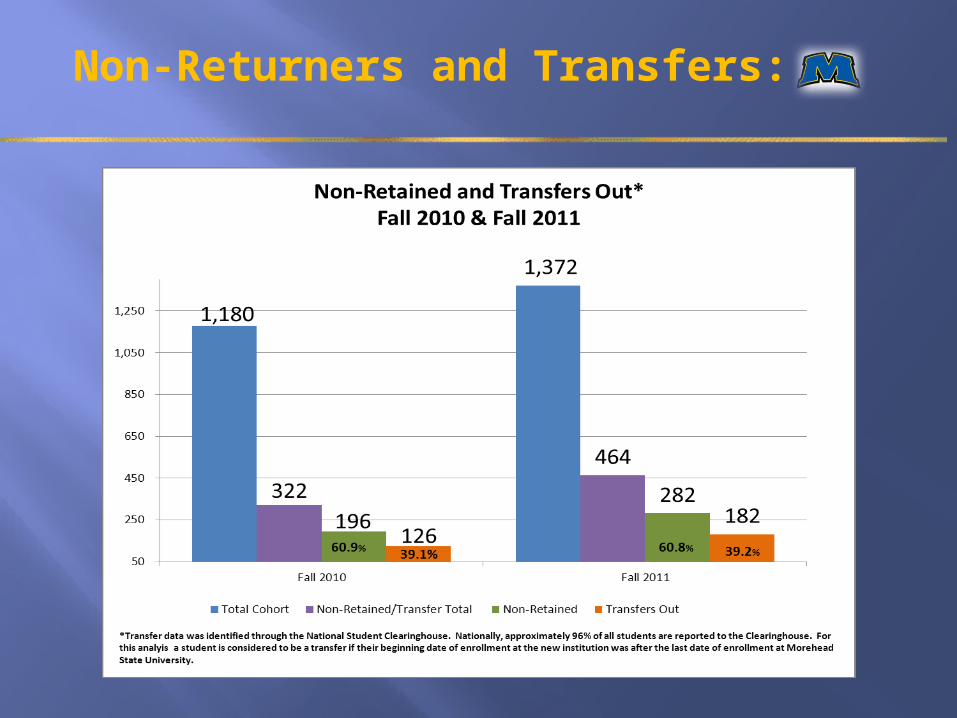
Non-Returners and Transfers:
·

Where Do They Go?
·
Non-Retained Studentsby Transfer InstitutionFall 2010 - Fall 2011
Transfer Institution Fall 2010 Fall 2011
Four Year In-State 29 38Four Year Out of State 29 22KCTCS 53 100
Other Two Year or Less College 15 22Grand Total 126 182

ACTSWEET SPOTSTUDENTS
(21-26)

ACT Sweet Spot Retention:
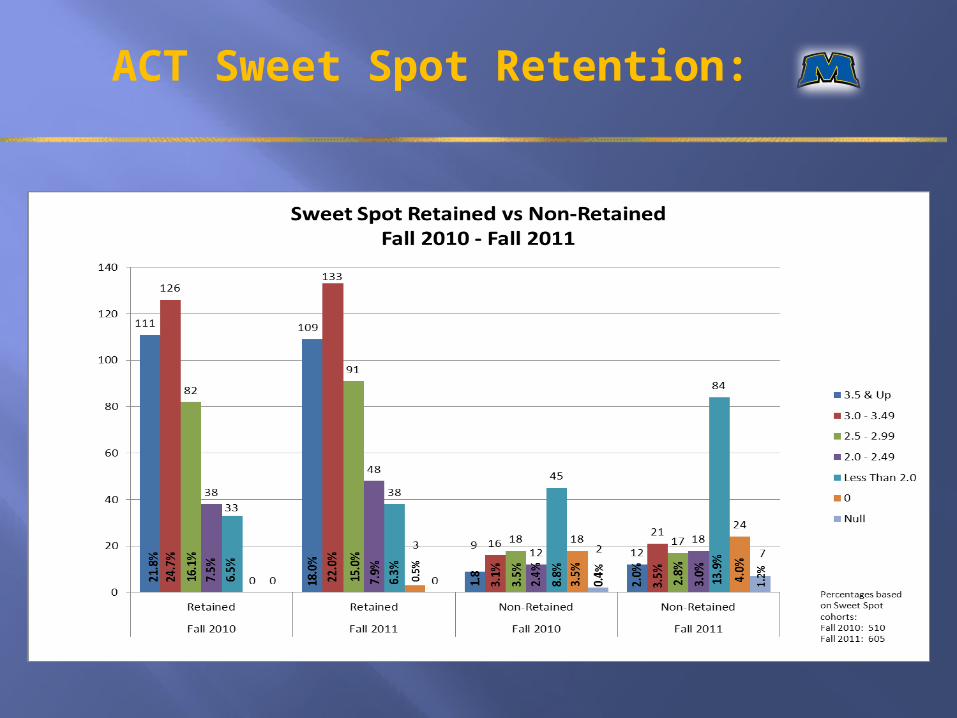
ACT Sweet Spot Retention:

ACT Sweet Spot Retention:
ACT Sweet Spot Retention:
ACT Sweet Spot Retention:

FALL 2012COHORTPROFILE
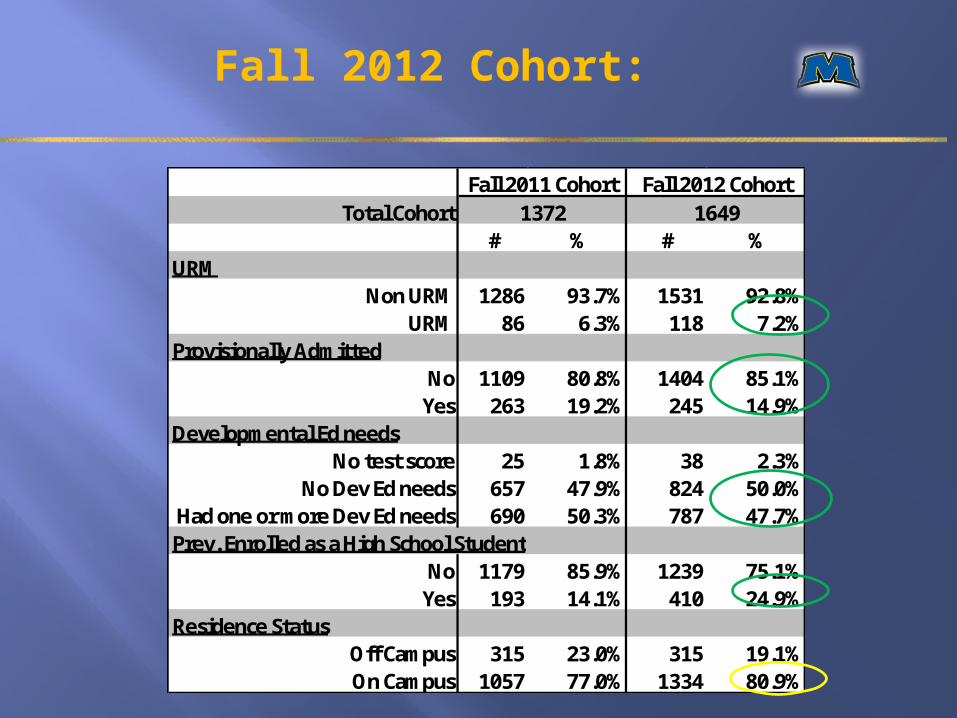
Fall 2012 Cohort:
Total Cohort# % # %
URMNon URM 1286 93.7% 1531 92.8%
URM 86 6.3% 118 7.2%Provisionally Admitted
No 1109 80.8% 1404 85.1%Yes 263 19.2% 245 14.9%
Developmental Ed needsNo test score 25 1.8% 38 2.3%
No Dev Ed needs 657 47.9% 824 50.0%Had one or more Dev Ed needs 690 50.3% 787 47.7%Prev. Enrolled as a High School Student
No 1179 85.9% 1239 75.1%Yes 193 14.1% 410 24.9%
Residence StatusOff Campus 315 23.0% 315 19.1%On Campus 1057 77.0% 1334 80.9%
Fall 2011 Cohort Fall 2012 Cohort1372 1649
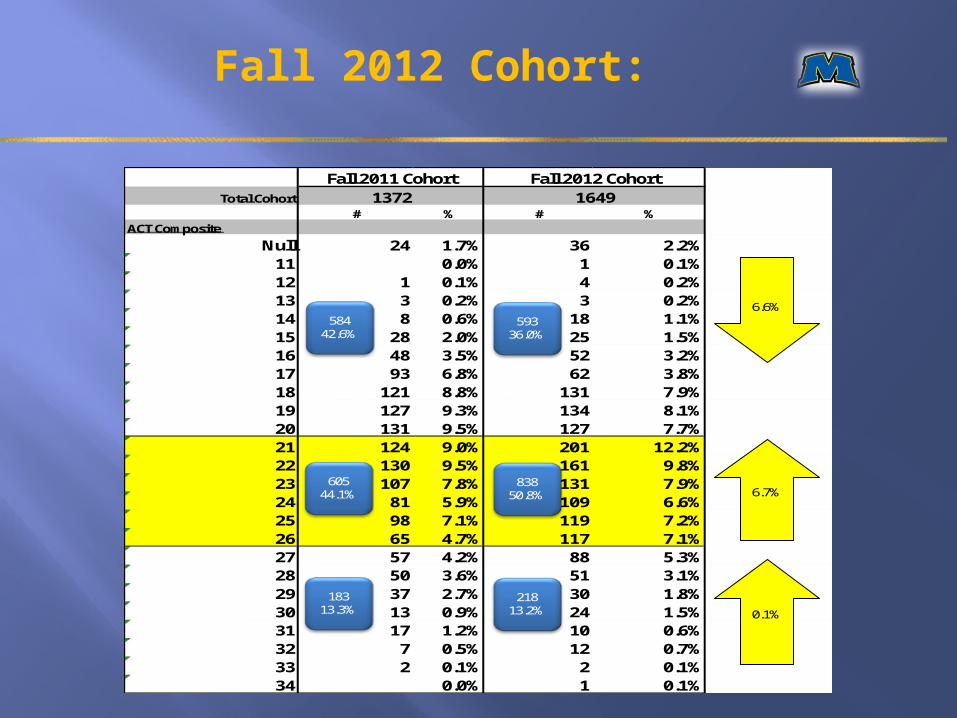
Fall 2012 Cohort:
Total Cohort# % # %
ACT Composite
Null 24 1.7% 36 2.2%11 0.0% 1 0.1%12 1 0.1% 4 0.2%13 3 0.2% 3 0.2%14 8 0.6% 18 1.1%15 28 2.0% 25 1.5%16 48 3.5% 52 3.2%17 93 6.8% 62 3.8%18 121 8.8% 131 7.9%19 127 9.3% 134 8.1%20 131 9.5% 127 7.7%21 124 9.0% 201 12.2%22 130 9.5% 161 9.8%23 107 7.8% 131 7.9%24 81 5.9% 109 6.6%25 98 7.1% 119 7.2%26 65 4.7% 117 7.1%27 57 4.2% 88 5.3%28 50 3.6% 51 3.1%29 37 2.7% 30 1.8%30 13 0.9% 24 1.5%31 17 1.2% 10 0.6%32 7 0.5% 12 0.7%33 2 0.1% 2 0.1%34 0.0% 1 0.1%
Fall 2011 Cohort Fall 2012 Cohort1372 1649
58442.6%
59336.0%
60544.1%
83850.8%
18313.3%
21813.2%
6.6%
6.7%
0.1%
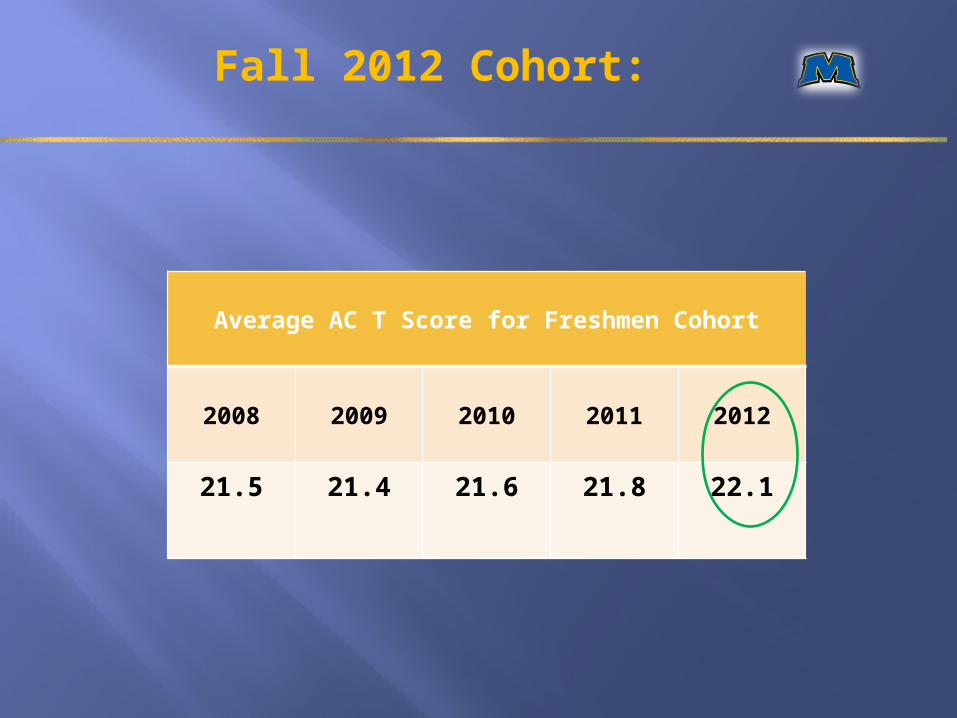
Fall 2012 Cohort:
Average AC T Score for Freshmen Cohort
2008 2009 2010 2011 2012
21.5 21.4 21.6 21.8 22.1

Fall 2012 Cohort:
Count PercentTotal Hours Attempted
Average Hours
Attempted
Estimated Hours
Completed* Count PercentTotal Hours Attempted
Average Hours Attempted
Estimated Hours
Completed*
Target Spring
Enrollment
Target Spring
RetentionLess than 12 16 115 7.2 2.7 8 55 6.9 5.812-14 196 2,406 12.3 4.6 300 3,770 12.6 10.615+ Hours 241 3,711 15.4 5.7 888 13,815 15.6 13.1
Grand Total 453 27.5% 6,232 13.8 5.1 1,196 72.5% 17,640 14.7 12.4 1,454 88.0%
Hours Attempted
NOT ADVANCED REGISTERED ADVANCED REGISTERED FOR SPRING 2013
Credit Hours Attempted v. Estimated Hours CompletedFall 2012
Estimated Hours Completed was based on the ratio of hours attempted/completed during the fall for retained and not retained students to the subsequent spring term over the past five years. Not retained completed 37.17% of hours attempted while retained completed 84.19% of hours
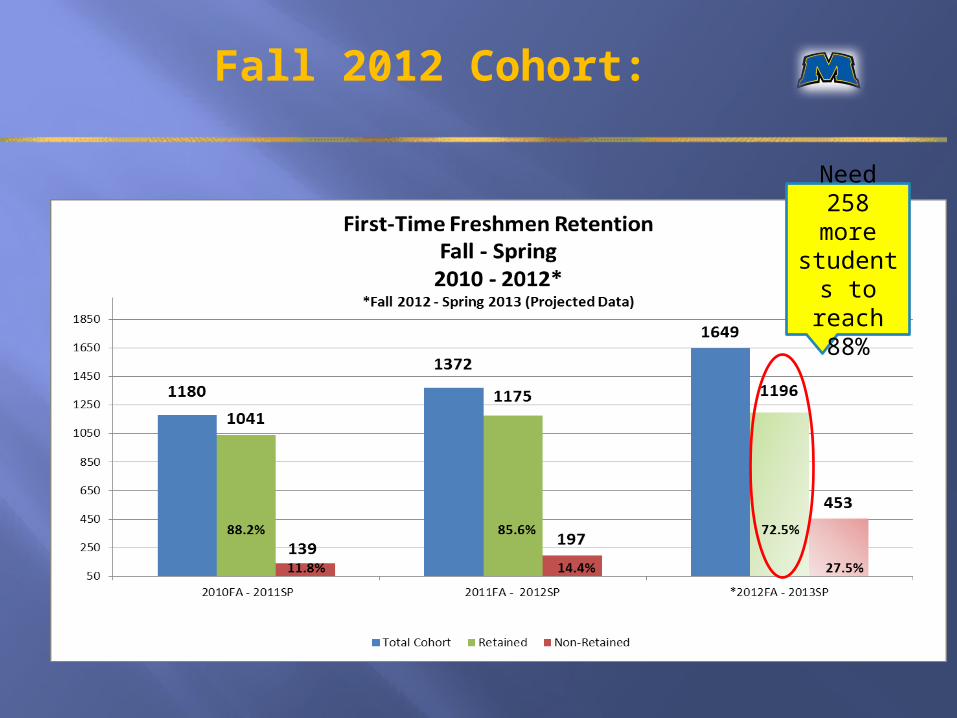
Fall 2012 Cohort:
Need 258
more students to reach
88%

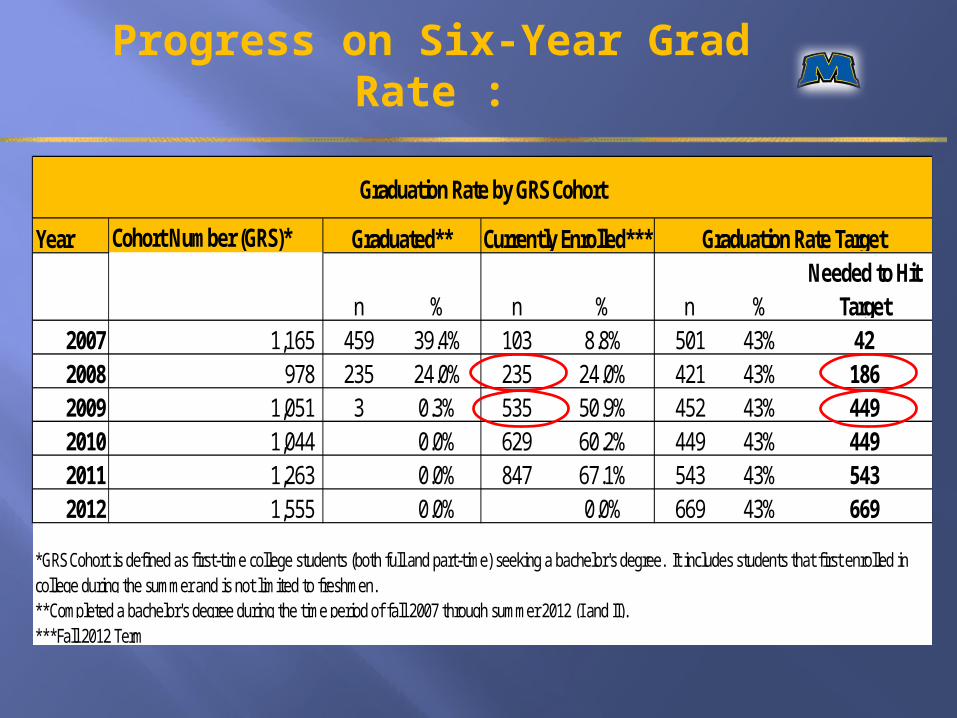
Progress on Six-Year Grad Rate :
Year Cohort Number (GRS)*
n % n % n %Needed to Hit
Target2007 1,165 459 39.4% 103 8.8% 501 43% 422008 978 235 24.0% 235 24.0% 421 43% 1862009 1,051 3 0.3% 535 50.9% 452 43% 4492010 1,044 0.0% 629 60.2% 449 43% 4492011 1,263 0.0% 847 67.1% 543 43% 5432012 1,555 0.0% 0.0% 669 43% 669
Graduation Rate Target
Graduation Rate by GRS Cohort
*GRS Cohort is defined as first-time college students (both full and part-time) seeking a bachelor's degree. It includes students that first enrolled in college during the summer and is not limited to freshmen.**Completed a bachelor's degree during the time period of fall 2007 through summer 2012 (I and II).***Fall 2012 Term
Graduated** Currently Enrolled***
Next Steps: Deeper Analysis
Sub-Committees to Review Following Areas:
· STUDENT LIFE· FINANCIAL AID· ACADEMIC AFFAIRS
Student Life :
Review policies and processes related to room changes. Monitor data and strategies consistently to maintain a pulse on issues that might impact retention.
Review of renovation plan. The buildings which consistently have the highest rates of departure are Cartmell (double-occupancy) and Mignon Hall (suite-style). These buildings have not been renovated to date.
Collaborate with Academic Affairs to collect additional data to better inform strategies to increase retention.

Financial Aid :
“…. inherit tension between increasing admissions vs. overall enrollment management.”
- The Chronicle of Higher Education
Review of current financial aid practices to ensure that they support recruitment AND retention.
Review current tuition model to better align with goal of students completing 15 credit hours each semester.
Academic Affairs:
Review policies and program options for Undeclared/Provisional/University Studies FTFR entering MSU.
Increase emphasis on number of hours attempted/completed by full-time students; 15 hrs. per semester / 30 hrs. end of first year is goal.
Implement professional advising model in each college.

Academic Affairs:
Implement a four-week freshmen push at start of fall semester.
Collaborate with Student Life to collect additional data to better inform strategies to increase retention.
Review the accuracy of mid-term grade as a predictor of final grade.
Identify strategies to reach six-year grad. rate target for 2007, 2008, and 2009 cohorts.