msci acwi emerging market consumer growth …...msci acwi emerging market consumer growth index...
TRANSCRIPT
JUNE 2017
INDEX METHODOLOGY
MSCI ACWI EMERGING MARKET CONSUMER GROWTH INDEX METHODOLOGY
June 2017
MSCI.COM | PAGE 2 OF 18 © 2017 MSCI Inc. All rights reserved. Please refer to the disclaimer at the end of this document.
MSCI ACWI EMERGING MARKET CONSUMER GROWTH INDEX METHODOLOGY | JUNE 2017
1 Introduction .........................................................................3
2 Index Construction Methodology ............................................4
2.1 Eligible Universe: .................................................................................4
2.2 Security Selection:................................................................................4
2.3 Weighting Scheme: ..............................................................................4
3 Maintaining the MSCI ACWI Emerging Market Consumer Growth
Index .........................................................................................5
3.1 Annual Index Review ............................................................................5
3.2 Quarterly Index Reviews.......................................................................5
3.3 Ongoing Event Related Changes ...........................................................5
Appendix I: Estimation of Consumer Exposure of Companies ...........8
Definition of Consumer Oriented Products and Services..................................8
Company Level Data used for Determining Consumer Exposure ......................8
Assignment of Consumer Exposure Multipliers ...............................................9
Appendix II: Estimation of Economic Exposure of Companies ......... 14
CONTENTS
MSCI.COM | PAGE 3 OF 18 © 2017 MSCI Inc. All rights reserved. Please refer to the disclaimer at the end of this document.
MSCI ACWI EMERGING MARKET CONSUMER GROWTH INDEX METHODOLOGY | JUNE 2017
1 INTRODUCTION
The MSCI ACWI Emerging Market Consumer Growth Index (the “Index”) aims to reflect the
performance of consumer oriented companies from the MSCI ACWI Index1 that derive high
or growing revenues from emerging markets (herein ‘EMs’), while satisfying investability and
diversification criteria.
1 The MSCI ACWI Index is a global equity index consisting of developed and emerging market countries across the large and mid cap size‐segments. For more information, please visit MSCI’s web site athttps://www.msci.com/index-methodology.
MSCI.COM | PAGE 4 OF 18 © 2017 MSCI Inc. All rights reserved. Please refer to the disclaimer at the end of this document.
MSCI ACWI EMERGING MARKET CONSUMER GROWTH INDEX METHODOLOGY | JUNE 2017
2 INDEX CONSTRUCTION METHODOLOGY
2.1 ELIGIBLE UNIVERSE:
The eligible universe of the Index is defined based on the Global Industry Classification
Standard (GICS®) and includes:
All constituents of MSCI ACWI classified under the Consumer Staples or Consumer
Discretionary Sectors
All Constituents of MSCI ACWI classified under the Health Care, Industrials, Information
Technology or Telecommunication Services sectors that derive at least 60% of their
revenues from consumer oriented products and services. These revenues are estimated
from the companies’ annual accounts and other public sources, through a process
described in Appendix I.
2.2 SECURITY SELECTION:
All securities from the eligible universe that meet either of the following criteria a re included
in the Index:
Companies that derive at least 50% of their revenues from EMs, or
Companies that derive at least 25% of their revenues from EMs and have EM revenue
compound annual growth rate (CAGR) of at least 10% over the previous 3 years .
The details of determining the economic exposure of a company to EMs (EM exposure) and
EM revenue CAGR are set forth in Appendix II.
2.3 WEIGHTING SCHEME:
The securities eligible for inclusion in the Index are weighted by the product of their market
capitalization and EM exposure. The issuer weight is capped at 5%.
MSCI.COM | PAGE 5 OF 18 © 2017 MSCI Inc. All rights reserved. Please refer to the disclaimer at the end of this document.
MSCI ACWI EMERGING MARKET CONSUMER GROWTH INDEX METHODOLOGY | JUNE 2017
3 MAINTAINING THE MSCI ACWI EMERGING MARKET CONSUMER
GROWTH INDEX
3.1 ANNUAL INDEX REVIEW
The Index is rebalanced annually in May, coinciding with the May Semi‐Annual Index Review
of the MSCI Global Investable Market Indexes. The pro forma MSCI ACWI Emerging Market
Consumer Growth Index is in general announced nine business days before the effective
date.
All constituents of the pro forma MSCI ACWI that are not currently a part of the MSCI ACWI
Emerging Market Consumer Growth Index are evaluated for inclusion based on the rules
described in Section 2. Existing constituents of the current MSCI ACWI Emerging Market
Consumer Growth Index will continue to remain in the Index as long as they satisfy the
eligible universe criteria set forth in Section 2.1, and also satisfy the following security
selection criteria:
Derive at least 50% of their revenues from EMs, or
Derive at least 25% of their revenues from EMs and have EM revenue compound annual
growth rate (CAGR) of at least 7.5% over the previous 3 years .
3.2 QUARTERLY INDEX REVIEWS
Additions to MSCI ACWI at the November Semi -Annual Index Review and the February and
August Quarterly Index Reviews are only considered for inclusion in the MSCI ACWI
Emerging Market Consumer Growth Index at the next Annual Index Review.
Deletions from MSCI ACWI at the November Semi -Annual Index Review and the February
and August Quarterly Index Reviews are s imultaneously deleted from the MSCI ACWI
Emerging Market Consumer Growth Index.
3.3 ONGOING EVENT RELATED CHANGES
The general treatment of corporate events in the MSCI ACWI Emerging Market Consumer
Growth Indexes aims to minimize turnover outside of Index Reviews. The methodology aims
to appropriately represent an investor’s participation in an event based on relevant deal
terms and pre-event weighting of the index constituents that are involved. Further, changes
in index market capitalization that occur as a result of corporate event implementation will
be offset by a corresponding change in the Variable Weighting Factor (VWF) of the
constituent.
MSCI.COM | PAGE 6 OF 18 © 2017 MSCI Inc. All rights reserved. Please refer to the disclaimer at the end of this document.
MSCI ACWI EMERGING MARKET CONSUMER GROWTH INDEX METHODOLOGY | JUNE 2017
Additionally, if the frequency of Index Reviews in the Parent Index is greater than the frequency of Index Reviews in the MSCI ACWI Emerging Market Consumer Growth Index, the changes made to the Parent Index during intermediate Index Reviews will be neutralized in the MSCI ACWI Emerging Market Consumer Growth Index. The following section briefly describes the treatment of common corporate events within the MSCI ACWI Emerging Market Consumer Growth Indexes. No new securities will be added (except where noted below) to the Index between Index Reviews. Parent Index deletions will be reflected simultaneously.
EVENT TYPE EVENT DETAILS Constituent Changes A new security added to the parent index
(such as IPO and other early inclusions) will not be added to the index.
Spin-Offs All securities created as a result of the
spin-off of an existing Index constituent will be added to the Index at the time of event implementation. Reevaluation for continued inclusion in the Index will occur
at the subsequent Index Review. Merger/Acquisition For Mergers and Acquisitions, the
acquirer’s post event weight will account for the proportionate amount of shares involved in deal consideration, while cash proceeds will be invested across the Index. If an existing Index constituent is acquired by a non-Index constituent, the existing constituent will be deleted from the Index and the acquiring non-constituent will not be added to the Index.
Changes in Security Characteristics A security will continue to be an Index
constituent if there are changes in characteristics (country, sector, size segment, etc.) Reevaluation for continued
MSCI.COM | PAGE 7 OF 18 © 2017 MSCI Inc. All rights reserved. Please refer to the disclaimer at the end of this document.
MSCI ACWI EMERGING MARKET CONSUMER GROWTH INDEX METHODOLOGY | JUNE 2017
inclusion in the Index will occur at the subsequent Index Review.
Further detail and il lustration regarding specific treatment of corporate events relevant to this Index can be found in the MSCI Corporate Events Methodology book under the sections detail ing the treatment of events in Capped Weighted and Non-Market Capitalization Weighted indexes. The MSCI Corporate Events methodology book is available at: https://www.msci.com/index-methodology
MSCI.COM | PAGE 8 OF 18 © 2017 MSCI Inc. All rights reserved. Please refer to the disclaimer at the end of this document.
MSCI ACWI EMERGING MARKET CONSUMER GROWTH INDEX METHODOLOGY | JUNE 2017
APPENDIX I: ESTIMATION OF CONSUMER EXPOSURE OF
COMPANIES
The proportion of revenues of a company derived from consumer oriented products and
services (consumer exposure) is estimated from the companies’ annual accounts and other
public sources. Various aspects of the estimation process are described below.
DEFINITION OF CONSUMER ORIENTED PRODUCTS AND SERVICES
The definition of consumer oriented products and services is based on the personal
consumption expenditure (PCE), a component statistic for consumption in the GDP,
collected by the Bureau of Economic Analysis (BEA). The categories included in the PCE are
reproduced below2:
Durable goods: motor vehicles and parts, furnishings and durable household equipment,
recreational goods and vehicles, and other durable goods.
Nondurable goods: food and beverages purchased for off-premises consumption,
clothing and footwear, gasoline and other energy goods, and other nondurable goods.
Services: housing and utilities, health care, transportation services, recreation services,
food services and accommodations, financial services and insurance and other services.
COMPANY LEVEL DATA USED FOR DETERMINING CONSUMER EXPOSURE
The following data points are collected at a company level:
The company’s GICS® sub-industry classification
Product segment information from company annual reports and vendor databases
(segment name and revenues)
A summary description of the company’s businesses from public sources
Any additional information about the company’s business from public sources3
2 Source: Bureau of Economic Analysis National Income and Product Accounts Handbook Chapter 5: Personal
Consumption Expenditures. https://www.bea.gov/national/pdf/NIPAhandbookch5.pdf (Pages 4-5). Pages 11-30, for example lists
the components underlying the 3 categories, and includes items such as Air transportation, Motor vehicle services (Parking fees and tolls).
3 For example, some vendors associate a company’s product segment with a specific SIC (Standard Industry Classification)
description for products and services, used by official agencies within the US government. These descriptions provide additional information on the nature of the segment.
MSCI.COM | PAGE 9 OF 18 © 2017 MSCI Inc. All rights reserved. Please refer to the disclaimer at the end of this document.
MSCI ACWI EMERGING MARKET CONSUMER GROWTH INDEX METHODOLOGY | JUNE 2017
ASSIGNMENT OF CONSUMER EXPOSURE MULTIPLIERS
Each of the product segments of the company is assigned a consumer exposure multiplier of
0, 0.5 or 1 based on the following criteria:
If the company’s GICS sub-industry, segment name, business summary, and any
additional information considered together convey a non-consumer orientation, the
consumer exposure multiplier is assigned as 0.
If the combination described above conveys a consumer orientation, the consumer
exposure multiplier is assigned as 1.
If the combination conveys both a consumer and a business orientation, the consumer
exposure multiplier is assigned as 0.5.
Lastly, the consumer revenues of a company are the sum-product of consumer exposure
multipliers and segment revenues. The consumer exposure (%) is the consumer revenues
divided by the total segment revenues. For the purposes of computing consumer exposure,
only revenues from product segments revenues are considered, and any non-product
segments (such as Miscellaneous, corporate center, eliminations and other) are ignored
from the computation.
Illustrations:
1. Johnson & Johnson (GICS Sub-industry: Pharmaceuticals):
Business description: Johnson & Johnson is a holding company. The Company is
engaged in the research and development, manufacture and sale of a broad range
of products in the health care field. The business of Johnson & Johnson is conducted
by more than 275 operating companies located in 60 countries, including the United
States, which sell products in virtually all countries throughout the world. In March
2013, Johnson & Johnson's Cordis Corporation announced the acquisition of Flexible
Stenting Solutions, Inc. In June 2013, Johnson & Johnson announced the opening of
the Johnson & Johnson Innovation center in Boston. In August 2013, Johnson &
Johnson announced it had completed its acquisition of Aragon Pharmaceuticals, Inc.,
a pharmaceutical discovery and development company focused on drugs to treat
hormonally driven cancers.
MSCI.COM | PAGE 10 OF 18 © 2017 MSCI Inc. All rights reserved. Please refer to the disclaimer at the end of this document.
MSCI ACWI EMERGING MARKET CONSUMER GROWTH INDEX METHODOLOGY | JUNE 2017
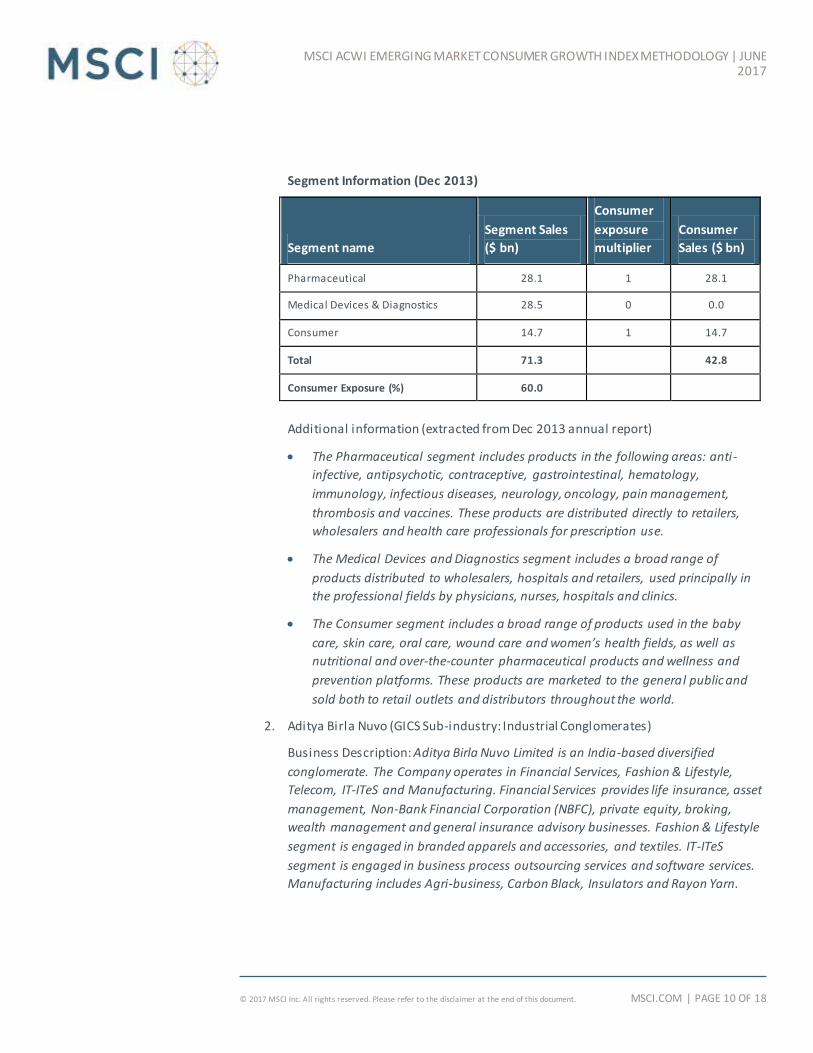
Segment Information (Dec 2013)
Segment name
Segment Sales
($ bn)
Consumer
exposure
multiplier
Consumer
Sales ($ bn)
Pharmaceutical 28.1 1 28.1
Medical Devices & Diagnostics 28.5 0 0.0
Consumer 14.7 1 14.7
Total 71.3
42.8
Consumer Exposure (%) 60.0
Additional information (extracted from Dec 2013 annual report)
The Pharmaceutical segment includes products in the following areas: anti-
infective, antipsychotic, contraceptive, gastrointestinal, hematology,
immunology, infectious diseases, neurology, oncology, pain management,
thrombosis and vaccines. These products are distributed directly to retailers,
wholesalers and health care professionals for prescription use.
The Medical Devices and Diagnostics segment includes a broad range of
products distributed to wholesalers, hospitals and retailers, used principally in
the professional fields by physicians, nurses, hospitals and clinics.
The Consumer segment includes a broad range of products used in the baby
care, skin care, oral care, wound care and women’s health fields, as well as
nutritional and over-the-counter pharmaceutical products and wellness and
prevention platforms. These products are marketed to the general public and
sold both to retail outlets and distributors throughout the world.
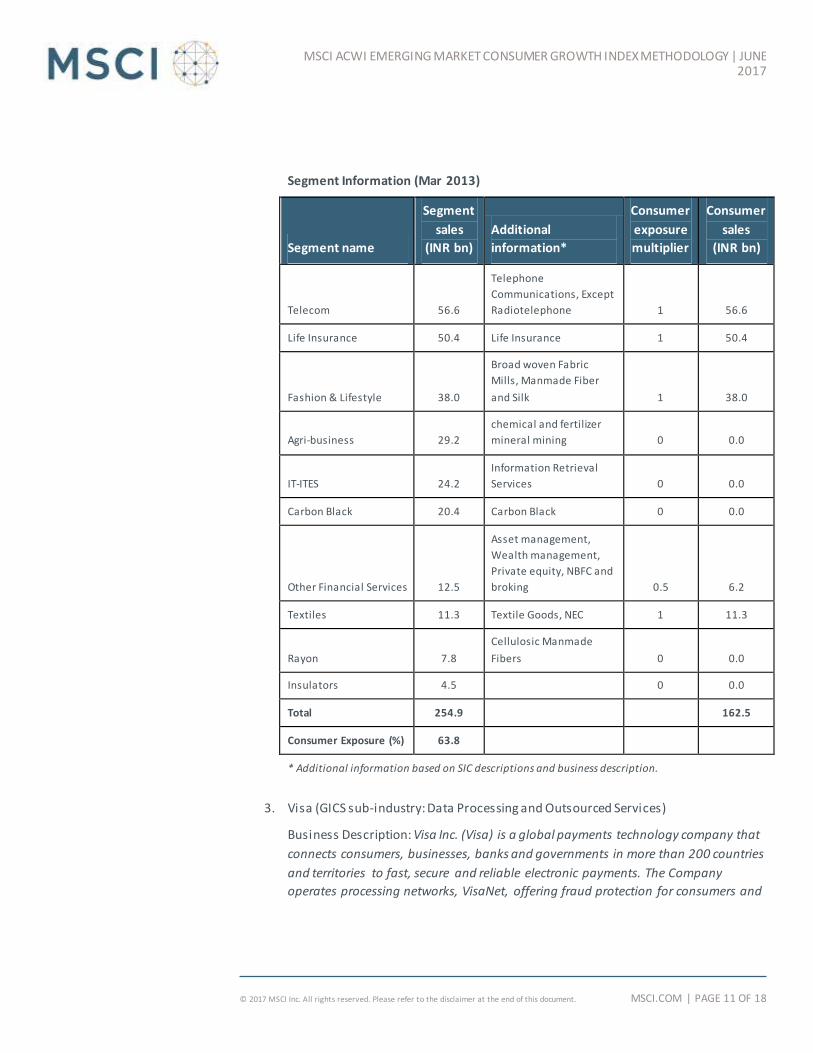
2. Aditya Birla Nuvo (GICS Sub-industry: Industrial Conglomerates)
Business Description: Aditya Birla Nuvo Limited is an India-based diversified
conglomerate. The Company operates in Financial Services, Fashion & Lifestyle,
Telecom, IT-ITeS and Manufacturing. Financial Services provides life insurance, asset
management, Non-Bank Financial Corporation (NBFC), private equity, broking,
wealth management and general insurance advisory businesses. Fashion & Lifestyle
segment is engaged in branded apparels and accessories, and textiles. IT-ITeS
segment is engaged in business process outsourcing services and software services.
Manufacturing includes Agri-business, Carbon Black, Insulators and Rayon Yarn.
MSCI.COM | PAGE 11 OF 18 © 2017 MSCI Inc. All rights reserved. Please refer to the disclaimer at the end of this document.
MSCI ACWI EMERGING MARKET CONSUMER GROWTH INDEX METHODOLOGY | JUNE 2017
Segment Information (Mar 2013)
Segment name
Segment
sales
(INR bn)
Additional
information*
Consumer
exposure
multiplier
Consumer
sales
(INR bn)
Telecom 56.6
Telephone
Communications, Except
Radiotelephone 1 56.6
Life Insurance 50.4 Life Insurance 1 50.4
Fashion & Lifestyle 38.0
Broad woven Fabric
Mills, Manmade Fiber
and Silk 1 38.0
Agri-business 29.2
chemical and fertilizer
mineral mining 0 0.0
IT-ITES 24.2
Information Retrieval
Services 0 0.0
Carbon Black 20.4 Carbon Black 0 0.0
Other Financial Services 12.5
Asset management,
Wealth management,
Private equity, NBFC and
broking 0.5 6.2
Textiles 11.3 Textile Goods, NEC 1 11.3
Rayon 7.8
Cellulosic Manmade
Fibers 0 0.0
Insulators 4.5 0 0.0
Total 254.9
162.5
Consumer Exposure (%) 63.8
* Additional information based on SIC descriptions and business description.
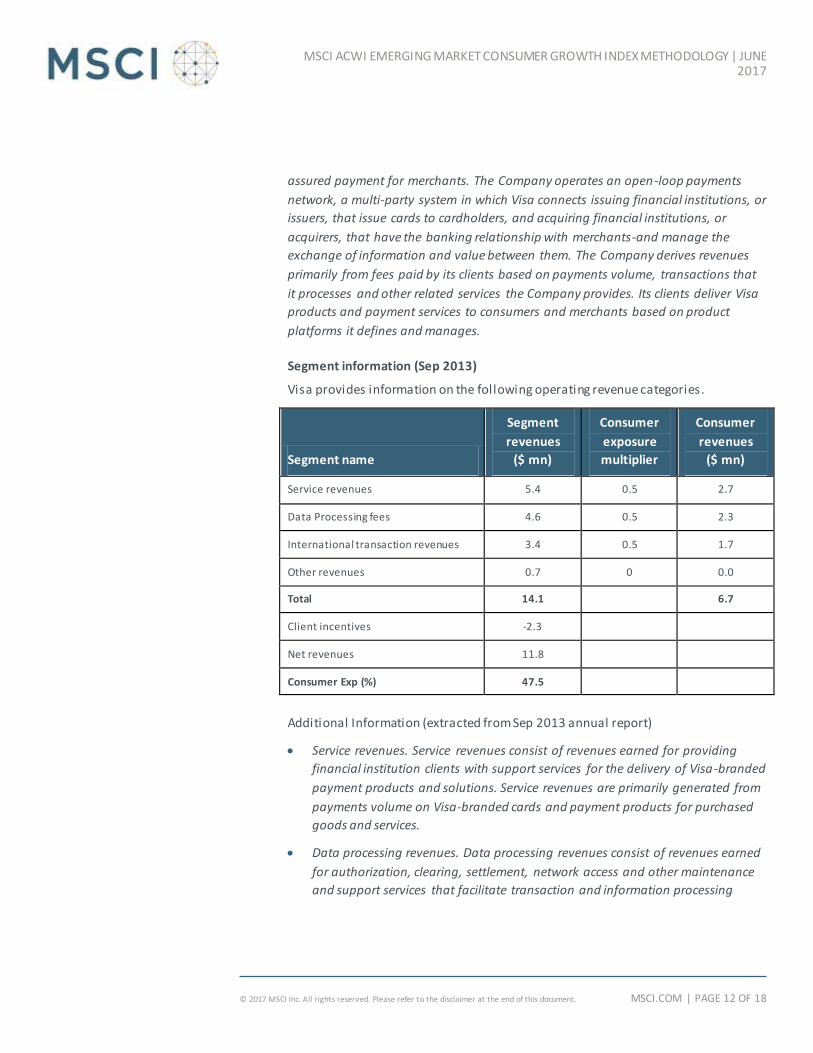
3. Visa (GICS sub-industry: Data Processing and Outsourced Services)
Business Description: Visa Inc. (Visa) is a global payments technology company that
connects consumers, businesses, banks and governments in more than 200 countries
and territories to fast, secure and reliable electronic payments. The Company
operates processing networks, VisaNet, offering fraud protection for consumers and
MSCI.COM | PAGE 12 OF 18 © 2017 MSCI Inc. All rights reserved. Please refer to the disclaimer at the end of this document.
MSCI ACWI EMERGING MARKET CONSUMER GROWTH INDEX METHODOLOGY | JUNE 2017
assured payment for merchants. The Company operates an open-loop payments
network, a multi-party system in which Visa connects issuing financial institutions, or
issuers, that issue cards to cardholders, and acquiring financial institutions, or
acquirers, that have the banking relationship with merchants-and manage the
exchange of information and value between them. The Company derives revenues
primarily from fees paid by its clients based on payments volume, transactions that
it processes and other related services the Company provides. Its clients deliver Visa
products and payment services to consumers and merchants based on product
platforms it defines and manages.
Segment information (Sep 2013)
Visa provides information on the following operating revenue categories.
Segment name
Segment
revenues
($ mn)
Consumer
exposure
multiplier
Consumer
revenues
($ mn)
Service revenues 5.4 0.5 2.7
Data Processing fees 4.6 0.5 2.3
International transaction revenues 3.4 0.5 1.7
Other revenues 0.7 0 0.0
Total 14.1
6.7
Client incentives -2.3
Net revenues 11.8
Consumer Exp (%) 47.5
Additional Information (extracted from Sep 2013 annual report)
Service revenues. Service revenues consist of revenues earned for providing
financial institution clients with support services for the delivery of Visa-branded
payment products and solutions. Service revenues are primarily generated from
payments volume on Visa-branded cards and payment products for purchased
goods and services.
Data processing revenues. Data processing revenues consist of revenues earned
for authorization, clearing, settlement, network access and other maintenance
and support services that facilitate transaction and information processing
MSCI.COM | PAGE 13 OF 18 © 2017 MSCI Inc. All rights reserved. Please refer to the disclaimer at the end of this document.
MSCI ACWI EMERGING MARKET CONSUMER GROWTH INDEX METHODOLOGY | JUNE 2017
among our financial institution clients globally and with Visa Europe. Data
processing revenues are primarily generated from the number of transactions
we process.
International transaction revenues. International transaction revenues consist
of revenues earned for cross-border transaction processing and currency
conversion activities. Cross-border transactions arise when the country of origin
of the issuer is different from that of the merchant. International transaction
revenues are primarily generated by cross-border payments and cash volume.
Other revenues consist mainly of license fees for use of the Visa brand, revenues
earned from Visa Europe in connection with the Visa Europe Framework
Agreement, fees from account holder services, licensing and certification and
other activities related to our acquired entities. Other revenues also include
optional service or product enhancements, such as extended account holder
protection and concierge services.
Client incentives. Client incentives consist of long-term contracts with financial
institution clients and other business partners for various programs designed to
build payments volume, increase Visa-branded card and product acceptance
and win merchant routing transactions over our network. These incentives are
primarily accounted for as reductions to operating revenues.
MSCI.COM | PAGE 14 OF 18 © 2017 MSCI Inc. All rights reserved. Please refer to the disclaimer at the end of this document.
MSCI ACWI EMERGING MARKET CONSUMER GROWTH INDEX METHODOLOGY | JUNE 2017
APPENDIX II: ESTIMATION OF ECONOMIC EXPOSURE OF
COMPANIES
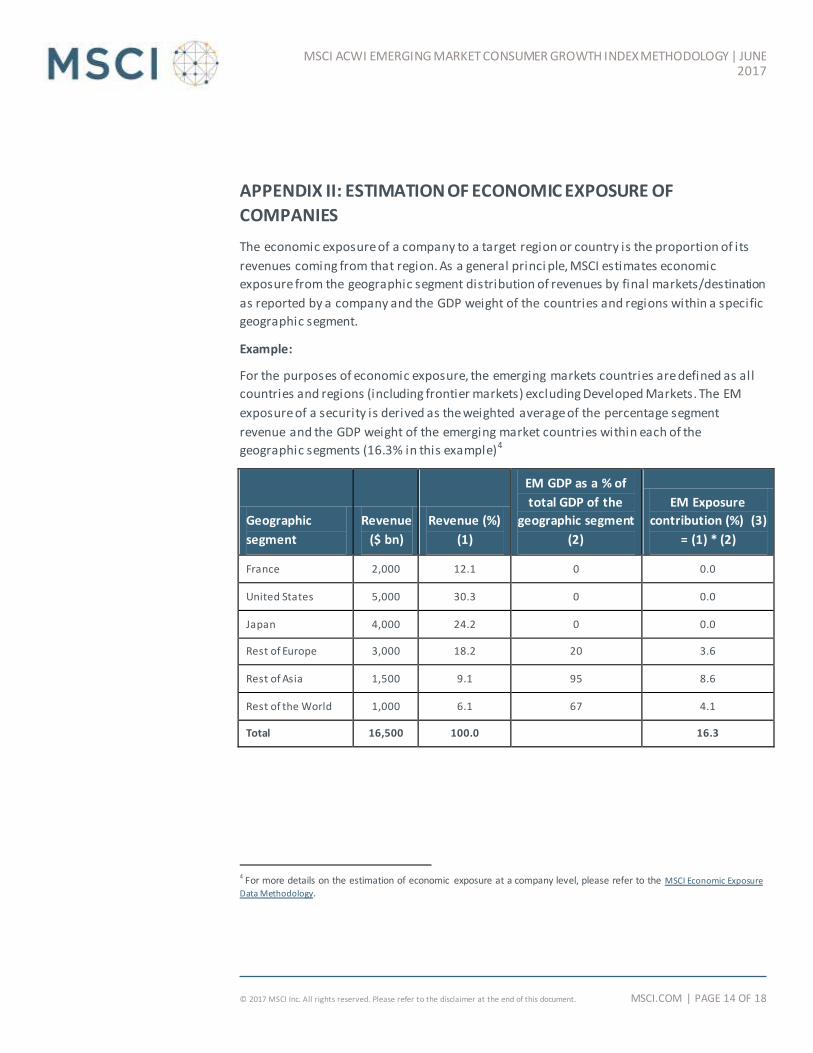
The economic exposure of a company to a target region or country is the proportion of its
revenues coming from that region. As a general princi ple, MSCI estimates economic
exposure from the geographic segment distribution of revenues by final markets/destination
as reported by a company and the GDP weight of the countries and regions within a specific
geographic segment.
Example:
For the purposes of economic exposure, the emerging markets countries are defined as all
countries and regions (including frontier markets) excluding Developed Markets. The EM
exposure of a security is derived as the weighted average of the percentage segment
revenue and the GDP weight of the emerging market countries within each of the
geographic segments (16.3% in this example)4
Geographic
segment
Revenue
($ bn)
Revenue (%)
(1)
EM GDP as a % of
total GDP of the
geographic segment
(2)
EM Exposure
contribution (%) (3)
= (1) * (2)
France 2,000 12.1 0 0.0
United States 5,000 30.3 0 0.0
Japan 4,000 24.2 0 0.0
Rest of Europe 3,000 18.2 20 3.6
Rest of Asia 1,500 9.1 95 8.6
Rest of the World 1,000 6.1 67 4.1
Total 16,500 100.0
16.3
4 For more details on the estimation of economic exposure at a company level, please refer to the MSCI Economic Exposure
Data Methodology.
MSCI.COM | PAGE 15 OF 18 © 2017 MSCI Inc. All rights reserved. Please refer to the disclaimer at the end of this document.
MSCI ACWI EMERGING MARKET CONSUMER GROWTH INDEX METHODOLOGY | JUNE 2017
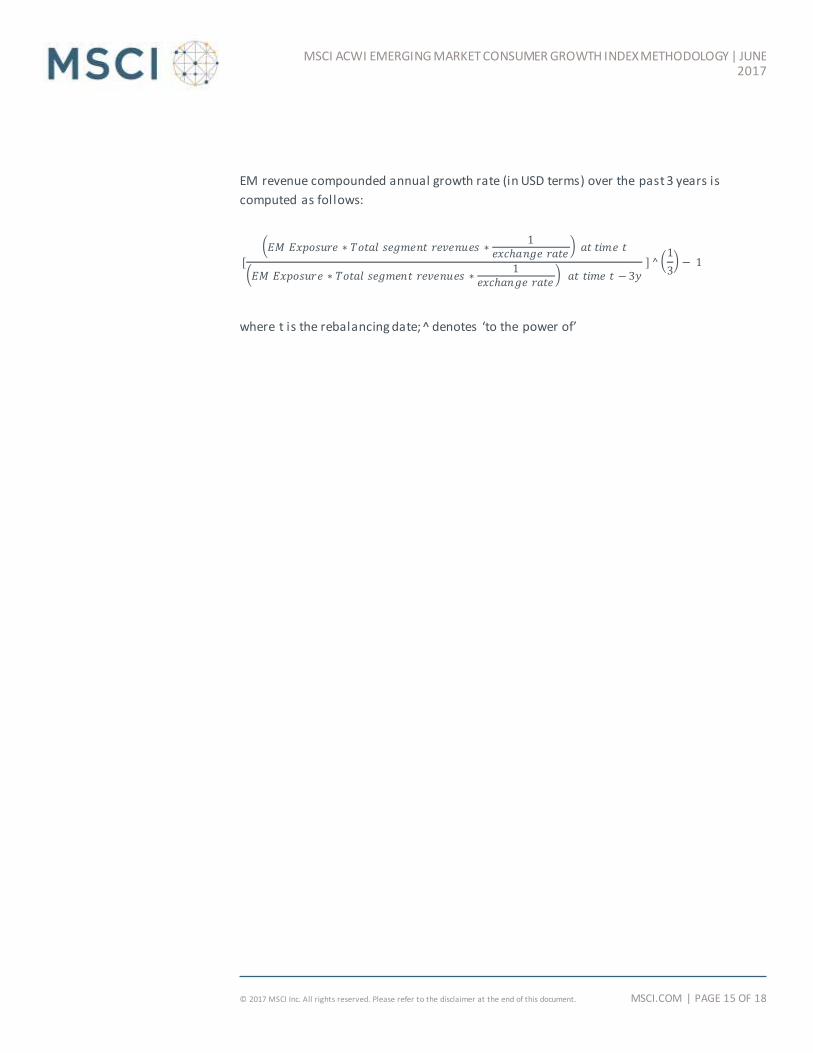
EM revenue compounded annual growth rate (in USD terms) over the past 3 years is
computed as follows:
(
)
(
)
(
)
where t is the rebalancing date; ̂ denotes ‘to the power of’
MSCI.COM | PAGE 16 OF 18 © 2017 MSCI Inc. All rights reserved. Please refer to the disclaimer at the end of this document.
MSCI ACWI EMERGING MARKET CONSUMER GROWTH INDEX METHODOLOGY | JUNE 2017
The following sections have been modified since April 2014: Appendix III in the previous version of the methodology book describing the Corporate
Events treatment has been deleted. The details on the Corporate Events treatment are now included in Section 3.3.
MSCI.COM | PAGE 17 OF 18 © 2017 MSCI Inc. All rights reserved. Please refer to the disclaimer at the end of this document.
MSCI ACWI EMERGING MARKET CONSUMER GROWTH INDEX METHODOLOGY | JUNE 2017
AMERICAS
Americas 1 888 588 4567 *
Atlanta + 1 404 551 3212
Boston + 1 617 532 0920
Chicago + 1 312 675 0545
Monterrey + 52 81 1253 4020
New York + 1 212 804 3901
San Francisco + 1 415 836 8800
Sao Paulo + 55 11 3706 1360
Toronto + 1 416 628 1007
EUROPE, MIDDLE EAST & AFRICA
Cape Town + 27 21 673 0100
Frankfurt + 49 69 133 859 00
Geneva + 41 22 817 9777
London + 44 20 7618 2222
Milan + 39 02 5849 0415
Paris 0800 91 59 17 *
ASIA PACIFIC
China North 10800 852 1032 *
China South 10800 152 1032 *
Hong Kong + 852 2844 9333
Mumbai + 91 22 6784 9160
Seoul 00798 8521 3392 *
Singapore 800 852 3749 *
Sydney + 61 2 9033 9333
Taipei 008 0112 7513 *
Tokyo + 81 3 5290 1555
ABOUT MSCI
For more than 40 years, MSCI’s research-
based indexes and analytics have helped
the world’s leading investors build and
manage better portfolios. Clients rely on
our offerings for deeper insights into the
drivers of performance and risk in their
portfolios, broad asset class coverage and
innovative research.
Our l ine of products and services includes
indexes, analytical models, data, real estate
benchmarks and ESG research.
MSCI serves 98 of the top 100 largest
money managers, according to the most
recent P&I ranking.
For more information, visit us at
www.msci.com.
* = toll free
CONTACT US
MSCI ACWI EMERGING MARKET CONSUMER GROWTH INDEX METHODOLOGY | JUNE 2017
MSCI.COM | PAGE 18 OF 18 © 2017 MSCI Inc. All rights reserved.
• This document and all of the information contained in it, including without limitation all text, data, graphs, charts (coll ectively, the “Information”) is
the property of MSCI Inc. or its subsidiaries (collectively, “MSCI”), or MSCI’s licensors, direct or indirect suppliers or any third party involved in making
or compiling any Information (collectively, with MSCI, the “Information Providers”) and is provided for informational purpose s only. The Information
may not be modified, reverse-engineered, reproduced or redisseminated in whole or in part without prior written permission from MSCI.
• The Information may not be used to create derivative works or to verify or correct other data or information. For example (but without limitation),
the Information may not be used to create indexes, databases, risk models, analytics, software, or in connection with the issuing, offering,
sponsoring, managing or marketing of any securities, portfolios, financial products or other investment vehicles utilizing or based on, linked to,
tracking or otherwise derived from the Information or any other MSCI data, information, products or services.
• The user of the Information assumes the entire risk of any use it may make or permit to be made of the Information. NONE OF THE INFORMATION PROVIDERS MAKES ANY EXPRESS OR IMPLIED WARRANTIES OR REPRESENTATIONS WITH RESPECT TO THE INFORMATION (OR THE RESULTS TO BE
OBTAINED BY THE USE THEREOF), AND TO THE MAXIMUM EXTENT PERMITTED BY APPLICABLE LAW, EACH INFORMATION PROVIDER EXPRESS LY
DISCLAIMS ALL IMPLIED WARRANTIES (INCLUDING, WITHOUT LIMITATION, ANY IMPLIED WARRANTIES OF ORIGINALITY, ACCURACY, TIMELINESS,
NON-INFRINGEMENT, COMPLETENESS, MERCHANTABILITY AND FITNESS FOR A PARTICULAR PURPOSE) WITH RESPECT TO ANY OF THE
INFORMATION.
• Without limiting any of the foregoing and to the maximum extent permitted by applicable law, in no event shall any Information Provider have any
liability regarding any of the Information for any direct, indirect, special, punitive, consequential (includi ng lost profits) or any other damages even if
notified of the possibility of such damages. The foregoing shall not exclude or limit any liability that may not by applicabl e law be excluded or limited,
including without limitation (as applicable), any liability for death or personal injury to the extent that such injury results from the negligence or
willful default of itself, its servants, agents or sub-contractors.
• Information containing any historical information, data or analysis should not be taken as an indication or guarantee of any future performance,
analysis, forecast or prediction. Past performance does not guarantee future results.
• The Information should not be relied on and is not a substitute for the skill, judgment and experience of the user, its management, employees, advisors and/or clients when making investment and other business decisions. All Information is impersonal and not tailored to the needs of any
person, entity or group of persons.
• None of the Information constitutes an offer to sell (or a solicitation of an offer to buy), any security, financial product or other investment vehicle
or any trading strategy.
• It is not possible to invest directly in an index. Exposure to an asset class or trading strategy or other categ ory represented by an index is only
available through third party investable instruments (if any) based on that index. MSCI does not issue, sponsor, endorse, market, offer, review or otherwise express any opinion regarding any fund, ETF, derivative or ot her security, investment, financial product or trading strategy that is based on,
linked to or seeks to provide an investment return related to the performance of any MSCI index (collectively, “Index Linked Investments”). MSCI
makes no assurance that any Index Linked Investments will accurately track index performance or provide positive investment returns. MSCI Inc. is
not an investment adviser or fiduciary and MSCI makes no representation regarding the advisability of investing in any Index Linked Investments.
• Index returns do not represent the results of actual trading of investible assets/securities. MSCI maintains and calculates indexes, but does not
manage actual assets. Index returns do not reflect payment of any sales charges or fees an investor may pay to purchase the securities underlying the
index or Index Linked Investments. The imposition of these fees and charges would cause the performance of an Index Linked Investment to be
different than the MSCI index performance.
• The Information may contain back tested data. Back-tested performance is not actual performance, but is hypothetical. There are frequently
material differences between back tested performance results and actual results subsequently achieved by any investment strat egy.
• Constituents of MSCI equity indexes are listed companies, which are included in or excluded from the indexes according to the application of the
relevant index methodologies. Accordingly, constituents in MSCI equity indexes may include MSCI Inc., clients of M SCI or suppliers to MSCI. Inclusion
of a security within an MSCI index is not a recommendation by MSCI to buy, sell, or hold such security, nor is it considered to be investment advice.
• Data and information produced by various affiliates of MSCI Inc., including MSCI ESG Research LLC and Barra LLC, may be used in calculating certain
MSCI indexes. More information can be found in the relevant index methodologies on www.msci.com.
• MSCI receives compensation in connection with licensing its indexes to third parties. MSCI Inc.’s revenue includes fees based on assets in Index
Linked Investments. Information can be found in MSCI Inc.’s company filings on the Investor Relations section of www.msci.com.
• MSCI ESG Research LLC is a Registered Investment Adviser under the Investment Advisers Act of 1940 and a subsidiary of MSCI Inc. Except with respect to any applicable products or services from MSCI ESG Research, neither MSCI nor any of its products or services recommends, endorses,
approves or otherwise expresses any opinion regarding any issuer, securities, financial products or instruments or trading strategies and MSCI’s
products or services are not intended to constitute investment advice or a recommendation to make (or refrain from making) any kind of investment
decision and may not be relied on as such. Issuers mentioned or included in any MSCI ESG Research materials may include MSCI Inc., clients of MSCI
or suppliers to MSCI, and may also purchase research or other products or services from MSCI ESG Research. MSCI ESG Research materials, including
materials utilized in any MSCI ESG Indexes or other products, have not been submitted to, nor received approval from, the Uni ted States Securities
and Exchange Commission or any other regulatory body.
• Any use of or access to products, services or information of MSCI requires a license from MSCI. MSCI, Barra, RiskMetrics, IPD, FEA, InvestorForce, and other MSCI brands and product names are the trademarks, service marks, or registered trademarks of MSCI or its subsidiaries in the United States and other jurisdictions. The Global Industry Classification Standard (GICS) was developed by and is the exclusive property of MSCI and Standard & Poor’s. “Global Industry Classification Standard (GICS)” is a service mark of MSCI and Standard & Poor’s.
NOTICE AND DISCLAIMER