msc final report - wur
TRANSCRIPT
MSc Final Report Impact of Forward Vertical Integration (FVI) on current Customer relationship. A case study of North East Pharmaceutical Group (NEPG).
Education Program: MSc Food Technology (Food Innovation and Management)
Course code: MST-80436, ECTS: 36
Student Name: Shutong Chen
Student Number: 920822157060
Supervisor: Prof. dr. Jacques Trienekens
Co-reader: Prof. dr. Emiel Wubben
Thesis Group: Management Studies (MST), Wageningen UR

1
Table of Contents
Chapter 1 Introduction ............................................................................................................... 3
1.1 Pharmaceutical Value Chain ............................................................................................. 3
1.2 Chinese Vitamin C Production and NEPG ......................................................................... 4
1.3 Problem statement .......................................................................................................... 4
1.4 Objective and Research Questions .................................................................................. 5
1.5 Research Design and Framework ..................................................................................... 6
1.5.1 Research Design ........................................................................................................ 6
1.5.2 Research Framework ................................................................................................. 6
Chapter 2 Literature Review ...................................................................................................... 8
2.1 Forward Vertical Integration ............................................................................................ 8
2.1.1 Dimensions of forward vertical integration .............................................................. 8
2.1.2 Value creation strategies and effect on company’s performance .......................... 10
2.2 Customer relationship .................................................................................................... 13
2.2.1 Factors determine customers’ willingness to repurchase ...................................... 15
2.2.2 Customer relationship quality ................................................................................. 16
2.3 Conceptual Framework .................................................................................................. 17
2.3.1 Forward Vertical Integration and Customers’ willingness to repurchase .............. 17
2.3.2 Current relationship quality .................................................................................... 18
2.3.3 Conceptual framework ............................................................................................ 19
Chapter 3 Methodology ........................................................................................................... 20
3.1 Research Design ............................................................................................................. 20
3.2 Data collection ................................................................................................................ 20
3.3 Analytical method .......................................................................................................... 23
3.4 Triangulation .................................................................................................................. 25
3.5 Validity and Limitation ................................................................................................... 25
Chapter 4 Results and analysis ................................................................................................. 27
4.1 Customer’s interview result ........................................................................................... 27
4.2 Company’s interview result ............................................................................................ 33
Chapter 5 Discussion ................................................................................................................ 36
Chapter 6 Conclusion & Recommendations ............................................................................ 38
A reference case – Case study of Aland (Jiangsu) Nutraceutical Co., Ltd. ............................... 40
References ................................................................................................................................ 41
Appendix 1 Company interview questions .............................................................................. 50
Appendix 2 Customer interview questions (and Expected answer) ........................................ 51
Appendix 3 Customer company details and type of respond .................................................. 52

2
Appendix 4 Coded interview transcripts (Company) ............................................................... 52
Appendix 5 Coded interview transcripts (Customer) ............................................................... 52

3
Chapter 1 Introduction This introduction section introduces the pharmaceutical value chain and explains the current Chinese
vitamin C powder industry. Then the case company is introduced, and the aim of forward vertical
integration will be discussed. Finally, its influence on customer relationships will be discussed.
1.1 Pharmaceutical Value Chain
The pharmaceutical industry develops, produces, and markets drugs or pharmaceutical licensed for
use as medications. Pharmaceutical are allowed to deal in generic or brand medications and medical
devices. They are subject to a variety of laws and regulations regarding the patenting, testing and
ensuring safety and marketing of drugs. In the pharmaceutical industry value chain (Figure 1),
comprises of four main components, namely (a) manufacturing of the active pharmaceutical
ingredients (APIs), (b) manufacturing of the end product (medicine), (c) distribution to the dispensing
point such as pharmacy or wholesaler and (d) dispensing to the consumer (Aitken, 2016). He stated
that there are two categories of manufacturing required for drug production: API manufacturers
produce the raw ingredients which will be used in medicine; and the end product manufacturers which
produce the finished dose form to be sold to the trading companies and consumed by the patient.
According to CphI China (www.cphi.com, accessed 29th May 2017), China is the world’s largest
producer and exporter of active pharmaceutical ingredients (APIs) and it has the world’s second largest
pharmaceutical market. In 2014, the global API market reached 130 billion dollars, with a compound
annual growth rate (CAGR) of 7%, by which China covers 40% of global APIs production. It is believed
that the Chinese API industry will develop more rapidly in the foreseeable future, which will rise to 180
billion dollars in 2020. However, most of the products are sold to the end product manufacturing
companies and more than 70 times profit will be created by them (X. Su, personal communication, 06-
09-2017). Currently there are five different types of vitamin C end product which include vitamin C
chewable tablet, vitamin C effervescent tablet, vitamin C powder drink and vitamin C mixed tablets
(with vitamin A and vitamin E, etc.) (NEPG Annual Report 2015/2016, 2016). Take the vitamin C
chewable tablet for example, the raw vitamin C powder content is about 10% of the whole tablet but
the price of the end is 10 times than the raw vitamin C powder.
Figure 1 Illustration of the pharmaceutical value chain

4
1.2 Chinese Vitamin C Production and NEPG
Among all the Chinese APIs varieties, Chinese Vitamin C powder industry is a representative example.
Chinese Vitamin C industry is one of the few Chinese APIs which has its own patent and pricing power.
In 2015, global demand for Vitamin C stood at 120,000 tonnes and China managed to capture over 80%
of the global market (www.foodnavigator-asia.com, accessed 1st June 2017). There are five major
Vitamin C production companies in the world, which are CSPC Pharmaceutical Group. Ltd, North China
Pharmaceutical Company. Ltd, Northeast Pharmaceutical Group. Ltd (abbr. NEPG), Royal DSM
(Jiangshan). Ltd and Shandong Ruby Pharmaceutical. Ltd. All, except for Royal DSM (Jiangshan). Ltd,
which is a Dutch-Chinese joint venture enterprise, are from China. This is because the Chinese Vitamin
C production has a relatively competitive advantage in low labor costs, next to advantages in high yield,
and strong quality control processes.
NEPG is a Chinese state-owned pharmaceutical company with many years of experience, majoring in
producing Active Pharmaceutical Ingredients (API). One of their best-selling product is Vitamin C
powder, with annual production of 20,000 tonnes, which ranks the 2nd place in China (NEPG Annual
Report 2015/2016, 2016). In China, the Vitamin C powder is exported mainly to Europe, it is also
exported to South and North America, Japan, Korea, China and other countries in the world (NEPG
Annual Report 2015/2016, 2016). According to the NEPG Annual Report, about 47% of its vitamin C
powder customers are located in Europe, in which most of them are the distributors/trading
companies. The western distributors/trading companies sell the vitamin C powder to the end product
producers: Some of them also customize the raw vitamin C powder based on their customers’
requirements. Then the end product producers further process the vitamin C powder to make the food,
feed, food supplements, cosmetics and vitamin C drinks, etc. To date, the raw vitamin C powder as an
API, its price shows a cyclical variation (NEPG Major Product Research Report, 2012). Different medical
preparations (which are made to different concentrations) have different prices. Use vitamin C
chewable tablets as an example, the price of 1-gram vitamin C powder is charged 325 times more in
the tablet than just 1 gram of pure vitamin C powder. (X. Su, personal communication, 06-09-2017).
If we calculate the extreme situation, the price of the vitamin C powder in the final product is charged
70 -600 times more than the raw Vitamin C powder. This added-value is mostly created by the western
downstream customers who process the powder to the tablet. This situation is a prevalence in the
Chinese Vitamin C powder industry, who is exported their product to the end product manufacturing
company without adding value (NEPG Major Product Research Report, 2012). Among all the Chinese
API industry, NEPG is just one example of the companies whose products are low value added. If NEPG
continues to operate in a low value-added situation, the company will be unprofitable with the raw
vitamin C powder production. In order to change the current situation, which by supporting the API
manufacturing company to increase the bargaining power towards the generic from medicine
producer. Also helping the company to capture more benefit within the market, forward vertical
integrate was proposed by the company as a possible solution to this situation (NEPG Major Product
Research Report, 2012).
1.3 Problem statement
In the pharmaceutical industry, Kubo (2011) stated that the most common type of vertical integration
is backward vertical integration. This backward vertical integration has two possible causes, which are
(1) “provide the company with early access to high quality active pharmaceutical ingredients and
improve the profitability, in addition to further enhancing the R&D capabilities (Kubo, 2011; Karwal,
2006)” and (2) “avoid sourcing API from a competitor (Stafford, 2006, p.302). Karwal (2006) points out
that “Many key API suppliers, especially from India, China and Eastern Europe, are moving up the value

5
chain and decreasing their supply activities, becoming direct competitors in finished form generics”.
However, there is a gap of analyzing the incentives of forward vertical integration in pharmaceutical
industry and lack of empirical research of how this could successfully implement in an API
manufacturing company.
To date, NEPG’s Vitamin C powder production is in the upstream of the whole pharmaceutical value
chain and it is low value-added. In order to improve Chinese Vitamin C industry’s low value-added
production and get more profit, value creation is necessary. One concrete manifestation of value
creation is profit maximization (Jensen, 2001). According to Bowman & Ambrosini (2000), a process
by which the value can be exchanged and realized by the next tier customers can be defined as a value
creation process. He also stated that the result of value creation process could be an increased value
of the product, which by increasing the product value and its price. In order to add value to vitamin C
powder production and be able to charge more price, NEPG decided to integrate forward. The idea of
forward vertical integration is to change the production process from only producing powder to further
process the various end products (Figure 1). This value creation process could be defined as a hybrid
strategy within Faulkner & Bowman (1995)’s strategy clock. They proposed a pie chart to illustrate the
price and perceived value, which showed the applicable strategies. These strategies include low price
strategy, differentiation strategy and hybrid strategy. In which the hybrid strategy could both help the
company to eliminate the intermediate cost and enable the company to produce various products.
However, broaden the product portfolio may result in a conflict with customers’ current product
portfolio, which could lead to a clash of both parties’ benefit. Jensen (2001) stated that company
cannot create value without good relations with customers or suppliers. To retain the existing
customers, firms need to deploy and leverage resources to achieve superior performance. (Day, 1994;
Morgan, 2009). They are usually embedded in organizational processes and enables firm to coordinate
their activities more effectively (Day, 1994). Literature stated that a lower price or various customized
product range could influence the current customer’s relationships which in terms of customer’s
willingness to buy (Anderson et al., 2004; Yu et al., 2013). However, there are factors that can mediate
the customers’ willingness to buy, such as the customers’ attitudes over the company’s current
performance and the customers’ attitudes over the company’s current relationship quality.
Since there is still much uncertainty between forward vertical integration in the Chinese Vitamin C
industry and its influence on the current customer’s willingness to buy, it is of interest to analyze the
direct relation between forward vertical integration and the possible changes of current customer’s
willingness to buy. Also, the mediating attributes will be analyzed; the identified factors and relations
may then be useful for the NEPG.
1.4 Objective and Research Questions
The objective of this study is to help NEPG to capture benefits from forward vertical integration by
identifying the relation between company’s capabilities regarding to forward vertical integration and
possible changes of current customer’s willingness to buy the new product among its current EU
customers.
Thus, the general research question (GRQ) of this study is: what is the impact of forward vertical
integration on customer’s willingness to buy among NEPG’s current EU customers?
To answer this general research question, the following specific research questions (SRQs) need to be
answered; the words in bracket shows in which chapter and research phase that particular questions
will be answered:
6
(1) What are the measurable factors such as forward vertical integration, current relationship quality,
customers’ willingness to buy and its relation to the new customer relationships? [Literature review –
Theoretical Phase]
(2) What are the NEPG’s current customers’ perceptions regarding to the selected factors? [Primary
data collection & Results – Empirical Phase]
(3) What are the NEPG’s capabilities to offer its current EU customers regarding to the selected factors?
[Primary data collection & Results – Empirical Phase]
(4) What are the gaps and possible matches between NEPG and its current EU customers regarding to
forward vertical integration? [Data analysis – Analysis Phase]
(5) What are the options for NEPG regarding to forward vertical integration and how do they affect the
new customer relationships? [Conclusion & Recommendation – Conclusion Phase]
1.5 Research Design and Framework
1.5.1 Research Design
The research design establishes the decision-making process, conceptual structure of investigation and
methods of analysis used to address the central research problem of this study. The aim of this study
was to analyze the direct relation between forward vertical integration and its influence on current
customer relationship and draw the managerial implications. To achieve this goal, a cross-sectional
study design was selected, which was the most common type of study design in the social sciences
(Kumar, 2011). This choice was based on two reasons. Firstly, Kumar (2011) stated that the best deign
of a study is cross-sectional when the findings in the research will be authentic for a limited period of
time after this study. In this study, several factors that could influence the current relationship were
proposed. To test the feasibility of these factors, interviews were done with NEPG’s managers and its
current EU customers. According to the interviews, the best match of both party’s preferences was
compared and analyzed. In this way, a compromise was made between NEPG and its current EU
customers. Hence, a cross-sectional design was used, because it allows for the comparison of different
groups of people in one point in time.
1.5.2 Research Framework
The research framework of this research can be found in Figure 2 and serves as a tool to clarify the
whole research process. The research framework that was used in this research was divided into four
phases namely theoretical, empirical, analysis and conclusion respectively. The arrows in Figure 2
represents the sequence of initiation of the research. The theoretical phase consists of the literature
review of hypothesis about forward vertical integration, customer relationships in terms of factors
influence relationship quality, and customers’ willingness to buy. Afterwards, the empirical phase was
divided into two different data collection methods, namely customer interviews and company
interviews. The outcome from both data collection methods were then used for the comparison, which
aimed to find the possible gaps and matches between NEPG and its current EU customers. Lastly, the
conclusion phase summed up the result of the analysis and provides the managerial suggestions for
NEPG regarding to forward vertical integration and how do they affect the new customer relationships.

7
Figure 2 Research Framework
8
Chapter 2 Literature Review To answer the question “ What are the measurable factors such as forward vertical integration, current
relationship quality, customers’ willingness to buy and its relation to the new customer relationships?”,
the literature review covers the existing theoretical frameworks of three main concepts namely
forward vertical integration, value creation and customer relationship. This literature review will start
by identifying prior works and concepts done within value addition through forward vertical
integration. Then, the review will continue by elaborating the frameworks of customer relationships,
followed by the variables about customers’ perceptions. This chapter closes by answering the stated
specific research question and build the hypotheses, coherently presented by the conceptual
framework.
2.1 Forward Vertical Integration
In this review subsection, the incentive and the benefit of forward integration will be elaborated. Also,
to successfully integrate, what actions/changes should company make/facilitate will be discussed.
Then the strategies of forward vertical integration which are prevalence in pharmaceutical industry
will be listed. Finally, the applicability level of these forward vertical integration methods to the
Chinese pharmaceutical industry will be discussed
2.1.1 Dimensions of forward vertical integration
The concept of forward vertical integration was discussed in different studies. Buzzell (1983) stated
that vertical integration can have a significant impact on business performance, which could be crucial
to survival. However, different dimensions need to be combined to an overall forward vertical
integration measure. As such there are not only different dimensions but also different perceptions of
what is a success or failure.
Harrigan (1985) proposed a dynamic concept of vertical integration in which, the key to effective
management is to understand the corporate needs for the intrafirm cooperation. Therefore, a
corporate strategy need to be developed in order to vertically integrated. Harrigan (1985) also
suggested that firms may adjust the dimensions of their vertical integration strategies to suit
competitive or corporate needs. He stated several dimensions of integrations need to be taken into
consideration, which are:
(1) Stages of integration. The number of steps in the chain of processing which a firm engages in - from
ultra-raw materials to the final consumer - determines the number of stages of integration. Harrigan
(1985) stated that the number of integrated stages matters if firm do not manage complexity well and
the firm should define the boundaries of vertical integration.
(2) Breadth of integration. The way that firms define their SBU’s boundaries vary. The number of
activities firms perform in-house at any particular level of the vertical chain determines the breadth of
integration of the SBU at that level. Breadth of integration matters because plants that try to produce
too many diverse components for a product line may lose opportunities to enjoy scale economies.
Harrigan (198) argues the breadth of integration matters because plants that try to produce too many
diverse components for a product line may lose opportunities to enjoy the scale economies. He also
stated that overly broad manufacturing policies could also mean that SBUs lose cost advantages of
purchasing components or services from more efficient outsiders.
(3) Degree of integration. Degrees of integration determines the proportion of total output (of a
particular component or service) an SBU purchases from (or sells to) its sister SBUs. Fully integrated

9
SBUs transfer 95% or more of their requirements for a particular resource in-house. Taper integrated
firms purchase more than 5% of their requirements for that resource form outsiders (Crandall, 1968).
(4) Form of integration. Although many firms prefer to own vertically integrated units entirely, they
need not own a business unit to control it and enjoy the benefits of vertical relationships, for a variety
of other control arrangements are possible. In many environments, firms can obtain leverage over
other’s assets without owning them fully. Often firms can secure knowledge, services, and materials
in this manner with only a small ownership stake.
All vertical integration strategies encompass degree, stages, breadth, and form (Harrigan, 1985). He
also stated that there could be some combination among these dimensions and the decision to alter
one dimension of strategy will affect the values of other dimensions.
Pharmaceutical market consists of an upstream segment that manufactures active pharmaceutical
ingredients, and a downstream segment that processes the active pharmaceutical ingredients into
finished formulations and supplies them to final consumers. In the pharmaceutical industry, the most
common type of vertical integration is backward vertical integration. Kubo (2011) states that there are
two possible reasons of vertical integration in the pharmaceutical industry, which are (1) “provide the
company with early access to high quality active pharmaceutical ingredients and improve the
company’s profitability, in addition to further enhancing our R&D capabilities”, and (2) “avoid sourcing
API from the competitor” (Stafford, 2006).
On the other hand, the most common type of forward vertical integration in pharmaceutical industry
is Marketing/R&D integration, open innovation and “keep every production in-house” strategy. Since
the product innovation is risky and time consuming, with R&D costs representing a high proportion of
sales revenues (DiMasi et al., 1991). Moreover, R&D cost will also influence the pattern of international
resource allocation and firms’ competitiveness. The aim of forward vertical integration in
pharmaceutical industry is in concordance with the general idea of forward integration. Therefore, the
vertical integration in pharmaceutical industry is to better understand the consumers’ needs and
shorten the R&D time (Balakrishnan & Wernerfelt, 1986; Cockburn, 2004; Harrigan, 1986). Researchers
stated the most common form for forward vertical integration in pharmaceutical industry is
Marketing/R&D integration, open innovation and keep every aspect in-house integration (Becker &
Lillemark, 2006; Chesbrough, 2006; Chesbrough & Appleyard, 2007; Gassmann, Enkel, & Chesbrough,
2010; DCAT Week highlights pharma challenges, retrieved Oct. 2017). Becker and Lillemark (2006)
studied a European pharmaceutical firm about the integration of marketing and R&D sectors. They
classified Marketing/ R&D integration as a cross-functional integration and its main motivation comes
from its beneficial effects on new product development performance (Becker & Lillemark, 2006; Griffin
& Hauser, 1996; Song, Thieme & Xie, 1998; Song, Montoya-Weiss & Schmidt, 1997). Becker and
Lillemark (2006) argued that to improve the cost effectiveness, Marketing/ R&D integration has an
opportunity to add value by producing fuller documentation of a drug’s profile than what is strictly
needed to obtain regulatory approval. He proposed that study the integration of marketing and R&D
in the context of the pharmaceutical industry seems particularly promising for a number of reasons.
Such as understanding consumer needs, marketing as a source of innovation, translating consumer
needs into workable products, testing and forecasting However, Marketing/R&D integration are met
with several barriers such as timing of integration, cost of integration, level of integration and mentality
difference, etc.
Open innovation is a trend to improve the productivity and probability of success (Khanna, 2012).
However, there is a lack of detailed literature about forward vertical integration by “keeping every
10
production in-house integration” in the pharmaceutical industry, which means to integrate
forward/backward to produce every product by the company itself. Especially in the API industry, it
seems more lucrative if the company forward vertical integrate from making ingredients to make
finished products.
Despite there are many influence factors of the implementation of forward vertical integration (such
as company’s capabilities, dimensions of integration, etc.) and lack of literatures about forward vertical
integration in pharmaceutical industry, it is promising to give an empirical proof of vertical integration
through “keep every production in-house” strategy. In order to analyze how could pharmaceutical
industry successfully forward integrate, the aforementioned dimensions will be adopted and used in
this research.
2.1.2 Value creation strategies and effect on company’s performance
In this review subsection, strategies of value creation will be elaborated. Then, the specific type of
value creation strategies which fits the forward vertical integration will be explained. Moreover, its
applicability and influence on the performance of Chinese pharmaceutical industry will be discussed.
In the end, the relation among value creation, forward vertical integration and customer relationship
will be discussed.
2.1.2.1 Value creation strategies
Value creation is the purpose of the firm to create and deliver value in an efficient enough way that
will generate profit after cost (Jorgenson, 2015). Also, it is stated that the realization and maximization
of profit is an objective function of value maximization and thus, a necessary precondition for the
survival of a company (Jensen, 2001; Kalwani, 1995). To create value, a company must possess unique
skills that can help it to differentiate from its competitors, in terms of quality, product service,
technology or cost. A company that maintains its competitive advantage is able to surpass competitors
in the long term (Liu, 2013). To strive for a company’s competitive advantage in the market, firms may
position themselves in specific manners trying to achieve cost leadership, differentiation leadership,
cost focus or differentiation focus, etc. (Johnson, Scholes, & Whittington, 2009). These strategies are
adapted from Porter (2008)’s three generic strategies, Faulkner & Bowman (1995)’s strategy clock and
Treacy & Wiersema (1993)’s value disciplines (
Figure 3).
In Porter (2008)’s three generic strategies, he stated a company can achieve its competitive advantage
by choosing either of the following three ways, which are cost leadership, differentiation and focus
strategies. Cost leadership strategy means the company becomes the lowest-cost company by either
lower the input cost (e.g. location, contracts) or reach the economies of scale (e.g. operational
efficiency). As an alternative, differentiation strategy involves the uniqueness along some dimension
that is sufficiently valued by customers to allow a price premium. In the end, focus strategy is to target
a narrow segment of domain of activity and tailors its products or services to the need of that specific
segment, to the exclusion of others (Porter, 2008). However, Porter (2008) argues that the company
can only achieve its competitive advantage by either lowering costs than its competitors or having a
superior products or services that are “differentiated” from competitor’s products. The company who
wants to implement both strategies in the same time will stuck in the middle and end up with failure.
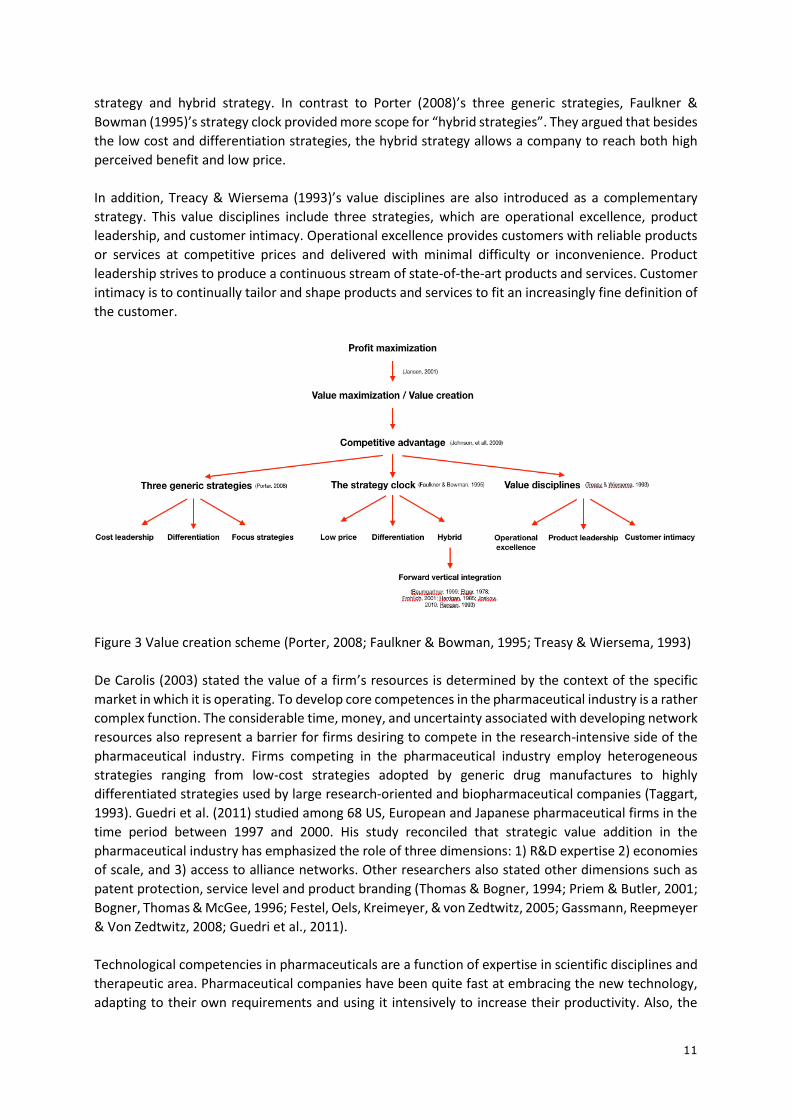
However, Faulkner & Bowman (1995)’s strategy clock provides another way of approach. There are
three competitive strategies in their strategy clock, which are low-price strategy, differentiation
11
strategy and hybrid strategy. In contrast to Porter (2008)’s three generic strategies, Faulkner &
Bowman (1995)’s strategy clock provided more scope for “hybrid strategies”. They argued that besides
the low cost and differentiation strategies, the hybrid strategy allows a company to reach both high
perceived benefit and low price.
In addition, Treacy & Wiersema (1993)’s value disciplines are also introduced as a complementary
strategy. This value disciplines include three strategies, which are operational excellence, product
leadership, and customer intimacy. Operational excellence provides customers with reliable products
or services at competitive prices and delivered with minimal difficulty or inconvenience. Product
leadership strives to produce a continuous stream of state-of-the-art products and services. Customer
intimacy is to continually tailor and shape products and services to fit an increasingly fine definition of
the customer.
Figure 3 Value creation scheme (Porter, 2008; Faulkner & Bowman, 1995; Treasy & Wiersema, 1993)
De Carolis (2003) stated the value of a firm’s resources is determined by the context of the specific
market in which it is operating. To develop core competences in the pharmaceutical industry is a rather
complex function. The considerable time, money, and uncertainty associated with developing network
resources also represent a barrier for firms desiring to compete in the research-intensive side of the
pharmaceutical industry. Firms competing in the pharmaceutical industry employ heterogeneous
strategies ranging from low-cost strategies adopted by generic drug manufactures to highly
differentiated strategies used by large research-oriented and biopharmaceutical companies (Taggart,
1993). Guedri et al. (2011) studied among 68 US, European and Japanese pharmaceutical firms in the
time period between 1997 and 2000. His study reconciled that strategic value addition in the
pharmaceutical industry has emphasized the role of three dimensions: 1) R&D expertise 2) economies
of scale, and 3) access to alliance networks. Other researchers also stated other dimensions such as
patent protection, service level and product branding (Thomas & Bogner, 1994; Priem & Butler, 2001;
Bogner, Thomas & McGee, 1996; Festel, Oels, Kreimeyer, & von Zedtwitz, 2005; Gassmann, Reepmeyer
& Von Zedtwitz, 2008; Guedri et al., 2011).
Technological competencies in pharmaceuticals are a function of expertise in scientific disciplines and
therapeutic area. Pharmaceutical companies have been quite fast at embracing the new technology,
adapting to their own requirements and using it intensively to increase their productivity. Also, the
12
advent of new technology increases the probability of discovering new molecules. Firstly, by
shortening the time necessary for scanning for the suitable molecules for an identified disease.
Secondly, by allowing the holders of the technology to scan across a range of therapeutic indications.
This potentially creates a competitive edge for those pharmaceutical producers who possess
ownership advantages in the new technology over others do not. Also, on the other hand, pursing new
products in one therapeutic area can enhance learning in other areas. Schweizer (2005) stated there
is a clear cut between the pharmaceutical industry as it existed in the past and the pharmaceutical
company in its current form as it was shaped through the wave of mergers, acquisitions and the
increasing number of strategic alliances in order to co-exploit new technologies, co-discover new
molecules, co-market new drugs. Allen, Lee & Tushman (1980) and Katz (1988) suggests in technology
driven environments intra-organizational learning enhances research performance. Henderson and
Cockburn (1994) also find that a flow of information across the boundaries of the firm is related to the
research productivity.
Besides the technological competencies, pharmaceutical companies need to effectively market their
new products (De Carolis, 2003). De Carolis (2003) also stated the success of some drugs, particularly
those in the same category, depends on how well a company can differentiate that drug particularly
to doctors or the customers.
2.1.2.2 Effect on company’s performance
Traditionally, economists suggested that vertical integration is motivated by a drive for market power
or cost reduction factors (Bhuyan, 2005; Lin et al., 2014; Carlton & Perloff, 1999, Chapter 12; Yu et al.,
2013). From their empirical research, they found forward integration enables a manufacturer to better
understand customer requirements and better manage the demand side by directly controlling the
retail price. This action allows the manufacturer to provide superior performances, which includes
more innovative products at low cost, which could fit Faulkner & Bowman (1995)’s “hybrid strategy”.
Also, many researchers found that downstream vertical integration plays an important role for
manufacturing firms in several ways (Baumgartner, 1999; Frohlich, 2001; Guan, 2012; Rangan, 1993).
Firstly, it can help firms to secure the distribution channels of their products in order to achieve more
market power, especially in markets with increased uncertainties (Etgar, 1978; Harrigan, 1985; Rangan,
1993). Secondly, it can offer a way to control efficiency gains and transaction cost reductions in the
supply chain (Frohlich, 2001; Joskow, 2010). Thirdly, downstream markets can offer the forward
integrated suppliers important benefits because now they could make more goods and services in-
house (Baumgartner, 1999; Harrigan, 1985). Lin et al. (2014) characterize the main effect of forward
integration is on (1) profitability, (2) product quality, and (3) economy of scale (volume) in competitive
setting. However, the effect of forward integration is twofold, which unilateral forward integration can
harm a manufacturer’s profitability.
In China, the API industry possesses a low R&D intensity, fierce competition over the low-ended
product (X. Su, personal communication, 28-10-2017). The high-quality standard and long R&D period
lead to a high entry barrier of the API industry. Normally, the western manufacture company will
source from two to three API suppliers. Therefore, the competition for the western customer resources
becomes intense. For most of the Chinese API manufacturing companies, includes NEPG, the main
purpose to forward vertical integration is to extend the production line, increase the production
efficiency and quality to get more profit. Since the main advantage in Chinese Vitamin C industry is the
low labor cost and production efficiency. By integrating forward, NEPG could produce versatile
products in a relative low price to meet different customers’ needs.
13
In an exchange relationship a product must first exist, so a relationship can be built around it.
Customers do not have the motivation to continue the relationship merely for the relationship itself
unless they receive a product that meets their standards. Based on the incentive of Chinese
pharmaceutical industry and the purpose of NEPG, the main effect of forward integration which
summarized by Lin et al. (2014) will be adopted and measured in this research. By analyzing how
performance can influence the customer relationship, these measurable factors will be adopted from
the literature and empirically examined in this research.
However, those factors are measuring the direct effect of a company who forward vertically integrated.
According to Walter et al. (2003), if the benefit of a relationship is realized within that relationship, it
is a direct effect. This means that the fulfillment of the function does not depend on other relationships
or factors. These indirect effects include non-product related attributes such as service and
communication (Wilson, 1995) Based on the Maslow’s demand theory, Chen et al. (2005) gives an extra
vision about the communication/interaction. Interaction between the customer and supplier, which
means, more specifically, the face to face interaction. This kind of interaction focus more to the
technical support since the quality of technical support is as the same importance as product quality.
The ability to communicate with exchange partners fosters cooperation and trust in relationships
(Perrien and Ricard, 1995; Deutsch, 1958). Therefore, these indirect factors will also be adopted and
examined in this research.
To sum up, in NEPG Major Product Research Report (2012) it stated that the future Vitamin C
production should aim at both mass-production and lean production. For the low-end product like
pure vitamin C powder, cost leadership could be reached by lower the production cost and improve
the production efficiency. For the high-end product, such as pre-mixed powder products,
differentiation strategy is more suited, as the company should focus on improving the quality,
producing tailored product and providing better service. Since NEPG integrates the production process
from only producing Vitamin C powder to the finished dose forms. This kind of forward vertical
integration in Chinese vitamin C industry could partly meet the concept of Faulkner & Bowman (1995)’s
hybrid strategy, who argued that a company could serve different markets by both being both cost
leadership and differentiate from the competitors. By combining the abilities to respond directly to
customer requests and to provide the customer with a highly interactive, customized experience,
companies have a greater ability today to establish, nature, and sustain long term customer
relationships than ever before (Chen & Popvich, 2003). Besides these advantages, researchers also
indicated that value addition by forward integration could significantly influence the customer
relationship thus customer relationship management (CRM) is needed. However, there is limited
research about the relationship between forward vertical integration and customer relationship in API
industry. Therefore, the relationship between forward vertical integration and customer relationship
in the Chinese vitamin C industry need to be further analyzed, which by using the aforementioned
three aspects.
2.2 Customer relationship
In this review subsection, general idea of customer relationship management will be introduced. Then,
the measurement factors of customer relationships quality will be elaborated. Finally, how can these
factors apply to this research will be discussed.
Management of customer relationships is a key activity for the enterprise. Ways of more effectively
managing relationships with customers are typically addressed under the heading of relationship
marketing (RM), customer relationship management (CRM) and customer management (Frow et al.,
14
2011). However, there is a considerable confusion in the academic and managerial literatures about
how they differ and what the implications might be used each approach for effective customer
management. Parvatiyar and Sheth (2001) argued the terms RM and CRM can be used interchangeably.
While Zablah, Bellenger, & Johnston (2004) and Frow et al. (2011) agreed on that the RM and CRM are
different phenomena, which a clear distinction should be made between them.
According to many researchers, relationship marketing (RM) involves the strategic management of
relationships with multiple stakeholders (Christopher et al., 1991; Doyle, 1995; Gummesson, 1995). It
also emphasizes that customer retention affects company profitability in that it is more efficient to
maintain an existing relationship with a customer than create a new one (Bull, 2003; Payne,
Christopher, Peck & Clark, 1998; Reichheld, Teal & Smith, 1996). Since the existing customer are
already familiar with and require far less persuasion to buy the company’s products or services (Bull,
2003). Empirical evidence stresses that it is critical for a company to build the “right” type of
relationship with its customers (Niraj, Gupta, and Narasimhan, 1996; Reinartz and Kumar, 2000). This
“right” relationship depends on several situational factors, which are organizational design, adequate
incentive schemes, and information technology resources, as well as industry, company, or customer
relationships. These factors may affect the performance of relationship marketing activities.
Customer relationship management (CRM) is defined as an activity that addresses all aspects of
identifying customers, developing customer insight and building customer relationships (Boulding et
al., 2013; Srivastava et al., 1999). Thus, CRM involves the strategic management of relationships
utilizing appropriate technological tools (Frow et al., 2011). Customer management represents parts
of CRM which involves a more tactical management of customer interactions and transactions.
According to Newell (2001), CRM is a useful tool in terms of identifying the right customer groups and
for helping to decide which customer to jettison. There are several CRM value drivers to enhance the
customer equity, which are target profitable customers, integrate offering across channels, customize
products and services and improve service efficiency and effectiveness (Richards & Jones, 2008). The
relationship model was adopted from Frow and Payne (2009), which is shown in Figure 4.
In this research since the research objective is NEPG and its current EU customers and the aim is to retain the current customers. Therefore, to identify the “right” relationship with the customers is our focus. This fits the relationship marketing (RM) theory which stated by Niraj, Gupta, & Narasimhan (1996) and Reinartz & Kumar (2000). In order to identify the “right” relationship, customers’ perceptions will be analyzed. Also, company’s capabilities and strategies will be analyzed, which in respond of customers’ perceptions and preferences regarding to the relationship. This action involves a tactical management of customer interactions and transactions (Boulding et al., 2013; Srivastava et al., 1999; Newell, 2001). Therefore, this study will adopt a combination of both relationship marketing (RM) and customer relationship management (CRM) theory.

15
Figure 4 Relationship marketing, CRM and customer management (Source: Frow and Payne (2009))
2.2.1 Factors determine customers’ willingness to repurchase
In today’s environment, businesses are increasingly dependent on the relationship they have with their
suppliers/customers and are demanding that they adhere to high standards. It is increasingly
important that suppliers have strong relationships with their customers to stay ahead of the
competition. The establishment, development, and maintenance of relationships between exchange
partners is crucial to achieve success (Morgan and Hunt, 1994). There are many advantages for firms
that enter into productive relationships with their customers such as low transactional cost, more
cooperation, lower risk, and information sharing (Ellram, 1995). Research has begun to investigate
what determines the success or failure of relationships between exchange partners by looking at both
seller characteristics and the nature of interactions between suppliers and customers (Crosby, Evans,
and Cowles, 1990; Morgan and Hunt, 1994).
Hellier et al. (2003) stated that these three constructs directly influenced the customers repurchase
intention. Repurchase intention defines the individual’s judgement about buying again a designated
service from the same company, taking into account his or her current situation and likely
circumstances. Hellier et al. (2003) stated that the customer repurchase intention is directly related to
customer perceived quality, perceived value, and perceived equity.
Customer perceived value determines the customers’ overall appraisal of the net worth of the service,
based on the customers’ assessment of what is received (Benefits provided by the service) and what
is given (costs or sacrifice in acquiring and utilizing the service).
Customer perceived quality measures the customers’ overall assessment of the standard of the
service delivery process. This process could be further explained by the product quality, service quality,
and ways of communication/interaction.
Customer perceived equity is the customers’ overall assessment of the standard of fairness and justice
of the company’s service transaction and its customer problem and complaint handling process.
According to many researchers, analysis of the inter-relationships between customer retention factors
can be undertaken at the single transaction (micro) level or at a global (macro) level. In this research,

16
since the NEPG is a Chinese vitamin C manufacturing company and the target customer group is the
European customers. Therefore, macro level framework will be adopted. This is also because the
customer repurchase decision often depends on a general assessment of the service and supplier,
based on multiple service transaction experiences with that supplier (Danaher and Mattsson, 1994;
Liljander and Strandvik, 1995).
2.2.2 Customer relationship quality
Many factors may contribute to the customer repurchase intention. Hellier et al. (2003) stated that
the current relationship quality directly influenced the customers repurchase intention. Researchers
argued that relationship quality has three dimensions, which are commitment, trust and satisfaction
(Parsons, 2002; Crosby, Evans, and Cowles, 1990; Hennig-Thurau and Klee, 1997). Commitment is
often cited as a critical ingredient for determining customer relationship success (Dwyer, Schurr, and
Oh, 1987; Schurr and Ozanne, 1985; Morgan and Hunt, 1994; Wilson, 1995). Trust is believed to
alleviate risk and to increase cooperation in exchange relationships (Schurr and Ozanne, 1985; Swan
and Nolan, 1985). Satisfaction refers to the degree to which interactions between the buyer and the
seller meet their expectations for performance and can be based on evaluations of the tangible
product or non-product related attributes such as service and communication (Wilson, 1995; Hellier
et al., 2003). Parson (2002) summarized the aforementioned dimensions as customers’ perceptions,
since all these three factors are measured from the buyers’ perspective.
According to Parson (2002), customers’ perception variables focus on buyers’ perception of how the
supplier perform in order to influence the relationship quality. In a competitive business situation,
there is always a chance that a seller can be replaced by a competitor. Therefore, it is useful to
understand the supplier’s performance that customers think influence the quality of supplier-customer
relationships. These variables include commitment, trust and satisfaction, which according to many
researchers, measures the customers’ perceived value, perceived quality, and perceived equity.
Commitment is the enduring desire to maintain the relationship and the length of the relationship
(Moorman, Zaltman, and Deshpande, 1992). According to Morgan and Hunt (1994), commitment
should be an important variable in determining successful relationships depend on mutual
commitment between customer and supplier. When motivation to maintain the relationship is high,
then the probability that the quality of the relationship is also high increases. A longer relationship
implies a certain degree of commitment between two parties (Dwyer, Schurr, and Oh, 1987). Therefore,
commitment should be considered as a necessary condition for maintaining relationship quality.
Just like commitment, trust is one of the most widely examined and confirmed constructs in
relationship marketing research (Crosby, Evans, and Cowles, 1990; Morgan and Hunt, 1994; Wilson,
1995). Common to all different definitions used to conceptualize trust there is the notion that trust
constitutes the belief, attitude or expectation of a party that the relationship partner’s behavior or its
outcomes will be for the trusting party’s own benefit (Andaleeb, 1992). Moorman et al (1993) define
trust as “willingness to rely on an exchange partner in whim one has confidence”. Summarizing the
conceptual approaches of other scholars, we summarize trust have three essential components: (1)
the belief that the relationship partner will show benevolence in his or her actions (Anderson and Weitz,
1992; Geyskens, Steenkamp, Scheer, and Kumar, 1996), (2) honesty, which means the trusting party
relies to the relationship partner being credible (E.g. Doney and Cannon, 1997; Ganesan, 1994), (3) the
belief that the relationship partner has the competence to act for the benefit of the relationship
(Andaleeb, 1992; Ganesan, 1994; Moorman, Zaltman and Deshpande, 1992). In this research, we adopt
this approach, for which the concept of trust includes benevolence, credibility, and global trust.

17
According to considerable attention to business relationship consequence, a construct that has
received particular attention within the domain of B2B relationships is trust (Sharif, 2005). It maintains
relationship by staying with existing partner and resisting attractive short-term alternatives.
Satisfaction has been discussed extensively as a central elements of a firm’s marketing concept during
the past two decades and it is considered as a key driver of the long-term relationship between
suppliers and buyers (Anderson and Sullivan, 1993; Churchill and Supernant, 1982; Tse and Wilton,
1988). Anderson and Narus (1984) define satisfaction as “a positive affective state resulting from the
appraisal of all aspects of a firm’s working relationship with another firm”. Customer satisfaction with
a product presumably leads to repeat purchases, acceptance of other products in the same product
line, and favourable word-of-mouth publicity (Cardozo, 1965). Therefore, the knowledge about factors
affecting customer satisfaction is essential. According to Cardozo (1965), Oliver (1980) and Churchill &
Supernant (1982)’s research, satisfaction is built upon the match between product performance (i.e.
quality, price, capacity, etc.) and customer’s expectation. Moreover, Chen et al. (2005) analysed the
factors that affect the degree of customer satisfaction. Boulding et al. (1993) indicate that customer
satisfaction can be transaction specific or cumulative. Transaction specific customer satisfaction may
yield meaningful insight into a particular encounter and may be predictive of additional transactions,
but cumulative satisfaction is a more fundamental conceptualization of a firm’s past, current and
future performance (Anderson et al., 1994). Johnston el al. (2004) stated that the degree to customer
satisfaction can be enhanced depends on how well the trading partners are integrated. Organizational
learning theory helps explain why integration should be related to customer satisfaction. Mutual
knowledge created through information shared along the supply chain increases the profitability of a
common understanding among the parties. Hence a customer’s expectations are kept consistent with
the supply chain’s ability to meet the customer’s need; met expectations being correlated with
satisfied customers, especially to the extent the customer has contributed to the mutual knowledge
created by the shared information. For example, through collaboration with customers and suppliers’
firms can learn to tailor service offerings to more closely match specific customer requirements (Stank
et al., 2001).
For NEPG, if it forward vertically integrates, the relationship with its current EU customers will change
(Yu et al., 2013). During the literature research, we found there appears a gap on actually measuring
the direct impact of forward vertical integration on customer relationships. To measure the impact of
forward vertical integration on customer relationships, customer perceptions will be measured and
analysed (Parson, 2002). One of the purpose of this research is to fill this gap and empirically
investigate the impact of forward vertical integration on customer relationships.
2.3 Conceptual Framework
Based on the theoretical framework previously discussed, the following conceptual framework (Figure
5) was assembled and the hypothesis is made.
This study considers three main sets of variables, forward vertical integration in terms of dimensions
of integration, customers’ willingness to repurchase (i.e. customers’ perceptions regarding to the
company’s new product, service, price, communication, etc.) and the current customer relationship
quality in terms of commitment, trust and satisfaction.
2.3.1 Forward Vertical Integration and Customers’ willingness to repurchase
According to Baumgartner (1999); Frohlich (2001); Guan (2012); Rangan (1993); Joskow (2010); Etgar,
(1978) and Harrigan, (1985), a well-integrated supply chain can reduce the transactional cost and

18
deliver more service and versatile products. However, they stated that before company forward
vertically integrate, there are several variables need to be measured and considers by the company.
These variables describe the factors that measures the dimensions of forward vertical integration.
According to Harrigan (1985), dimensions of integration variables describes the characteristic of the
specific forward vertical integration a company will carry out which links with a company’s strategy.
These dimensions of integration variables include stages of integration, breadth of integration, degree
of integration and the form of integration. The aim of the forward vertical integration process in this
research is to eliminate the intermediate cost and produce various products, which fits the “Hybrid
strategy” in Faulkner & Bowman (1995)’s strategy clock. However, according to researchers, value
creation by forward vertical integration could change the current customers’ attitudes towards
continue buying the new product from the same supplier. This is because the company’s new product
portfolio may overlap with the customer company’s product portfolio thus threats the customer
company’s own benefit.
According to many researchers, the repurchase intention is made when customers found a product in
terms of quality, value and equity meet their expectations (Hellier et al., 2003). These quality, value
and equity measures of a supplier will be measured from customers’ perspective and be treated as
customers’ perceived benefit. Walter et al. (2003) stated that if the benefit of a relationship is realized
within that relationship, it is a direct effect. This means that the fulfillment of the function does not
depend on other relationships or factors. The direct effect of supplier’s can be measured from product
price, product quality and service quality (Bhuyan, 2005; Lin et al., 2014; Carlton & Perloff, 1999,
Chapter 12; Baumgartner, 1999; Frohlich, 2001; Guan, 2012; Rangan, 1993; Etgar, 1978; Harrigan, 1985;
Joskow, 2010; Vickery, Jayaram, Droge & Clantone, 2003; Danese & Romeo, 2012). These three factors
can be classified as direct functions where a customer gains benefit from a supplier relationship. The
indirect effect includes the service/support and the communication/interaction. These factors are
classified as an indirect factor because they cannot be measured directly. Personal relationships and
other factors also need to be taken into consideration (Walter et al., 2003). Based on these, the first
hypothesis is made.
Hypothesis 1: Company’s capabilities which in terms of dimensions of integration has direct impact
on customers’ willingness to buy the new product.
2.3.2 Current relationship quality
Besides the impact of forward vertical integration, Hellier et al. (2003) stated that the customers’
willingness to repurchase could also be influenced by the current relationship quality. Parson (2002)
stated several customers’ relationship variables can be summarized into the factors that influence the
relationship quality, which refer to the customers’ perceptions over the company which includes both
tangible and intangible attributes (Parsons, 2002). More in specific, these variables are commitment,
trust and satisfaction (Cardozo, 1965; Oliver, 1980; Churchil & Supernant, 1982; Hennig-Thurau & Klee,
1997; Chen et al., 2005; Hellier et al., 2003). Especially for the customer satisfaction, Homburg et al.
(2005) stated that higher customer satisfaction would lead to improved company performance and
thus lead to an increase profitability. Many researchers also found that customers tend to repurchase
from the same supplier in a B2B relationship when they perceived a high value, high quality and equity
over its supplier. Therefore, the following hypothesis is made:
Hypothesis 2: Current customers’ perceptions over the company in terms of commitment, trust and
satisfaction has a mediating effect between forward vertical integration and customers’ willingness
to buy the new product.
19
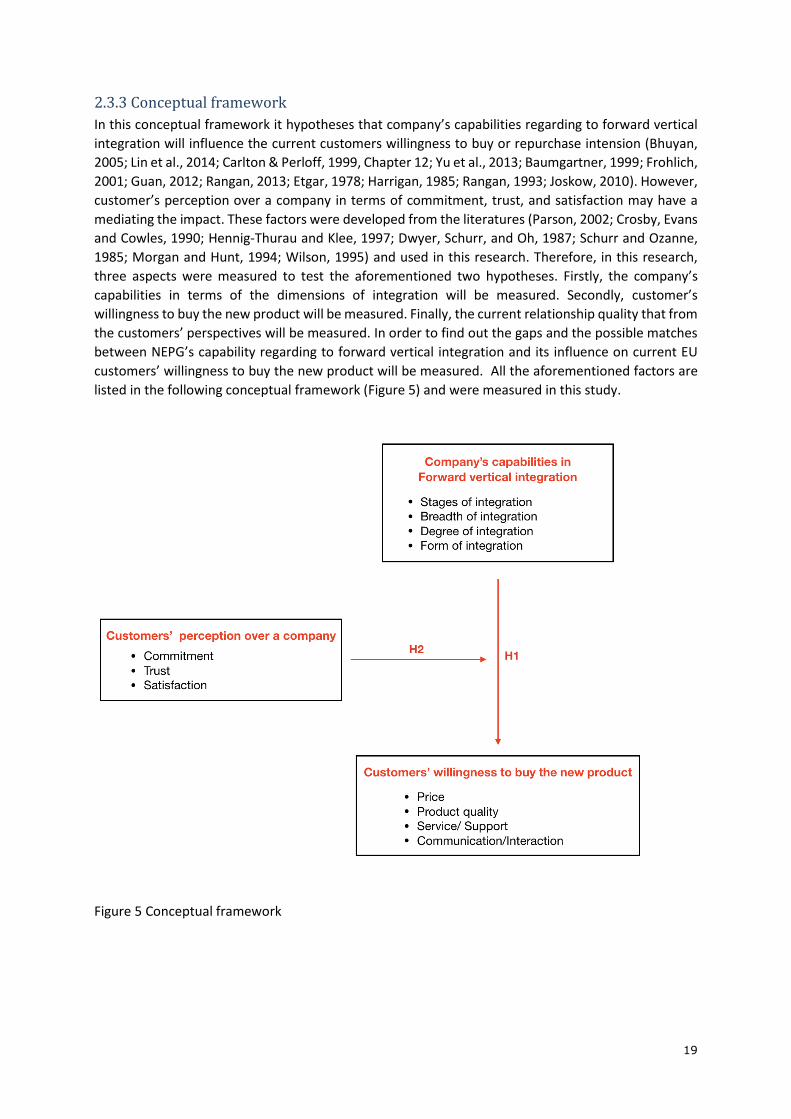
2.3.3 Conceptual framework
In this conceptual framework it hypotheses that company’s capabilities regarding to forward vertical
integration will influence the current customers willingness to buy or repurchase intension (Bhuyan,
2005; Lin et al., 2014; Carlton & Perloff, 1999, Chapter 12; Yu et al., 2013; Baumgartner, 1999; Frohlich,
2001; Guan, 2012; Rangan, 2013; Etgar, 1978; Harrigan, 1985; Rangan, 1993; Joskow, 2010). However,
customer’s perception over a company in terms of commitment, trust, and satisfaction may have a
mediating the impact. These factors were developed from the literatures (Parson, 2002; Crosby, Evans
and Cowles, 1990; Hennig-Thurau and Klee, 1997; Dwyer, Schurr, and Oh, 1987; Schurr and Ozanne,
1985; Morgan and Hunt, 1994; Wilson, 1995) and used in this research. Therefore, in this research,
three aspects were measured to test the aforementioned two hypotheses. Firstly, the company’s
capabilities in terms of the dimensions of integration will be measured. Secondly, customer’s
willingness to buy the new product will be measured. Finally, the current relationship quality that from
the customers’ perspectives will be measured. In order to find out the gaps and the possible matches
between NEPG’s capability regarding to forward vertical integration and its influence on current EU
customers’ willingness to buy the new product will be measured. All the aforementioned factors are
listed in the following conceptual framework (Figure 5) and were measured in this study.
Figure 5 Conceptual framework

20
Chapter 3 Methodology
In this chapter, the methodology of this research will be explained, which includes research design,
data collection, and analytical method. In the end, the limitation of this methodology will also be
discussed.
3.1 Research Design
The research design used in this study is a case study design, since the total study population is one
entity (which is NEPG) (Kumar, 2011). Kumar (2011) stated when doing a case study design, it is
assumed that the case being studied represents the typical case. This assumption allows us to have a
valuable insight on a particular topic or situation. He argued the major strength of the case study design
is that it is useful in areas where little is known, which is prevalent in qualitative research. The main
focus in qualitative research is to understand, explain, explore, discover and clarify situations feelings,
perceptions, attitudes, values and experiences of a group of people (Kumar, 2011). Since the main
interest of this research is to study the strategy of the company and the perceptions of the customer,
the qualitative study design is more appropriate. As it is a very flexible and open-ended technique to
collect data and it is more appropriate for exploring the variation and diversity in any aspect of social
life (Kumar, 2011).
3.2 Data collection
In this study, the data will be collected within two groups, namely NEPG’s managers and NEPG’s
current EU customers. The reason that these two groups of informants will be chosen is:
According to NEPG Major Product Research Report (2012), NEPG exports about 47% of its vitamin C
powder product to Europe, which the European customers are NEPG’s major customer segments. Also,
to analyze the customers’ perceptions over the company in the context of forward vertical integration,
customers’ willingness-to-buy towards the new product and current relationship quality will be
analyzed. Finally, to respond the customers’ preferences and aim for getting more profit, company’s
capability will be developed.
Since the NEPG’s headquarter is in Shenyang, the place for the data collection will be in Shenyang,
Liaoning province, People’s Republic of China. Depending on these two groups of study population,
primary data will be collected and analyzed. The primary data collection method will be used in this
study is interview, since interview is one of the most common methods used in the qualitative research
(Kumar, 2011). Also, Frey and Fontana (1991) note that case studies normally focus on two types of
data gathering methods, which are observation and interviews. Interview involves asking questions,
listening to and recording answers from an individual or group on a structured, semi-structured or
unstructured format in an in-depth manner (Qu & Dumay, 2011). McNamara (1999) stated that
interviews are particularly useful for getting the story behind a participant’s experiences. He also
stated the interviewer can peruse detailed information around the topic, since the questions can be
further explained, and the information can be supplemented. The whole interview research for both
parties will be conducted over a period of one month since there are time limitations of this research.
In this research, two parts of interviews will be conducted, which the first part interviews will be set
up among NEPG’s EU customers and the second part of interviews will be conducted with the NEPG
managers. For all above the reasons and the fact that not all NEPG’s managers and its customers will
have the same chance to be selected, the judgmental sampling will be used. This type of sampling
method will be used for both groups of interviews. According to Kumar (2011), this sampling method
21
is appropriate for qualitative studies when the goal is to describe a phenomenon. Moreover, it is used
when the researcher knows who can provide the best information to achieve the objectives of the
study (Kumar, 2011).
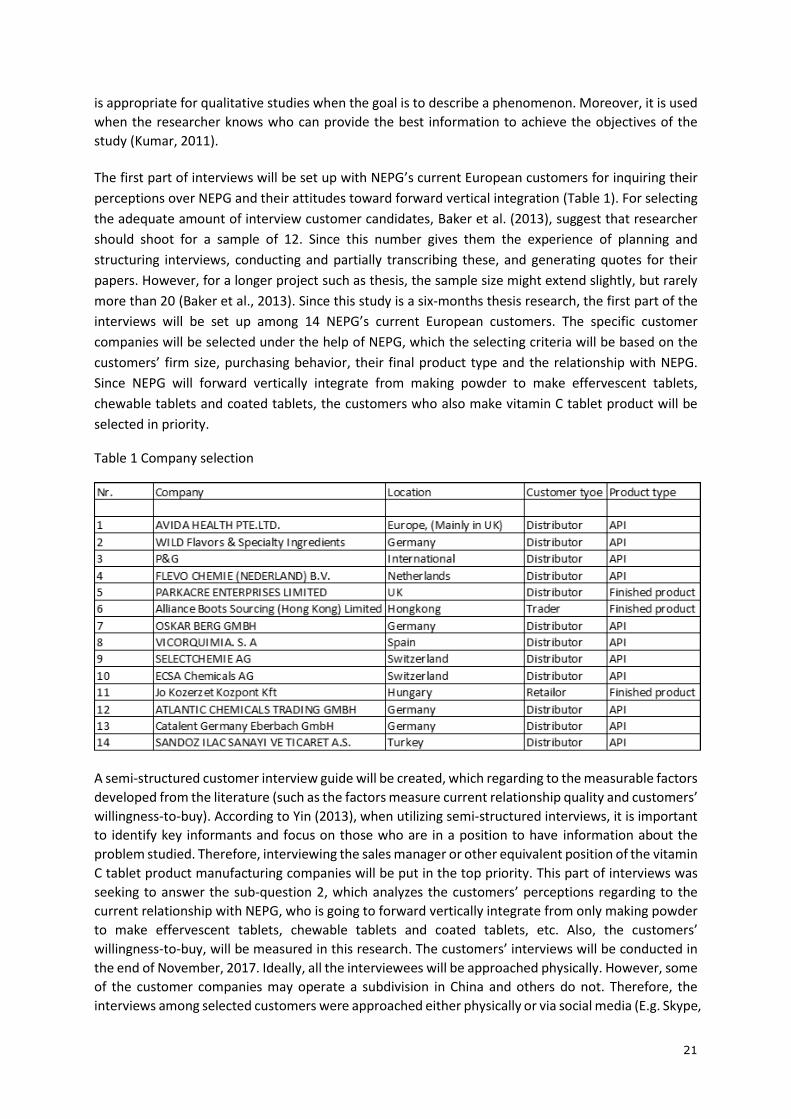
The first part of interviews will be set up with NEPG’s current European customers for inquiring their
perceptions over NEPG and their attitudes toward forward vertical integration (Table 1). For selecting
the adequate amount of interview customer candidates, Baker et al. (2013), suggest that researcher
should shoot for a sample of 12. Since this number gives them the experience of planning and
structuring interviews, conducting and partially transcribing these, and generating quotes for their
papers. However, for a longer project such as thesis, the sample size might extend slightly, but rarely
more than 20 (Baker et al., 2013). Since this study is a six-months thesis research, the first part of the
interviews will be set up among 14 NEPG’s current European customers. The specific customer
companies will be selected under the help of NEPG, which the selecting criteria will be based on the
customers’ firm size, purchasing behavior, their final product type and the relationship with NEPG.
Since NEPG will forward vertically integrate from making powder to make effervescent tablets,
chewable tablets and coated tablets, the customers who also make vitamin C tablet product will be
selected in priority.
Table 1 Company selection
A semi-structured customer interview guide will be created, which regarding to the measurable factors
developed from the literature (such as the factors measure current relationship quality and customers’
willingness-to-buy). According to Yin (2013), when utilizing semi-structured interviews, it is important
to identify key informants and focus on those who are in a position to have information about the
problem studied. Therefore, interviewing the sales manager or other equivalent position of the vitamin
C tablet product manufacturing companies will be put in the top priority. This part of interviews was
seeking to answer the sub-question 2, which analyzes the customers’ perceptions regarding to the
current relationship with NEPG, who is going to forward vertically integrate from only making powder
to make effervescent tablets, chewable tablets and coated tablets, etc. Also, the customers’
willingness-to-buy, will be measured in this research. The customers’ interviews will be conducted in
the end of November, 2017. Ideally, all the interviewees will be approached physically. However, some
of the customer companies may operate a subdivision in China and others do not. Therefore, the
interviews among selected customers were approached either physically or via social media (E.g. Skype,
22
etc.). Moreover, some of the interview among all the 14 European customers were recorded under
the customers’ approval.
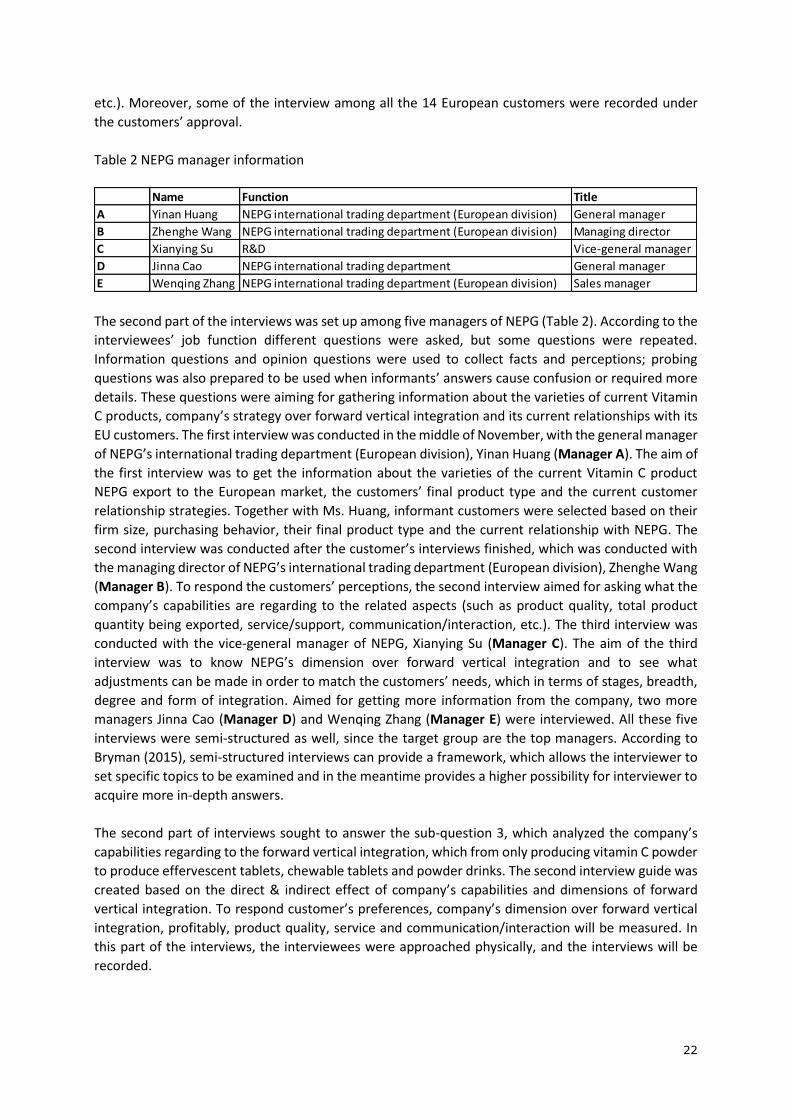
Table 2 NEPG manager information
The second part of the interviews was set up among five managers of NEPG (Table 2). According to the
interviewees’ job function different questions were asked, but some questions were repeated.
Information questions and opinion questions were used to collect facts and perceptions; probing
questions was also prepared to be used when informants’ answers cause confusion or required more
details. These questions were aiming for gathering information about the varieties of current Vitamin
C products, company’s strategy over forward vertical integration and its current relationships with its
EU customers. The first interview was conducted in the middle of November, with the general manager
of NEPG’s international trading department (European division), Yinan Huang (Manager A). The aim of
the first interview was to get the information about the varieties of the current Vitamin C product
NEPG export to the European market, the customers’ final product type and the current customer
relationship strategies. Together with Ms. Huang, informant customers were selected based on their
firm size, purchasing behavior, their final product type and the current relationship with NEPG. The
second interview was conducted after the customer’s interviews finished, which was conducted with
the managing director of NEPG’s international trading department (European division), Zhenghe Wang
(Manager B). To respond the customers’ perceptions, the second interview aimed for asking what the
company’s capabilities are regarding to the related aspects (such as product quality, total product
quantity being exported, service/support, communication/interaction, etc.). The third interview was
conducted with the vice-general manager of NEPG, Xianying Su (Manager C). The aim of the third
interview was to know NEPG’s dimension over forward vertical integration and to see what
adjustments can be made in order to match the customers’ needs, which in terms of stages, breadth,
degree and form of integration. Aimed for getting more information from the company, two more
managers Jinna Cao (Manager D) and Wenqing Zhang (Manager E) were interviewed. All these five
interviews were semi-structured as well, since the target group are the top managers. According to
Bryman (2015), semi-structured interviews can provide a framework, which allows the interviewer to
set specific topics to be examined and in the meantime provides a higher possibility for interviewer to
acquire more in-depth answers.
The second part of interviews sought to answer the sub-question 3, which analyzed the company’s
capabilities regarding to the forward vertical integration, which from only producing vitamin C powder
to produce effervescent tablets, chewable tablets and powder drinks. The second interview guide was
created based on the direct & indirect effect of company’s capabilities and dimensions of forward
vertical integration. To respond customer’s preferences, company’s dimension over forward vertical
integration, profitably, product quality, service and communication/interaction will be measured. In
this part of the interviews, the interviewees were approached physically, and the interviews will be
recorded.
Name Function Title
A Yinan Huang NEPG international trading department (European division) General manager
B Zhenghe Wang NEPG international trading department (European division) Managing director
C Xianying Su R&D Vice-general manager
D Jinna Cao NEPG international trading department General manager
E Wenqing Zhang NEPG international trading department (European division) Sales manager

23
3.3 Analytical method
Qualitative data analysis is the range of process and procedures whereby we move from the qualitative
data that have been collected into some form of explanation, understanding or interpretation of the
people and situations we are investigating (Strauss, 1987). It refers to research activity which, involves
several different but related elements (or operations). Qualitative analysis occurs at various levels of
explicitness, abstraction and systematization.
It is time saving by using the electronic software to code, but it might also take several weeks to get
acquainted with a software package (Basit, 2003). Regarding to the time constraints and the translation
process, the data was transcribed and coded manually in this research (Table 4, Table 6 and

24
Appendix 1 Company interview questions). The framework of coding was guided by the measurable
factors which were derived from the literature.
The main variables in this research were measured by multiple items, such as company’s capabilities
in terms of dimensions of integration, current customer relationship quality and the customers’
willingness-to-buy. The detailed interview questions are listed in

25
Appendix 1 Company interview questions and Appendix 2 Customer interview questions (and
Expected answer).
In total, 31 questions were constructed and asked to the NEPG managers, respectively. Some of the
questions were also repeated in different interviews. These questions were divided into four question
types, namely direct effect questions, indirect effect questions, questions regarding to degree of
integration and informative questions. The classification of the questions is shown in Table 3.
Table 3 Classification of questions (Company interview)
According to Walter et al. (2003), if the benefit of a relationship is realized within that relationship, it
is a direct effect. Lin et al. (2014) stated there are three aspects of the main effect of forward
integration which are profitability, quality and volume function. These factors that were summarized
by Lin et al. (2014) are adopted and measured in this research. Nine questions (in
Question Type Question number Number of questions in total
Direct effect questions 2; 7; 12; 13; 20; 21; 22; 24; 28 9
Indirect effect questions 23; 25; 27; 30; 31 5
Questions regarding to degree of integration 1; 3; 4; 5; 6; 11; 14; 29 8
Informative question 8; 9; 10; 15; 16; 17; 18; 19; 26 9
26
Appendix 1 Company interview questions) were generated to measure the direct effect of company’s
performance. These items are developed based on the studies by Lin et al. (2014) and Harrigan (1985).
There are also indirect effects which could also influence the firm’s performance. These indirect effects
include non-product related attributes such as service and communication (Wilson, 1995) Based on
the Maslow’s demand theory, Chen et al. (2005) gives an extra vision about the
communication/interaction. Interaction between the customer and supplier, which means, more
specifically, the face to face interaction. This kind of interaction focus more to the technical support
since the quality of technical support is as the same importance as product quality. The ability to
communicate with exchange partners fosters cooperation and trust in relationships (Perrien and
Ricard, 1995; Deutsch, 1958). Therefore, these indirect factors will also be adopted and examined in
this research. Five questions ( in

27
Appendix 1 Company interview questions) were created based on the studies by Chen et al. (2005),
Wilson (1995) and Perrien and Ricard (1995).
Dimensions of integration refers to the stage, breadth, degree and form of integration (Harrigan, 1985).
Harrigan (1985) suggested that firms may evaluate themselves before integrating. Firms may adjust
the dimensions of their vertical integration strategies to suit competitive or corporate needs. Eight
questions (in

28
Appendix 1 Company interview questions) were used to measure dimensions of firm’s integration.
The items are developed based on the studies by Harrigan (1985).
In addition, according to the manager’s answer, nine followed-up questions (in

29
Appendix 1 Company interview questions) were asked, which aimed to acquire more information.
Since these questions were asked extemporaneously, those questions were not strictly followed the
framework.
Current relationship quality was measured from the customers’ perceptions, which contains three
aspects, namely commitment, trust and satisfaction. In total 22 questions (in Appendix 2 Customer
interview questions (and Expected answer)) were generated, which aiming to find out customers’ trust,
satisfaction and commitment over the NEPG. These factors were measured by Likert scale, and further
inquiries were made to find out the customers’ intentions behind the score.
Commitment is the motivation to maintain the relationship and the length of the relationship.
According to Morgan and Hunt (1994), commitment should be an important variable in determining
successful relationships depend on mutual commitment between customer and supplier. When
motivation to maintain the relationship is high, then the probability that the quality of the relationship
is also high increases. A longer relationship implies a certain degree of commitment between two
parties (Dwyer, Schurr, and Oh, 1987). Three questions (in Appendix 2 Customer interview questions
(and Expected answer)) were generated to measure the customer’s commitment over its supplier.
These items were developed based on the studies by Dwyer, Schurr and Oh (1987). Moreover, because
of the complex nature of the B2B context, Kristensen et al. (2000) stated that business customers
consider corporate image as the most important criterion for being loyal to the supplier compared to
satisfaction, trust, and handling customer complaints.
Trust refer to the belief that the other party is honest and sincere and in no circumstance will
deliberately do anything to damage the relationship. The trust of a firm may be determined on the
basis of reputation, trustworthiness, mutual disclosure (Kwon and Suh, 2004), as well as previous
experience (Wilson, 1995). Authors such as Doney and Cannon (1997), Ganesan (1994) treats trust as
a second-order construct of credibility which is based on the extent to which the retailer believes that
the vendor has the required expertise to perform the job effectively and reliably (cognitive dimension);
and benevolence which represents the good intention of exchange partners, as well as beneficial
motivation of the vendor to the retailer when new conditions arise (Ganesan, 1994). We define the
trust between supplier and customer belongs to inter-organizational trust, and it measures the aspects
of transaction experience, fairness, reputation, and trust worthiness. Based on the direct and indirect
dimensions developed by Lin et al. (2014) and Walter et al. (2003), six questions (in Appendix 2
Customer interview questions (and Expected answer)) were generated to measure the customer’s
trust over its supplier. These questions were also developed based on the studies by Claro et al. (2003),
Doney and Cannon (1997), and Ganesan (1994).
Customer satisfaction was used to measure the quality of a business relationship. People are satisfied
when the perceived relationship is equal to or stronger than what they expected. Wallin Andreassen
and Lindestad (1998) suggest that the customer satisfaction indicators should tap into the construct
by addressing overall satisfaction and congruence with expectations. Ping (1993) proposed that the
relationship between buyers and sellers reflects overall satisfaction. In addition, we adopted two items
commonly used in customer satisfaction research as indicators of the customer satisfaction construct
(Oliver and Swan 1989). Moreover, adopted from the direct and indirect dimensions developed by Lin
et al. (2014) and Walter et al. (2003), which can determine the customers’ willingness-to-buy, thirteen
questions (in Appendix 2 Customer interview questions (and Expected answer)) were constructed and
used to measure relationship satisfaction. This measurement instrument was also developed based on
Fornell et al. (1996).

30
A follow up question was asked, which is “If NEPG forward vertically integrate, from only producing
powder to produce tablets product, will you still buy its product?”. If the customer’s answer is “NO”,
then the intention hide behind this answer will be asked and then the interview will be ended. However,
if the respondent answers “YES”, the following question which related to the customers’ expectations
(i.e. product quality, price, volume, service, communication and the relationship) will be asked. These
questions were constructed based on Lin et al. (2014), Walter et al. (2003), Oliver and Swan (1989),
Dwyer, Schurr, and Oh (1987), and Fornel et al. (1996).
3.4 Triangulation
Because of the limitation of the case study method, triangulation of data source is required. Secondary
data will be collected to avoid bias and gain insight from other case studies. In a case study design, the
“case” you select becomes the basis of a thorough, holistic and in-depth exploration of the aspect that
you want to find out about (Kumar, 2011). Also, it is stated, a case study should focus on a bounded
subject/unit that is either very representative or extremely atypical. In this study, cases about
customer relationship regarding to forward vertical integration in European Fast-Moving Consumer
Goods (FMCG) industries will be selected first. If there are not many case could be found, then the
customer relationship management case regarding to forward vertical integration in any industries in
Western countries will be selected. However, the boundary of the case search will keep within the
western countries.
When doing the search for the cases, the credibility of the source has to be evaluated and taken into
consideration. Within this study, the sources are divided into high, medium and low credibility levels.
Case sources from academic and governmental institutional bodies are classified to have high
credibility level; several examples include universities, government reports, and journals. Case sources
from non-academic institutions are classified to have a medium credibility level; several examples
include news articles, consultancy company’s articles, non-profit organization articles. Case sources
from colloquial platforms are classified to have a low credibility level; several examples include self-
written articles and forums.
3.5 Validity and Limitation
This section presents the validity and limitations of both the interviews and the case comparison
analysis method. Since this research is a case study, there are several limitations of this study. The
limitations are the case study limitation itself, sample selection method, and data collecting method.
In this research which only NEPG will be analyzed, it is lack of representativeness and its generalizability
to the whole vitamin C industry is low. Another possibility is that researcher bias may arise according
to the amount of data being collected. There are possibilities that the data gathered are misread or
misinterpreted by the researcher. Moreover, the information of the contact customers was given by
NEPG which they might just be the sales person or contract employee of that company. This could
influence the quality of the result since the interviewed person may not represent the company and
also, he/she may not know all the company’s decision in this situation. Because of the aforementioned
reasons, it would be hard for the researcher to have an objective outlook on the data and reduce the
scientific nature of the research.
When constructing the interview guide, it is important to have the face and content validity. Each
question or item on the research instrument must have a logical link with the objective, and the items
and questions over the full range of the issue is measured. Also, the wording of questions and physical
setting is important, while avoiding the leading questions.

31
When conducting the interview, the quality of the data depends on the quality of the interviewer, the
quality of the interaction and the researcher bias (Kumar, 2011). In an interview situation the quality
of the data generated is affected by the experience, skills and commitment of the interviewer. Also,
because the interaction in each interview is unique, the quality of the responses obtained from
different interviews may vary significantly. Moreover, the researcher bias in the framing of questions
and the interpretations of responses is always possible. In this research, the researcher will be the
primary instrument for data collection and analysis, it is possible that he/she may exhibit bias in the
way he/she interpret responses, select response categories or choose word to summarize respondents’
expressed opinions. In the end, due to the companies’ confidential agreement, the interviewee may
not willing to tell everything. This may also affect the quality of information or even result in an
interview being terminated. In addition to the data collection method, the integrity and skills of the
investigator are important. Because the researcher will be the primary instrument for data collection
and analysis. It is also possible that the researcher might need time to prepare for the training and
transcribe responses.
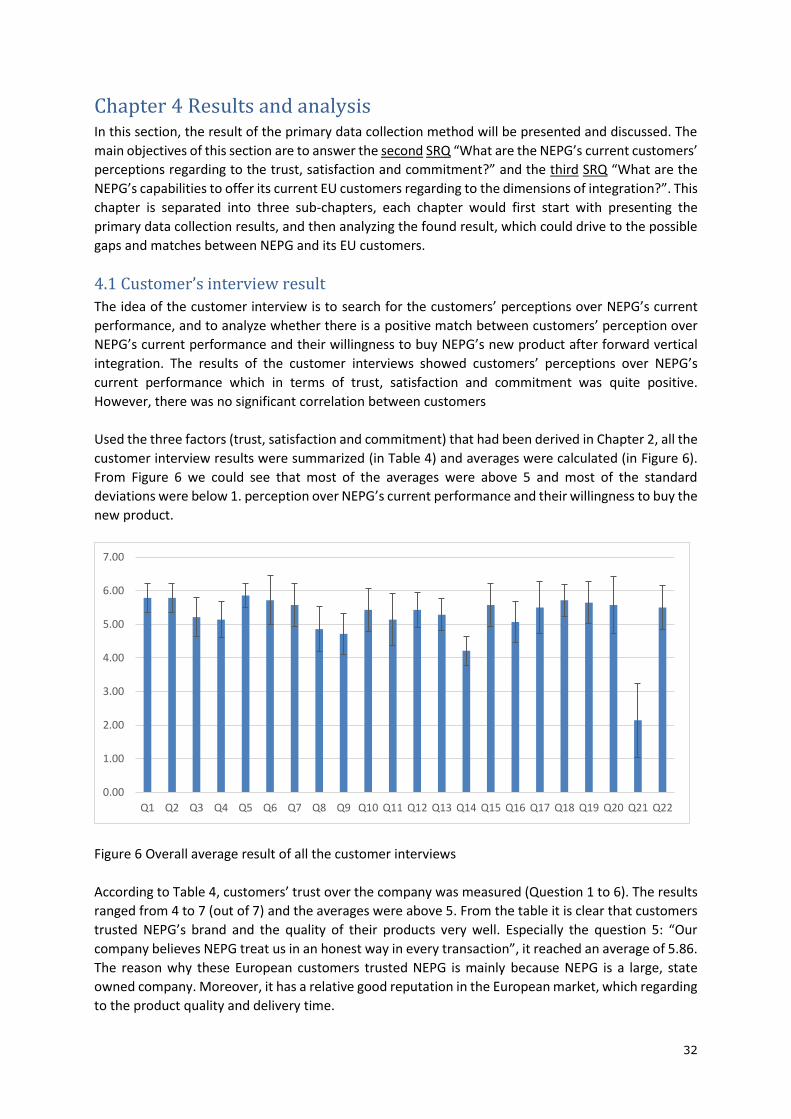
32
Chapter 4 Results and analysis In this section, the result of the primary data collection method will be presented and discussed. The
main objectives of this section are to answer the second SRQ “What are the NEPG’s current customers’
perceptions regarding to the trust, satisfaction and commitment?” and the third SRQ “What are the
NEPG’s capabilities to offer its current EU customers regarding to the dimensions of integration?”. This
chapter is separated into three sub-chapters, each chapter would first start with presenting the
primary data collection results, and then analyzing the found result, which could drive to the possible
gaps and matches between NEPG and its EU customers.
4.1 Customer’s interview result
The idea of the customer interview is to search for the customers’ perceptions over NEPG’s current
performance, and to analyze whether there is a positive match between customers’ perception over
NEPG’s current performance and their willingness to buy NEPG’s new product after forward vertical
integration. The results of the customer interviews showed customers’ perceptions over NEPG’s
current performance which in terms of trust, satisfaction and commitment was quite positive.
However, there was no significant correlation between customers
Used the three factors (trust, satisfaction and commitment) that had been derived in Chapter 2, all the
customer interview results were summarized (in Table 4) and averages were calculated (in Figure 6).
From Figure 6 we could see that most of the averages were above 5 and most of the standard
deviations were below 1. perception over NEPG’s current performance and their willingness to buy the
new product.
Figure 6 Overall average result of all the customer interviews
According to Table 4, customers’ trust over the company was measured (Question 1 to 6). The results
ranged from 4 to 7 (out of 7) and the averages were above 5. From the table it is clear that customers
trusted NEPG’s brand and the quality of their products very well. Especially the question 5: “Our
company believes NEPG treat us in an honest way in every transaction”, it reached an average of 5.86.
The reason why these European customers trusted NEPG is mainly because NEPG is a large, state
owned company. Moreover, it has a relative good reputation in the European market, which regarding
to the product quality and delivery time.
0.00
1.00
2.00
3.00
4.00
5.00
6.00
7.00
Q1 Q2 Q3 Q4 Q5 Q6 Q7 Q8 Q9 Q10 Q11 Q12 Q13 Q14 Q15 Q16 Q17 Q18 Q19 Q20 Q21 Q22

33
Table 4 Result of customer interview
For the customers’ satisfaction measurement (Question 7 to 19 in Table 4), results ranged from 4 to 6
(out of 7). If we calculated the average scores which were based on the customers’ satisfaction, most
of the customers are quite positive towards NEPG’s current business performance, since most of the
average scores were above 5 (Figure 6). However, question regarding to the product quality (Question

34
8 and 9) had an average score of 4.86 and 4.71. This was because sometimes the products are different
between batches, which in terms of impurities, yellowish color and different particle sizes. Also, NEPG
scored low (an average of 4.21) in problem-solving issues (Question 14).
Moreover, the results over customers’ commitment (Question 20 to 22 in Table 4) ranged from 1 to 7
(Out of 7). However, in this section there was an outlier which is question 21, stated “Our company
shares any values with NEPG” (Figure 6). which had an average of 2.14. The reason of this low
commitment score was because some of the customers they only share their formulas with NEPG and
others didn’t share anything with NEPG. NEPG either produce customers’ formula and put on the
customer company’s label, or NEPG sell their own products to the customers. Another reason for this
low commitment score is because customers stated the traceability of the problem-solving process is
low and the processing time is always too long. Customers especially pointed out the technical
problems, which the solving time is extremely long.
Finally, based on these customer’s perceptions, their willingness to buy the new product were asked.
The result from the interview were classified, as can be observed in Table 5. Compared the results,
most of the existing EU customers would like to continue buying the vitamin C powder product (API)
from NEPG, instead of buying their new chewable or effervescent vitamin C tablet product.
Table 5 Customer's willingness to buy the new products
Among all these 14 analyzed companies, 9 of the customers (which were marked in red in Table 5)
answered they do not want to buy the new tablet product after NEPG’s forward vertical integration.
From the answer of previous questions that were listed in Table 4, we analyzed the average score of
these (positive) customers who are willing to buy the new product (Figure 7). Compared with the
customers who are not willing to buy the new tablet products, the average score of these positive
customers were slightly higher. Especially from question 7 to 19, these positive customers were more
satisfied with NEPG’s current product/service quality. Moreover, the answers of these customers were
more positive than the others, which means they would like to focus on the long-term goals or share
more values with NEPG.
No. Company name Willingness to buy tablets
1 AVIDA HEALTH PTE.LTD. No
2 WILD Flavors & Specialty Ingredients Depends
3 P&G No
4 FLEVO CHEMIE (NEDERLAND) B.V. Yes
5 PARKACRE ENTERPRISES LIMITED
6 Alliance Boots Sourcing (Hong Kong) Limited Yes
7 OSKAR BERG GMBH No
8 VICORQUIMIA. S. A No
9 SELECTCHEMIE AG Yes
10 ECSA Chemicals AG No
11 Jo Kozerzet Kozpont Kft No
12 ATLANTIC CHEMICALS TRADING GMBH Yes
13 Catalent Germany Eberbach GmbH No
14 SANDOZ ILAC SANAYI VE TICARET A.S. No
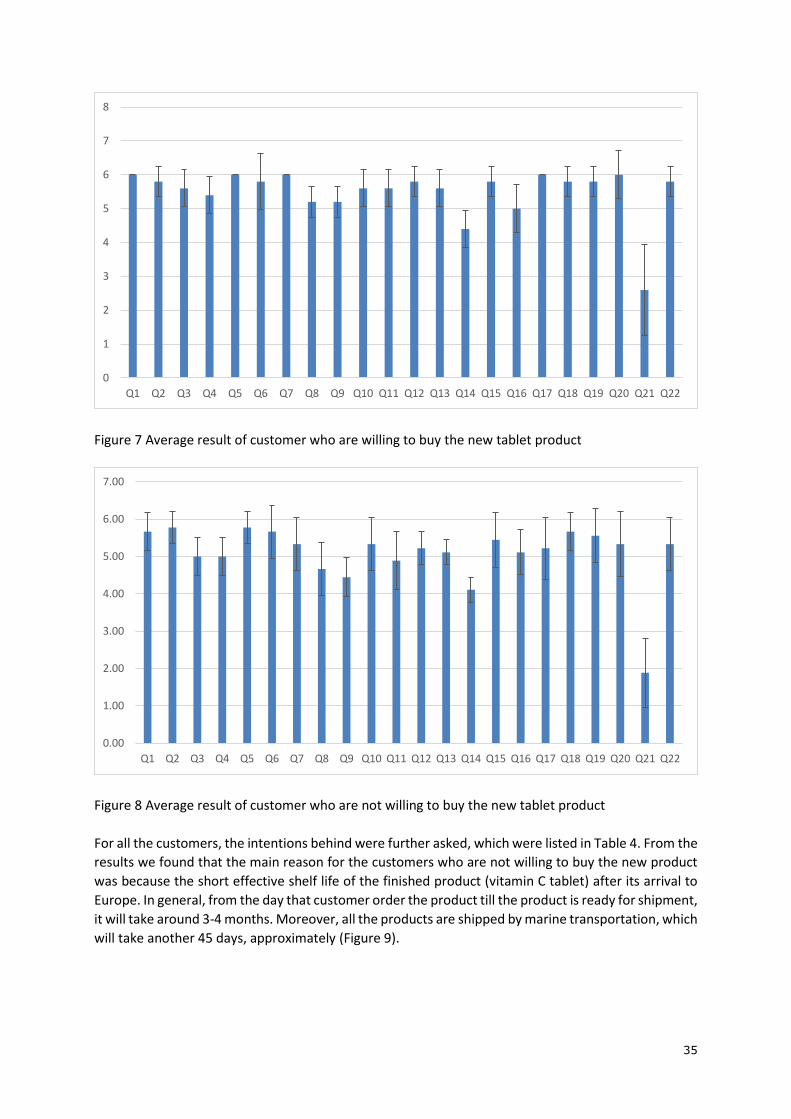
35
Figure 7 Average result of customer who are willing to buy the new tablet product
Figure 8 Average result of customer who are not willing to buy the new tablet product
For all the customers, the intentions behind were further asked, which were listed in Table 4. From the
results we found that the main reason for the customers who are not willing to buy the new product
was because the short effective shelf life of the finished product (vitamin C tablet) after its arrival to
Europe. In general, from the day that customer order the product till the product is ready for shipment,
it will take around 3-4 months. Moreover, all the products are shipped by marine transportation, which
will take another 45 days, approximately (Figure 9).
0
1
2
3
4
5
6
7
8
Q1 Q2 Q3 Q4 Q5 Q6 Q7 Q8 Q9 Q10 Q11 Q12 Q13 Q14 Q15 Q16 Q17 Q18 Q19 Q20 Q21 Q22
0.00
1.00
2.00
3.00
4.00
5.00
6.00
7.00
Q1 Q2 Q3 Q4 Q5 Q6 Q7 Q8 Q9 Q10 Q11 Q12 Q13 Q14 Q15 Q16 Q17 Q18 Q19 Q20 Q21 Q22
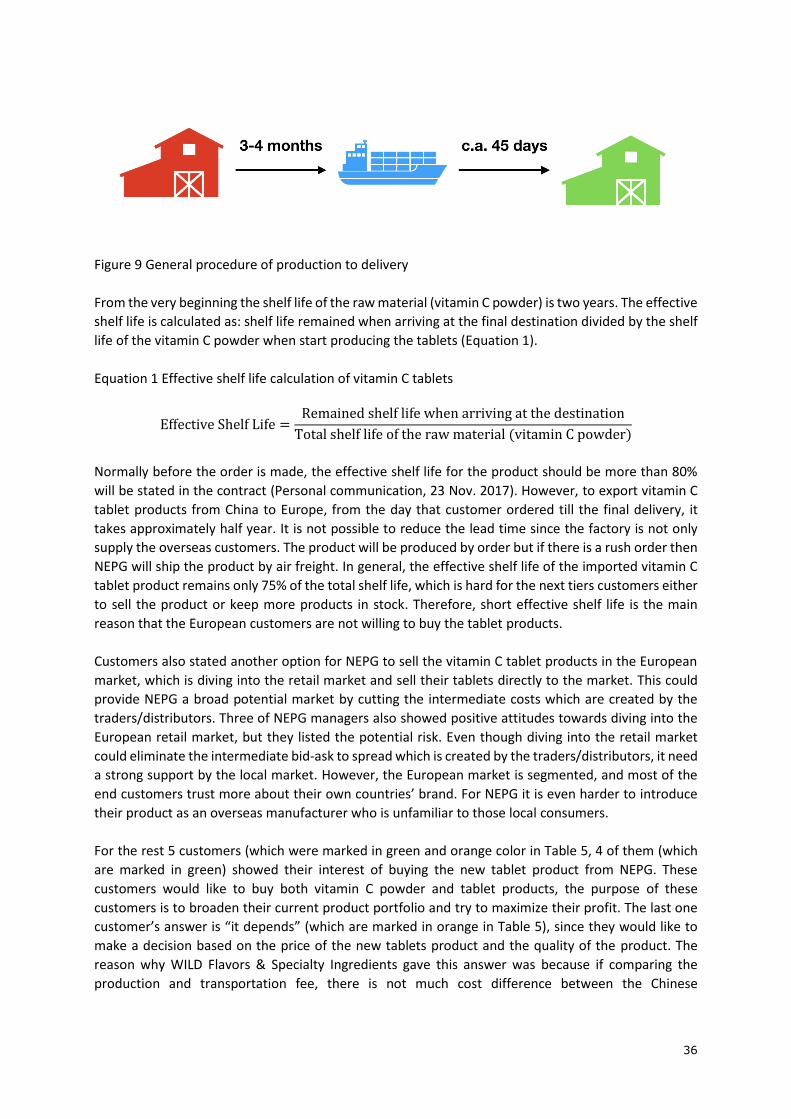
36
Figure 9 General procedure of production to delivery
From the very beginning the shelf life of the raw material (vitamin C powder) is two years. The effective
shelf life is calculated as: shelf life remained when arriving at the final destination divided by the shelf
life of the vitamin C powder when start producing the tablets (Equation 1).
Equation 1 Effective shelf life calculation of vitamin C tablets
Effective Shelf Life =Remained shelf life when arriving at the destination
Total shelf life of the raw material (vitamin C powder)
Normally before the order is made, the effective shelf life for the product should be more than 80%
will be stated in the contract (Personal communication, 23 Nov. 2017). However, to export vitamin C
tablet products from China to Europe, from the day that customer ordered till the final delivery, it
takes approximately half year. It is not possible to reduce the lead time since the factory is not only
supply the overseas customers. The product will be produced by order but if there is a rush order then
NEPG will ship the product by air freight. In general, the effective shelf life of the imported vitamin C
tablet product remains only 75% of the total shelf life, which is hard for the next tiers customers either
to sell the product or keep more products in stock. Therefore, short effective shelf life is the main
reason that the European customers are not willing to buy the tablet products.
Customers also stated another option for NEPG to sell the vitamin C tablet products in the European
market, which is diving into the retail market and sell their tablets directly to the market. This could
provide NEPG a broad potential market by cutting the intermediate costs which are created by the
traders/distributors. Three of NEPG managers also showed positive attitudes towards diving into the
European retail market, but they listed the potential risk. Even though diving into the retail market
could eliminate the intermediate bid-ask to spread which is created by the traders/distributors, it need
a strong support by the local market. However, the European market is segmented, and most of the
end customers trust more about their own countries’ brand. For NEPG it is even harder to introduce
their product as an overseas manufacturer who is unfamiliar to those local consumers.
For the rest 5 customers (which were marked in green and orange color in Table 5, 4 of them (which
are marked in green) showed their interest of buying the new tablet product from NEPG. These
customers would like to buy both vitamin C powder and tablet products, the purpose of these
customers is to broaden their current product portfolio and try to maximize their profit. The last one
customer’s answer is “it depends” (which are marked in orange in Table 5), since they would like to
make a decision based on the price of the new tablets product and the quality of the product. The
reason why WILD Flavors & Specialty Ingredients gave this answer was because if comparing the
production and transportation fee, there is not much cost difference between the Chinese
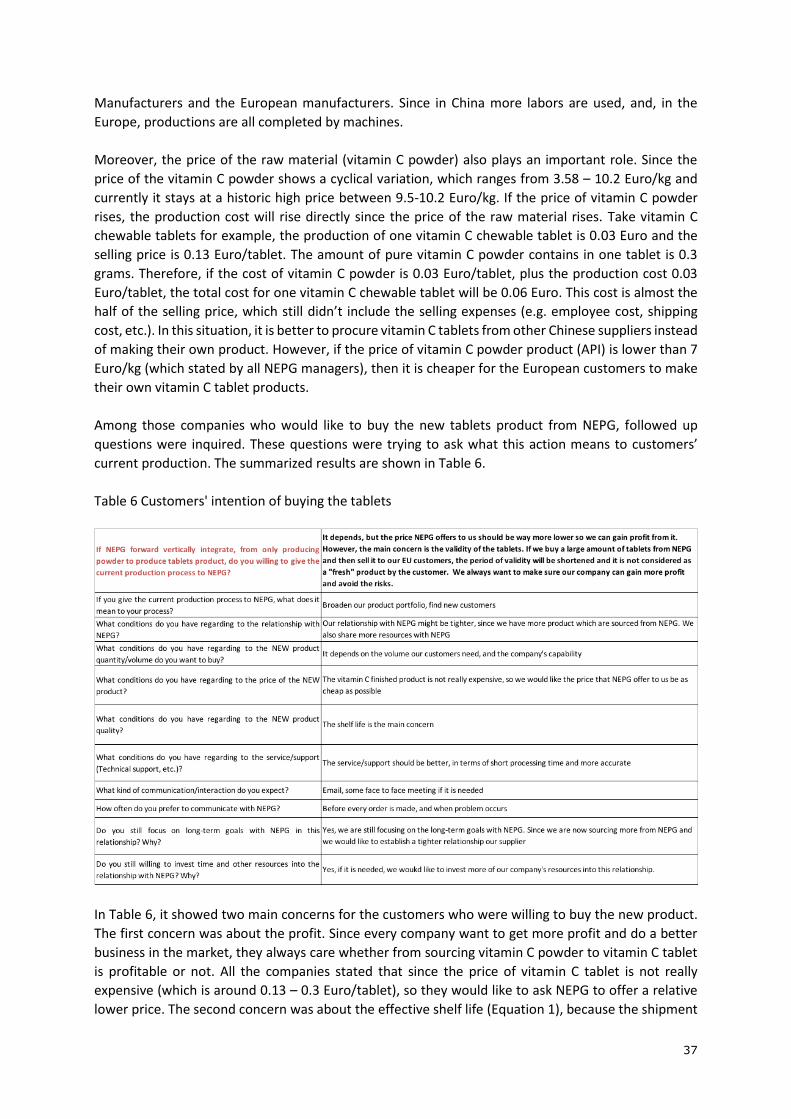
37
Manufacturers and the European manufacturers. Since in China more labors are used, and, in the
Europe, productions are all completed by machines.
Moreover, the price of the raw material (vitamin C powder) also plays an important role. Since the
price of the vitamin C powder shows a cyclical variation, which ranges from 3.58 – 10.2 Euro/kg and
currently it stays at a historic high price between 9.5-10.2 Euro/kg. If the price of vitamin C powder
rises, the production cost will rise directly since the price of the raw material rises. Take vitamin C
chewable tablets for example, the production of one vitamin C chewable tablet is 0.03 Euro and the
selling price is 0.13 Euro/tablet. The amount of pure vitamin C powder contains in one tablet is 0.3
grams. Therefore, if the cost of vitamin C powder is 0.03 Euro/tablet, plus the production cost 0.03
Euro/tablet, the total cost for one vitamin C chewable tablet will be 0.06 Euro. This cost is almost the
half of the selling price, which still didn’t include the selling expenses (e.g. employee cost, shipping
cost, etc.). In this situation, it is better to procure vitamin C tablets from other Chinese suppliers instead
of making their own product. However, if the price of vitamin C powder product (API) is lower than 7
Euro/kg (which stated by all NEPG managers), then it is cheaper for the European customers to make
their own vitamin C tablet products.
Among those companies who would like to buy the new tablets product from NEPG, followed up
questions were inquired. These questions were trying to ask what this action means to customers’
current production. The summarized results are shown in Table 6.
Table 6 Customers' intention of buying the tablets
In Table 6, it showed two main concerns for the customers who were willing to buy the new product.
The first concern was about the profit. Since every company want to get more profit and do a better
business in the market, they always care whether from sourcing vitamin C powder to vitamin C tablet
is profitable or not. All the companies stated that since the price of vitamin C tablet is not really
expensive (which is around 0.13 – 0.3 Euro/tablet), so they would like to ask NEPG to offer a relative
lower price. The second concern was about the effective shelf life (Equation 1), because the shipment
38
takes a long time and it is also quite hard to shorten the lead time. Then for these distributors/traders,
to source vitamin C tablets from NEPG means they could broaden their product portfolio. Moreover,
this could also mean that besides the existing customers who are buying the vitamin C powder, the
customer companies need to find new customers.
Considering about the relationship, all of the customers stated that they would prefer a tighter
relationship with NEPG. This is because the customers will source more product from NEPG and they
would like to share more resources and information with NEPG. Moreover, all the customers would
like to focus a long-term goal with NEPG if it is needed because base on the current performance, they
trust NEPG and their products.
On the other hand, customers had a recommendation about the quality and the service/support which
provided by NEPG. They explained that they would like to have a more standard product quality and a
higher traceability for their new vitamin C tablet products.
To conclude, however, there was no positive mediating effect between the customers’ perceptions
over NEPG and their willingness to buy the new product. Since most of the customers are distributor
and traders, who import the product from NEPG and further sell to their EU end product producers.
When they want to make a decision they also need to take their next tier customers’ interests into
consideration. Also, the effective shelf life directly affects the customers’ willingness to buy the tablets
products, since the production and transportation takes longer time. In the end, the cost and the brand
effect could also be included into the reason why most of the customers showed no interest about
buying NEPG’s new tablet product.
4.2 Company’s interview result
Based on the customers’ perceptions, the idea of the 5 company interviews were to search for the
company’s capabilities in the actions of forward vertical integration. This subchapter will be divided
into two parts, which are company’s capabilities regarding to the forward vertical integration. In order
to adapt to the customers’ requirements or preferences, company’s strategies must be adjusted.
Basically, using the dimensions that were derived from Chapter 2; together with the customers’
perceptions, company interview results were summarized (
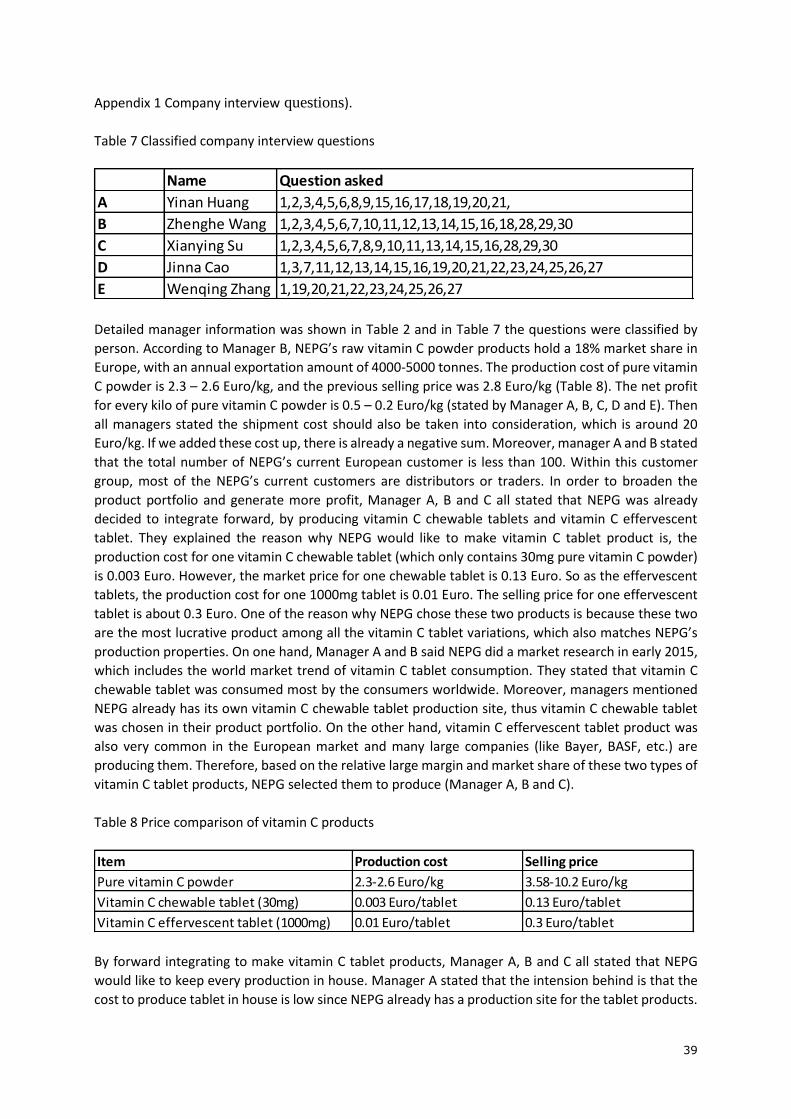
39
Appendix 1 Company interview questions).
Table 7 Classified company interview questions
Detailed manager information was shown in Table 2 and in Table 7 the questions were classified by
person. According to Manager B, NEPG’s raw vitamin C powder products hold a 18% market share in
Europe, with an annual exportation amount of 4000-5000 tonnes. The production cost of pure vitamin
C powder is 2.3 – 2.6 Euro/kg, and the previous selling price was 2.8 Euro/kg (Table 8). The net profit
for every kilo of pure vitamin C powder is 0.5 – 0.2 Euro/kg (stated by Manager A, B, C, D and E). Then
all managers stated the shipment cost should also be taken into consideration, which is around 20
Euro/kg. If we added these cost up, there is already a negative sum. Moreover, manager A and B stated
that the total number of NEPG’s current European customer is less than 100. Within this customer
group, most of the NEPG’s current customers are distributors or traders. In order to broaden the
product portfolio and generate more profit, Manager A, B and C all stated that NEPG was already
decided to integrate forward, by producing vitamin C chewable tablets and vitamin C effervescent
tablet. They explained the reason why NEPG would like to make vitamin C tablet product is, the
production cost for one vitamin C chewable tablet (which only contains 30mg pure vitamin C powder)
is 0.003 Euro. However, the market price for one chewable tablet is 0.13 Euro. So as the effervescent
tablets, the production cost for one 1000mg tablet is 0.01 Euro. The selling price for one effervescent
tablet is about 0.3 Euro. One of the reason why NEPG chose these two products is because these two
are the most lucrative product among all the vitamin C tablet variations, which also matches NEPG’s
production properties. On one hand, Manager A and B said NEPG did a market research in early 2015,
which includes the world market trend of vitamin C tablet consumption. They stated that vitamin C
chewable tablet was consumed most by the consumers worldwide. Moreover, managers mentioned
NEPG already has its own vitamin C chewable tablet production site, thus vitamin C chewable tablet
was chosen in their product portfolio. On the other hand, vitamin C effervescent tablet product was
also very common in the European market and many large companies (like Bayer, BASF, etc.) are
producing them. Therefore, based on the relative large margin and market share of these two types of
vitamin C tablet products, NEPG selected them to produce (Manager A, B and C).
Table 8 Price comparison of vitamin C products
By forward integrating to make vitamin C tablet products, Manager A, B and C all stated that NEPG
would like to keep every production in house. Manager A stated that the intension behind is that the
cost to produce tablet in house is low since NEPG already has a production site for the tablet products.
Name Question asked
A Yinan Huang 1,2,3,4,5,6,8,9,15,16,17,18,19,20,21,
B Zhenghe Wang 1,2,3,4,5,6,7,10,11,12,13,14,15,16,18,28,29,30
C Xianying Su 1,2,3,4,5,6,7,8,9,10,11,13,14,15,16,28,29,30
D Jinna Cao 1,3,7,11,12,13,14,15,16,19,20,21,22,23,24,25,26,27
E Wenqing Zhang 1,19,20,21,22,23,24,25,26,27
Item Production cost Selling price
Pure vitamin C powder 2.3-2.6 Euro/kg 3.58-10.2 Euro/kg
Vitamin C chewable tablet (30mg) 0.003 Euro/tablet 0.13 Euro/tablet
Vitamin C effervescent tablet (1000mg) 0.01 Euro/tablet 0.3 Euro/tablet
40
Also, for NEPG’s current domestic customers, it is easier to produce the tablets in Shenyang and
transport to other cities.
All the five NEPG managers confirmed the possibilities of NEPG could directly diving into the European
vitamin C tablets retail market. However, they also stated that there are several challenges to sell the
vitamin C tablet products in European market. One of the challenges was that besides the duration of
transportation, European market is segmented. This means that besides the EU members whose food
importation are regulated by the EFSA (European Food Safety Authority), non-EU members still
execute their own countries’ food safety standard. Also, from the interview with Manager B (Personal
communication, 23 Nov. 2017), he explained that based on the previous market analysis and
experiences, European consumers tend to buy their own countries’ brand. This is mainly because they
trust more to the product or the brand they are familiar with. Even though there could be a possibility
for NEPG to dive into the European vitamin C tablets retail market and sell their product directly to the
European consumers, NEPG will still face the risk of unprofitable or even loss. It is hard to predict the
profitability of exporting tablets to Europe, which will risk of putting a considerable effort and getting
a low profit in return. Therefore, NEPG needs to analyze the risks and benefits thoroughly before it
finally decides to export to Europe.
However, Manager D and E stated that NEPG does produce tablet products and export to South
America, which the transportation time is also about 45 days. NEPG produce the bulk tablet products
and exported to the South America and the final packaging and labeling procedure will be done in the
customers’ factories. Some of the NEPG’s customers are end product manufacturers, however, they
will only procure the tablet products from NEPG when the price of vitamin C powder is too high. This
is because the price of raw vitamin C powder was show a cyclical variation, which could be influenced
by a short in supply, exceed the emission limit, or the government regulation. However, the price of
vitamin C tablet product shows very stable.
Regarding to the target exportation volume, Manager B stated that the exportation volume of the next
year is targeted for more than 5,000 tonnes for the vitamin C powder. Since they will export their first
batch of vitamin C tablet product to Europe, their target is 1,000 tonnes.
To conclude, from all these five interviews it is clear that NEPG is capable of further producing tablet
products. It might also be promising and lucrative to dive into the European retail market but a detailed
risk analysis need to be done in advance. Also, the main constraints for NEPG is the production time.
From the production side Manager C stated that they will try to shorten the lead time but it is not sure
yet.
41
Chapter 5 Discussion This discussion section presents the possible gaps and matches between customers’ preferences and
the company’s capabilities which is aiming to answer the fourth SRQ “What are the gaps and possible
matches between NEPG and its current EU customers regarding to forward vertical integration?”. Also,
the limitations of the data collection method will be discussed. In the end, there will be a reference
case of a successful Chinese vitamin C tablet manufacturing company who managed to integrate
successfully. The relatability of this reference case will be further discussed together with the focal
case.
The general information which regarding to the informative questions were got from both the NEPG
manager and the customers were in concordance (for example, delivery time, transportation time,
complaints, etc.). Regarding to the customer’s reaction about the trust, satisfaction and commitment
of the company, NEPG was quite satisfied with it. However, considering about the customer complaints,
which regarding to the product quality and the extremely long processing time, NEPG managers stated
that they will work on the quality control and the traceability of the problem-solving process. Especially
for the tablet products that will be exported to Europe, NEPG will improve the traceability of each
process between NEPG and the factories, from the powder to the tablet production.
The first objective of this study was to examine whether there is a (positive) relationship between
company’s capability about forward vertical integration and the customers’ willingness to buy. Thus
the first hypothesis was made, which is “Company’s capabilities which in terms of dimensions of
integration has direct impact on customers’ willingness to buy the new product.”. This hypothesis
was tested by the customer’s reaction over the company’s forward vertical integration. Several
measurable factors were used to test company’s capabilities and customer’s willingness to buy, which
are dimensions of integration, price, product quality, service/support and communication/interaction.
Customer interviews and email questionnaires were done to get the customer’s attitudes towards
NEPG’s forward vertical integration. Moreover, five company interviews were also done to see what
the company’s capabilities are. However, from those results it was hard to see there was a direct
correlation between forward vertical integration and current customers’ willingness to buy the new
product. The reason could because most of the NEPG’s customers are distributors or traders, they do
not need to process the raw vitamin C powder by themselves. Normally these distributors/traders
source the vitamin C powder from NEPG and sell them to the next tier customers (European end
product manufacturing companies). According to the customers’ responds, if NEPG forward vertical
integrate, which means NEPG will produce both vitamin C powder and tablets; they still can buy the
raw vitamin C powder from NEPG. Since most of these distributors’ customers are end product
manufacturing companies. Also, considering about the duration from the production to the
transportation, these distributors would not prefer to buy the tablets from NEPG.
The second objective of our study was to examine whether there is a mediating effect between
customers’ perceptions and their willingness to buy the new product. The second hypothesis is:
“Current customers’ perceptions over the company in terms of commitment, trust and satisfaction
has a mediating effect between forward vertical integration and customers’ willingness to buy the
new product”. This hypothesis was also tested by customer interviews, by which asking the customers
about their trust, satisfaction and commitment over the NEPG’s current performance. The findings
reveal a subtle support for such an effect. It showed that the customers who trust more about the
company tend to buy the new product. Since during the customer interview there were some
companies showed their willingness to source the vitamin C tablets from NEPG. It is worthwhile to
compare the result with Hellier et al. (2003) and Homburg et al. (2005), which they both focus on the

42
customer’s expectation and the (re)purchase intention. Hellier et al. (2003)’s findings suggest that
customer’s expectations/satisfactions have a strong correlation with the repurchase intention.
Homburg et al. (2005)’s findings suggested that higher customer satisfaction lead to a higher
willingness to buy function. Our study extends Hellier et al. (2003) and Homburg et al. (2005)’s work
by identifying other two aspects that the customer can use to measure their perceptions – namely,
commitment and trust. Among all the interviewed companies these companies presented a relatively
higher score in trust, commitment and satisfaction towards NEPG’s service quality and communication;
they would also establish a long-term relationship with NEPG. The reason behind because they have a
mutual goal with NEPG, which they also want to expand their product profile and find more customers
to obtain profit.
Literatures about the relationship between customer perceptions and their repurchase intentions
were searched and compared with our results. According to Hellier et al. (2003) and Olsen (2003), they
found that customer satisfaction lead to a customer loyalty and brand preference and therefore it
influences the customer repurchase intention. In their results it didn’t show a direct relation between
customers trust, commitment with their repurchase intentions. However, they were stated more in a
cause and effect relationship. In Yi & La (2004)’s result, they showed a more comprehensive
relationship among commitment, trust, satisfaction and customer repurchase intention. They also
stated that all this factors lead to a disconfirmation and therefore influence the customers satisfaction,
loyalty and the repurchase intention.
For triangulation, it was hard to find the literature which showed a direct influence between
customer’s trust, commitment, satisfaction and their repurchase intention. The main reason is that
compare with the previous research, there was one construct missing in our research. The customer
loyalty was not included into this research and this might be one of the reasons why there were limited
information about the similar research.
Finally, there are several limitations of conducting this study. One of the biggest limitation of the study
is the incomplete information. Since the contact information was provided by the company and the
quality of the contact person could not be ensured. There might be a chance that the contact person
is contracted by another company and he/she is not aware of any company’s decision. Or he/she only
in charge of sourcing and directly takes order from the company. In this cases the contact person may
not know the company’s decision towards NEPG’s forward vertical integration. This could lead to an
incomplete or even wrong direction of the final result. Another limitation was personal bias, since this
study was mainly based on interviews and probing people’s ideas. There might be a chance that in any
part of the interview the question was not explained well or it is not well understood by the respondent.
Moreover, the ideal situation for data collection in this study was that all the interviewees will be
approached face to face, which further opinions could be asked. However, in the real case, only 5 out
of 14 companies were approached in person. This could also lead to an incomplete answer, since some
respondents only gave scores while without giving any remarks. In the end, the construct of the
interview questions was obtained from several studies, which may lack of finding out the detailed
intention about the direct relation between forward vertical integration and customers’ willingness to
buy.
43
Chapter 6 Conclusion & Recommendations The general research question of this study is “what the impact of forward vertical integration on
customer’s willingness to buy among NEPG’s current EU customers?”. This study attempted to answer
this question using the different constructs that influences forward vertical integration, customers’
willingness to buy, and the factors influence customers’ trust, satisfaction and commitment over the
company. In order to answer the general research question, five sub-questions were developed, and
the methods were developed in order to answer these questions.
According to the literature three main factors were determined, which were company’s capabilities in
forward vertical integration, customer’s willingness to buy the new product and the customer’s
perception over a company. Two hypotheses were made, which “Company’s capabilities which in
terms of dimensions of integration has direct impact on customers’ willingness to buy the new
product” and “Current customers’ perceptions over the company in terms of commitment, trust and
satisfaction has a mediating effect between forward vertical integration and customers’ willingness
to buy the new product”. In order to test these two hypotheses several sub-factors were developed
for constructing the questions and approaching to the answer. In this research interview and email
questionnaires were used, since not all the respondents were available for a face-to-face interview. In
total 5 customer interviews, 9 email questionnaires and 5 company interviews were done in this
research. Customer interviews were done first; the aim of these interviews was to find out whether
the customers would like to continue buying product from the same company if it is forward vertical
integrated. Also, the customers’ trust, satisfaction and commitment over the company were inquired.
For every interview question, further explanation was required, to see whether there is a correlation
between forward vertical integration and customers willingness to buy. Moreover, the aim of customer
interview was also seeking to find whether there are correlations between customers’ perceptions and
their willingness to buy the new product. However, our findings suggested that there is no significant
relation between forward vertical integration and customers’ willingness to buy the new product. This
was primarily due to long production to delivery time and segmented European market. Other reasons
might lead to this result was because most of the NEPG’s customers are distributors or traders, their
preference may differ from the manufacturing companies’ preferences.
Subsequently, the company interviews were done by adopting the Harrigan (1985)’s four dimensions
which were used to examine the company’s capabilities. After finding out the customers’ preferences,
in the perspective of Harrigan (1985)’s four dimensions, this study predicted several gaps and matches
that may arise during NEPG’s forward vertical integration. Since NEPG will only produce vitamin C
chewable tablets and effervescent tablets and keep every production in house. The main managerial
gaps between NEPG and their European customers include the information management and the
length of processing time. The possible matches could be NEPG and their European distributors would
both like to expand their business area and find more customers, which could be one of the potential
point of NEPG’s forward vertical integration. Moreover, the product type (vitamin C chewable and
effervescent tablets) or the industry (food supplement) could be varied. If NEPG decided to acquire
more downstream/retail companies, they could also extend their business to animal feed or cosmetic
industry, which is more lucrative than the food supplements industry. However, this strategy needs a
detailed investigation about the certain industry and gain extra expertise over it, since NEPG is not
familiar with those industries.
De Carolis (2003) stated the value of a firm’s resources is determined by the context of the specific
market in which it is operating. The considerable time, money, and uncertainty associated with
developing network resources also represent a barrier for firms desiring to compete in the research-
44
intensive side of the pharmaceutical industry. Firms competing in the pharmaceutical industry employ
heterogeneous strategies ranging from low-cost strategies adopted by generic drug manufactures to
highly differentiated strategies used by large research-oriented and biopharmaceutical companies
(Taggart, 1993). Guedri et al. (2011) emphasized the possible value addition strategy in three
dimensions: 1) R&D expertise 2) economies of scale, and 3) access to alliance networks. Because of the
limited budget and short-term goal oriented attitude, it is relatively hard to pursue the R&D expertise
in China. Therefore, this dimension was not adopted in this research.
Finally, our results suggest that approaches to measure the rest of the strategies which stated by
Guedri et al. (2011), to analyze which option is the best way for the Chinese vitamin C industry. Also,
add the customer loyalty into the conceptual framework to make a more comprehensive relationship
between customer’s expectation and their repurchase intention (Yi & La (2004); Hellier et al. (2003);
and Olsen (2003)). Then, the quality of the respondent should be standardized. This action is to
guarantee all the respondents could represent their company and they are also fully aware of their
company’s decision. Moreover, the impact of forward vertical integration should be built on both of
the customers’ perceptions and company’s capabilities. Since in the long term, current customers’
perceptions are relevant because they determine the company’s existing profit. In the end, based on
the reference case of Aland (Jiangsu) Nutraceutical Co., Ltd., we also suggest that acquiring the
pharmacy/retail companies and reach the economy of scale might be a potential aspect for NEPG in
their process of forward vertical integration.

45
A reference case – Case study of Aland (Jiangsu) Nutraceutical Co.,
Ltd. According to the interview with NEPG managers, they mentioned a reference case which could be a
perfect example for NEPG. The company is Aland (Jiangsu) Nutraceutical Co. Ltd., which was part of
Jiangsu Jiangshan Pharmaceutical Co. Ltd.. Jiangsu Jiangshan Pharmaceutical Co. Ltd. was found in
1990, which is a global leading vitamin C API manufacturing company and the main dietary
supplements producer in China. In 2015, Royal DSM acquired Jiangshan Pharmaceutical’s vitamin C API
production and left Aland (Jiangsu) Nutraceutical Co., Ltd. to grow itself.
In 2010, Aland (Jiangsu) finalized the full acquisition of American’s dietary supplements producer IVC
(which was found in 1955). This acquisition facilitated Aland (Jiangsu) to become a large contract
manufacturer in the American dietary supplement market. Few years later, it acquired many American
dietary supplement companies, such as Adam Nutrition, Perrigo Nutritionals, the British largest dietary
supplement manufacturer Brunel and Bio care. By acquiring these western old brand companies, Aland
was able to enter the Europe & American dietary supplements retailing market.
Overseas acquisition is the key of the success of Aland (Jiangsu). By combining contract manufacturing
and brand sales together; enabled Aland (Jiangsu) to centralize the production and maximize the
capacity. To date, low profit, high demand is the current situation in the dietary supplement market
all over the world. Aland (Jiangsu) is a positive example which shows the principal pathway of survival
in the world’s dietary supplement market. Besides the centralized production and capacity
maximization, adopting delicacy and a superior information management also contribute to Aland
(Jiangsu)’s current monopolistic advantage. Despite the profit (per order) of vitamin C tablet product
is less profitable than the vitamin C API product; by reaching the economics of scale and centralized
production after the delicacy management, which brought Aland (Jiangsu) an over 7-billion-Euro value
of exports.
Aland (Jiangsu) could be a good example for NEPG, which shows how to reach the economics of scale
in the vitamin C tablet market. Keep acquiring the old brand European vitamin C tablet manufacturing
companies could be important, which may enable the foreign company to secure the European retail
channel. Also, the information management is crucial in the whole process. Without a good
information management, it is hard to track and trace the process, especially for the overseas
transport.
46
References 1. Aitken, M. (2016). Understanding the pharmaceutical value chain. Pharmaceuticals Policy and Law,
18(1-4), 55-66.
2. Allen, T. J., Lee, D. M., & Tushman, M. L. (1980). R&D performance as a function of internal
communication, project management, and the nature of the work. IEEE Transactions on
engineering management, (1), 2-12.
3. Andaleeb, S. S. (1992). The trust concept: research issues for channels of distribution. Research
in marketing, 11(1), 1-34.
4. Anderson, E. W., & Sullivan, M. W. (1993). The antecedents and consequences of customer
satisfaction for firms. Marketing science, 12(2), 125-143.
5. Anderson, E. W., Fornell, C., & Mazvancheryl, S. K. (2004). Customer satisfaction and shareholder
value. Journal of marketing, 68(4), 172-185
6. Anderson, E., & Weitz, B. (1992). The use of pledges to build and sustain commitment in distribution
channels. Journal of marketing research, 18-34.
7. Anderson, J. C., & Narus, J. A. (1984). A model of the distributor's perspective of distributor-
manufacturer working relationships. The journal of marketing, 62-74.
8. Balakrishnan, S., & Wernerfelt, B. (1986). Technical change, competition and vertical
integration. Strategic Management Journal, 7(4), 347-359.
9. Basit, T. (2003). Manual or electronic? The role of coding in qualitative data analysis. Educational
research, 45(2), 143-154.
10. Baumgartner, P. (1999). Go downstream. The new profit imperative in manufacturing. Harvard
business review, 77(5).
11. Becker, M. C., & Lillemark, M. (2006). Marketing/R&D integration in the pharmaceutical
industry. Research Policy, 35(1), 105-120.
12. Bhuyan, S. (2005). An empirical evaluation of factors determining vertical integration in US food
manufacturing industries. Agribusiness, 21(3), 429-445.
13. Bogner, W. C., Thomas, H., & McGee, J. (1996). A longitudinal study of the competitive positions
and entry paths of European firms in the US pharmaceutical market. Strategic Management
Journal, 85-107.
14. Boulding, W., Staelin, R., Ehret, M., & Johnston, W. J. (2013, May). A customer relationship
management roadmap: What is known, potential pitfalls, and where to go. American Marketing
Association.
15. Bowman, C., & Ambrosini, V. (2000). Value creation versus value capture: towards a coherent
definition of value in strategy. British journal of management, 11(1), 1-15.
47
16. Bull, C. (2003). Strategic issues in customer relationship management implementation:
Effectiveness issues and insights. Journal of Service Research, 9(2), 184-194.
17. Buzzell, R. D. (1983). Is vertical integration profitable. Harvard business review, 61(1), 92-102.
18. Cardozo, R. N. (1965). An experimental study of customer effort, expectation, and
satisfaction. Journal of marketing research, 244-249.
19. Carlton, D. W., & Perloff, J. M. (1999). Modern Industrial Organization, Adisson-Wesley Longman.
20. Chen, I. J., & Popovich, K. (2003). Understanding customer relationship management (CRM)
People, process and technology. Business process management journal, 9(5), 672-688.
21. Chen, Z., Li, F., & Hao, Y., (2005). Analysis of the Factors that affect the degree of CS. Journal of
Adult Education School of Hebei University of Technology, (4), p.38-40
22. Chesbrough, H. W. (2006). Open innovation: The new imperative for creating and profiting from
technology. Harvard Business Press.
23. Chesbrough, H. W., & Appleyard, M. M. (2007). Open innovation and strategy. California
management review, 50(1), 57-76.
24. China Pharma Industry. (2016, July 15). Retrieved May 29, 2017, from
http://www.cphi.com/china/visit/why-visit/china-pharma-industry
25. Christopher, M., Payne, A., & Ballantyne, D. (1991). Relationship marketing: bringing quality
customer service and marketing together.
26. Churchill Jr, G. A., & Surprenant, C. (1982). An investigation into the determinants of customer
satisfaction. Journal of marketing research, 491-504.
27. Claro, D. P., Hagelaar, G., & Omta, O. (2003). The determinants of relational governance and
performance: how to manage business relationships?. Industrial Marketing Management, 32(8),
703-716.
28. Cockburn, I. M. (2004). The changing structure of the pharmaceutical industry. Health
Affairs, 23(1), 10-22.
29. Crandall, R. W. (1968). Vertical integration in the United States automobile industry (Doctoral
dissertation, Northwestern University).
30. Crosby, L. A., Evans, K. R., & Cowles, D. (1990). Relationship quality in services selling: an
interpersonal influence perspective. The journal of marketing, 68-81.
31. Danaher, P. J., & Mattsson, J. (1994). Customer satisfaction during the service delivery
process. European journal of Marketing, 28(5), 5-16.
32. Danese, P., & Romano, P. (2012). Relationship between downstream integration, performance
measurement systems and supply network efficiency. International Journal of Production
Research, 50(7), 2002-2013.

48
33. Day, G. S. (1994). The capabilities of market-driven organizations. the Journal of Marketing, 37-52.
34. DCAT Week highlights pharma challenges, opportunities. (2017, October 05). Retrieved October
11, 2017, from https://clarivate.com/blog/dcat-week-highlights-pharma-challenges-
opportunities/
35. De Carolis, D. M. (2003). Competencies and imitability in the pharmaceutical industry: An analysis
of their relationship with firm performance. Journal of management, 29(1), 27-50.
36. Deutsch, M. (1958). Trust and suspicion. Journal of conflict resolution, 2(4), 265-279.
37. DiMasi, J. A., Hansen, R. W., Grabowski, H. G., & Lasagna, L. (1991). Cost of innovation in the
pharmaceutical industry. Journal of health economics, 10(2), 107-142.
38. Doney, P. M., & Cannon, J. P. (1997). Trust in buyer-seller relationships. Journal of marketing, 61,
35-51.
39. Doyle, P. (1995). Marketing in the new millennium. European Journal of Marketing, 29(13), 23-41.
40. Dwyer, F. R., Schurr, P. H., & Oh, S. (1987). Developing buyer-seller relationships. The Journal of
marketing, 11-27.
41. Ellram, L. M. (1991). A managerial guideline for the development and implementation of
purchasing partnerships. Journal of Supply Chain Management, 27(3), 2-8.
42. Etgar, M. (1978). The effects of forward vertical integration on service performance of a
distributive industry. The Journal of Industrial Economics, 249-255.
43. Faulkner, D., & Bowman, C. (1995). The essence of competitive strategy. Prentice Hall.
44. Festel, G., Oels, U., Kreimeyer, A., & von Zedtwitz, M. (2005). The Chemical and Pharmaceutical
Industry in China: Challenges and Threats for Foreign Companies.
45. Fornell, C., Johnson, M. D., Anderson, E. W., Cha, J., & Bryant, B. E. (1996). The American customer
satisfaction index: nature, purpose, and findings. the Journal of Marketing, 7-18.
46. Frey, J. H., & Fontana, A. (1991). The group interview in social research. The Social Science
Journal, 28(2), 175-187.
47. Frohlich, M. T., & Westbrook, R. (2001). Arcs of integration: an international study of supply chain
strategies. Journal of operations management, 19(2), 185-200.
48. Frow, P. E., & Payne, A. F. (2009). Customer relationship management: a strategic
perspective. Journal of Business Market Management, 3(1), 7-27.
49. Frow, P., Payne, A., Wilkinson, I. F., & Young, L. (2011). Customer management and CRM:
addressing the dark side. Journal of Services Marketing, 25(2), 79-89.
49
50. Ganesan, S. (1994). Determinants of long-term orientation in buyer-seller relationships. the
Journal of Marketing, 1-19.
51. Garbarino, E., & Johnson, M. S. (1999). The different roles of satisfaction, trust, and commitment
in customer relationships. the Journal of Marketing, 70-87.
52. Garbarino, E., & Johnson, M. S. (1999). The different roles of satisfaction, trust, and commitment
in customer relationships. the Journal of Marketing, 70-87.
53. Gassmann, O., Enkel, E., & Chesbrough, H. (2010). The future of open innovation. R&d
Management, 40(3), 213-221.
54. Gassmann, O., Reepmeyer, G., & Von Zedtwitz, M. (2008). Leading pharmaceutical innovation:
trends and drivers for growth in the pharmaceutical industry. Springer Science & Business Media.
55. Geyskens, I., Steenkamp, J. B. E., Scheer, L. K., & Kumar, N. (1996). The effects of trust and
interdependence on relationship commitment: A trans-Atlantic study. International Journal of
research in marketing, 13(4), 303-317.
56. Griffin, A., & Hauser, J. R. (1996). Integrating R&D and marketing: a review and analysis of the
literature. Journal of product innovation management, 13(3), 191-215.
57. Guan, W., & Rehme, J. (2012). Vertical integration in supply chains: driving forces and
consequences for a manufacturer's downstream integration. Supply chain management: An
international Journal, 17(2), 187-201.
58. Guedri, Z., & McGuire, J. (2011). Multimarket competition, mobility barriers, and firm
performance. Journal of Management Studies, 48(4), 857-890.
59. Gummesson, E. (1995). Relationship marketing: From 4Ps to 30Rs. Malmö: Liber-Hermods.
60. Hansen, G. S., & Hill, C. W. (1991). Are institutional investors myopic? A time‐series study of four
technology‐driven industries. Strategic management journal, 12(1), 1-16.
61. Harrigan, K. R. (1985). Vertical integration and corporate strategy. Academy of Management
journal, 28(2), 397-425.
62. Harrigan, K. R. (1986). Matching vertical integration strategies to competitive conditions. Strategic
Management Journal, 7(6), 535-555.
63. Hellier, P. K., Geursen, G. M., Carr, R. A., & Rickard, J. A. (2003). Customer repurchase intention: A
general structural equation model. European journal of marketing, 37(11/12), 1762-1800.
64. Henderson, R., & Cockburn, I. (1994). Measuring competence? Exploring firm effects in
pharmaceutical research. Strategic management journal, 15(S1), 63-84.
65. Hennig‐Thurau, T., & Klee, A. (1997). The impact of customer satisfaction and relationship quality
on customer retention: A critical reassessment and model development. Psychology &
marketing, 14(8), 737-764.
50
66. Homburg, C., Koschate, N., & Hoyer, W. D. (2005). Do satisfied customers really pay more? A study
of the relationship between customer satisfaction and willingness to pay. Journal of
Marketing, 69(2), 84-96.
67. Jensen, M. C. (2001). Value maximization, stakeholder theory, and the corporate objective
function. Journal of applied corporate finance, 14(3), 8-21.
68. Johnson, G., Scholes, K., & Whittington, R. (2009). Fundamentals of strategy. Pearson Education.
69. Jorgenson, E. (2015, September 14). Why Value Creation is the Foundation of Business: How to
define it, measure it, and manage it. Retrieved September 07, 2017, from
https://medium.com/evergreen-business-weekly/why-value-creation-is-the-foundation-of-
business-how-to-define-it-measure-it-and-manage-it-147c92b87aca
70. Joskow, P. L. (2010). Vertical integration. Antitrust Bulletin, 55(3), 545.
71. Kalwani, M. U., & Narayandas, N. (1995). Long-term manufacturer-supplier relationships: do they
pay off for supplier firms?. The Journal of marketing, 1-16.
72. Karwal, V. (2006). The changing competitive landscape in the global generics market: Threat or
opportunity? Journal of Generic Medicines, 3(4), 269-279.
73. Katz, R. (Ed.). (1988). Managing professionals in innovative organizations: A collection of readings.
Ballinger.
74. Khanna, I. (2012). Drug discovery in pharmaceutical industry: productivity challenges and
trends. Drug discovery today, 17(19), 1088-1102.
75. Kubo, K. (2011). Vertical Integration and Market Entry in the Generic Pharmaceutical Industry.
University of California, Berkeley.
76. Kumar, R. (2011). Research Methodology. A step-by-step guide for beginners (Third ed.). London:
SAGE Publications Ltd.
77. Kumar, R. (2011). Research Methodology. A step-by-step guide for beginners (Third ed.). London:
SAGE Publications Ltd
78. Kwon, I. W. G., & Suh, T. (2004). Factors affecting the level of trust and commitment in supply
chain relationships. Journal of supply chain management, 40(1), 4-14.
79. Liljander, V., & Strandvik, T. (1995). The nature of customer relationships in services. Advances in
services marketing and management, 4(141), 67.
80. Lin, Y. T., Parlaktürk, A. K., & Swaminathan, J. M. (2014). Vertical integration under competition:
Forward, backward, or no integration?. Production and Operations Management, 23(1), 19-35.
81. Liu, Y. (2013). Sustainable competitive advantage in turbulent business
environments. International Journal of Production Research, 51(10), 2821-2841.
51
82. McNamara, C. (1999). General guidelines for conducting interviews, Minnesota. Patton, M.,(1987).
How to use.
83. Moorman, C., Deshpande, R., & Zaltman, G. (1993). Factors affecting trust in market research
relationships. the Journal of Marketing, 81-101.
84. Moorman, C., Zaltman, G., & Deshpande, R. (1992). Relationships between providers and users of
market research: The dynamics of trust within and between organizations. Journal of marketing
research, 29(3), 314.
85. Morgan, R. M., & Hunt, S. D. (1994). The commitment-trust theory of relationship marketing. The
journal of marketing, 20-38.
86. Newell, F. (2001). Loyalty. com: Customer relationship management in the new era of Internet
marketing. McGraw-Hill, Inc.
87. Niraj, R., Gupta, M., & Narasimhan, C. (2001). Customer profitability in a supply chain. Journal of
Marketing, 65(3), 1-16.
88. Oh, H. (1999). Service quality, customer satisfaction, and customer value: A holistic perspective.
International Journal of Hospitality Management, 18(1), 67-82.
89. Oliver, R. L. (1980). A cognitive model of the antecedents and consequences of satisfaction
decisions. Journal of marketing research, 460-469.
90. Oliver, R. L., & Swan, J. E. (1989). Consumer perceptions of interpersonal equity and satisfaction
in transactions: a field survey approach. The Journal of Marketing, 21-35.
91. Olsen, S. O. (2007). Repurchase loyalty: The role of involvement and satisfaction. Psychology &
Marketing, 24(4), 315-341.
92. Parsons, A. L. (2002). What determines buyer‐seller relationship quality? An investigation from
the buyer's perspective. Journal of Supply Chain Management, 38(1), 4-12.
93. Parvatiyar, A., & Sheth, J. N. (2001). Conceptual framework of customer relationship management
(pp. 3-25). New Delhi, India: Tata/McGraw-Hill.
94. Payne, A., Christopher, M., Peck, H., & Clark, M. (1998). Relationship marketing for competitive
advantage: winning and keeping customers. Butterworth-Heinemann.
95. Perrien, J., & Ricard, L. (1995). The meaning of a marketing relationship: a pilot study. Industrial
Marketing Management, 24(1), 37-43.
96. Ping, R. A. (1993). The effects of satisfaction and structural constraints on retailer exiting, voice,
loyalty, opportunism, and neglect. Journal of retailing, 69(3), 320-352.
97. Porter, M. E. (2008). The five competitive forces that shape strategy. Harvard business
review, 86(1), 25-40.
52
98. Porter, M. E. (2008). Competitive advantage: Creating and sustaining superior performance.
Simon and Schuster.
99. Porter, M. E. (2008). Competitive strategy: Techniques for analyzing industries and competitors.
Simon and Schuster.
100. Powell, W. W., Koput, K. W., & Smith-Doerr, L. (1996). Interorganizational collaboration and the
locus of innovation: Networks of learning in biotechnology. Administrative science quarterly, 116-
145.
101. Priem, R. L., & Butler, J. E. (2001). Is the resource-based “view” a useful perspective for strategic
management research? Academy of management review, 26(1), 22-40.
102. Qu, S. Q., & Dumay, J. (2011). The qualitative research interview. Qualitative research in
accounting & management, 8(3), 238-264.
103. Rangan, V. K., Corey, E. R., & Cespedes, F. (1993). Transaction cost theory: inferences from clinical
field research on downstream vertical integration. Organization Science, 4(3), 454-477.
104. Reichheld, F. F., Teal, T., & Smith, D. K. (1996). The loyalty effect (p. 59). Boston, MA: Harvard
business school press.
105. Reinartz, W. J., & Kumar, V. (2000). On the profitability of long-life customers in a noncontractual
setting: An empirical investigation and implications for marketing. Journal of marketing, 64(4), 17-
35.
106. Richards, K. A., & Jones, E. (2008). Customer relationship management: Finding value drivers.
Industrial marketing management, 37(2), 120-130.
107. Schurr, P. H., & Ozanne, J. L. (1985). Influences on exchange processes: Buyers' preconceptions of
a seller's trustworthiness and bargaining toughness. Journal of consumer research, 11(4), 939-953.
108. Schweizer, L. (2005). Organizational integration of acquired biotechnology companies into
pharmaceutical companies: The need for a hybrid approach. Academy of Management
Journal, 48(6), 1051-1074.
109. Song, X. M., Montoya-Weiss, M. M., & Schmidt, J. B. (1997). Antecedents and consequences of
cross-functional cooperation: a comparison of R&D, manufacturing, and marketing
perspectives. Journal of Product Innovation Management, 14(1), 35-47.
110. Song, X. M., Thieme, R. J., & Xie, J. (1998). The impact of cross‐functional joint involvement across
product development stages: an exploratory study. Journal of Product innovation
management, 15(4), 289-303.
111. Srivastava, R. K., Shervani, T. A., & Fahey, L. (1999). Marketing, business processes, and
shareholder value: An organizationally embedded view of marketing activities and the discipline
of marketing. The Journal of Marketing, 168-179.
53
112. Stafford, A. (2006). The evolution of the global active pharmaceutical ingredients supply market
and the impact on the generic pharmaceuticals business in the United States. Journal of Generic
Medicines, 3(4), 295-305.
113. Storbacka, K., Strandvik, T., & Grönroos, C. (1994). Managing customer relationships for profit: the
dynamics of relationship quality. International journal of service industry management, 5(5), 21-
38.
114. Strauss, A. L. (1987). Qualitative analysis for social scientists. Cambridge University
115. Swan, J. E., & Nolan, J. J. (1985). Gaining customer trust: a conceptual guide for the salesperson.
Journal of Personal Selling & Sales Management, 5(2), 39-48.
116. Taggart, J. H. (1993). The world pharmaceutical industry. Taylor & Francis.
117. Thomas, H., & Bogner, W. C. (1994). Core competence and competitive advantage: A model and
illustrative evidence from the pharmaceutical industry.
118. Treacy, M., & Wiersema, F. (1993). Customer intimacy and other value disciplines. Harvard
business review, 71(1), 84-93.
119. Tse, D. K., & Wilton, P. C. (1988). Models of consumer satisfaction formation: An extension. Journal
of marketing research, 204-212.
120. Vickery, S. K., Jayaram, J., Droge, C., & Calantone, R. (2003). The effects of an integrative supply
chain strategy on customer service and financial performance: an analysis of direct versus indirect
relationships. Journal of operations management, 21(5), 523-539.
121. Wallin Andreassen, T., & Lindestad, B. (1998). Customer loyalty and complex services: The impact
of corporate image on quality, customer satisfaction and loyalty for customers with varying
degrees of service expertise. International journal of service industry management, 9(1), 7-23.
122. Walter, A., Müller, T. A., Helfert, G., & Ritter, T. (2003). Functions of industrial supplier
relationships and their impact on relationship quality. Industrial Marketing Management, 32(2),
159-169.
123. Whitehead, R. (2016, March 13). Scale of Chinese vitamin C production drives prices down.
Retrieved June 1, 2017, from http://www.foodnavigator-asia.com/Markets/Scale-of-Chinese-
vitamin-C-production-drives-prices-down
124. Wilson, D. T. (1995). An integrated model of buyer-seller relationships. Journal of the academy of
marketing science, 23(4), 335-345.
125. Yi, Y., & La, S. (2004). What influences the relationship between customer satisfaction and
repurchase intention? Investigating the effects of adjusted expectations and customer loyalty.
Psychology & Marketing, 21(5), 351-373.
126. Yin, R. K. (2013). Case study research: Design and methods. Sage publications.
54
127. Yu, W., Jacobs, M. A., Salisbury, W. D., & Enns, H. (2013). The effects of supply chain integration
on customer satisfaction and financial performance: An organizational learning
perspective. International Journal of Production Economics, 146(1), 346-358.
128. Zablah, A. R., Bellenger, D. N., & Johnston, W. J. (2004). An evaluation of divergent perspectives
on customer relationship management: Towards a common understanding of an emerging
phenomenon. Industrial marketing management, 33(6), 475-489.
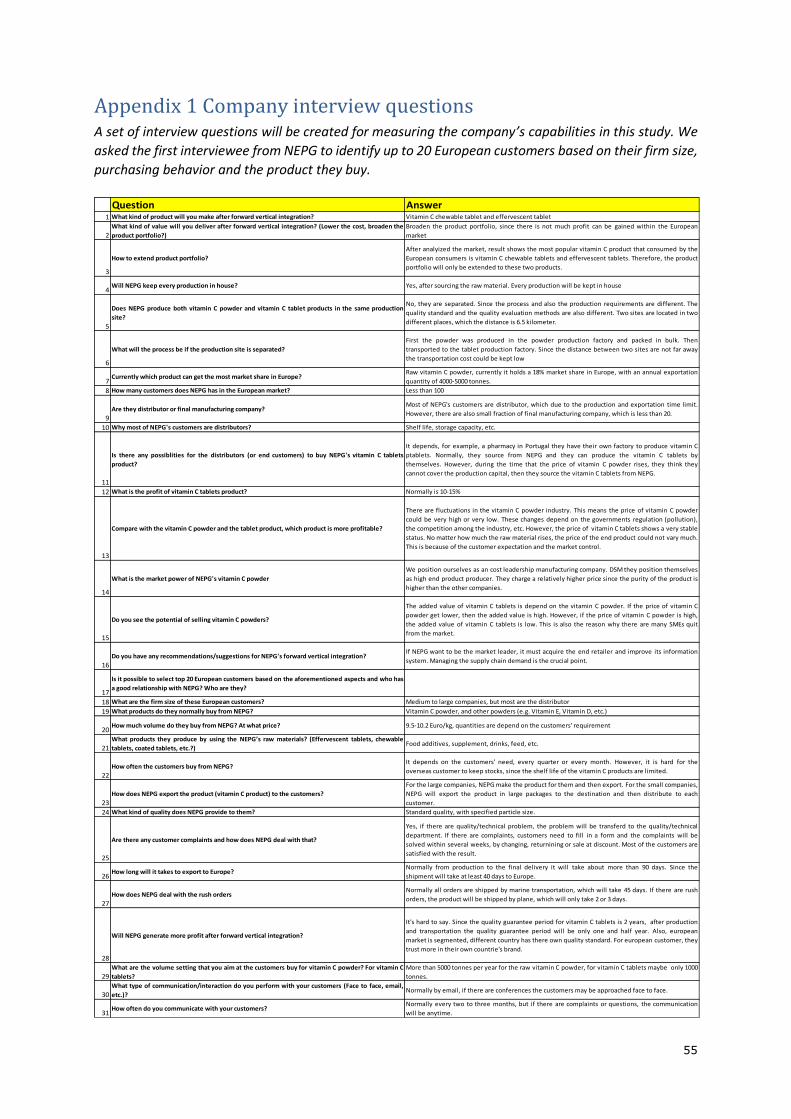
55
Appendix 1 Company interview questions A set of interview questions will be created for measuring the company’s capabilities in this study. We
asked the first interviewee from NEPG to identify up to 20 European customers based on their firm size,
purchasing behavior and the product they buy.
Question Answer1 What kind of product will you make after forward vertical integration? Vitamin C chewable tablet and effervescent tablet
2
What kind of value will you deliver after forward vertical integration? (Lower the cost, broaden the
product portfolio?)
Broaden the product portfolio, since there is not much profit can be gained within the European
market
3
How to extend product portfolio?
After analyized the market, result shows the most popular vitamin C product that consumed by the
European consumers is vitamin C chewable tablets and effervescent tablets. Therefore, the product
portfolio will only be extended to these two products.
4Will NEPG keep every production in house? Yes, after sourcing the raw material. Every production will be kept in house
5
Does NEPG produce both vitamin C powder and vitamin C tablet products in the same production
site?
No, they are separated. Since the process and also the production requirements are different. The
quality standard and the quality evaluation methods are also different. Two sites are located in two
different places, which the distance is 6.5 kilometer.
6
What will the process be if the production site is separated?
First the powder was produced in the powder production factory and packed in bulk. Then
transported to the tablet production factory. Since the distance between two sites are not far away
the transportation cost could be kept low
7Currently which product can get the most market share in Europe?
Raw vitamin C powder, currently it holds a 18% market share in Europe, with an annual exportation
quantity of 4000-5000 tonnes.
8 How many customers does NEPG has in the European market? Less than 100
9
Are they distributor or final manufacturing company?Most of NEPG's customers are distributor, which due to the production and exportation time limit.
However, there are also small fraction of final manufacturing company, which is less than 20.
10 Why most of NEPG's customers are distributors? Shelf life, storage capacity, etc.
11
Is there any possiblities for the distributors (or end customers) to buy NEPG's vitamin C tablets
product?
It depends, for example, a pharmacy in Portugal they have their own factory to produce vitamin C
ptablets. Normally, they source from NEPG and they can produce the vitamin C tablets by
themselves. However, during the time that the price of vitamin C powder rises, they think they
cannot cover the production capital, then they source the vitamin C tablets from NEPG.
12 What is the profit of vitamin C tablets product? Normally is 10-15%
13
Compare with the vitamin C powder and the tablet product, which product is more profitable?
There are fluctuations in the vitamin C powder industry. This means the price of vitamin C powder
could be very high or very low. These changes depend on the governments regulation (pollution),
the competition among the industry, etc. However, the price of vitamin C tablets shows a very stable
status. No matter how much the raw material rises, the price of the end product could not vary much.
This is because of the customer expectation and the market control.
14
What is the market power of NEPG's vitamin C powder
We position ourselves as an cost leadership manufacturing company. DSM they position themselves
as high end product producer. They charge a relatively higher price since the purity of the product is
higher than the other companies.
15
Do you see the potential of selling vitamin C powders?
The added value of vitamin C tablets is depend on the vitamin C powder. If the price of vitamin C
powder get lower, then the added value is high. However, if the price of vitamin C powder is high,
the added value of vitamin C tablets is low. This is also the reason why there are many SMEs quit
from the market.
16
Do you have any recommendations/suggestions for NEPG's forward vertical integration?If NEPG want to be the market leader, it must acquire the end retailer and improve its information
system. Managing the supply chain demand is the crucial point.
17
Is it possible to select top 20 European customers based on the aforementioned aspects and who has
a good relationship with NEPG? Who are they?
18 What are the firm size of these European customers? Medium to large companies, but most are the distributor
19 What products do they normally buy from NEPG? Vitamin C powder, and other powders (e.g. Vitamin E, Vitamin D, etc.)
20How much volume do they buy from NEPG? At what price? 9.5-10.2 Euro/kg, quantities are depend on the customers' requirement
21
What products they produce by using the NEPG’s raw materials? (Effervescent tablets, chewable
tablets, coated tablets, etc.?)Food additives, supplement, drinks, feed, etc.
22
How often the customers buy from NEPG?It depends on the customers' need, every quarter or every month. However, it is hard for the
overseas customer to keep stocks, since the shelf life of the vitamin C products are limited.
23
How does NEPG export the product (vitamin C product) to the customers?
For the large companies, NEPG make the product for them and then export. For the small companies,
NEPG will export the product in large packages to the destination and then distribute to each
customer.
24 What kind of quality does NEPG provide to them? Standard quality, with specified particle size.
25
Are there any customer complaints and how does NEPG deal with that?
Yes, if there are quality/technical problem, the problem will be transferd to the quality/technical
department. If there are complaints, customers need to fill in a form and the complaints will be
solved within several weeks, by changing, returnining or sale at discount. Most of the customers are
satisfied with the result.
26How long will it takes to export to Europe?
Normally from production to the final delivery it will take about more than 90 days. Since the
shipment will take at least 40 days to Europe.
27
How does NEPG deal with the rush ordersNormally all orders are shipped by marine transportation, which will take 45 days. If there are rush
orders, the product will be shipped by plane, which will only take 2 or 3 days.
28
Will NEPG generate more profit after forward vertical integration?
It's hard to say. Since the quality guarantee period for vitamin C tablets is 2 years, after production
and transportation the quality guarantee period will be only one and half year. Also, european
market is segmented, different country has there own quality standard. For european customer, they
trust more in their own countrie's brand.
29
What are the volume setting that you aim at the customers buy for vitamin C powder? For vitamin C
tablets?
More than 5000 tonnes per year for the raw vitamin C powder, for vitamin C tablets maybe only 1000
tonnes.
30
What type of communication/interaction do you perform with your customers (Face to face, email,
etc.)?Normally by email, if there are conferences the customers may be approached face to face.
31How often do you communicate with your customers?
Normally every two to three months, but if there are complaints or questions, the communication
will be anytime.

56
Appendix 2 Customer interview questions (and Expected answer)
12
34
56
7Tr
ust
Ou
r co
mp
any
tru
sts
the
cu
rre
nt
rela
tio
nsh
ip w
ith
NEP
G (
Ove
rall
tru
st).
Ou
r co
mp
any
tru
sts
the
cu
rre
nt
pro
du
ct b
ran
d o
f N
EPG
.
Ou
r co
mp
any
tru
sts
NEP
G’s
cu
rre
nt
pro
du
ct q
ual
ity.
Ou
r co
mp
any
be
lie
ves
the
exp
ert
ise
of
NEP
G t
o p
erf
orm
job
eff
ect
ive
ly a
nd
re
liab
ly.
Ou
r co
mp
any
be
lie
ves
NEP
G t
reat
s u
s in
an
ho
ne
st w
ay in
eve
ry t
ran
sact
ion
.
Ou
r co
mp
any
has
inte
rest
of
NEP
G in
co
mp
any’
s w
elf
are
an
d m
oti
vati
on
to
se
ek
join
t ga
ins.
Sati
sfac
tio
n
Ou
r co
mp
any
is s
atis
fie
d w
ith
th
e c
urr
en
t re
lati
on
ship
wit
h N
EPG
.
Ou
r co
mp
any
is s
atis
fie
d w
ith
NEP
G’s
cu
rre
nt
pro
du
ct q
ual
ity.
NEP
G’s
curr
en
tp
rod
uct
qu
alit
ym
ee
to
ur
com
pan
y’s
exp
ect
atio
n(w
hic
has
pe
ctd
oe
san
dw
hic
h
asp
ect
do
esn
’t m
ee
t th
e e
xpe
ctat
ion
?)
Ou
r co
mp
any
is s
atis
fie
d w
ith
th
e c
urr
en
t p
rice
NEP
G o
ffe
r to
me
.
The
curr
en
tp
rice
NEP
Go
ffe
rto
ou
rco
mp
any
me
et
ou
rco
mp
any’
se
xpe
ctat
ion
.(w
hic
has
pe
ctd
oe
s
and
wh
ich
asp
ect
do
esn
’t m
ee
t th
e e
xpe
ctat
ion
?)
Ou
r co
mp
any
is s
atis
fie
d w
ith
th
e c
urr
en
t se
rvic
e q
ual
ity
of
NEP
G?
Wh
y?
Ou
r co
mp
any
is s
atis
fie
d w
ith
th
e c
urr
en
t se
rvic
e r
ega
rdin
g to
th
e t
ech
nic
al p
rob
lem
.
Ou
r co
mp
any
is s
atis
fie
d w
ith
th
e c
urr
en
t se
rvic
e r
ega
rdin
g to
so
lve
th
e p
rob
lem
in t
ime
.
Ou
r co
mp
any
is s
atis
fie
d w
ith
th
e c
urr
en
t se
rvic
e r
ega
rdin
g to
th
e p
rob
lem
so
lvin
g ac
cura
cy.
The
curr
en
tse
rvic
eq
ual
ity
of
NEP
Gm
ee
to
ur
com
pan
y’s
exp
ect
atio
n.(
wh
ich
asp
ect
do
es
and
wh
ich
asp
ect
do
esn
’t m
ee
t th
e e
xpe
ctat
ion
?)
Ou
r co
mp
any
is s
atis
fie
d w
ith
th
e c
urr
en
t co
mm
un
icat
ion
/in
tera
ctio
n w
ith
NEP
G. W
hy?
Ou
r co
mp
any
is s
atis
fie
d w
ith
th
e c
urr
en
t w
ay o
f co
mm
un
icat
ion
wit
h N
EPG
. Wh
y?
Ou
r co
mp
any
is s
atis
fie
d w
ith
th
e c
urr
en
t fr
eq
ue
ncy
of
com
mu
nic
atio
n w
ith
NEP
G?
Wh
y?
Co
mm
itm
en
t
Ou
r co
mp
any
focu
s o
n lo
ng-
term
go
als
wit
h N
EPG
in t
his
re
lati
on
ship
.
Ou
r co
mp
any
shar
es
any
valu
es
wit
h N
EPG
. (W
hat
kin
d o
f va
lue
s d
o y
ou
sh
are
wit
h N
EPG
?)
Ou
r co
mp
any
wil
lin
g to
inve
st t
ime
an
d o
the
r re
sou
rce
s in
to t
he
re
lati
on
ship
wit
h N
EPG
.
IfN
EPG
forw
ard
vert
ical
lyin
tegr
ate
,fro
mo
nly
pro
du
cin
gp
ow
de
rto
pro
du
ceta
ble
tsp
rod
uct
,d
oyo
u
wil
lin
g to
giv
e t
he
cu
rre
nt
pro
du
ctio
n p
roce
ss t
o N
EPG
?
If y
ou
giv
e t
he
cu
rre
nt
pro
du
ctio
n p
roce
ss t
o N
EPG
, wh
at d
oe
s it
me
an t
o y
ou
r p
roce
ss?
Wh
at c
on
dit
ion
s d
o y
ou
hav
e r
ega
rdin
g to
th
e r
ela
tio
nsh
ip w
ith
NEP
G?
Wh
at c
on
dit
ion
s d
o y
ou
hav
e r
ega
rdin
g to
th
e N
EW p
rod
uct
qu
anti
ty/v
olu
me
do
yo
u w
ant
to b
uy?
Wh
at c
on
dit
ion
s d
o y
ou
hav
e r
ega
rdin
g to
th
e p
rice
of
the
NEW
pro
du
ct?
Wh
at c
on
dit
ion
s d
o y
ou
hav
e r
ega
rdin
g to
th
e N
EW p
rod
uct
qu
alit
y?
Wh
at c
on
dit
ion
s d
o y
ou
hav
e r
ega
rdin
g to
th
e s
erv
ice
/su
pp
ort
(Te
chn
ical
su
pp
ort
, etc
.)?
Wh
at k
ind
of
com
mu
nic
atio
n/i
nte
ract
ion
do
yo
u e
xpe
ct?
Ho
w o
fte
n d
o y
ou
pre
fer
to c
om
mu
nic
ate
wit
h N
EPG
?
Do
yo
u s
till
fo
cus
on
lon
g-te
rm g
oal
s w
ith
NEP
G in
th
is r
ela
tio
nsh
ip?
Wh
y?
Do
yo
u s
till
wil
lin
g to
inve
st t
ime
an
d o
the
r re
sou
rce
s in
to t
he
re
lati
on
ship
wit
h N
EPG
? W
hy?
Qu
est
ion
s
(Be
cau
se o
f N
EPG
is t
rust
wo
rth
y, m
utu
al b
en
efi
t, e
tc.)
(Mu
tual
be
ne
fit,
ch
eap
in p
rice
, can
gai
n m
ore
co
ntr
ol o
ver
the
do
wn
stre
am c
ust
om
ers
, etc
.)
(Eve
ry m
on
th, e
very
2-3
mo
nth
s, w
he
n p
rob
lem
occ
urs
, etc
.)
(Em
ail,
fac
e t
o f
ace
, etc
.)
(Be
ab
le t
o s
olv
e t
he
pro
ble
m a
ccu
rate
ly a
nd
on
tim
e, e
tc.)
(In
te
rms
of
pu
rity
, or
the
pro
du
ct c
om
par
e/i
n c
on
cord
ance
wit
h t
he
cu
sto
me
r co
mp
any’
s cu
rre
nt
pro
du
ct q
ual
ity
or
eq
uiv
ale
nt)
(Eu
ro p
er
ton
ne
, co
mp
are
wit
h t
he
cu
rre
nt
pro
du
ctio
n c
ost
)
(0-1
00%
of
curr
en
t p
rod
uct
ion
, or
ho
w m
any
ton
ne
s p
er
tim
e p
eri
od
)
(Sh
are
th
e f
acil
itie
s, o
pe
nn
ess
in p
roce
ss a
nd
co
mm
un
icat
ion
, etc
.)
(Ch
eap
in p
rice
, mo
re c
on
tro
l of
the
pro
cess
, etc
.)
Ye
s/N
o
Re
mar
ksD
egr
ee
s

57
Appendix 3 Customer company details and type of respond
Appendix 4 Coded interview transcripts (Company)
Appendix 5 Coded interview transcripts (Customer)
Nr. Company Location Customer tyoe Product type Contact person Type of respond
1 AVIDA HEALTH PTE.LTD. Europe, (Mainly in UK) Distributor API Liangfang Chen Interview
2 WILD Flavors & Specialty Ingredients Germany Distributor API Eric Wang Interview
3 P&G International Distributor API Cherry Wang Interview
4 FLEVO CHEMIE (NEDERLAND) B.V. Netherlands Distributor API Lu Xu Interview
5 PARKACRE ENTERPRISES LIMITED UK Distributor Finished product Oliver Harvey Company email
6 Alliance Boots Sourcing (Hong Kong) Limited Hongkong Trader Finished product Gigi Lau Interview
7 OSKAR BERG GMBH Germany Distributor API Bernhard Hartmann Company email
8 VICORQUIMIA. S. A Spain Distributor API Lourdes Pimienta Company email
9 SELECTCHEMIE AG Switzerland Distributor API Monica Gonzalez Company email
10 ECSA Chemicals AG Switzerland Distributor API Nicola Filippini Company email
11 Jo Kozerzet Kozpont Kft Hungary Retailor Finished product Lajos Dunás Varga Company email
12 ATLANTIC CHEMICALS TRADING GMBH Germany Distributor API Jeffrey Rumble Company email
13 Catalent Germany Eberbach GmbH Germany Distributor API Barbara Klauer Company email
14 SANDOZ ILAC SANAYI VE TICARET A.S. Turkey Distributor API Çağla PEKÇEÇINAR Company email
Key word Respond ReasonsStrategy Produce vitamin C chewable & effervescent tablets
Keep every production in house
Reason and Value Broaden product portfolio
Gain more profit
Broden customer portfolio Get more end product manufacturer Only if the vitamin C powder is expensive
Other options Directly dive into EU retail market
Risks/Challenges Short effective shelf life Long lead time
Key word Respond Reasons
Trust Company size, state-owned
Satisfaction Product quality in terms of color, impurities,etc.
Delivery time
Price
Service Delivery in time, problem solving
Commitment Less/No shared valuesNEPG only produce powder for the company,
or company only share formulas with NEPG
Long term goals
Impact on customer companies Influence on company's current production Price difference, less control over process
More shared facilities/values
Tighter relationship with NEPG
Main concerns Price, volume, shelf life