ms visio 2010 - odisha state open universityosou.ac.in/eresources/osou-dca-05-msvisio.pdf · ms...
TRANSCRIPT

MS VISIO 2010
ORISSA STATE OPEN UNIVERSITY

MS VISIO 2010
ORISSA STATE OPEN UNIVERSITY Page 1

MS VISIO 2010
ORISSA STATE OPEN UNIVERSITY Page 2
Contents 1.Getting Started With MS Visio ................................................................................................................... 4
1.1 What is MS Visio ................................................................................................................................. 4
1.1.1 Why MS Visio ................................................................................................................................... 4
1.2 MS Visio Tools ............................................................................................................................... 5
1.2.1 File Tab .................................................................................................................................. 6
1.2.2 Home Tab .............................................................................................................................. 7
1.2.3 Insert Tab ............................................................................................................................ 13
1.2.4 Design Tab ........................................................................................................................... 14
1.2.5 Data Tab .............................................................................................................................. 19
1.2.6 Process Tab ......................................................................................................................... 20
1.2.7 Review Tab .......................................................................................................................... 20
1.2.8 View Tab .............................................................................................................................. 21
1.3 My First Diagram In MS Visio ...................................................................................................... 23
1.3.1 Shapes In The Diagram ............................................................................................................ 24
1.3.1.1Adding Shapes To A Diagram ....................................................................................................... 25
1.3.1.1.1 Formatting shapes In The Diagram ......................................................................................... 27
1.3.1.1.2 Adding Text To Shapes To A Diagram ...................................................................................... 29
1.3.1.1.3 Connecting Shapes In a diagram .............................................................................................. 31
1.3.1.1.4 Formatting Text In The Shapes of the Diagram ....................................................................... 35
1.3.1.1.5 Delete A Shape In The Diagram ............................................................................................... 35
2. Create my first flow chart ....................................................................................................................... 36
2.1 Flowchart .......................................................................................................................................... 36
2.1.1 Shapes in Flow chart and their use ........................................................................................ 36
2.2 How to draw a flow chart. ............................................................................................................ 38
2.2.1 Draw A Simple Flow Chart ............................................................................................................ 38
2.2.2 Saving my flow chart ............................................................................................................... 39
2.3 Use Of Other Shapes ................................................................................................................... 40
2.3.1 Use Of Manual Loop ................................................................................................................ 40
2.3.1.1 Use Of Manual Input ............................................................................................................... 40
2.3.2 Use Of Sub Process.................................................................................................................. 41
2.3.3 Use Of Preparation .................................................................................................................. 42

MS VISIO 2010
ORISSA STATE OPEN UNIVERSITY Page 3
2.3.4 Use Of Document .................................................................................................................... 44
2.3.5 Use Of Multiple Document ........................................................................................................... 44
2.3.6 Use Of Decision ............................................................................................................................. 45
2.3.7 Use Of Merge ................................................................................................................................ 46
2.3.8 Use Of Sort .............................................................................................................................. 48
2.3.9 Use Of Collate ......................................................................................................................... 49
2.3.10 Use Of On Page Reference ........................................................................................................... 50
2.3.11 Use Of Off Page Reference .......................................................................................................... 51
2.3.12 Use Of Logical AND ................................................................................................................. 52
2.3.13 Use Of Logical OR ......................................................................................................................... 53
2.3.14 Use Of External Data Storage ....................................................................................................... 54
2.3.15 Use Of Internal Data Storage ................................................................................................. 55
2.3.16 Use Of Database ...................................................................................................................... 57
2.3.17 Use Of Punched Card .................................................................................................................. 59
2.3.18 Use Of Magnetic Tape ................................................................................................................. 60
2.3.19 USE OF DELAY .............................................................................................................................. 61
3 .Creating my organization chart ............................................................................................................... 62
3.1 How to a create a organization flow chart........................................................................................ 62
3.2 What are the shapes ......................................................................................................................... 63
3.3 Adding Shapes To The Drawing Board ............................................................................................. 67
4. Save As Other Formats ............................................................................................................................ 73
5.QUESTIONS .............................................................................................................................................. 73

MS VISIO 2010
ORISSA STATE OPEN UNIVERSITY Page 4
1.Getting Started With MS Visio
1.1 What is MS Visio MS Visio is a very powerful tool designed by Microsoft used by
1. Corporate Sectors
2. Freelancers
In many fields. Some of the fields are
1. Business Analysts
2. Software Development
3. Hardware installation and Networking
4. Electrical Engineering
5. Civil Engineers and construction
6. Top managers who are into designing Organization Charts
1.1.1 Why MS Visio A PICTURE IS WORTH A THOUSAND WORDS :- Normally we human beings understand a
pictorial representation faster than the text written. Business analysts who work very far away
from the site of development need to interact with their teams as to what the client needs. The
Client needs are well understood and put in a pictorial format using MS Visio. Doing so not only
saves time ,saves energy ,explains everything to the client ,to the development team down the
stream till it touches the developer, tester, documentation team.
In the present century where time and energy are the most vital elements for development, we
work as a team and in a team everything if its transparent work is finished at a rapid speed and
completed finished product is at the clients end ahead of time.

MS VISIO 2010
ORISSA STATE OPEN UNIVERSITY Page 5
1.2 MS Visio Tools

MS VISIO 2010
ORISSA STATE OPEN UNIVERSITY Page 6
1.2.1 File Tab
The file tab is used to
1. Create A New File
2. Save the existing file
3. Save the existing file in another format as jpg and pdf file.
4. View the recent files
5. Help options
6. Option to customize the menus
7. Exit Visio
MS VISIO 2010
ORISSA STATE OPEN UNIVERSITY Page 7
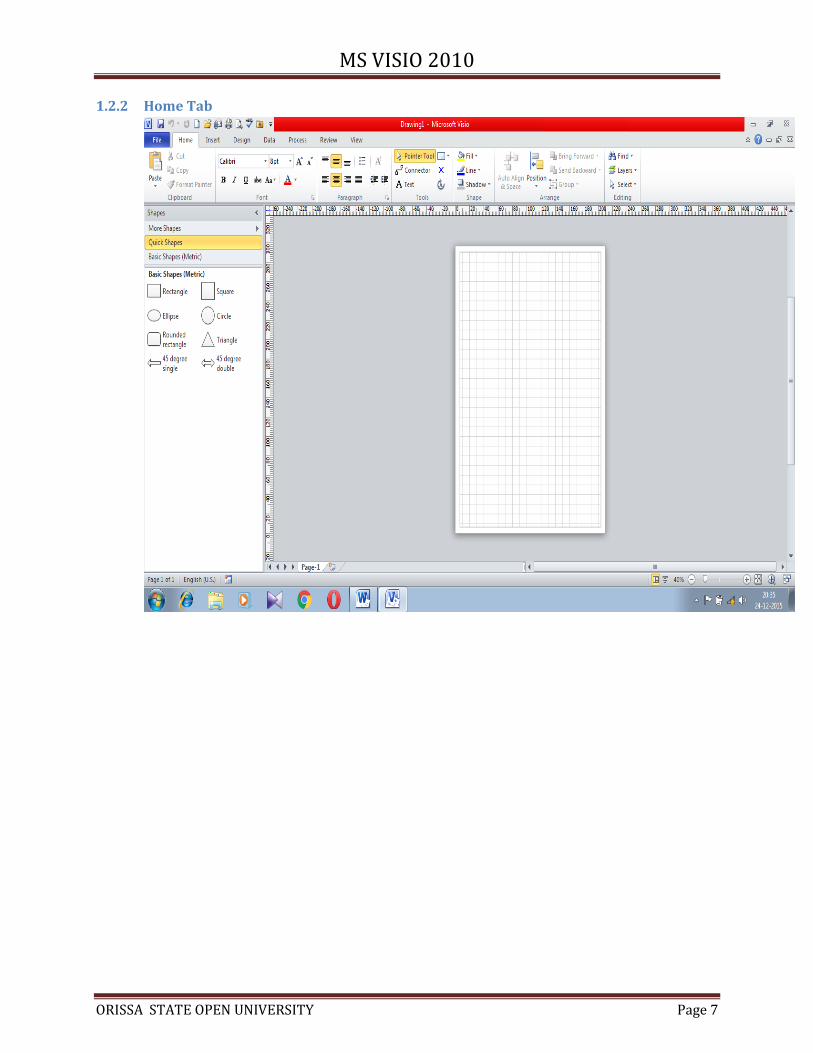
1.2.2 Home Tab

MS VISIO 2010
ORISSA STATE OPEN UNIVERSITY Page 8
The home tab is comprised of the following
Quick Shapes
Basic Shapes
More Shapes

MS VISIO 2010
ORISSA STATE OPEN UNIVERSITY Page 9
CLIP BOARD
Cut a shape or a text inside the shape
Copy a shape or a text inside the shape
Paste a shape /text in a document.
Paste a shape /text in a document in a
1. Formatted Text 2. Unformatted Unicode Text 3. Unformated Text
Paste as hyperlink
Duplicate a shape
Copy formatting text from one place to the other
FONT
Font Name
Font Size
Increase Font size
Decrease Font Size
Make the font bold
Make the font italic
Make the text underlined
Make the text underlined
Change the theme colour of the text
Show font dialog box as shown below

MS VISIO 2010
ORISSA STATE OPEN UNIVERSITY Page 10
PARAGRAPH
Align the paragraph top
Align the paragraph middle
Align the paragraph bottom
Align the paragraph left
Align the paragraph center
Align the paragraph right
Justify the paragraph alignment
Starts bulleting the list
Rotate text
Decrease Indent
Increase indent
Show paragraph dialog box

MS VISIO 2010
ORISSA STATE OPEN UNIVERSITY Page 11
The pointer tool is used to select move and resize objects
Draw connection between objects
Add a text shape or select text
Use basic drawing tools such as rectangle,elipse,line
Used to remove a connection between 2 objects
Used to move and rotate the text between the shape
SHAPE
Used to fill the shape with colours
Used to draw lines
Used to apply a shadow to a drawn object
ARRANGE
Move the selected shapes to space them evenly and straighten connectors
Position shapes on the page by changing their alignment,spacing and rotation.
Auto align Move the selected shapes to straighten connections
Align Left Align left
Align Center Align Center
Align Right Align Right
Align top Align Top
Align Middle Align Middle
Align Bottom Align Bottom
Auto space Auto space the objects
Spacing options Spacing option defined horizontally an vertically
Space shapes Space shapes
Rotate shapes Rotate Shapes

MS VISIO 2010
ORISSA STATE OPEN UNIVERSITY Page 12
Rotate diagram Rotate Diagram
Bring forward by one layer
Bring forward the object to the first layer
Send backward by one layer
Send to back to the last layer
Group Group Group objects together so that they are treated as one object
Ungroup Ungroup grouped objects
Add To Group Add an object to a group
Remove From Group Remove a object from a group
Convert To Group Convert a shape to a group
EDITING
Find a text in a document
Replace a text with another text in the document
Assign an object to a layer.
View the layer properties.
Select all objects on the page
Select objects by type
Select objects in the area
Lasso select

MS VISIO 2010
ORISSA STATE OPEN UNIVERSITY Page 13
1.2.3 Insert Tab
Inserts a blank page in the application
Inserts a background page in the application.
Inserts a picture into the page of ms visio application
Inserts a clipart into the page of ms viso application
Inserts a chart into the page of ms visio application
Insert a CAD drawing into the Ms Visio application
Inserts the container into the page of the MS Viso application
Inserts a callout into the page of the MS Visio application
Used to create a hyperlink to an object
Used to insert a textbox on a page of the MS Viso application
Insert a screen tip to an inserted object
Insert an embedded object on the page of MS Viso file
Insert a field into a MS Viso file

MS VISIO 2010
ORISSA STATE OPEN UNIVERSITY Page 14
Insert a symbol into a shape
1.2.4 Design Tab
Set the orientation to portrait
Set the orientation to landscape
Set the page size to width 21.59 cm and height 27.94 cm
Set the page size to width 27.94 cm and height 43.18 cm
Set he page size to width 21.59 cm and height 35.56 cm
Set the page size to 18.41 cm width and 26.67 height
Set the page size to 29.7 cm width and 42 cm height
Set the page size to 21 cm width and 29.7 cm height
Set the page size to 25.7cm width and 36.4 cm height
Set the page size to 18.2 cm width and 25.7 height
Set the page size to height 10.47 cm and width 24.13 cm
Set the page size to height 9.84 cm and width 19.05 cm
Fit the drawing into 1 page
Fit into very large pages

MS VISIO 2010
ORISSA STATE OPEN UNIVERSITY Page 15
Page auto size Automatically resize the page as you draw.
Print Setup
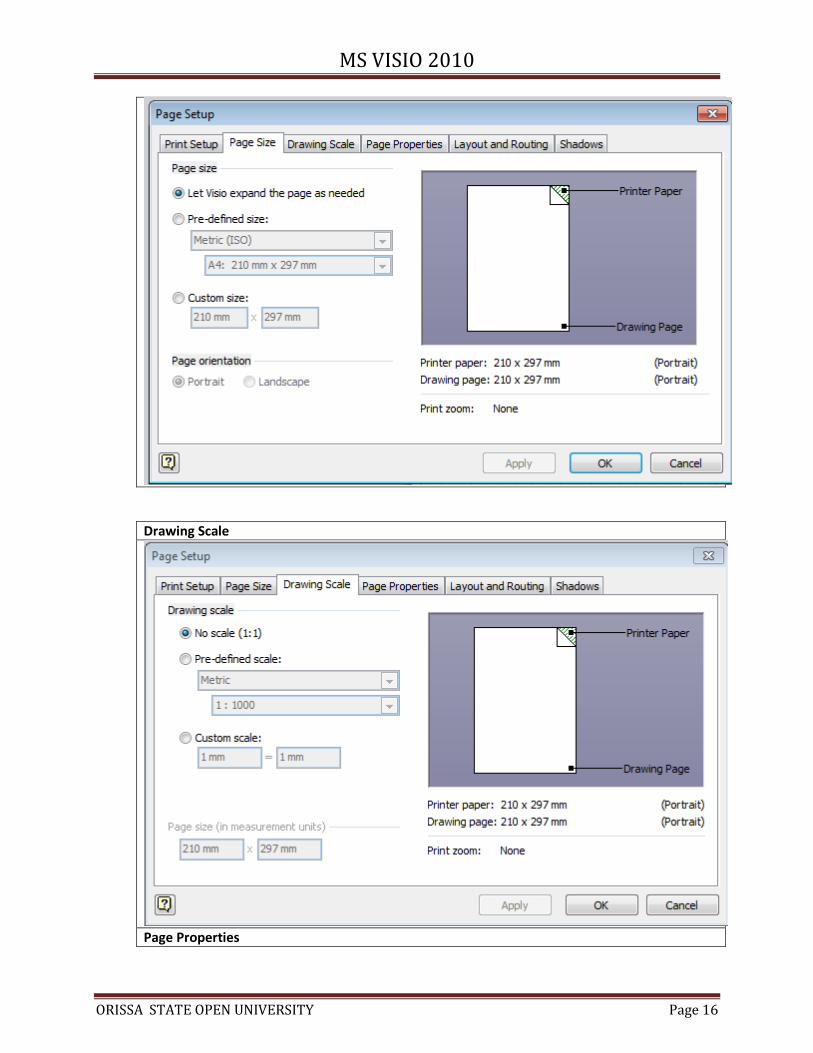
Page Size
MS VISIO 2010
ORISSA STATE OPEN UNIVERSITY Page 16
Drawing Scale
Page Properties

MS VISIO 2010
ORISSA STATE OPEN UNIVERSITY Page 17
Layout And Routing
Shadows

MS VISIO 2010
ORISSA STATE OPEN UNIVERSITY Page 18
THEMES Used to change the themes of the shapes
COLOURS Used to change the colour of shape selected
EFFECTS Used to change the effect of the shape selected
BACKGROUNDS Used to change the background of the page
BORDERS & SHADINGS
Used to change the Borders and shadings of a page
Re –Layout Page Used to change the re layout of a page

MS VISIO 2010
ORISSA STATE OPEN UNIVERSITY Page 19
Connectors Used to change the connectors connecting 2 shapes
1.2.5 Data Tab
External Data
Link data to shapes This option is used to link data to shapes
Automatically link data to shapes This option is used to automatically link imported data to shapes. To be used after link data to shapes.
Refresh information coming from the data source
Shows the refresh data dialog to update the information that is coming from a data source
Display shape data in your diagram by using text, data bars, icons, colour by value or a combination of these types.
Used to create a new data graphic based on the data you have entered in the shape data window or imported into the diagram
Edit data graphic that is used by the selected shape
Choose whether data graphic is applied to shapes when you link data to them.

MS VISIO 2010
ORISSA STATE OPEN UNIVERSITY Page 20
Insert a legend to show the meaning of data graphics used in the diagram
Horizontal legend
Vertical legend
1.2.6 Process Tab
Create new Sub process page and hyperlink the selected shape to the selected page
Link to existing sub process in a page
Create sub processes from selection
Check if the flow chart is correct or not
1.2.7 Review Tab
Check the spelling in the Viso diagram
Open through research task pane to search through reference materials such as dictionaries, encyclopedias and translation services.
Suggests other words with similar meanings to the word you have selected
Translate the said word into another language.

MS VISIO 2010
ORISSA STATE OPEN UNIVERSITY Page 21
Change default language
Add a new comment to a shape
Edit a comment to a shape
Delete a comment to a shape
Go to previous comment
Go to next comment
Show comments and other annotations
Go to previous mark up
Go to next mark up
Track all markup made to the drawing, comments, shapes and other annotations
Draw freeform ink
Open the reviewing task pane to review all markup made to the drawing.
1.2.8 View Tab
Views
View MS Visio in Full screen mode
Show
View rulers used to measure and line up objects in the document
Turn on page breaks to see what will be printed on each page of your document.
Turn on grid lines to which you can align objects in the document.
Turn on guides to help align objects on the document.

MS VISIO 2010
ORISSA STATE OPEN UNIVERSITY Page 22
Shows windows to view shapes and shape data and to easily move within the drawing.
Zoom
Show the zoom dialog box
Zooms the entire document so that it fits to the window
Zoom the page so that it is as wide as the window.
Visual Aids
Dynamic Grid guides assist in the sizing ,spacing and alignment of shapes in relation to one another
Auto connect helps add, connect, align and space shapes in a connected drawing such as process flow chart
Connection points are the points in the shape where you can glue connectors.
Window
Open a new window containing a view of the current document
Tile all program windows side by side on the screen
Cascade the open document windows on the screen so that they overlap.
Switch to different currently open windows.
View, list, create, edit, delete a macro
Runs other add ons and utilities
MS VISIO 2010
ORISSA STATE OPEN UNIVERSITY Page 23
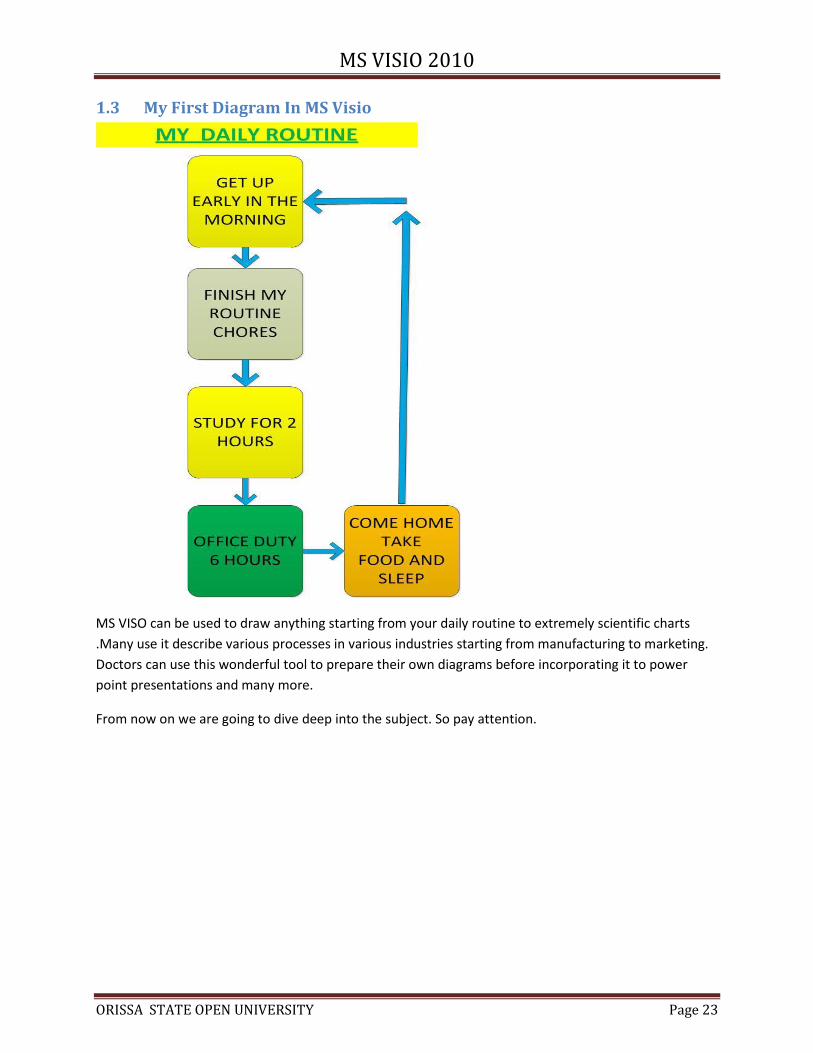
1.3 My First Diagram In MS Visio
MS VISO can be used to draw anything starting from your daily routine to extremely scientific charts
.Many use it describe various processes in various industries starting from manufacturing to marketing.
Doctors can use this wonderful tool to prepare their own diagrams before incorporating it to power
point presentations and many more.
From now on we are going to dive deep into the subject. So pay attention.

MS VISIO 2010
ORISSA STATE OPEN UNIVERSITY Page 24
1.3.1 Shapes In The Diagram

MS VISIO 2010
ORISSA STATE OPEN UNIVERSITY Page 25
1.3.1.1Adding Shapes To A Diagram STEP-1 :- Click on File and click on new

MS VISIO 2010
ORISSA STATE OPEN UNIVERSITY Page 26
STEP-2 :- Select any of the templates and click on the create button
STEP-3 :- Here We will see how to add shapes to the diagram.
Left click and pull the shape to the drawing board where you want to place it as shown below

MS VISIO 2010
ORISSA STATE OPEN UNIVERSITY Page 27
1.3.1.1.1 Formatting shapes In The Diagram
Formatting a shape in MS VISIO 2010 is by changing the fill colour, line colour and shadow
STEP-4 :- Here We will see how to colour the square that has been placed on the drawing board.

MS VISIO 2010
ORISSA STATE OPEN UNIVERSITY Page 28
Step-5 :- Here we will see how to change the line colour of the square as shown below
We can format the line line colour of the shape by
changing its weight,
dashes,
arrows applicable to connectors under home tag
line options applicable to connectors under home tag
as shown below
adding more colours to the line

MS VISIO 2010
ORISSA STATE OPEN UNIVERSITY Page 29
1.3.1.1.2 Adding Text To Shapes To A Diagram STEP-1 :-Consider the shape that we created. Double click on the shape and enter text as shown
below.
STEP-2:-TEXT THAT IS ENTERED IS IN THIS FORMAT AS SHOWN BELOW
Step-3
Select the magnification and increase the magnification as shown below

MS VISIO 2010
ORISSA STATE OPEN UNIVERSITY Page 30
Double click the text and increase the magnification of the font as shown below

MS VISIO 2010
ORISSA STATE OPEN UNIVERSITY Page 31
1.3.1.1.3 Connecting Shapes In a diagram A shape is connected to another shape with a connector .In this section we will learn how to connect 2
or more shapes with a connector.
STEP-1
From the templates drag a shape to the drawing board as shown below
STEP-2
From the template drag a shape to the drawing board as shown below

MS VISIO 2010
ORISSA STATE OPEN UNIVERSITY Page 32
STEP-3
Click on home tab and select the connector tab as shown below
STEP-4
Select the connector as shown below and right click the connector. Select the straight connector.

MS VISIO 2010
ORISSA STATE OPEN UNIVERSITY Page 33

MS VISIO 2010
ORISSA STATE OPEN UNIVERSITY Page 34
STEP-5
The two shapes are connected by using straight connector and the arrow symbols above.

MS VISIO 2010
ORISSA STATE OPEN UNIVERSITY Page 35
1.3.1.1.4 Formatting Text In The Shapes of the Diagram STEP-1
STEP-2
Select the text and
Change the text font from calibari to AHARONI and font size to 14 pt
Change the text to Bold by clicking and Italized by clicking and underlined by clicking and
many more as defined before
1.3.1.1.5 Delete A Shape In The Diagram To delete the shape in the Diagram select the shape and press the delete button

MS VISIO 2010
ORISSA STATE OPEN UNIVERSITY Page 36
2. Create my first flow chart
2.1 Flowchart A flowchart is a type of diagram that represents an algorithm, workflow or process, showing the steps as
boxes of various kinds, and their order by connecting them with arrows. This diagrammatic
representation illustrates a solution model to a given problem.
2.1.1 Shapes in Flow chart and their use
Terminator Used to start and stop a flowchart
Manual Loop Indicate the sequence of commands that continue to repeat until stopped manually
Manual Input Input done manually
Data Represents any type of data input /output
Process Indicates any processing function
Sub Process Indicates sub process of a process
Delay Delay in process
Preparation Indicates modification to a process such as setting a switch or initiating a routine
Display
Document Indicates document that can be read by a person
Multiple Document Indicates multiple document that can be read by a person
Decision Indicates decision point between two or more paths in a flowchart

MS VISIO 2010
ORISSA STATE OPEN UNIVERSITY Page 37
Merge Indicates multiple sets of data into one
Sort Used to sort data in the system
Collate
Indicates a step that organizes data into standard format.
On Page Reference Refers to a process in the same page
Off Page Reference Refers to a process in another page
OR Used in Logical Or
AND Summing Junction
External Data Data from external data source
Storage Internal storage such as hard disk to store data
Database Database
Punched card Punched card
Magnetic Tape Magnetic tape to read /write/read and write
MS VISIO 2010
ORISSA STATE OPEN UNIVERSITY Page 38
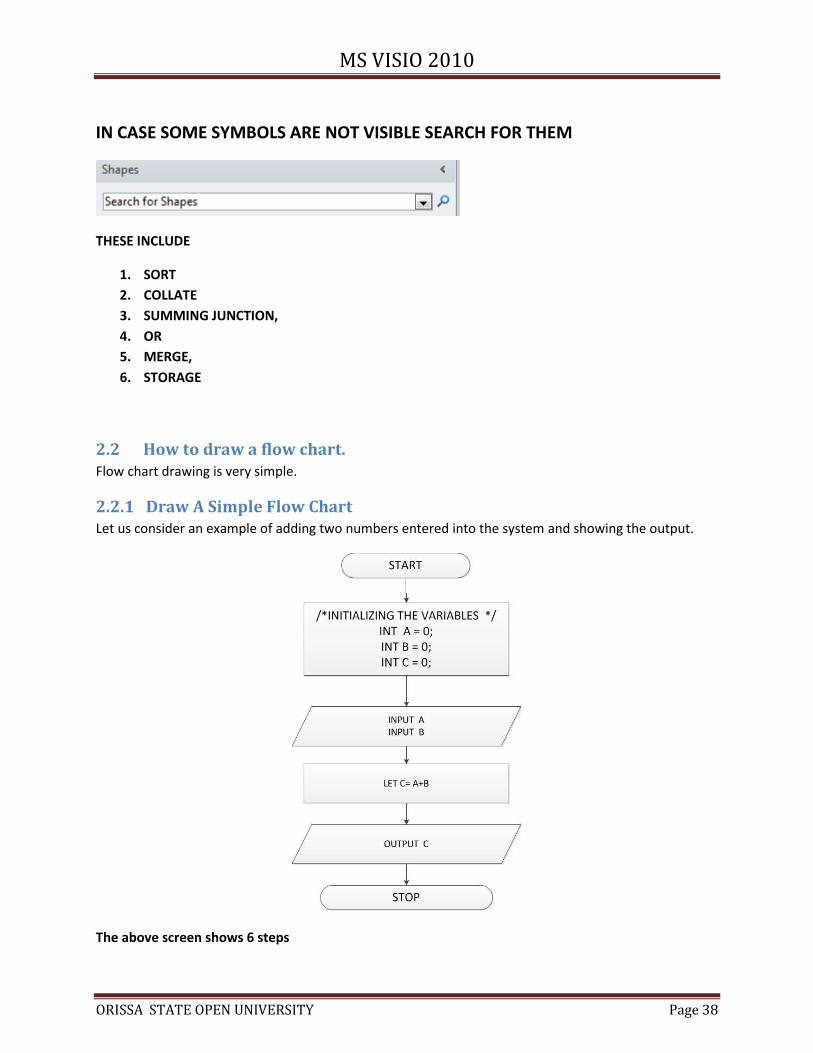
IN CASE SOME SYMBOLS ARE NOT VISIBLE SEARCH FOR THEM
THESE INCLUDE
1. SORT
2. COLLATE
3. SUMMING JUNCTION,
4. OR
5. MERGE,
6. STORAGE
2.2 How to draw a flow chart. Flow chart drawing is very simple.
2.2.1 Draw A Simple Flow Chart Let us consider an example of adding two numbers entered into the system and showing the output.
The above screen shows 6 steps

MS VISIO 2010
ORISSA STATE OPEN UNIVERSITY Page 39
1. START :- To Start the process
2. Initializing the variables :- Used To initialize the variables so that they can be used
3. Input A,B :-used to input the values of A and B
4. Let C= A+B :- This is a process where values of A AND B are summed up and stored in C
5. Output C:-Used to output the value of C on the screen
6. STOP :- Completes the execution
2.2.2 Saving my flow chart Click on file and then click save button. Click save as to save in another format.

MS VISIO 2010
ORISSA STATE OPEN UNIVERSITY Page 40
2.3 Use Of Other Shapes
2.3.1 Use Of Manual Loop
2.3.1.1 Use Of Manual Input The manual input is used to do the input manually

MS VISIO 2010
ORISSA STATE OPEN UNIVERSITY Page 41
2.3.2 Use Of Sub Process. Sub process are a small processes which make a process. Here the process Employee Recruitment
process is comprised of various processes as shown below written test, interviews , on job test, stress
test ,background checks, assign job.

MS VISIO 2010
ORISSA STATE OPEN UNIVERSITY Page 42
2.3.3 Use Of Preparation Below the student class is checked and its >7 class another subroutine is added a part of the student
daily study course and that is guide students from 1 to 6.

MS VISIO 2010
ORISSA STATE OPEN UNIVERSITY Page 43

MS VISIO 2010
ORISSA STATE OPEN UNIVERSITY Page 44
2.3.4 Use Of Document The Document symbol depicts output to be seen in a single sheet of paper as shown below.
2.3.5 Use Of Multiple Document Multiple Document is used in places where the output is in more than 1 page .Refer to sort example
below.
The multiple document is depicted by the symbol.If you don’t find this symbol search by typing
document.

MS VISIO 2010
ORISSA STATE OPEN UNIVERSITY Page 45
2.3.6 Use Of Decision
The decision is used just as if then else statement
If you do this then this will happen
If you do not do this this will happen.
Decisions are used to give the computer the intelligence about what to do when decisions change
MS VISIO 2010
ORISSA STATE OPEN UNIVERSITY Page 46
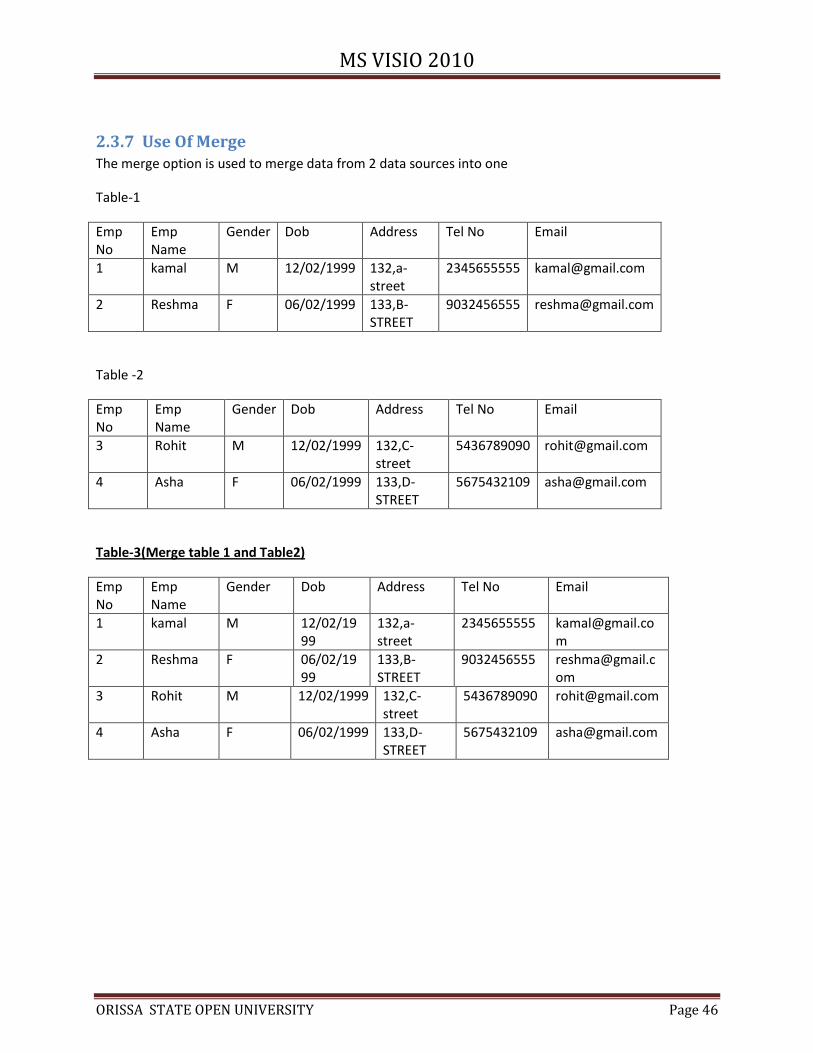
2.3.7 Use Of Merge The merge option is used to merge data from 2 data sources into one
Table-1
Emp No
Emp Name
Gender Dob Address Tel No Email
1 kamal M 12/02/1999 132,a-street
2345655555 [email protected]
2 Reshma F 06/02/1999 133,B-STREET
9032456555 [email protected]
Table -2
Emp No
Emp Name
Gender Dob Address Tel No Email
3 Rohit M 12/02/1999 132,C-street
5436789090 [email protected]
4 Asha F 06/02/1999 133,D-STREET
5675432109 [email protected]
Table-3(Merge table 1 and Table2)
Emp No
Emp Name
Gender Dob Address Tel No Email
1 kamal M 12/02/1999
132,a-street
2345655555 [email protected]
2 Reshma F 06/02/1999
133,B-STREET
9032456555 [email protected]
3 Rohit M 12/02/1999 132,C-street
5436789090 [email protected]
4 Asha F 06/02/1999 133,D-STREET
5675432109 [email protected]

MS VISIO 2010
ORISSA STATE OPEN UNIVERSITY Page 47
MS VISIO 2010
ORISSA STATE OPEN UNIVERSITY Page 48
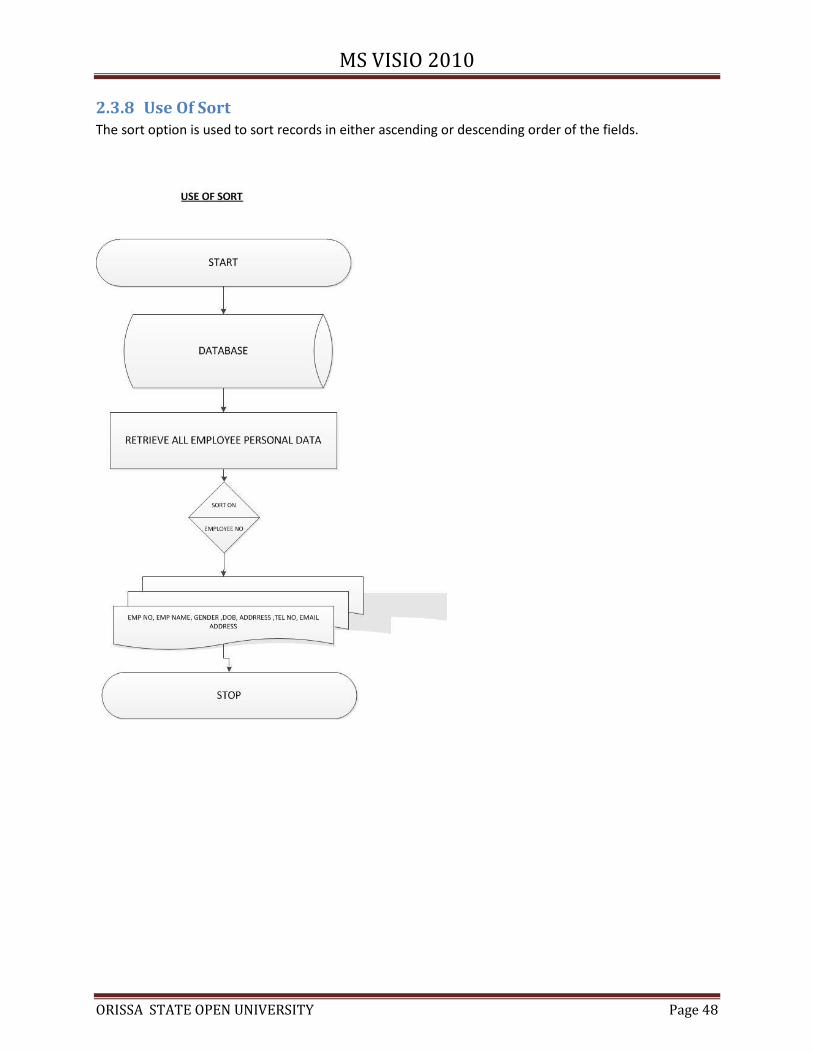
2.3.8 Use Of Sort The sort option is used to sort records in either ascending or descending order of the fields.

MS VISIO 2010
ORISSA STATE OPEN UNIVERSITY Page 49
2.3.9 Use Of Collate The collate symbol is used to organize data in a standard format

MS VISIO 2010
ORISSA STATE OPEN UNIVERSITY Page 50
2.3.10 Use Of On Page Reference The On page connector is used
1. If the flow chart is too big but can be broken down into one page as shown below.
2. If logically one has to go to a point of execution but is unable to reach it as shown in internal
storage.

MS VISIO 2010
ORISSA STATE OPEN UNIVERSITY Page 51
2.3.11 Use Of Off Page Reference
The Off Page Reference is used in cases where the flow chart is extremely large and does not fit into one
page. In such cases Off page connectors are used

MS VISIO 2010
ORISSA STATE OPEN UNIVERSITY Page 52
2.3.12 Use Of Logical AND

MS VISIO 2010
ORISSA STATE OPEN UNIVERSITY Page 53
2.3.13 Use Of Logical OR The logical OR is used in conditions where one condition may match or another condition may match

MS VISIO 2010
ORISSA STATE OPEN UNIVERSITY Page 54
2.3.14 Use Of External Data Storage External data storage are the devises which store data externally. These include
1. Pen Drives
2. External Hard Disk
3. External Card Memory
4. Floppy disks
5. Compact Disks
6. DVD
Data can be stored , retrieved, edited, deleted from an external data storage. Watch if arrow is going to
external data storage data is going towards external storage. If arrow is coming from external data
storage data is being retrieved from it . Below shows data from internal storage is going towards
external storage

MS VISIO 2010
ORISSA STATE OPEN UNIVERSITY Page 55
2.3.15 Use Of Internal Data Storage The internal data storage is a devise used to store data internally such as hard drives of the computer.
Data is stored, retrieved, edited, deleted from the Hard Drives. Data is stored in the hard drives in any
form except databases. Data can be any form such as
Flat files which include binary and text files prepared by
1. Various languages such as
C
C++
VC++
Pascal
Fortran
PHP
2. By a person
3. Excel sheets
4. Binary files
5. Ms word
6. Ms Power point

MS VISIO 2010
ORISSA STATE OPEN UNIVERSITY Page 56

MS VISIO 2010
ORISSA STATE OPEN UNIVERSITY Page 57
2.3.16 Use Of Database
A database is an organized collection of data.[1] It is the collection of
schemas, tables, queries, reports, views and other objects. The data is typically organized to
model aspects of reality in a way that supports processes requiring information, such as
modelling the availability of rooms in hotels in a way that supports finding a hotel with
vacancies.
A database management system (DBMS) is a computer software application that interacts
with the user, other applications, and the database itself to capture and analyze data. A
general-purpose DBMS is designed to allow the definition, creation, querying, update, and
administration of databases. Well-known DBMSs include MySQL, PostgreSQL,Microsoft
SQL Server, Oracle, Sybase and IBM DB2. A database is not generally portable across
different DBMSs, but different DBMS can interoperate by using standards such
as SQL and ODBC or JDBC to allow a single application to work with more than one DBMS.
Database management systems are often classified according to the database model that
they support; the most popular database systems since the 1980s have all supported
the relational model as represented by the SQL language.[disputed – discuss] Sometimes a DBMS is
loosely referred to as a 'database'.

MS VISIO 2010
ORISSA STATE OPEN UNIVERSITY Page 58

MS VISIO 2010
ORISSA STATE OPEN UNIVERSITY Page 59
2.3.17 Use Of Punched Card The punched card was used once upon a time when instructions and data were entered in the form of
punched card. Data used to be read by the computer by the help of computer punched card reader.

MS VISIO 2010
ORISSA STATE OPEN UNIVERSITY Page 60
2.3.18 Use Of Magnetic Tape
The magnetic tape is a devise which is used to store data sequentially.
The above example shows a person is entering item code and item name which gets stored in
the magnetic tape.

MS VISIO 2010
ORISSA STATE OPEN UNIVERSITY Page 61
2.3.19 USE OF DELAY The Delay tag is used to delay the process by a particular time T

MS VISIO 2010
ORISSA STATE OPEN UNIVERSITY Page 62
3 .Creating my organization chart
3.1 How to a create a organization flow chart
STEP-1
MS VISIO 2010
ORISSA STATE OPEN UNIVERSITY Page 63
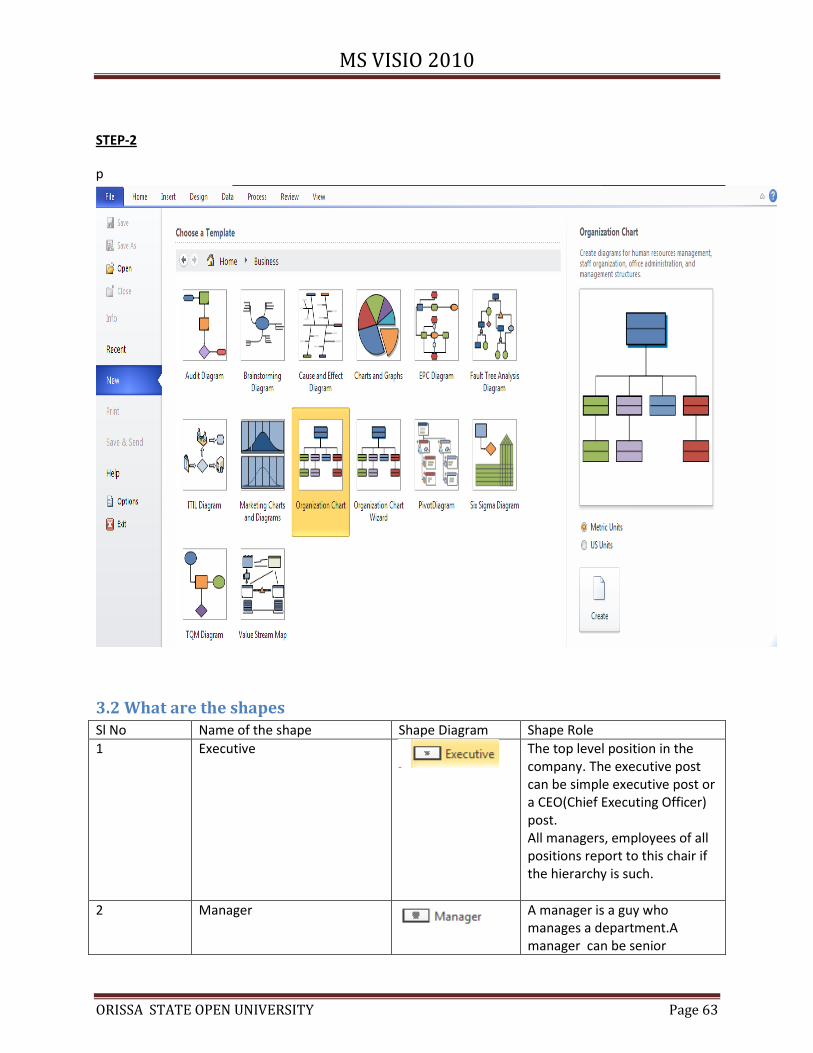
STEP-2
p
3.2 What are the shapes Sl No Name of the shape Shape Diagram Shape Role
1 Executive
The top level position in the company. The executive post can be simple executive post or a CEO(Chief Executing Officer) post. All managers, employees of all positions report to this chair if the hierarchy is such.
2 Manager
A manager is a guy who manages a department.A manager can be senior

MS VISIO 2010
ORISSA STATE OPEN UNIVERSITY Page 64
manager, Deputy manager, Assistant Manager, Junior Manager or simply a floor manager. The floor manager manage the entire floor of a huge shopping complex or a huge hospital. Assistant managers or the the junior managers come at the lowest level of the manager category when it comes to position. Jobs done by a data entry operator are reported to Assistant manager. Assistant Managers in turn report to deputy manager and deputy managers report to Senior manager. Senior manager report to CEO.
3 Position
These involve other positions other than managers in a company .These include Say in hospitals Senior surgeon, anesthesia doctor, junior surgeon
4 Consultant
This involves people who work for the organization on contractual basis. These include Visiting consultants to a hospital who charge per visit to patient. Permanent consultants who are paid a share of the amount of money for the number of patients they see .
5 Vacancy
This involves other posts
6 Assistant
The assistant is a person who assists another person in any job.
7 Team Frame
The team frame is used to group officers in a team
8 Staff
In involves all the staff that work under an officer
9 Multiple shapes
Add multiple shapes under a shape

MS VISIO 2010
ORISSA STATE OPEN UNIVERSITY Page 65
10 Three positions
Used to add 3 positions to a sheet
11 Title and Date
Used to add title and date
12 Title
Used to add title
13 Dynamic connector
Used to add dynamic connector between shapes.
14 Dotted Line Report
Used to add Dotted Line report
LAYOUT
Center
Left
Left Offset
Right Offset
Stagger
Vertical
Center Left
Left Offset
Staff Left
Right
Center Right
Right Offset
Staff Right

MS VISIO 2010
ORISSA STATE OPEN UNIVERSITY Page 66
Single side
Single Top
Double side
Double Top
Re layout Automatically rearrange
the shapes in the organization chart preserving the layout styles chosen.
Best fit To the Page Automatically rearrange
the chart so that it fits to the page
Change Spacing Show the spacing dialog
box to set the amount of space between some or all shapes in the organization chart
Move Left/Up Move the selected subordinate shapes to the left in the horizontal layout or up in the vertical layout.
Move Right/Down Move selected subordinate shapes to the Right in the Horizontal Layout or Down in the Vertical Layout
Show/Hide Subordinates
This option is used to hide the subordinates under a higher position
Insert image into a shape
Delete Image From a shape
Show/Hide pictures inside the selected organization chart
Create synchronized
copy of selected sections Of a large organization chart on a different page

MS VISIO 2010
ORISSA STATE OPEN UNIVERSITY Page 67
Expand subordinates
Sets options for the appearance of the organization chart
Automatically create an
organization chart based on the data imported from workbook /Microsoft Exchange server directory
Export an organization
chart to ms work book or A text file
Create a report
comparing the data in the current organization chart with another version of organization chart.
3.3 Adding Shapes To The Drawing Board STEP-1
Drag Executive to the Drawing Board

MS VISIO 2010
ORISSA STATE OPEN UNIVERSITY Page 68
STEP-2
Clean up all an write as shown below
Step-3
Drag Manager and Place over Executive as shown below

MS VISIO 2010
ORISSA STATE OPEN UNIVERSITY Page 69
Step-4
Drag another Manager

MS VISIO 2010
ORISSA STATE OPEN UNIVERSITY Page 70
Step-5
Shape Up A Bit and do the modification.The Organization chart is prepared.
I have added the manager under Executive .you can try Executive under executive and other ways.
Step-6
To horizontal align select the entire diagram with the mouse as shown below

MS VISIO 2010
ORISSA STATE OPEN UNIVERSITY Page 71
STEP-7
MS VISIO 2010
ORISSA STATE OPEN UNIVERSITY Page 72
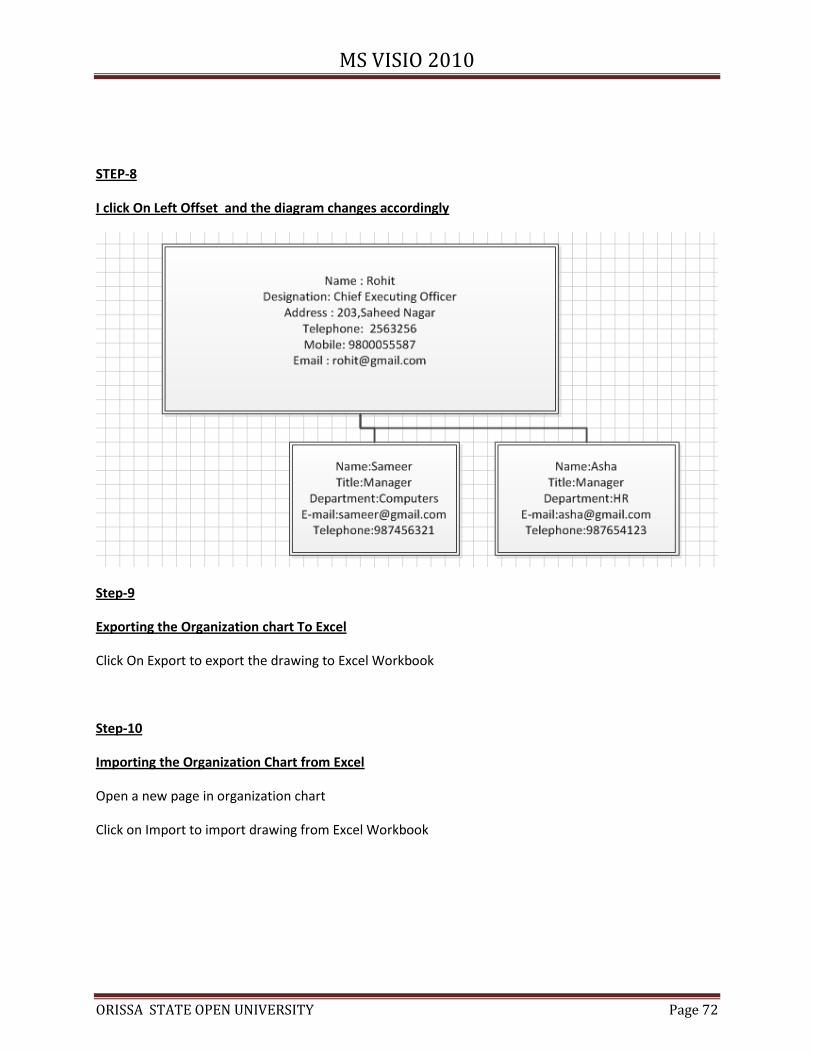
STEP-8
I click On Left Offset and the diagram changes accordingly
Step-9
Exporting the Organization chart To Excel
Click On Export to export the drawing to Excel Workbook
Step-10
Importing the Organization Chart from Excel
Open a new page in organization chart
Click on Import to import drawing from Excel Workbook
MS VISIO 2010
ORISSA STATE OPEN UNIVERSITY Page 73
4. Save As Other Formats To Save the MS VISO WORK IN ANY OTHER FORMAT USE SAVE AS AND CHOOSE THE FORMAT TO SAVE
YOUR WORK.
5.QUESTIONS 1. What is MS Visio and Why do we use it?
2. What are the components of MS Visio ?Describe.
3. What are the shapes that you have studied in MS Viso. Using Shapes describe the work flow of
an industry?
4. What is a flow chart? What are the shapes used in flowchart and what are their use?
5. Draw Flow chart to
a) Find even numbers from 1 to 50
b) Find odd numbers from 1 to 50
c) Find Prime numbers from 1 to 50
d) Find numbers divisible by 5 from 1 to 50
6. What is an organization chart and why it is used in every organization?
7. Draw and organization chart of an hospital Depicting Name , Designation, Gender, Role.
8. Can Ms Visio Be Stored in other Formats? If yes then how ?