ms swaminathan school of agriculture b
TRANSCRIPT
BS
Course C
Course Objective
Acquire a clear understanding of theory and application of Information & Community technology
in various fields and promoting the applications of ICT in Agriculture
C
Course Learning Outcome
➢ Understanding basic concept of computer.
➢ Fundamentals of MS Office.
➢ Basic concept database, Internet and WWW.
➢ Use of IT application and different IT tools in Agriculture.
MS SWAMINATHAN SCHOOL OF AGRICULTURE B.Sc
AGRICULTURAL INFORMATICS
SUBJECT CODE- [ASAI2101] 2(1+1)
AGRICULTURAL INFORMATICS
SUBJECT CODE- [ASAI2101] 2(1+1)
Lesson-1
1. Introduction to Computer
1.1 Introduction to Computer
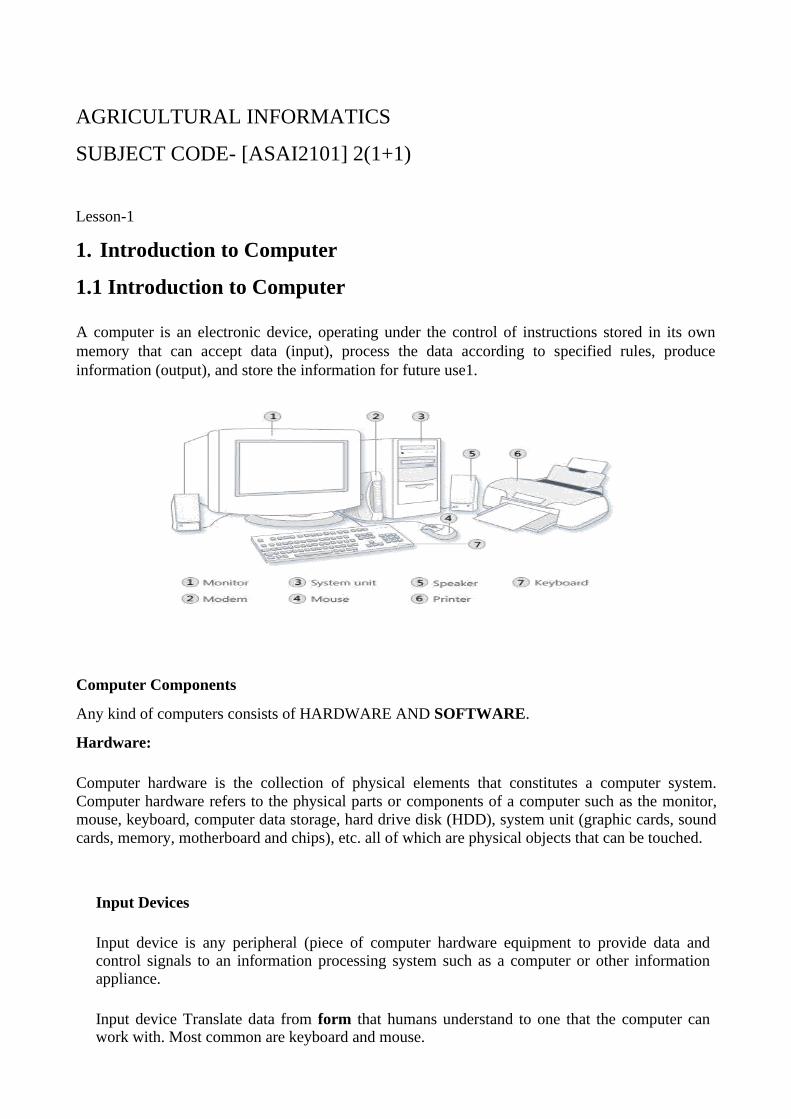
A computer is an electronic device, operating under the control of instructions stored in its own
memory that can accept data (input), process the data according to specified rules, produce
information (output), and store the information for future use1.
Computer Components
Any kind of computers consists of HARDWARE AND SOFTWARE.
Hardware:
Computer hardware is the collection of physical elements that constitutes a computer system.
Computer hardware refers to the physical parts or components of a computer such as the monitor,
mouse, keyboard, computer data storage, hard drive disk (HDD), system unit (graphic cards, sound
cards, memory, motherboard and chips), etc. all of which are physical objects that can be touched.
Input Devices
Input device is any peripheral (piece of computer hardware equipment to provide data and control signals to an information processing system such as a computer or other information appliance.
Input device Translate data from form that humans understand to one that the computer can work with. Most common are keyboard and mouse.
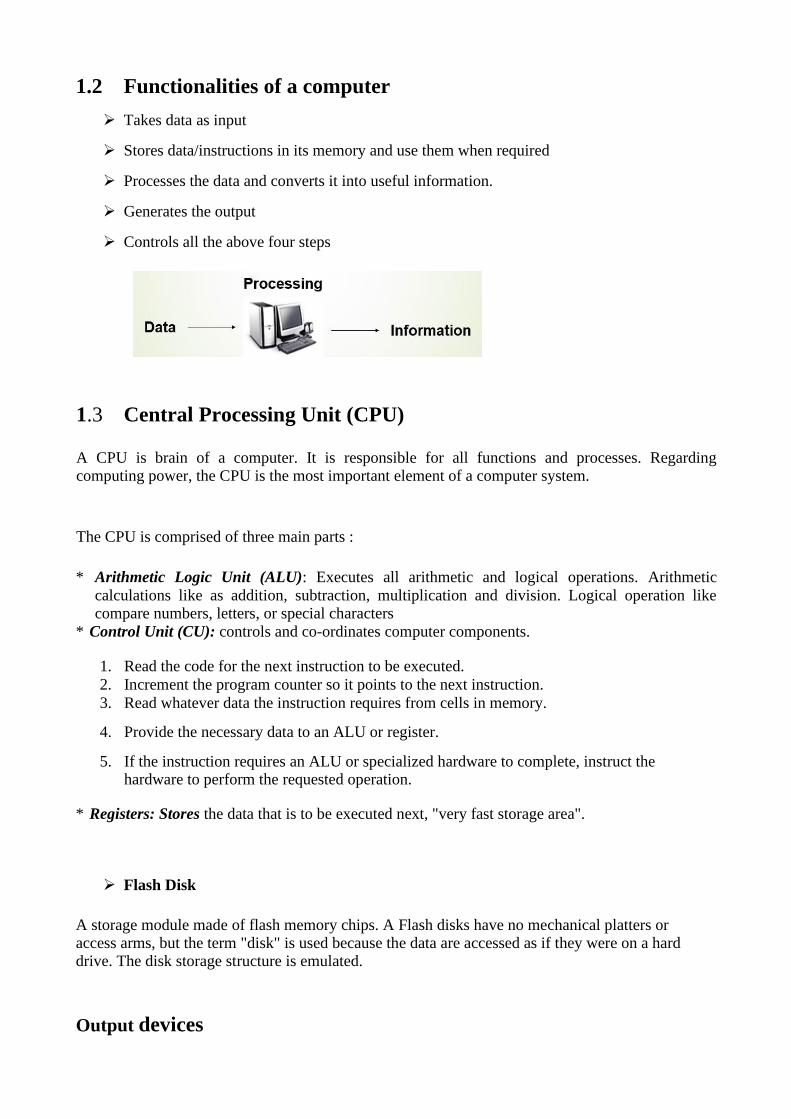
1.2 Functionalities of a computer
➢ Takes data as input
➢ Stores data/instructions in its memory and use them when required
➢ Processes the data and converts it into useful information.
➢ Generates the output
➢ Controls all the above four steps
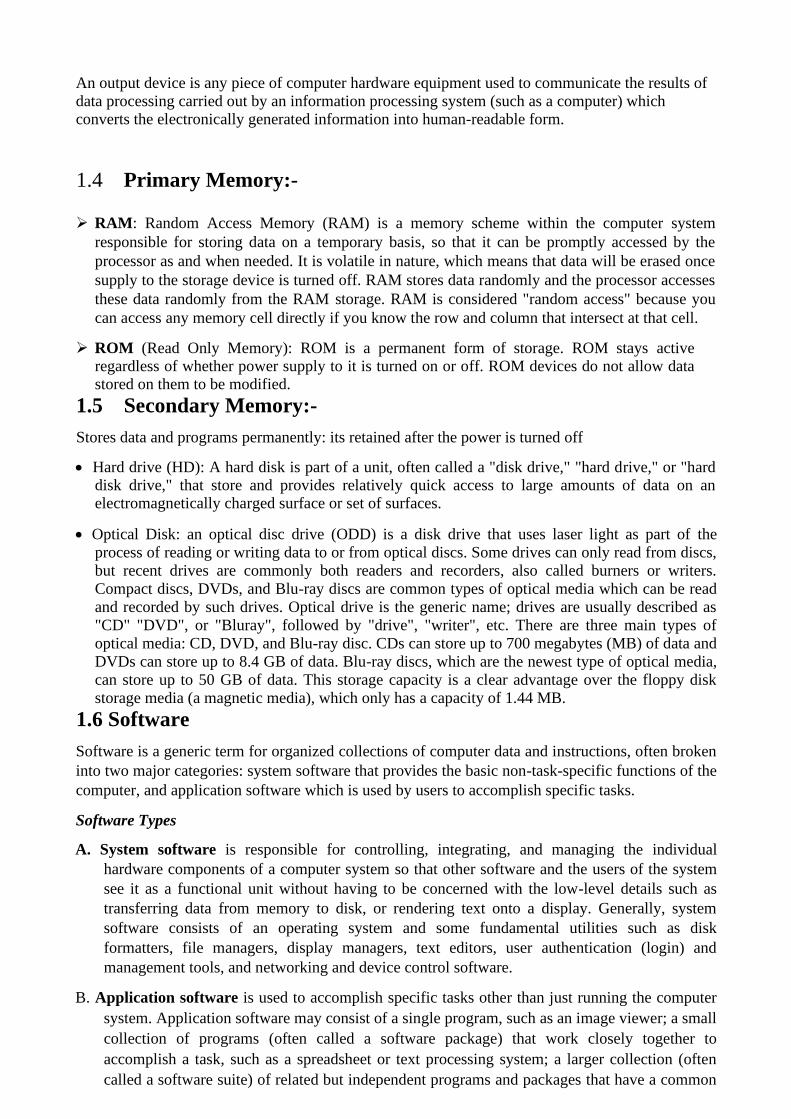
1.3 Central Processing Unit (CPU)
A CPU is brain of a computer. It is responsible for all functions and processes. Regarding computing power, the CPU is the most important element of a computer system.
The CPU is comprised of three main parts :
* Arithmetic Logic Unit (ALU): Executes all arithmetic and logical operations. Arithmetic
calculations like as addition, subtraction, multiplication and division. Logical operation like compare numbers, letters, or special characters
* Control Unit (CU): controls and co-ordinates computer components.
1. Read the code for the next instruction to be executed.
2. Increment the program counter so it points to the next instruction.
3. Read whatever data the instruction requires from cells in memory.
4. Provide the necessary data to an ALU or register.
5. If the instruction requires an ALU or specialized hardware to complete, instruct the hardware to perform the requested operation.
* Registers: Stores the data that is to be executed next, "very fast storage area".
➢ Flash Disk
A storage module made of flash memory chips. A Flash disks have no mechanical platters or access arms, but the term "disk" is used because the data are accessed as if they were on a hard drive. The disk storage structure is emulated.
Output devices
An output device is any piece of computer hardware equipment used to communicate the results of
data processing carried out by an information processing system (such as a computer) which converts the electronically generated information into human-readable form.
1.4 Primary Memory:-
➢ RAM: Random Access Memory (RAM) is a memory scheme within the computer system
responsible for storing data on a temporary basis, so that it can be promptly accessed by the
processor as and when needed. It is volatile in nature, which means that data will be erased once
supply to the storage device is turned off. RAM stores data randomly and the processor accesses
these data randomly from the RAM storage. RAM is considered "random access" because you
can access any memory cell directly if you know the row and column that intersect at that cell.
➢ ROM (Read Only Memory): ROM is a permanent form of storage. ROM stays active regardless of whether power supply to it is turned on or off. ROM devices do not allow data stored on them to be modified.
1.5 Secondary Memory:-
Stores data and programs permanently: its retained after the power is turned off
• Hard drive (HD): A hard disk is part of a unit, often called a "disk drive," "hard drive," or "hard disk drive," that store and provides relatively quick access to large amounts of data on an electromagnetically charged surface or set of surfaces.
• Optical Disk: an optical disc drive (ODD) is a disk drive that uses laser light as part of the
process of reading or writing data to or from optical discs. Some drives can only read from discs,
but recent drives are commonly both readers and recorders, also called burners or writers.
Compact discs, DVDs, and Blu-ray discs are common types of optical media which can be read
and recorded by such drives. Optical drive is the generic name; drives are usually described as
"CD" "DVD", or "Bluray", followed by "drive", "writer", etc. There are three main types of
optical media: CD, DVD, and Blu-ray disc. CDs can store up to 700 megabytes (MB) of data and
DVDs can store up to 8.4 GB of data. Blu-ray discs, which are the newest type of optical media,
can store up to 50 GB of data. This storage capacity is a clear advantage over the floppy disk
storage media (a magnetic media), which only has a capacity of 1.44 MB.
1.6 Software
Software is a generic term for organized collections of computer data and instructions, often broken
into two major categories: system software that provides the basic non-task-specific functions of the
computer, and application software which is used by users to accomplish specific tasks.
Software Types
A. System software is responsible for controlling, integrating, and managing the individual
hardware components of a computer system so that other software and the users of the system
see it as a functional unit without having to be concerned with the low-level details such as
transferring data from memory to disk, or rendering text onto a display. Generally, system
software consists of an operating system and some fundamental utilities such as disk
formatters, file managers, display managers, text editors, user authentication (login) and
management tools, and networking and device control software.
B. Application software is used to accomplish specific tasks other than just running the computer
system. Application software may consist of a single program, such as an image viewer; a small
collection of programs (often called a software package) that work closely together to
accomplish a task, such as a spreadsheet or text processing system; a larger collection (often
called a software suite) of related but independent programs and packages that have a common
user interface or shared data format, such as Microsoft Office, which consists of closely
integrated word processor, spreadsheet, database, etc.; or a software system, such as a database
management system, which is a collection of fundamental programs that may provide some
service to a variety of other independent applications.
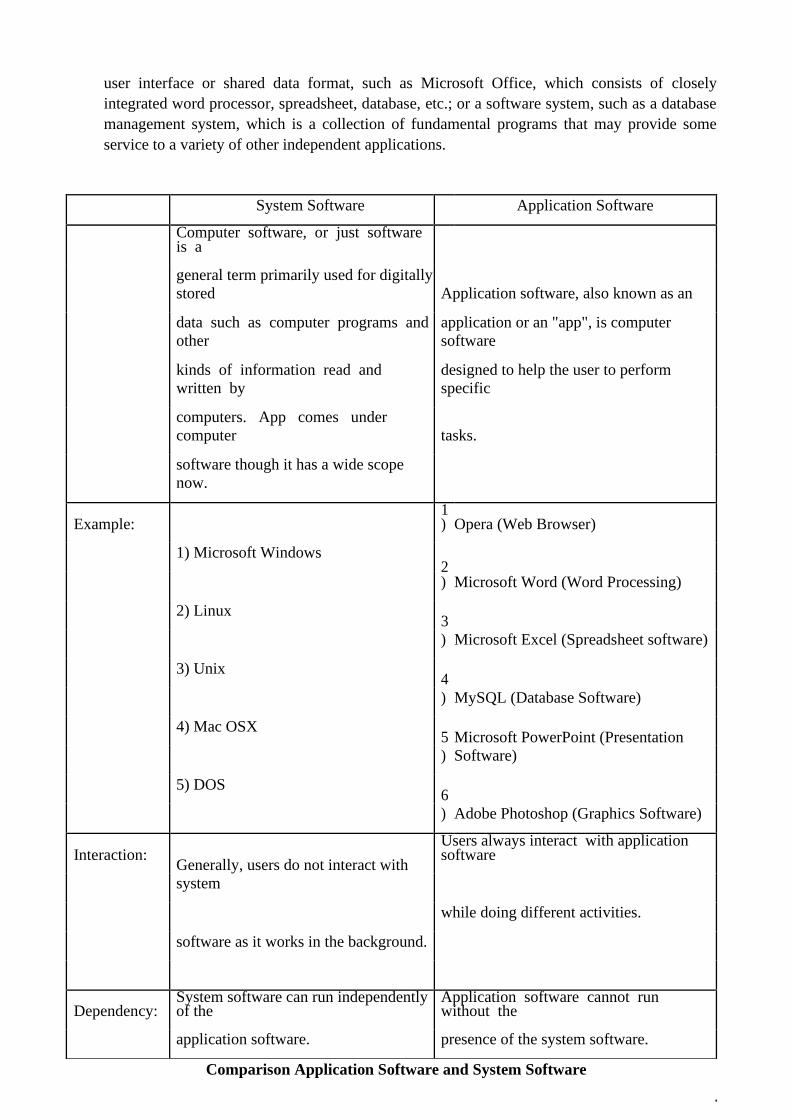
Comparison Application Software and System Software
System Software Application Software
Computer software, or just software is a
general term primarily used for digitally
stored Application software, also known as an
data such as computer programs and
other
application or an "app", is computer
software
kinds of information read and
written by
designed to help the user to perform
specific
computers. App comes under
computer tasks.
software though it has a wide scope
now.
Example:
1) Microsoft Windows
1) Opera (Web Browser)
2) Microsoft Word (Word Processing)
2) Linux 3
) Microsoft Excel (Spreadsheet software)
3) Unix 4
) MySQL (Database Software)
4) Mac OSX 5
)
Microsoft PowerPoint (Presentation
Software)
5) DOS 6
) Adobe Photoshop (Graphics Software)
Interaction: Generally, users do not interact with
system
Users always interact with application software
while doing different activities.
software as it works in the background.
Dependency: System software can run independently of the
Application software cannot run without the
application software. presence of the system software.
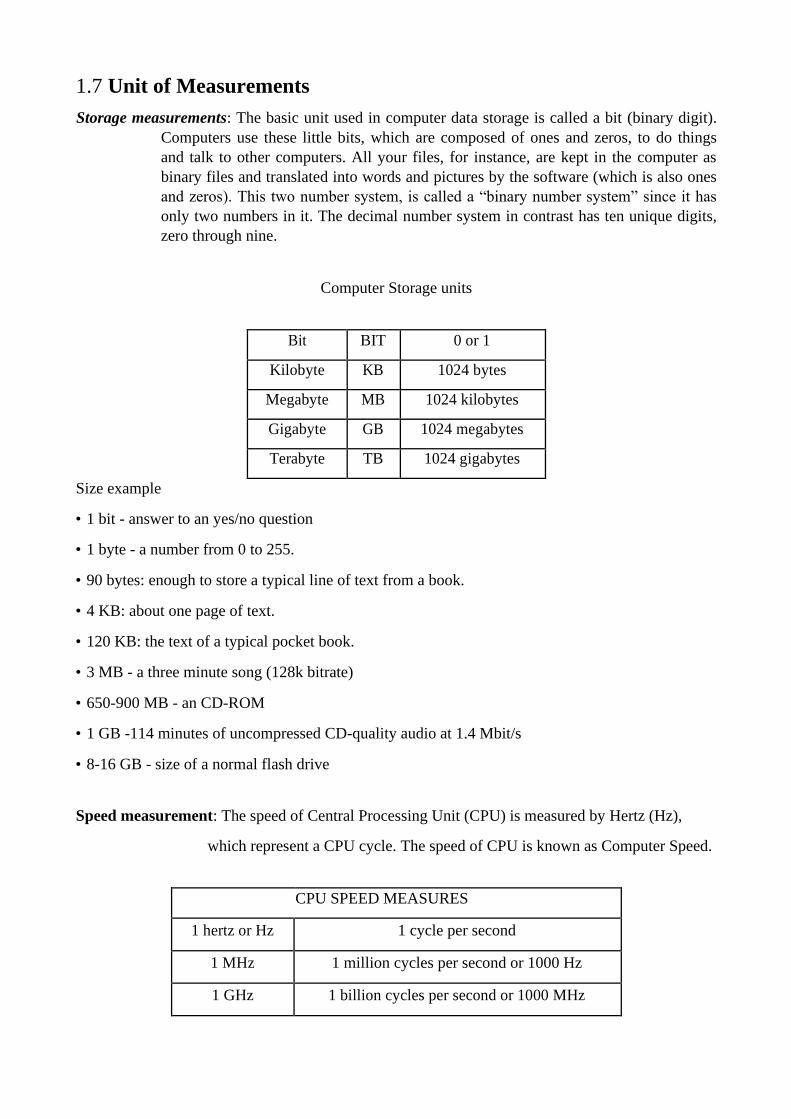
1.7 Unit of Measurements
Storage measurements: The basic unit used in computer data storage is called a bit (binary digit).
Computers use these little bits, which are composed of ones and zeros, to do things
and talk to other computers. All your files, for instance, are kept in the computer as
binary files and translated into words and pictures by the software (which is also ones
and zeros). This two number system, is called a “binary number system” since it has
only two numbers in it. The decimal number system in contrast has ten unique digits,
zero through nine.
Computer Storage units
Bit BIT 0 or 1
Kilobyte KB 1024 bytes
Megabyte MB 1024 kilobytes
Gigabyte GB 1024 megabytes
Terabyte TB 1024 gigabytes
Size example • 1 bit - answer to an yes/no question • 1 byte - a number from 0 to 255. • 90 bytes: enough to store a typical line of text from a book. • 4 KB: about one page of text. • 120 KB: the text of a typical pocket book. • 3 MB - a three minute song (128k bitrate) • 650-900 MB - an CD-ROM • 1 GB -114 minutes of uncompressed CD-quality audio at 1.4 Mbit/s • 8-16 GB - size of a normal flash drive
Speed measurement: The speed of Central Processing Unit (CPU) is measured by Hertz (Hz),
which represent a CPU cycle. The speed of CPU is known as Computer Speed.
CPU SPEED MEASURES
1 hertz or Hz 1 cycle per second
1 MHz 1 million cycles per second or 1000 Hz
1 GHz 1 billion cycles per second or 1000 MHz
Questions for Practice
➢ What do you mean by a computer?
➢ Discuss about few input and output device of a computer.
➢ What are the functionalities of a computer?
➢ Discuss about block diagram of a computer.
➢ What are the characteristics of a computer?
➢ Write difference between RAM and ROM.
➢ Define the term software and hardware.
➢ What are the units of measurement in the computer?
➢ Write the comparison between system software and application software.
➢ What is primary and secondary memory?
Lesson 2
2. Computer Classification
Computers can be generally classified by size and power as follows, though there is
Considerable overlap:
• Personal computer: A small, single-user computer based on a microprocessor. In addition to the
microprocessor, a personal computer has a keyboard for entering data, a monitor for
displaying information, and a storage device for saving data. • Workstation: A powerful, single-user computer. A workstation is like a personal computer, but it
has a more powerful microprocessor and a higher-quality monitor. • Minicomputer: A multi-user computer capable of supporting from 10 to hundreds of users
simultaneously. • Mainframe: A powerful multi-user computer capable of supporting many hundreds or thousands
of users simultaneously. • Supercomputer: An extremely fast computer that can perform hundreds of millions of instructions
per second.
2.1 Laptop and Smartphone Computers
LAPTOP: A laptop is a battery or AC-powered personal computer that can be easily carried and
used in a variety of locations. Many laptops are designed to have all of the
functionality of a desktop computer, which means they can generally run the same
software and open the same types of files. However, some laptops, such as netbooks,
sacrifice some functionality in order to be even more portable.
Netbook: A netbook is a type of laptop that is designed to be even more portable. Netbooks are
often cheaper than laptops or desktops. They are generally less powerful than other
types of computers, but they provide enough power for email and internet access, which
is where the name "netbook" comes from.
Mobile Device: A mobile device is basically any handheld computer. It is designed to be extremely
portable, often fitting in the palm of your hand or in your pocket. Some mobile devices
are more powerful, and they allow you to do many of the same things you can do with a
desktop or laptop computer. These include tablet computers, e-readers, and smartphones.
Tablet Computers: Like laptops, tablet computers are designed to be portable. However, they
provide a very different computing experience. The most obvious difference is that tablet
computers don't have keyboards or touchpads. Instead, the entire screen is touch-
sensitive, allowing you to type on a virtual keyboard and use your finger as a mouse
pointer. Tablet computers are mostly designed for consuming media, and they are
optimized for tasks like web browsing, watching videos, reading e-books, and playing
games. For many people, a "regular" computer like a desktop or laptop is still needed in
order to use some programs. However, the convenience of a tablet computer means that it
may be ideal as a second computer.
Smartphones: A smartphone is a powerful mobile phone that is designed to run a variety of
applications in addition to phone service. They are basically small tablet computers, and
they can be used for web browsing, watching videos, reading e-books, playing games and
more.
Data, Information and Knowledge
Data: Facts and figures which relay something specific, but which are not organized in any way and
which provide no further information regarding patterns, context, etc. So data means "unstructured
facts and figures that have the least impact on the typical manager."
Information: For data to become information, it must be contextualized, categorized, calculated
and condensed. Information thus paints a bigger picture; it is data with relevance and purpose. It
may convey a trend in the environment, or perhaps indicate a pattern of sales for a given period of
time. Essentially information is found "in answers to questions that begin with such words as who,
what, where, when, and how many".
Knowledge: Knowledge is closely linked to doing and implies know-how and understanding. The
knowledge possessed by each individual is a product of his experience, and encompasses the norms
by which he evaluates new inputs from his surroundings.
The content of the human mind can be classified into four categories:
1. Data: symbols
2. Information: data that are processed to be useful; provides answers to "who", "what", "where",
and "when" questions
3. Knowledge: application of data and information; answers "how" questions
4. Wisdom: evaluated understanding.
We need to understand that processing data produced Information and process Information
produces Knowledge and so on.
2.2 Characteristics of Computer
Speed, accuracy, diligence, storage capability and versatility are some of the key characteristics of a
computer. A brief overview of these characteristics is
• Speed: The computer can process data very fast, at the rate of millions of instructions per second.
Some calculations that would have taken hours and days to complete otherwise, can be
completed in a few seconds using the computer. For example, calculation and generation of
salary slips of thousands of employees of an organization, weather forecasting that requires
analysis of a large amount of data related to temperature, pressure and humidity of various
places, etc.
• Accuracy: Computer provides a high degree of accuracy. For example, the computer can
accurately give the result of division of any two numbers up to 10 decimal places.
• Diligence: When used for a longer period of time, the computer does not get tired or fatigued. It
can perform long and complex calculations with the same speed and accuracy from the
start till the end.
• Storage Capability: Large volumes of data and information can be stored in the computer and also
retrieved whenever required. A limited amount of data can be stored, temporarily, in the
primary memory. Secondary storage devices like floppy disk and compact disk can store a
large amount of data permanently.

• Versatility: Computer is versatile in nature. It can perform different types of tasks with the same
ease. At one moment you can use the computer to prepare a letter document and in the next
moment you may play music or print a document. Computers have several limitations too.
Computer can only perform tasks that it has been programmed to do.
2.3 Computer Viruses
Viruses: A virus is a small piece of software that piggybacks on real programs. For example, a
virus might attach itself to a program such as a spreadsheet program. Each time the
spreadsheet program runs, the virus runs, too, and it has the chance to reproduce (by
attaching to other programs) or wreak havoc.
•E-mail viruses: An e-mail virus travels as an attachment to e-mail messages, and usually
replicates itself by automatically mailing itself to dozens of people in the victim's e-
mail address book. Some e-mail viruses don't even require a double-click -- they
launch when you view the infected message in the preview pane of your e-mail
software [source: Johnson].
•Trojan horses: A Trojan horse is simply a computer program. The program claims to do one
thing (it may claim to be a game) but instead does damage when you run it (it may
erase your hard disk). Trojan horses have no way to replicate automatically.
•Worms: A worm is a small piece of software that uses computer networks and security holes to
replicate itself. A copy of the worm scans the network for another machine that has a
specific security hole. It copies itself to the new machine using the security hole, and
then starts replicating from there, as well.
What are some tips to avoid viruses and lessen their impact?*
• Install anti-virus software from a reputable vendor. Update it and use it regularly.
• In addition to scanning for viruses on a regular basis, install an "on access" scanner
(included in most anti-virus software packages) and configure it to start each time you start up your computer. This will protect your system by checking for viruses each time
you run an executable file.
• Use a virus scan before you open any new programs or files that may contain
executable code. This includes packaged software that you buy from the store as well as any program you might download from the Internet.
• If you are a member of an online community or chat room, be very careful about accepting files or clicking links that you find or that people send you within the community.
• Make sure you back up your data (documents, bookmark files, important email messages, etc.) on disc so that in the event of a virus infection, you do not lose valuable work.
Questions for Practice
1. Discuss about classification of computers.
2. Define the term data, information and knowledge.
3. What is computer virus and write about different types of computer virus?
4. What are the steps to follow to avoid computer virus?
5. Write different characteristics of computer.
Lesson-3
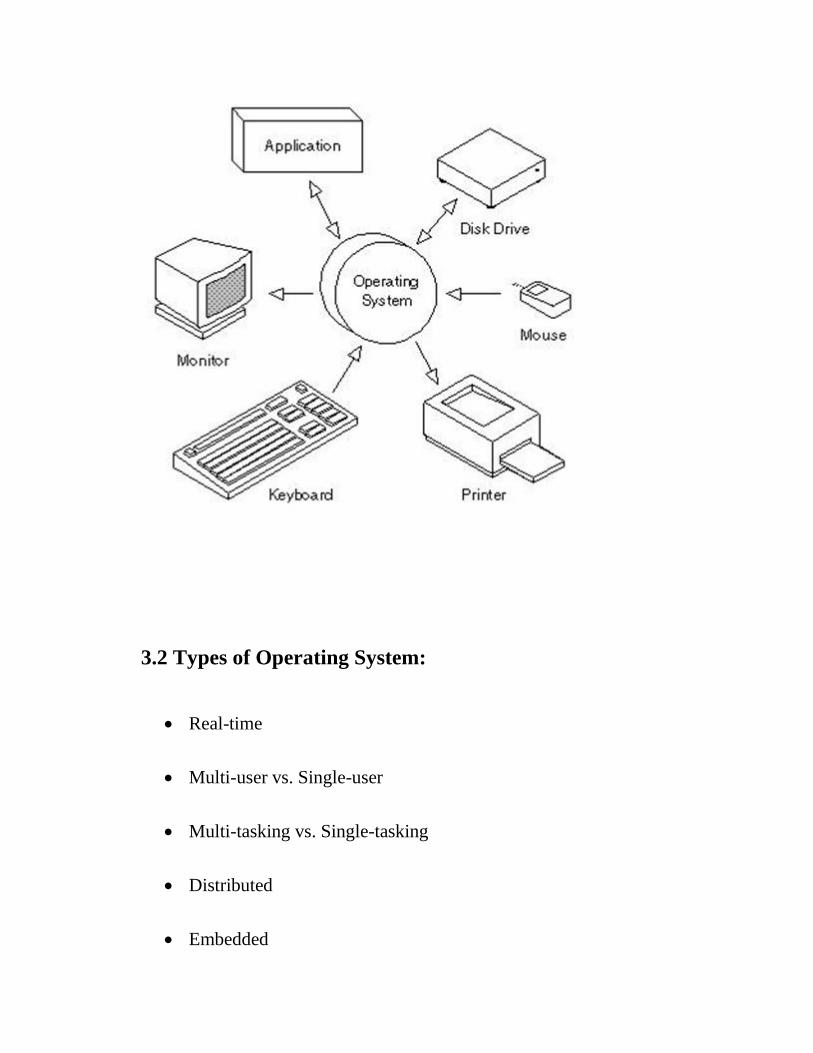
3. Operating System
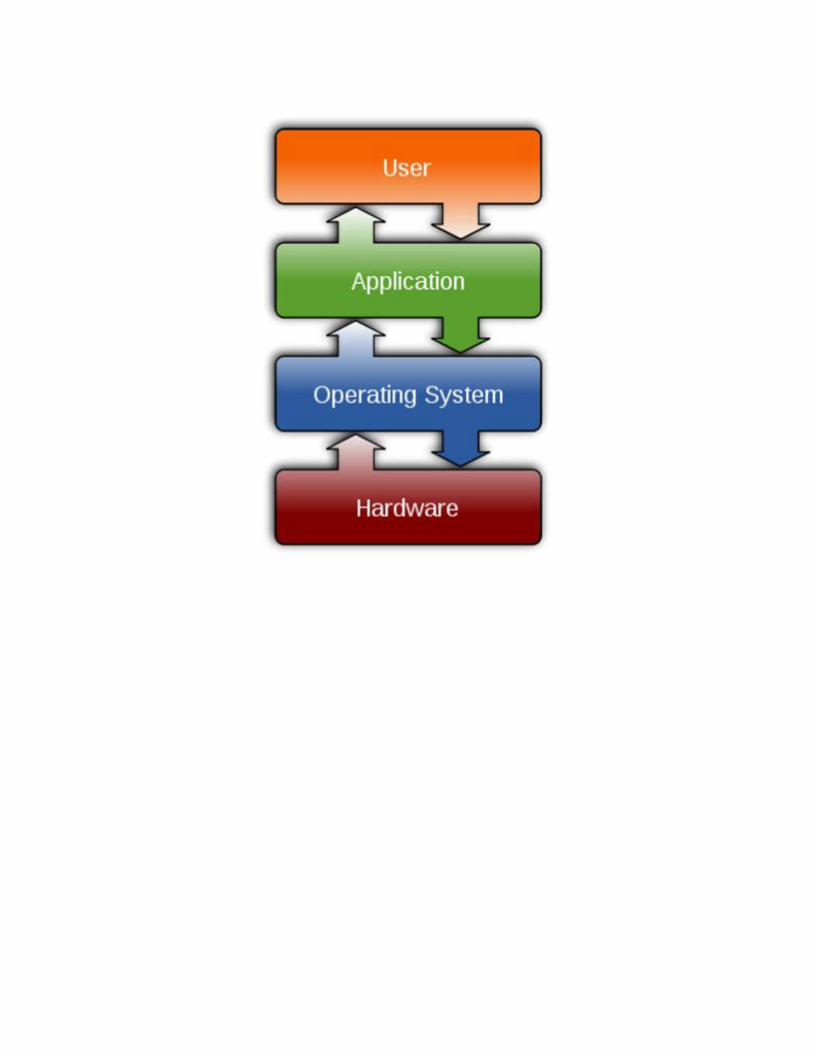
It is a control program that provides an interface between the computer hardware and the user. Part of this interface includes tools and services for the user.
3.1
• The operating system is the most important program that runs on a computer.
• Operating system is an interface between computer and user.
• It is responsible for the management and coordination of activities and the sharing of the resources of the computer.
3.2 Types of Operating System:
• Real-time
• Multi-user vs. Single-user
• Multi-tasking vs. Single-tasking
• Distributed
• Embedded
Real-Time
• A real-time operating system is a multitasking operating system that aims at executing real-time applications.
• Responds to input instantly.
Multi-user vs. Single-user
• A multi-user operating system allows multiple users to access a computer system concurrently.
• Time-sharing system can be classified as multi-user systems as they enable a multiple user access to a computer through the sharing of time.
• Single-user operating systems, as opposed to a multi-user operating system, are usable by a single user at a time
Multi-tasking vs. Single-tasking
• When a single program is allowed to run at a time, the system is grouped under a single-tasking system
• While in case the operating system allows the execution of multiple tasks at one time, it is classified as a multi-tasking operating system.
Distributed
• A distributed operating system manages a group of independent computers and makes them appear to be a single computer.
• The development of networked computers that could be linked and communicate with each other, gave rise to distributed computing.
Embedded
• Embedded operating systems are designed to be used in embedded computer systems.
• They are designed to operate on small machines like PDAs with less autonomy.
• They are able to operate with a limited number of resources.
3.3 Microsoft Word
Microsoft Word is a word processor developed by Microsoft. It was first released in 1983.
• The extension name of MS- word is .doc or .docx
• Microsoft Word is a component or product of the Microsoft Office suite.
• It allows the user to insert pictures, tables, charts, drawings & features that will make the
text richer & more interactive.
3.4 Features of MS-Word:
• WYSIWYG (what-you-see-is-what-you-get) display: It ensures that everything you see
on screen will appear the same way when printed or moved to another format or program.
• Spell check: Word comes with an built-in dictionary for spell checking; misspelled
words are marked with a red squiggly underline. Sometimes, Word auto-corrects an
obviously misspelled word or phrase.
• Text-level features such as bold, underline, italic and strike-through.
• Page-level features such as indentation, paragraphing and justification.
• Some features like cut, copy, paste, replace and find data.
• Page headers, footers, numbers and watermarking. Insertion of pictures tables and
shapes
The default Word document includes the following layout tools:
• Title bar: displays the document name and the application.
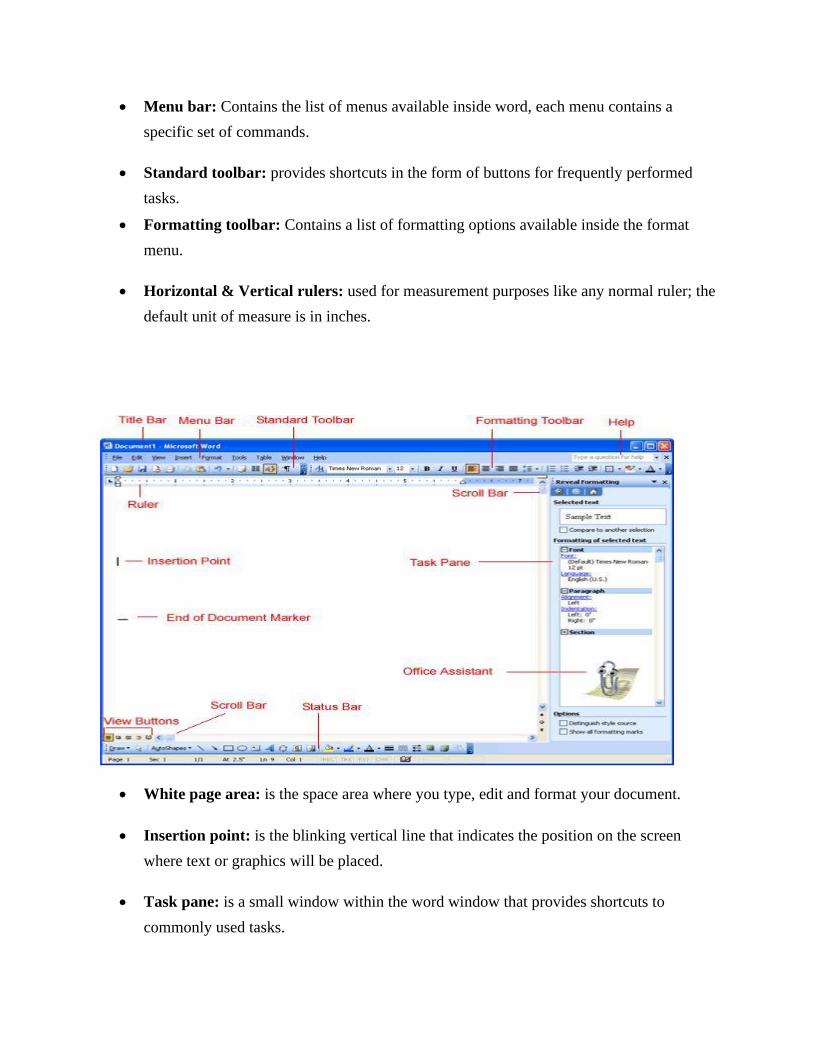
• Menu bar: Contains the list of menus available inside word, each menu contains a
specific set of commands.
• Standard toolbar: provides shortcuts in the form of buttons for frequently performed
tasks.
• Formatting toolbar: Contains a list of formatting options available inside the format
menu.
• Horizontal & Vertical rulers: used for measurement purposes like any normal ruler; the
default unit of measure is in inches.
• White page area: is the space area where you type, edit and format your document.
• Insertion point: is the blinking vertical line that indicates the position on the screen
where text or graphics will be placed.
• Task pane: is a small window within the word window that provides shortcuts to
commonly used tasks.

• Scroll bars: are used to move up and down or left and right in a document.
• Status bar: displays the details such as the page number the user is working on, section
no., page no. out of the total pages found in the document, line number, column number
etc
3.4.1 Features of EDIT MENU (ALT E)
1. Undo - Will take the previous command (ctrl +Z)
2. Redo - Will take the opposite action of undo ( Ctrl + Y)
3. Cut - Can cut a selected text ( Ctrl + X)
4. Copy - Can copy a selected text ( Ctrl + C)
5. Paste - Can paste the selected text ( Ctrl + V)
6. Del - Removes the selected text
7. Find - Used to find the part of text word \ character in the file (Ctrl + F)
8. Find Next – (F3) Finding \ finding next : Used to repeat the finding process.
9. Replace - Used to replace any part of Text / word / Character with another word/ character.
(Ctrl + H)
10. Paste special – This will paste the copied (or) cut text in a form of an object. It will paste in
box which cannot be altered.
11. Go To - Curser goes to the specified page, specified line, specified paragraph.(Ctrl + G)
MS WORD - Editing Text:
Typing and Inserting Text:
To enter text in your document, position the insertion point i.e a vertical blinking line,
where you want the text to appear and type it in. Word will automatically wrap text as it reaches
the end of a line. Press enter to start anew paragraph. When you reach the end of a page, word
will automatically break text onto the next page. If you want, you can start a new page at any
point by inserting a page break. To do so, press ctrl + Enter.
Word offers two modes for adding text to your documents: Insert mode and overwrite mode. In
Insert mode, characters typed are inserted into the text to the left of the insertion point, pushing
any characters to the right of the insertion point further to the right. In overtype mode, the text
you type will replace the existing text.
Note: The Insert key is a toggle key. This means that the same key can be used to switch back
and forth between two different modes.
Selecting Text:
In order to change the format of the text you just typed, it must be first highlighted, i.e. selected
with the mouse cursor. To highlight the whole text or part of it, locate the mouse at the start of
the text you wish to highlight and click the left button, then drag the mouse over the desired text
while keeping the left mouse button pressed. Shortcuts used for selecting a portion of the text:
• Whole word: Double click within the word.
• Whole paragraph: Triple click within the paragraph.
• Sentence: ctrl + click in a sentence
• Entire document: Edit →
select all (ctrl + A)
Deleting text:
• Use the BACKSPACE or the DELETE key to delete text.
• BACKSPACE key will delete text to the left of the cursor and DELETE key will erase
text to the right.
• To delete a large section of text, highlight the text using any of the methods outlined
above and press the DELETE key.
Moving, copying and pasting text:
Cut text:
Highlight the text you need to move and follow one of the methods listed below:
• From the Menu bar, select Edit →
cut (or)
• From the standard tool bar, click on the cut button. (or)
• Follow the key sequence Ctrl + X
Copy text:
• From the Menu bar, select Edit →
copy (or)
• From the standard toolbar, click the Copy button (or)
• Follow the key sequence Ctrl + C
Paste Text:
To paste previously cut or copied text, move the cursor to the location you want to move the text
to and follow one of the methods listed below:
• From the menu bar, select Edit →
Paste (or)
• From the standard Tool bar, click the Paste button (or)
• Follow the key sequence Ctrl + V
Spell Check
Using the "Spell Check" Feature As you type your document, red wavy lines will appear under
any word that is spelled incorrectly. The fastest way to fix spelling errors is to:
1. Put your cursor over the misspelled word and right click.
2. A drop down box will appear with correct spellings of the word.
3. Highlight and left click the word you want to replace the incorrect word with.
To complete a more comprehensive Spelling and Grammar check, you can use the Spelling and
Grammar feature.
1. Click on the Review tab
2. Click on the Spelling & Grammar command (a blue check mark with ABC above it).
3. A Spelling and Grammar box will appear.
4. You can correct any Spelling or Grammar issue within the box.
3.5 MS –EXCEL
• Spreadsheet is software presents data in the form of rows and columns.
“Microsoft Excel is a spreadsheet program included in the Microsoft Office
suite of applications.‖
• It includes all features like calculation, graphs, and functions, hold graphic objects
like pictures, images & analyzing data.
• The extension name of MS- Excel is .xls or .xslx
3.6 Features of MS-Excel:
Window based application: Excel like all other applications has Toolbars, Shortcut Menus,
Auto correct, online help and Wizards.
Workbooks: Workbooks are the files in which worksheets related to a project are held.
OLE support: Object linking and Embedding is a feature through which Excel can contain any
object like a document, a picture etc.
Maintaining high volume of data: Excel can contain large volume of data. A worksheet can
contain 65536 rows and 256 columns. A single cell can contain a maximum of 255 characters.
One workbook can contain a maximum of 256 worksheets.
Availability of functions: Several Mathematical, financial & statistical functions are available
in an Excel package.
Availability of Charts & Graphs: MS-Excel allows users to view data entered as tables in a
graphical form as charts, which helps the user to easily understand, analyze data & compare data.
Data Analysis Tools: MS-Excel provides a set of data analysis tools called Analysis Tool pack.
Sorting and filtering capability: Excel has the capability of sorting any data in Ascending
or Descending order.
Auto fill feature: Excel has the feature which allows to fill cells with repetitive data such as
chronological dates or numbers and repeated text.
Hyperlink:-We can link one file to another file or page with the use of Excel.
Clip art:- In this we can add images and also audio, video clips can be added here.
Images and Backgrounds:- In this we add images and backgrounds in sheet.
Database:- We can add database from other sources with data feature.
Data Validations:- In data tools there are data validations consolidate etc are used.
Page layout:- In this themes, colors, sheets, margins, size, backgrounds, breaks, print, titles,
sheets height, width, scaling, headings, views, bring to front of font or back alignment etc will be
used.
Functions:
➢ A function is a built-in, readymade and frequently used formula that accepts data, perform calculations& returns results.
➢ To enter a function in a cell,
i) Click the cell in which you want the result of the function to be displayed.
ii) Type = sign.
iii) Type the function name.
iv) Type the cell range & other arguments within brackets.
v) Press Enter.
Note: To specify a range of cells, a colon (:) is used between the first & last cell
addresses.
Example1: =Average (B1: B10)
Calculates the average of the values in the cells B1 to B10
Example2: =Average (B1,B3,B5,B7,B9)
Calculates the average of the values in the odd cells in between B1 to B10
Some Mathematical functions with syntax and purpose:
i) Sum( cell1, cell2,…) - gives the sum of the specific cells
sum( cellname : cellname) – gives the sum of the values in a specified range
ii) Abs( number) - gives the absolute value of the number
iii) Fact( number) - gives the factorial of the number
iv) Sqrt(number) - gives the square root of the number
v) Log(number) - gives the logarithm of the number
Some Statistical functions with syntax and purpose:
i) Average( range of cells) - calculates the average of the values in a specified range
ii) Stdev(range of cells) - calculates the standard deviation of the given data
iii) Mean( range of cells) - calculates the mean of the given data
iv) Max( range of cells) - gives the maximum value within the range specified
v) count( ) - counts how many numbers are there in the list of arguments
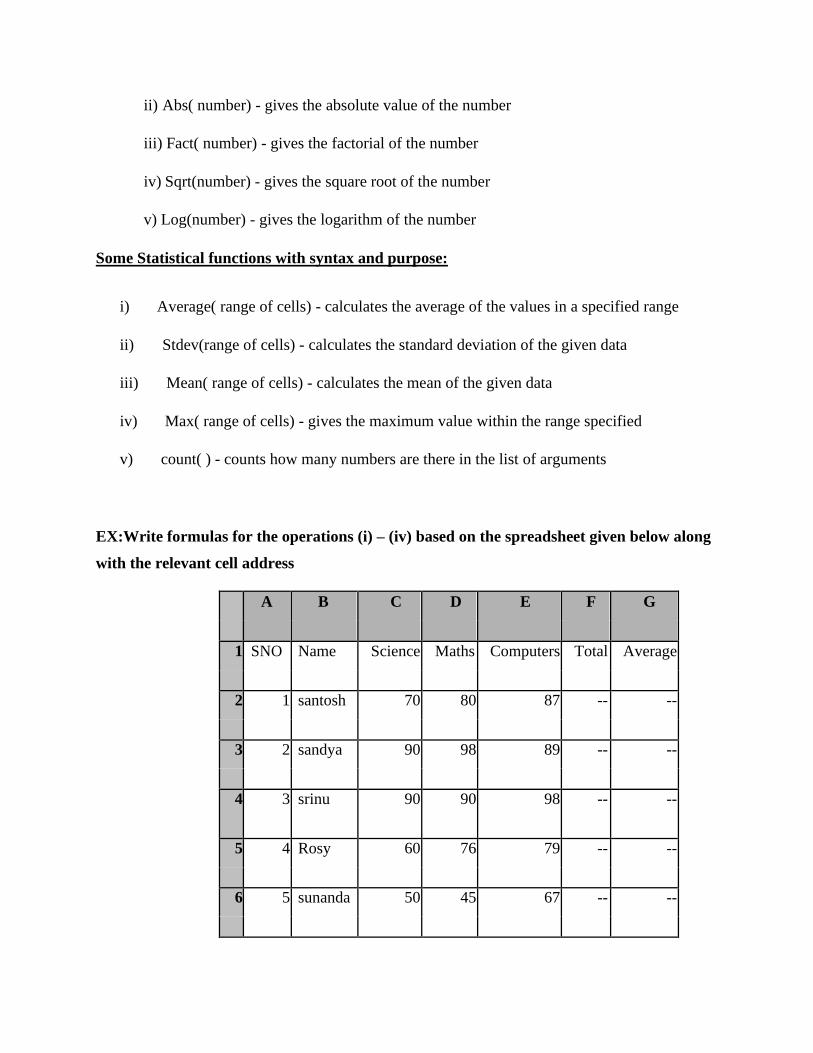
EX:Write formulas for the operations (i) – (iv) based on the spreadsheet given below along
with the relevant cell address
A B C D E F G
1 SNO Name Science Maths Computers Total Average
2 1 santosh 70 80 87 -- --
3 2 sandya 90 98 89 -- --
4 3 srinu 90 90 98 -- --
5 4 Rosy 60 76 79 -- --
6 5 sunanda 50 45 67 -- --
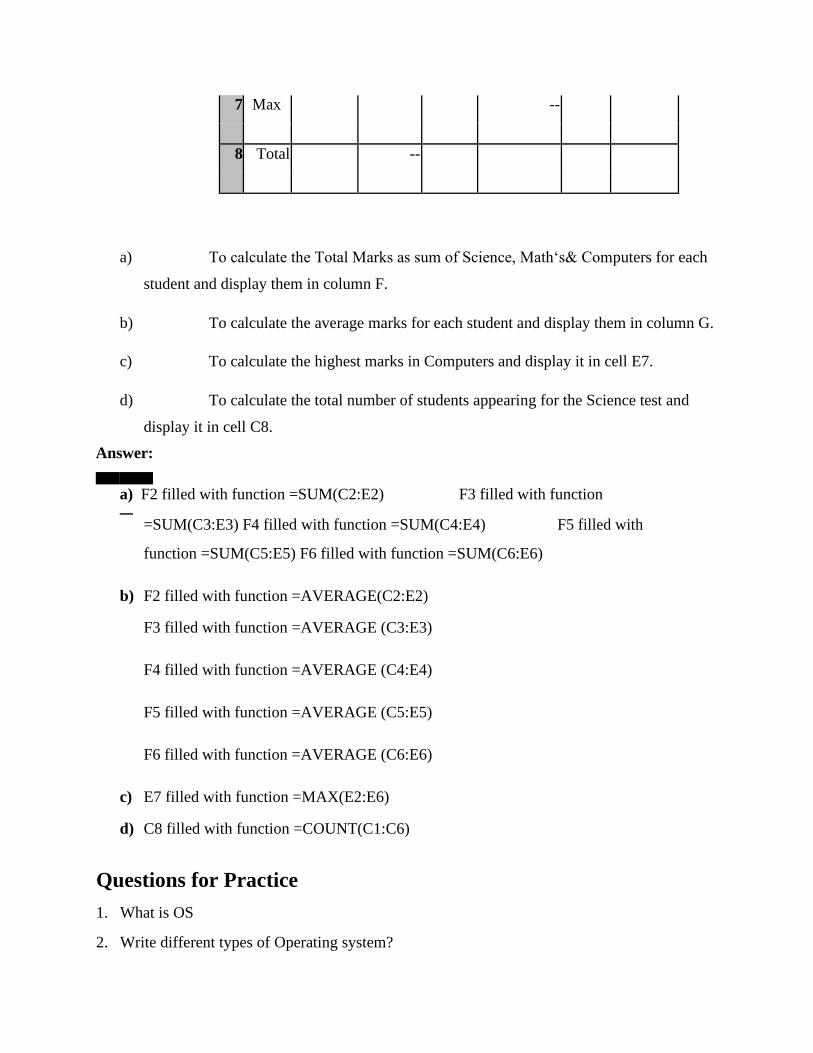
7 Max --
8 Total --
a) To calculate the Total Marks as sum of Science, Math‘s& Computers for each
student and display them in column F.
b) To calculate the average marks for each student and display them in column G.
c) To calculate the highest marks in Computers and display it in cell E7.
d) To calculate the total number of students appearing for the Science test and
display it in cell C8.
Answer:
a) F2 filled with function =SUM(C2:E2) F3 filled with function
=SUM(C3:E3) F4 filled with function =SUM(C4:E4) F5 filled with
function =SUM(C5:E5) F6 filled with function =SUM(C6:E6)
b) F2 filled with function =AVERAGE(C2:E2)
F3 filled with function =AVERAGE (C3:E3)
F4 filled with function =AVERAGE (C4:E4)
F5 filled with function =AVERAGE (C5:E5)
F6 filled with function =AVERAGE (C6:E6)
c) E7 filled with function =MAX(E2:E6)
d) C8 filled with function =COUNT(C1:C6)
Questions for Practice
1. What is OS
2. Write different types of Operating system?
3. Write function of operating system.
4. What is MS-Word?
5. What are the features of MS-Word?
6. What are the features of edit menu in word?
7. What is MS-Excel?
8. What are the features of MS-Excel?
9. Write different functions of MS-Excel?
10. Write some mathematical functions with syntax in excel.
11. Write some statistical functions with syntax in excel.
Lesson – 4
4. Microsoft PowerPoint
Microsoft PowerPoint is a presentation program developed by Microsoft. The extension name
of MS- PowerPoint is .ppt
• Microsoft PowerPoint is a component or product of the Microsoft Office suite.
• The presentations are collection of slides, which may contain text, images, and other
media, such as audio clips and movies. Sound effects and animated transitions can also
be included to add extra appeal to the presentation.
• It is used to create business presentations, but can also be used for educational or
informal purposes.
• PowerPoint presentations are often displayed using a projector.
Features of MS PowerPoint:
• Easy to create colorful, attractive designs using the standard templates and themes.
• Easy to modify compared to other visual, such as charts, and easy to drag and drop slides
to re-order presentation.
easy to present and maintain eye contact with a large audience
Design
The design features of PowerPoint allow you to customize the appearance and format of
the slides.
Animation
PowerPoint animation is divided between slide transitions and element animation. Using
slide transition adds an effect when switching slides during a slide show. You can edit the
transition effect and timing, as well as opt for an on-click or automatic transition between slides.
Element animation adds movement and sounds to the objects within the slide. For example, if
you're constructing a photo gallery as a slide show, you can choose which pictures enter the slide
first, how they enter and add a sound as they enter.
Presentation
The presentation function of PowerPoint is largely designed to accommodate public
speaking. PowerPoint comes with a built-in notes function; when printing out presentation slides,
you can add presenter notes beside each slide as accompanying content. This is useful to clarify
points in the slide without sacrificing the slide's readability. As of the 2007 version of
PowerPoint, you can pre-record narration for a presentation. PowerPoint also has a
rehearsal function as well, allowing you or your team to practice your timing and monitor the
length of your presentation.
Integration
PowerPoint is compatible with all other software in the Microsoft Office suite; you can
export slides into Word documents or use Excel charts within your presentation. In addition to
image and audio support, PowerPoint 2007 also has video-integration functionality; you can
embed videos within a presentation for easy playback without exiting the program. You can also
export presentation files to an online interface for multi-user remote editing and presentation
practice.
Disadvantages:
• Some features such as animations and backgrounds can distract the audience from the
actual information.
• Wastage of time to prepare the presentation.
• Basic equipment required to present. You will need to have a computer and projection
equipment in place to display the slides to the audience
4.1 Data presentation, tabulation and graph creation
Creating Charts:
Charts in Excel are used to represent data pictorially. We can use different types of
charts to represent data.
Types of charts which are available in Excel:
1. Column charts
2. Bar charts
3. Line
4. Pie
5. XY (scatter)
6. Area
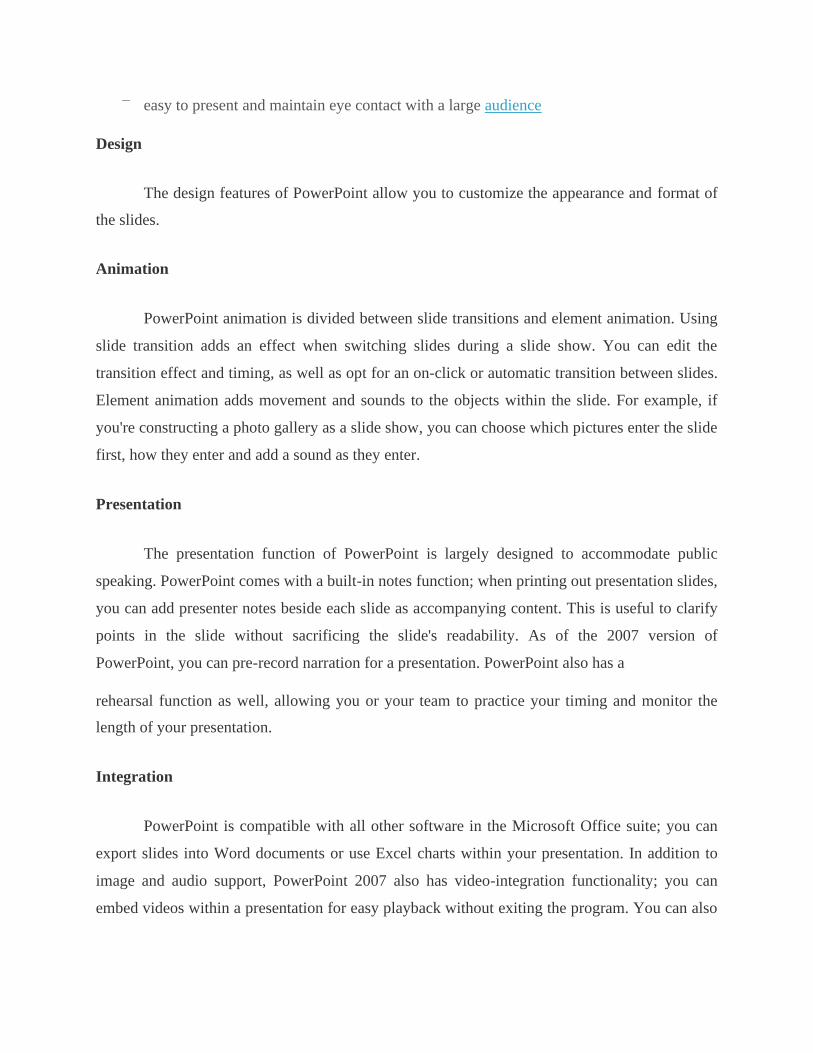
4.1.1 Pie chart:
➢ It is a graphic representation of numerical information by a circle divided into sectors‖.
Sectors are proportional to the frequencies or percentages of cases under various
categories. ➢ A Pie Chart can only display one series of data.
➢ None of the values that you want to plot are negative.
➢ Almost none of the values that you want to plot are zero values.
For example, to draw a pie chart for the production of different crops in a region:
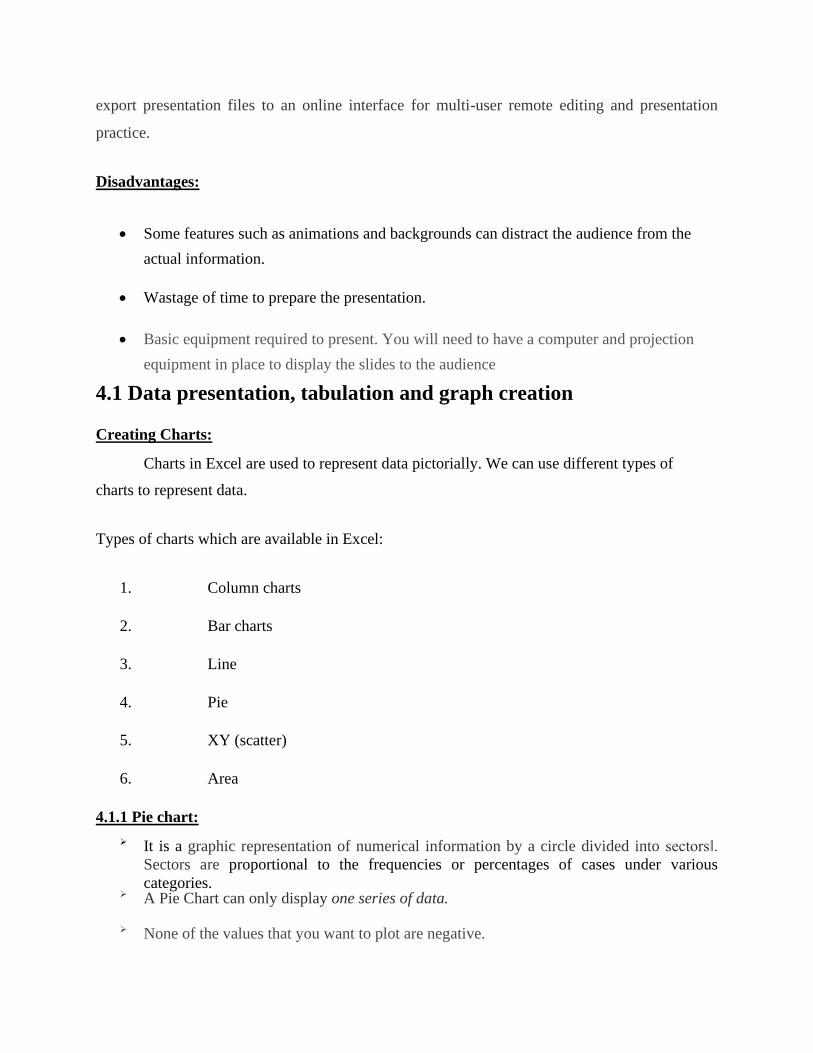
4.1.2 Column chart:
➢ It is a graphic representation of numerical information, in which the data are represented by symbols such as vertical bars.
➢ It is used to show comparisons between items of data. Each column in the chart represents the value of one item of data.
➢ It can display one or more series of data.
For the Above table column chart is
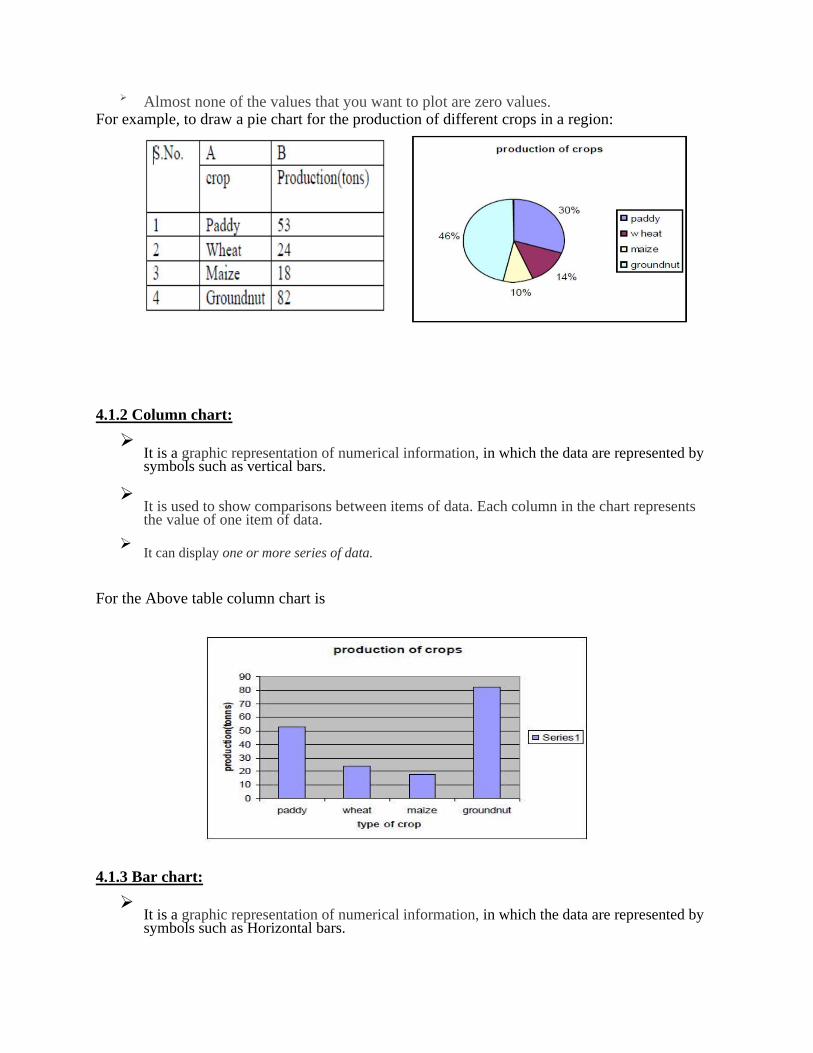
4.1.3 Bar chart:
➢ It is a graphic representation of numerical information, in which the data are represented by symbols such as Horizontal bars.
➢ It is used to show comparisons between items of data. Each Horizontal bar in the chart represents the value of one item of data.
➢ It can display one or more series of data.
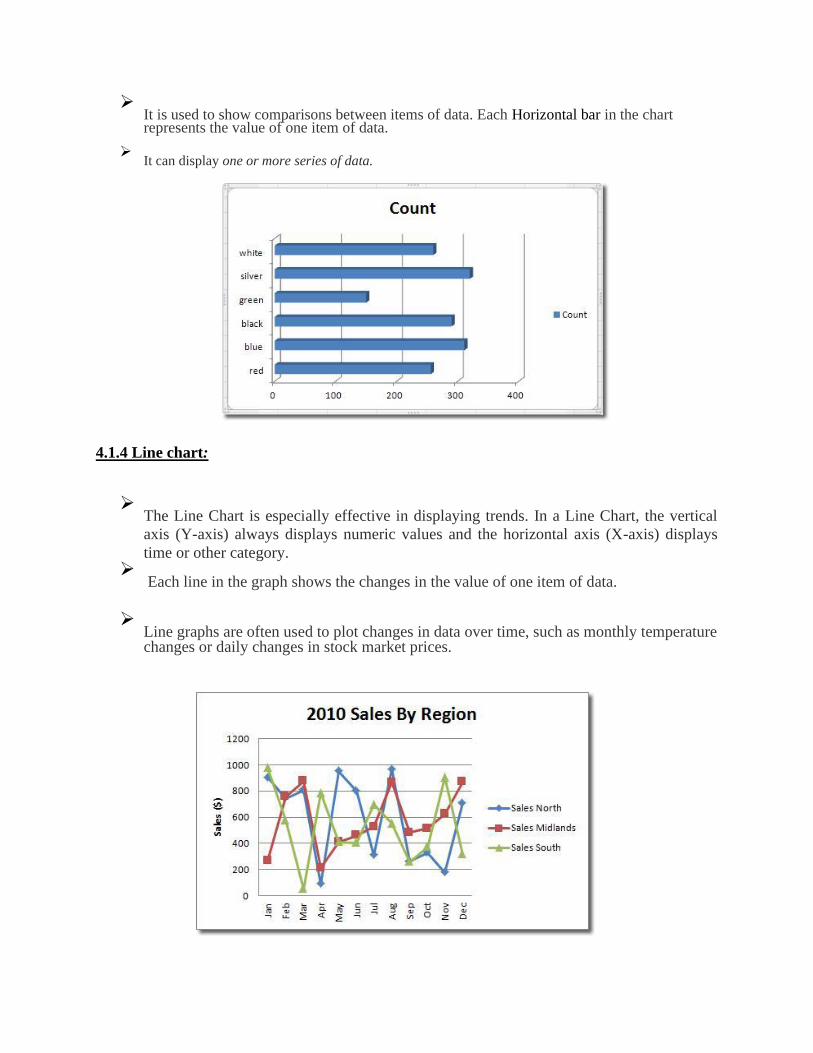
4.1.4 Line chart:
➢ The Line Chart is especially effective in displaying trends. In a Line Chart, the vertical
axis (Y-axis) always displays numeric values and the horizontal axis (X-axis) displays
time or other category.
➢ Each line in the graph shows the changes in the value of one item of data.
➢ Line graphs are often used to plot changes in data over time, such as monthly temperature changes or daily changes in stock market prices.
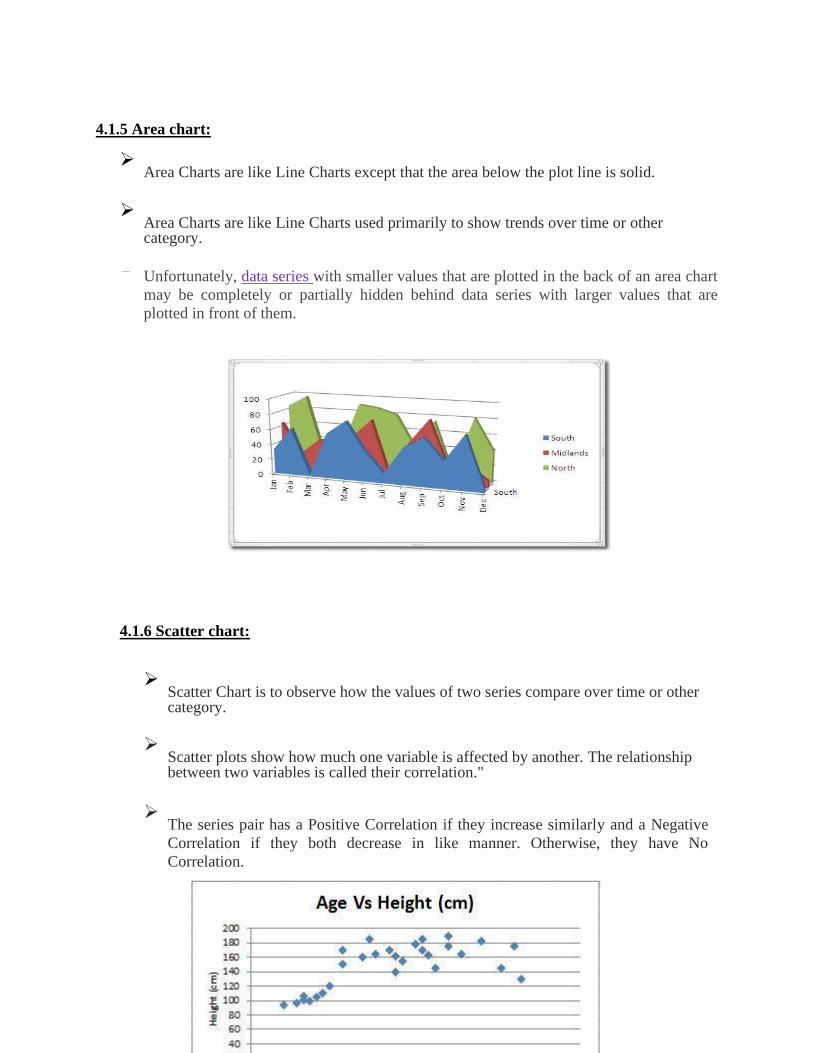
4.1.5 Area chart:
➢ Area Charts are like Line Charts except that the area below the plot line is solid.
➢ Area Charts are like Line Charts used primarily to show trends over time or other category.
Unfortunately, data series with smaller values that are plotted in the back of an area chart
may be completely or partially hidden behind data series with larger values that are
plotted in front of them.
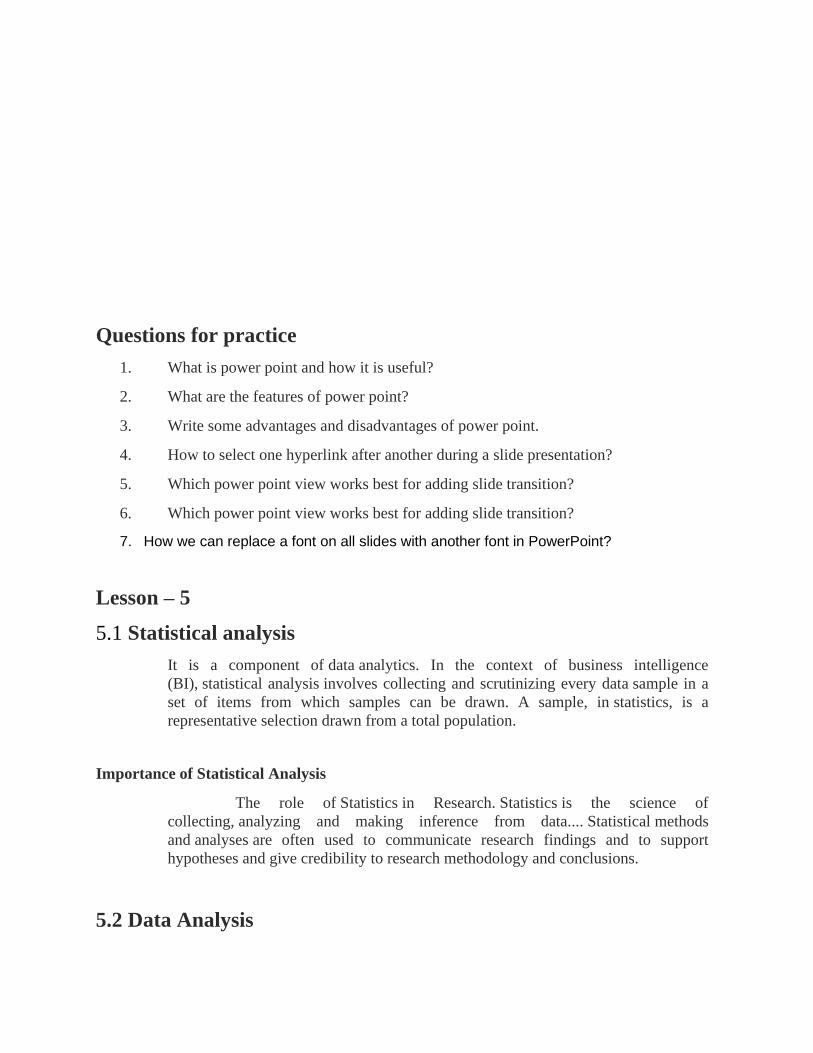
4.1.6 Scatter chart:
➢ Scatter Chart is to observe how the values of two series compare over time or other category.
➢ Scatter plots show how much one variable is affected by another. The relationship between two variables is called their correlation."
➢ The series pair has a Positive Correlation if they increase similarly and a Negative
Correlation if they both decrease in like manner. Otherwise, they have No
Correlation.
Questions for practice
1. What is power point and how it is useful?
2. What are the features of power point?
3. Write some advantages and disadvantages of power point.
4. How to select one hyperlink after another during a slide presentation?
5. Which power point view works best for adding slide transition?
6. Which power point view works best for adding slide transition?
7. How we can replace a font on all slides with another font in PowerPoint?
Lesson – 5
5.1 Statistical analysis
It is a component of data analytics. In the context of business intelligence
(BI), statistical analysis involves collecting and scrutinizing every data sample in a
set of items from which samples can be drawn. A sample, in statistics, is a
representative selection drawn from a total population.
Importance of Statistical Analysis
The role of Statistics in Research. Statistics is the science of
collecting, analyzing and making inference from data.... Statistical methods
and analyses are often used to communicate research findings and to support
hypotheses and give credibility to research methodology and conclusions.
5.2 Data Analysis
It is the process of systematically applying statistical and/or logical
techniques to describe and illustrate, condense and recap, and evaluate data. An
essential component of ensuring data integrity is the accurate and appropriate
analysis of research findings.
5.3 Classification of Data
It is an ordered set of related categories used to group data according to
its similarities. It consists of codes and descriptors and allows survey responses to
be put into meaningful categories in order to produce useful data. A classification is
a useful tool for anyone developing statistical surveys.
5.4 Mathematical Expression?
Mathematics is made up of symbols that can be combined to make
statements about the world around us. Sometimes those symbols represent numbers
and sometimes they are more abstract, representing spaces, symmetries or groups.
Mathematical expressions are formed when these symbols are combined with
mathematical operations such as addition, subtraction, or multiplication to name just
a few.
5.4.1 How to write Mathematical equation on MS Word
1. Select the Insert tab on the ribbon. ...
2. Find the Equation button on the far right. ...
3. Click the icon to insert an equation. ...
4. Insert special formatting. ...
5. Continue typing to complete the equation. ...
6. Move the equation on the page. ...
7. Write equations by hand
5.5 Computer Programming
A computer is a programmable machine. This means it can execute a programmed list of
instructions and respond to new instructions that it is given. Computer Programming is the
process of developing and implementing various sets of instructions to enable a computer to do a
certain task. Programs are written to solve problems or perform tasks on a computer.
Programmers translate the solutions or tasks into a language the computer can understand. As
we write programs, we must keep in mind that the computer will only do what we instruct it to
do. Because of this, we must be very careful and thorough with our instructions.
5.6 Compiler
A compiler is a special program that processes statements written in a particular programming
language and turns them into machine language or "code" that a computer's processor uses.
After you write a program, your source language statements are compiled into machine code that
is stored as an executable file.
Questions for practice
1. What is statistical analysis?
2. Write the importance of statistical analysis.
3. What do you mean by data analysis?
4. What do you mean by classification of data?
5. What is computer programming?
6. What is compiler?
Lesson – 6
6. Introduction to Computer Languages
6.1 Introduction to Visual Basic
Visual Basic is a third-generation event-driven programming language first released by
Microsoft in 1991. It evolved from the earlier DOS version called
BASIC. BASIC means Beginners' All-purpose Symbolic Instruction Code. Since then Microsoft
has released many versions of Visual Basic, from Visual Basic 1.0 to the final version Visual
Basic 6.0. Visual Basic is a user-friendly programming language designed for beginners, and it
enables anyone to develop GUI window applications easily.
In 2002, Microsoft released Visual Basic.NET(VB.NET) to replace Visual Basic 6. Thereafter,
Microsoft declared VB6 a legacy programming language in 2008. Fortunately, Microsoft still
provides some form of support for VB6. VB.NET is a fully object-oriented programming
language implemented in the .NET Framework. It was created to cater for the development of
the web as well as mobile applications. However, many developers still favor Visual Basic 6.0
over its successor Visual Basic.NET.
Programs can you create with Visual Basic
In VB 6, you can create any program depending on your objective. For math teachers, you can
create mathematical programs such as Geometric Progression, Quadratic Equation
Solver, Simultaneous Equation Solver ,Prime Number Tester, Factors Finder, Quadratic
Function Graph Plotter and so on. For science teachers, you can create simulation programs such
as Projectile, Simple Harmonic Motion, Star War etc. If you are in business, you can also
create business applications such as inventory management system , Amortization
Calculator , investments calculator, point-of-sale system, payroll system, accounting program
and more to help manage your business and increase productivity. For those of you who like
games , you can create programs such as slot machine, reversi, tic tac toe and more. Besides, you
can create multimedia programs such as Smart Audio Player, Multimedia Player and more.
Indeed, there is no limit to what program you can create ! We offer many sample codes in our
tutorial.
6.2 Java
JAVA was developed by Sun Microsystems Inc in 1991, later acquired by Oracle Corporation. It
was developed by James Gosling and Patrick Naughton. It is a simple programming language.
Writing, compiling and debugging a program is easy in java. It helps to create modular
programs and reusable code.
6.2.1 Main Features of JAVA
Java is a platform independent language
Compiler(javac) converts source code (.java file) to the byte code(.class file). As mentioned
above, JVM executes the bytecode produced by compiler. This byte code can run on any
platform such as Windows, Linux, Mac OS etc. Which means a program that is compiled on
windows can run on Linux and vice-versa. Each operating system has different JVM, however
the output they produce after execution of bytecode is same across all operating systems. That is
why we call java as platform independent language.
6.3 Fortran
Fortran77 programs are typed in lines of up to 72 characters, with the first six columns of each
line reserved for special purposes. As a result, Fortran77 statements ALWAYS BEGIN AT, OR
AFTER, COLUMN 7.
One of the special purposes for which the first six columns may be used is shown in the
projectile program: if the first column contains a 'c' or a '*' then the whole line is treated as a
COMMENT and is ignored when the program is compiled into executable code.
A second special use of the first six columns is to specify a CONTINUATION LINE. If column
6 of a line contains any character other than a space or a zero then the line is treated as a
continuation of the previous line. In this case columns 1-5 of the continuation line MUST BE
BLANK, and column 7 is treated as if it came immediately after column 72 of the previous line!
The third special use of the first six columns (actually, the first five columns) is for identifying a
statement by means of a STATEMENT LABEL, which is an integer, written in columns 1-5.
The number chosen can be any integer in the range 1-99999 as long as it is unique to the
statement being labelled. We will encounter uses of statement labels later in the tutorial; for now,
note that they are not generally required and their use is DISCOURAGED.
6.4 C/C++
The C language was developed in 1972 by Dennis Ritchie at Bell Telephone laboratories,
primarily as a systems programming language. That is, a language to write operating systems
with. Ritchie’s primary goals were to produce a minimalistic language that was easy to compile,
allowed efficient access to memory, produced efficient code, and did not need extensive run-time
support. Thus, for a high-level language, it was designed to be fairly low-level, while still
encouraging platform-independent programming.
C ended up being so efficient and flexible that in 1973, Ritchie and Ken Thompson rewrote most
of the UNIX operating system using C. Many previous operating systems had been written in
assembly. Unlike assembly, which ties a program to a specific CPU, C has excellent portability,
allowing UNIX to be recompiled on many different types of computers and speeding its
adoption. C and Unix had their fortunes tied together, and C’s popularity was in part tied to the
success of UNIX as an operating system.
In 1978, Brian Kernighan and Dennis Ritchie published a book called “The C Programming
Language”. This book, which was commonly known as K&R (after the authors’ last names),
provided an informal specification for the language and became a de facto standard. When
maximum portability was needed, programmers would stick to the recommendations in K&R,
because most compilers at the time were implemented to K&R standards.
In 1983, the American National Standards Institute (ANSI) formed a committee to establish a
formal standard for C. In 1989 (committees take forever to do anything), they finished, and
released the C89 standard, more commonly known as ANSI C. In 1990 the International
Organization for Standardization adopted ANSI C (with a few minor modifications). This
version of C became known as C90. Compilers eventually became ANSI C/C90 compliant, and
programs desiring maximum portability were coded to this standard.
In 1999, the ANSI committee released a new version of C called C99. It adopted many features
which had already made their way into compilers as extensions, or had been implemented in
C++.
C++
C++ (pronounced see plus plus) was developed by Bjarne Stroustrup at Bell Labs as an
extension to C, starting in 1979. C++ adds many new features to the C language, and is perhaps
best thought of as a superset of C, though this is not strictly true as C99 introduced a few features
that do not exist in C++. C++’s claim to fame results primarily from the fact that it is an object-
oriented language. As for what an object is and how it differs from traditional programming
methods, well, we’ll cover that in chapter (Basic object-oriented programming).
C++ was ratified in 1998 by the ISO committee, and again in 2003 (called C++03). Two updates
to the C++ language (C++11 and C++14, ratified in 2011 and 2014 accordingly) have been made
since then, adding additional functionality to the language. Relevant features from both of these
updates will be discussed in these tutorials.
6.4.1 Basic input/output functions Of C
The basic input/output functions are getchar , putchar , puts , scanf and printf . The first
two functions, getchar and putchar, are used to transfer single characters. ... C includes a
collection of header files that provide necessary information in support of the various
library functions.
C programming has several in-built library functions to perform input and output tasks.
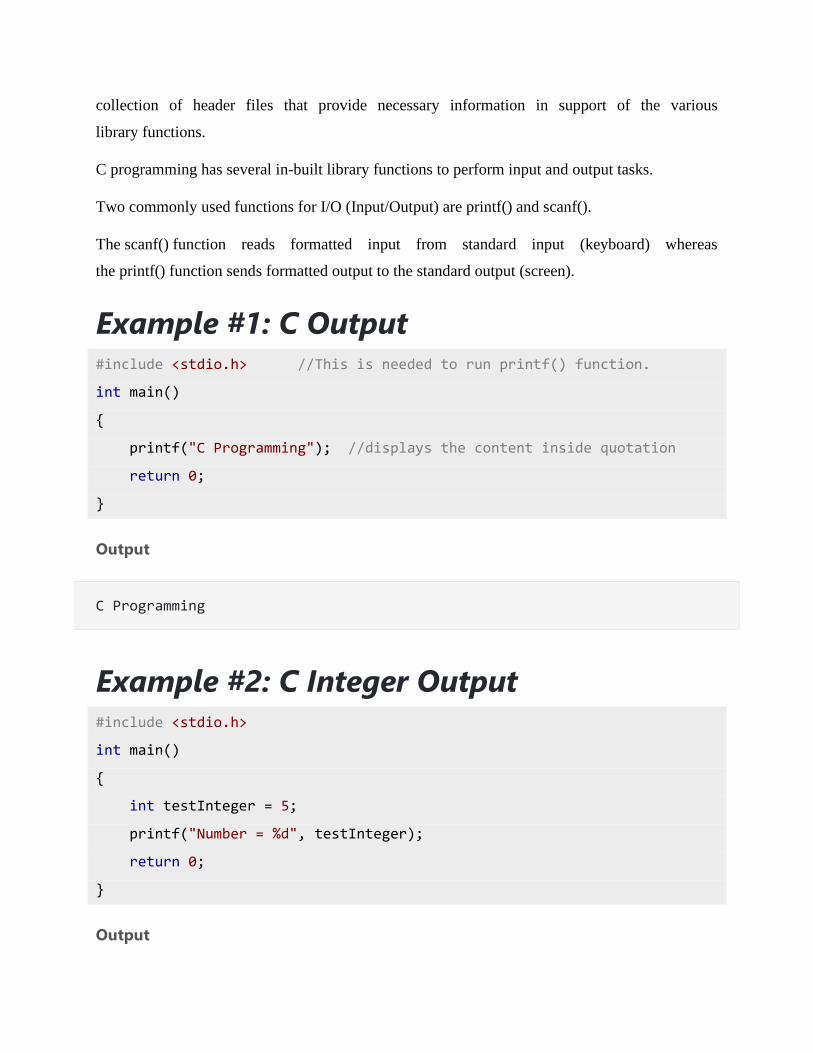
Two commonly used functions for I/O (Input/Output) are printf() and scanf().
The scanf() function reads formatted input from standard input (keyboard) whereas
the printf() function sends formatted output to the standard output (screen).
Example #1: C Output #include <stdio.h> //This is needed to run printf() function.
int main()
{
printf("C Programming"); //displays the content inside quotation
return 0;
}
Output
C Programming
Example #2: C Integer Output #include <stdio.h>
int main()
{
int testInteger = 5;
printf("Number = %d", testInteger);
return 0;
}
Output
Number = 5
Example #3: C Integer Input/Output #include <stdio.h>
int main()
{
int testInteger;
printf("Enter an integer: ");
scanf("%d",&testInteger);
printf("Number = %d",testInteger);
return 0;
}
Output
Enter an integer: 4
Number = 4
Questions for practice
1. What is the full form of BASIC language?
2. Write the application of BASIC.
3. What is Java?
4. Write the main features of JAVA.
5. Why Java is a platform independent language?
6. What is JVM?
7. What is C and C++?
8. Write basic input and output function of C?
Lesson – 7
7. Database, concepts and types
Database is a collection of related data and data is a collection of facts and figures
that can be processed to produce information. Mostly data represents recordable
facts. Data aids in producing information, which is based on facts. For example, if
we have data about marks obtained by all students, we can then conclude about
toppers and average marks. A database management system stores data in such a
way that it becomes easier to retrieve, manipulate, and produce information.
7.1 Characteristics:
Traditionally, data was organized in file formats. DBMS was a new concept then,
and all the research was done to make it overcome the deficiencies in traditional
style of data management. A modern DBMS has the following characteristics:
• Real-world entity: A modern DBMS is more realistic and uses real-world entities
to design its architecture. It uses the behavior and attributes too. For example, a
school database may use students as an entity and their age as an attribute.
• Relation-based tables: DBMS allows entities and relations among them to form
tables. A user can understand the architecture of a database just by looking at the
table names.
• Isolation of data and application: A database system is entirely different than its
data. A database is an active entity, whereas data is said to be passive, on which the
database works and organizes. DBMS also stores metadata, which is data about
data, to ease its own process.
• Less redundancy: DBMS follows the rules of normalization, which splits a
relation when any of its attributes is having redundancy in values. Normalization is
a mathematically rich and scientific process that reduces data redundancy.
• Consistency: Consistency is a state where every relation in a database remains
consistent. There exist methods and techniques, which can detect attempt of leaving
database in inconsistent state. A DBMS can provide greater consistency as
compared to earlier forms of data storing applications like file-processing systems.
• Query Language: DBMS is equipped with query language, which makes it more
efficient to retrieve and manipulate data. A user can apply as many and as different
filtering options as required to retrieve a set of data. Traditionally it was not possible
where file-processing system was used.
7.2 Different Types of Database:
A database is basically a repository of data which is devised in order to support
efficient data storage. In addition to data storage, a database also assists in retrieval
and maintenance of data stored in it. There are many different types of databases.
A database holds data and assists in making it reachable through various ways. A
database is known for its regular and systematically defined structure. Some
important characteristics of databases are –
Concurrent use – Many users can access the database concurrently
Structured and described data – In addition to data, it also consists of complete
definition and description of data
Separation of Data and Applications – Due to this feature it is not required for
application software to known about the physical data storage.
Data Integrity – Data remains protected from the unauthorized access and changes
Transactions – It refers to the features which maintains the atomicity; which means
a consistent state.
Data Persistence – It refers to the durability of the data which must not be
dependent on any of the system features
Different Types of Database
A database is basically a repository of data which is devised in order to support
efficient data storage. In addition to data storage, a database also assists in retrieval
and maintenance of data stored in it. There are many different types of databases.A
database holds data and assists in making it reachable through various ways. A database is
known for its regular and systematically defined structure. Some important characteristics
of databases are –
Concurrent use – Many users can access the database concurrently

Structured and described data – In addition to data, it also consists of complete
definition and description of data
Separation of Data and Applications – Due to this feature it is not required for
application software to known about the physical data storage.
Data Integrity – Data remains protected from the unauthorized access and changes
Transactions – It refers to the features which maintains the atomicity; which means
a consistent state.
Data Persistence – It refers to the durability of the data which must not be dependent
on any of the system features
Generally, databases can be categorized on the basis of number of users, location,
form of data saved in it, etc. Generally, all of the databases fall in one of these types
–
Document Oriented Database – This database is free from any type of strict schema. It does
not store data in the form of data table, but in the form of text records. This type of database is
suitable for storing dynamic data. CouchDB and RavenDB are examples of document databases.
It is useful for an application which is document-based. Documents are encoded using some
standard formats.
Embedded Database – An embedded database runs within an application, and therefore it does
not run as a separate application. Unlike general purpose databases, this database is embedded as
in line code or linked library. It saves time wasted on issues related to installations or
maintenance. These types of databases are generally found in the set-top boxes, mobile phones,
etc. RDM server and RDM Embedded are examples of these types of databases.
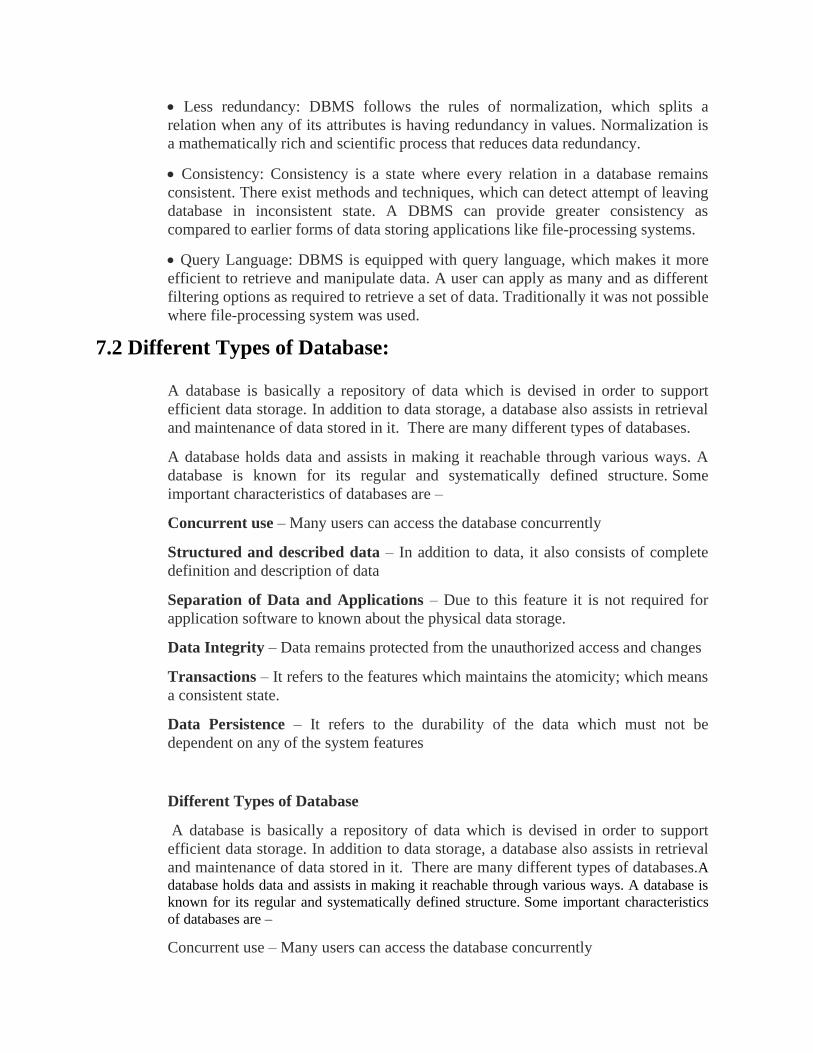
Graph Database – It is based on the relationship of resources with each other, and no particular
resourse has any essential importance on the other. These types of graphs help in storing data for
a dynamic schema. It provides index free adjancy. In this graph database, each vertex works as a
mini index for its adjacent elements. Infogrid type of graph database should be preferred for
model flexibility.
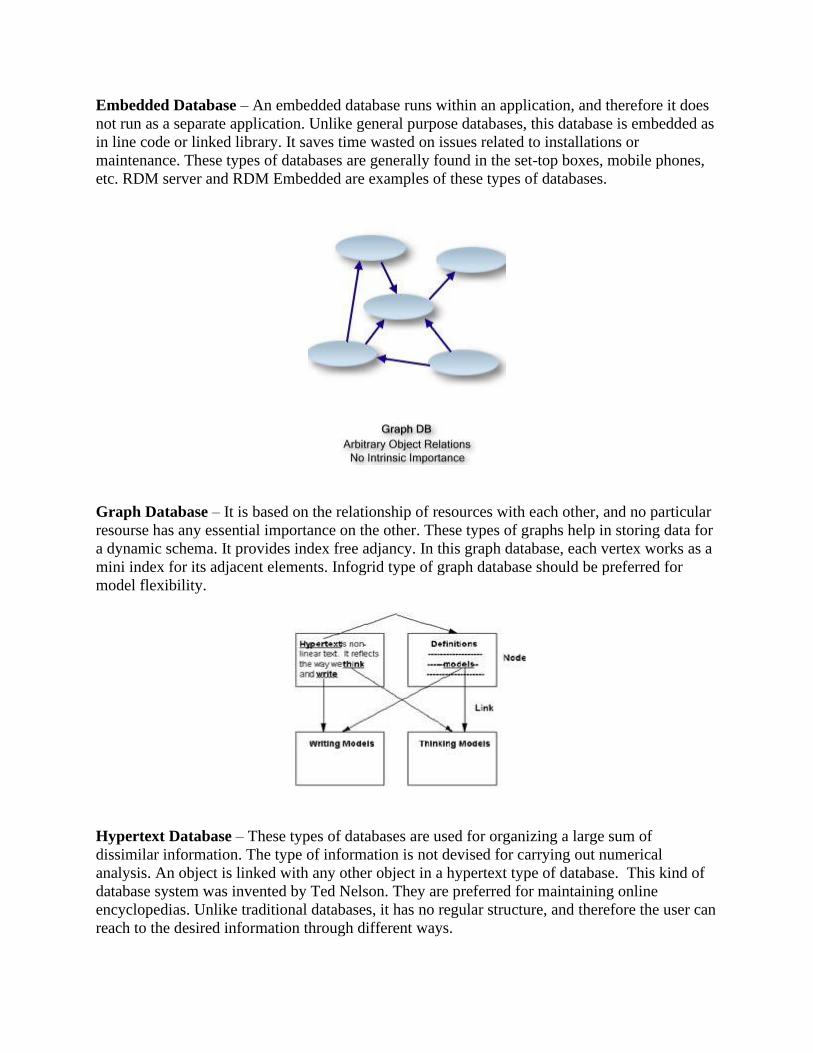
Hypertext Database – These types of databases are used for organizing a large sum of
dissimilar information. The type of information is not devised for carrying out numerical
analysis. An object is linked with any other object in a hypertext type of database. This kind of
database system was invented by Ted Nelson. They are preferred for maintaining online
encyclopedias. Unlike traditional databases, it has no regular structure, and therefore the user can
reach to the desired information through different ways.
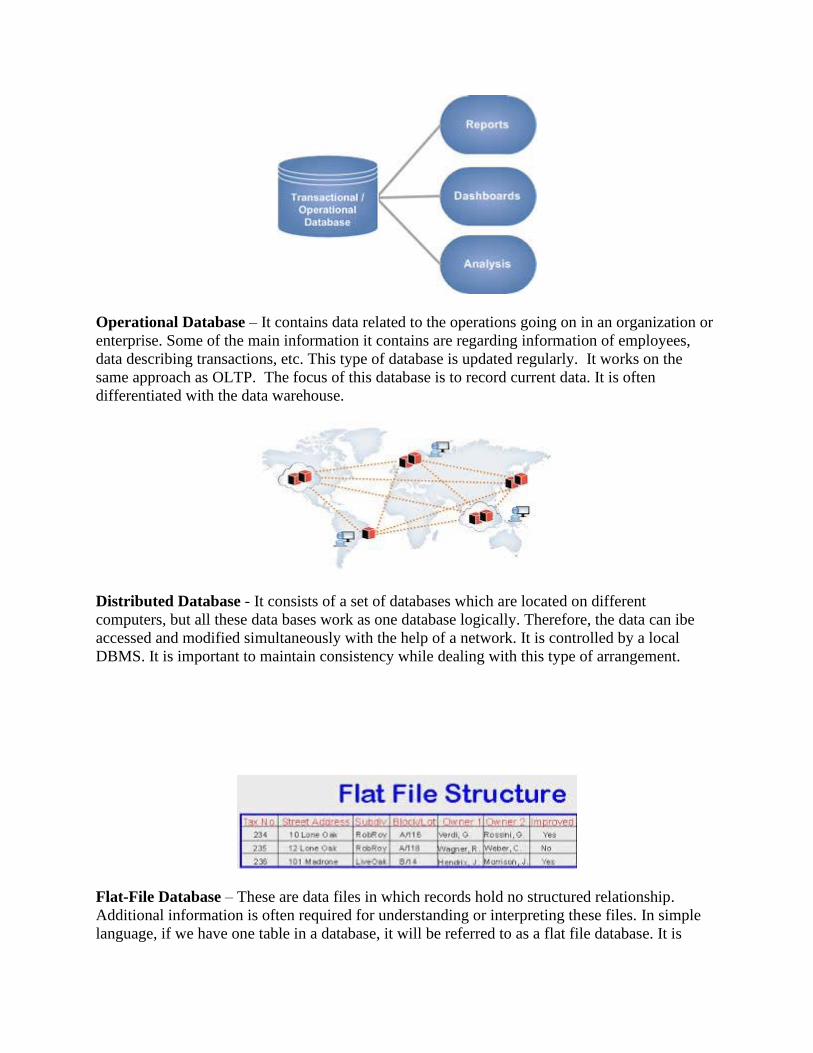
Operational Database – It contains data related to the operations going on in an organization or
enterprise. Some of the main information it contains are regarding information of employees,
data describing transactions, etc. This type of database is updated regularly. It works on the
same approach as OLTP. The focus of this database is to record current data. It is often
differentiated with the data warehouse.
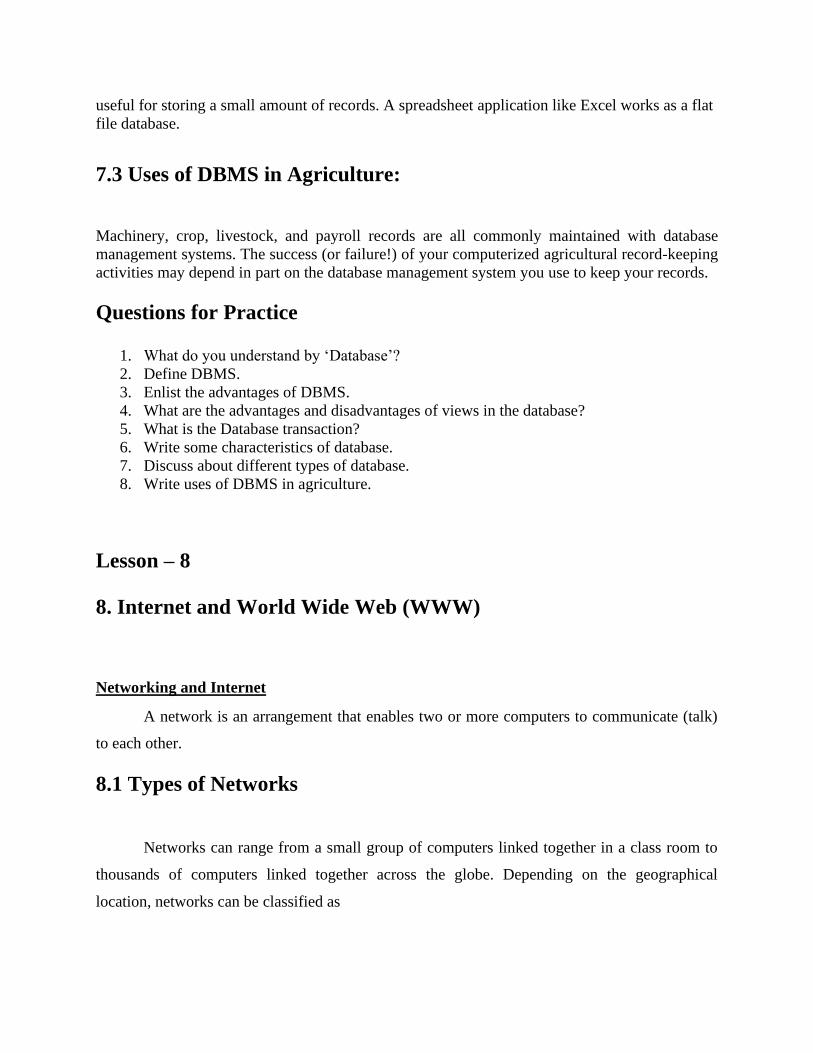
Distributed Database - It consists of a set of databases which are located on different
computers, but all these data bases work as one database logically. Therefore, the data can ibe
accessed and modified simultaneously with the help of a network. It is controlled by a local
DBMS. It is important to maintain consistency while dealing with this type of arrangement.
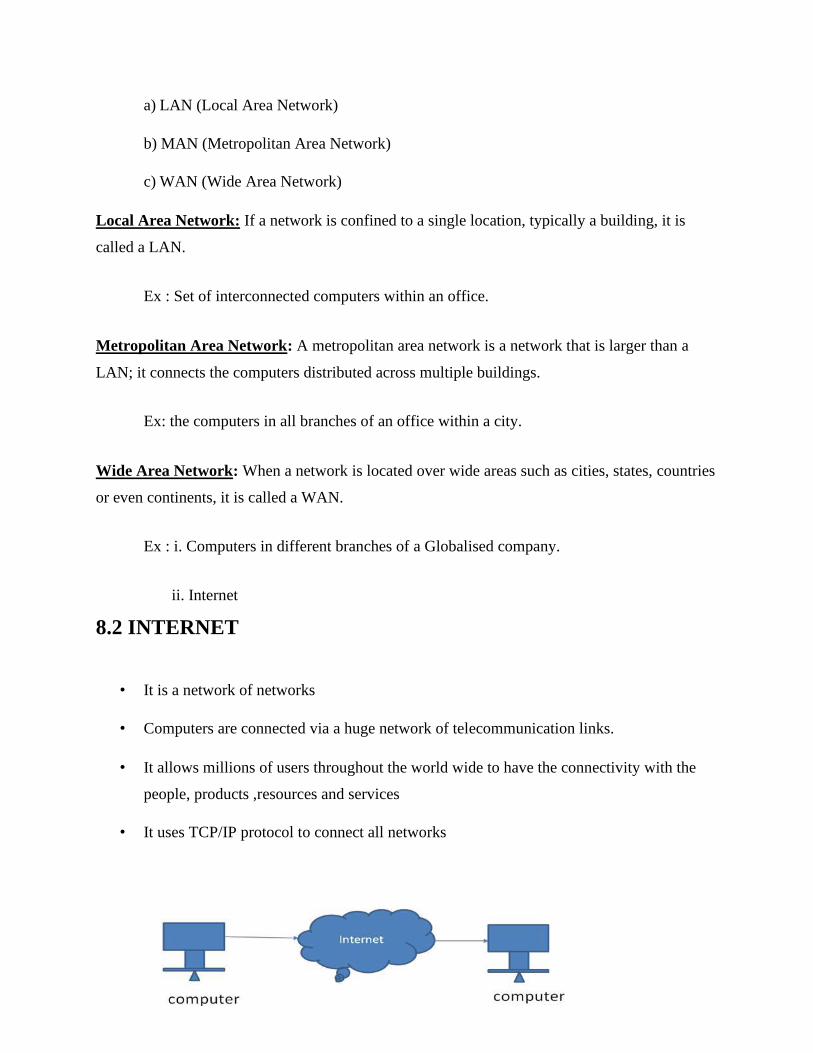
Flat-File Database – These are data files in which records hold no structured relationship.
Additional information is often required for understanding or interpreting these files. In simple
language, if we have one table in a database, it will be referred to as a flat file database. It is
useful for storing a small amount of records. A spreadsheet application like Excel works as a flat
file database.
7.3 Uses of DBMS in Agriculture:
Machinery, crop, livestock, and payroll records are all commonly maintained with database
management systems. The success (or failure!) of your computerized agricultural record-keeping
activities may depend in part on the database management system you use to keep your records.
Questions for Practice
1. What do you understand by ‘Database’?
2. Define DBMS.
3. Enlist the advantages of DBMS.
4. What are the advantages and disadvantages of views in the database?
5. What is the Database transaction?
6. Write some characteristics of database.
7. Discuss about different types of database.
8. Write uses of DBMS in agriculture.
Lesson – 8
8. Internet and World Wide Web (WWW)
Networking and Internet
A network is an arrangement that enables two or more computers to communicate (talk)
to each other.
8.1 Types of Networks
Networks can range from a small group of computers linked together in a class room to
thousands of computers linked together across the globe. Depending on the geographical
location, networks can be classified as
a) LAN (Local Area Network)
b) MAN (Metropolitan Area Network)
c) WAN (Wide Area Network)
Local Area Network: If a network is confined to a single location, typically a building, it is
called a LAN.
Ex : Set of interconnected computers within an office.
Metropolitan Area Network: A metropolitan area network is a network that is larger than a
LAN; it connects the computers distributed across multiple buildings.
Ex: the computers in all branches of an office within a city.
Wide Area Network: When a network is located over wide areas such as cities, states, countries
or even continents, it is called a WAN.
Ex : i. Computers in different branches of a Globalised company.
ii. Internet
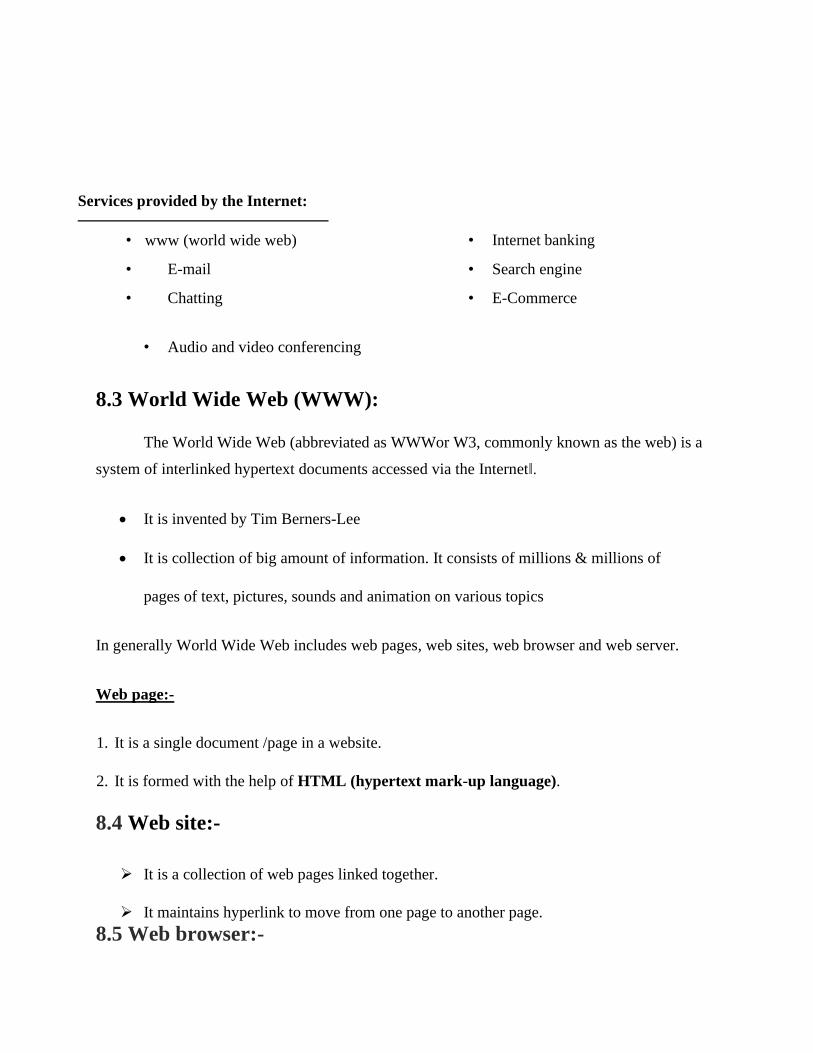
8.2 INTERNET
• It is a network of networks
• Computers are connected via a huge network of telecommunication links.
• It allows millions of users throughout the world wide to have the connectivity with the
people, products ,resources and services
• It uses TCP/IP protocol to connect all networks
Services provided by the Internet:
• www (world wide web) • Internet banking
• E-mail • Search engine
• Chatting • E-Commerce
• Audio and video conferencing
8.3 World Wide Web (WWW):
The World Wide Web (abbreviated as WWWor W3, commonly known as the web) is a
system of interlinked hypertext documents accessed via the Internet‖.
• It is invented by Tim Berners-Lee
• It is collection of big amount of information. It consists of millions & millions of
pages of text, pictures, sounds and animation on various topics
In generally World Wide Web includes web pages, web sites, web browser and web server.
Web page:-
1. It is a single document /page in a website.
2. It is formed with the help of HTML (hypertext mark-up language).
8.4 Web site:-
➢ It is a collection of web pages linked together.
➢ It maintains hyperlink to move from one page to another page.
8.5 Web browser:-
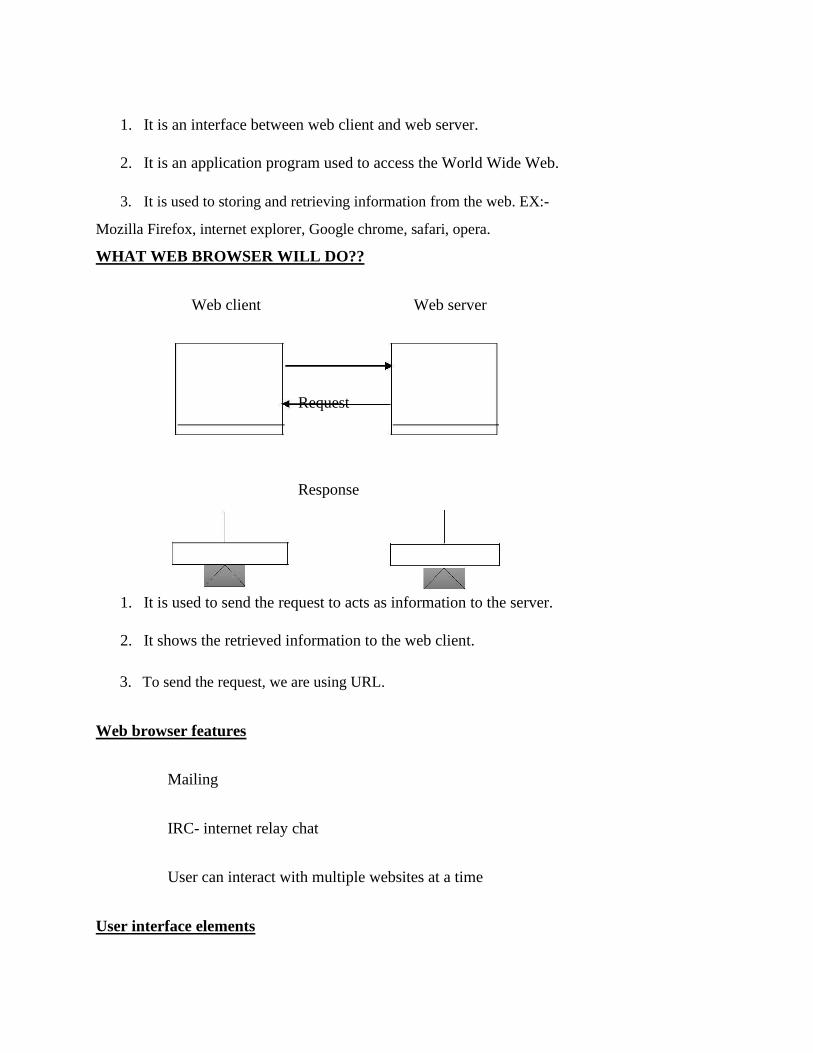
1. It is an interface between web client and web server.
2. It is an application program used to access the World Wide Web.
3. It is used to storing and retrieving information from the web. EX:-
Mozilla Firefox, internet explorer, Google chrome, safari, opera.
WHAT WEB BROWSER WILL DO??
Web client Web server
Request
Response
1. It is used to send the request to acts as information to the server.
2. It shows the retrieved information to the web client.
3. To send the request, we are using URL.
Web browser features
Mailing
IRC- internet relay chat
User can interact with multiple websites at a time
User interface elements
User interface elements provided by web browser.
i. Forwarding and back warding
ii. Refresh or reload a web page
iii. Boom marking(added to the recently visited web sites)
iv. Address bar (to enter the URL) search engine.
v. Home page
Web server
It is a computer that is used to provide the files, program and information requested
by the client connected to the network.
It is used to process and give the response to the client request.
8.6 E-Mail
• E-mail or electronic mail is a service for sending or receiving messages
electronically through a computer network.
• The electronic mail uses various technologies that support electronic transmission of
text, data and graphics.
EX: gmail,yahoomail,rediffmail……
8.6.1 Some of the features of E-mail are
1. It is much faster. Messages can be sent within a matter of seconds to any part in the
world.
2. It can be sent to many people at the same time
3. E-mail is cheaper than a phone call and an ordinary mail
4. It can access information and file libraries on request
5. E-mail user can have a mail box which is accessed through a computer terminal
6. An E-mail message consists of two parts
a) a header specifying the address of the sender and the address of the receiver
b) the text of the message
7. The mailing system allows selecting messages for reading, displaying, saving,
deleting, forwarding and replying.
8. Mailing list can be created to send the same message to a group of people
9.It is used to store some important data.
1. The person‗s Login name
2. @ sign
3. Domain name
A domain represents organization, network, and country name
Ex: [email protected] in this s.panao is the user name and his account is in the domain
cutm.ac.in. Both the names are separated by the @symbol.
Lesson – 9
9. e-Agriculture
E-Agriculture is a global Community of Practice, where people from all over the world exchange
information, ideas, and resources related to the use of information and communication
technologies (ICT) for sustainable agriculture and rural development.
E-Agriculture Community is made up of over 12,000 members from 170 countries and
territories, members are information and communication specialists, researchers, farmers,
students, policy makers, business people, development practitioners, and others.
Members have a common interest that brings them together, that of improving policies and
processes around the use of ICTs in support of agriculture and rural development, in order to
have a positive impact on rural livelihoods.
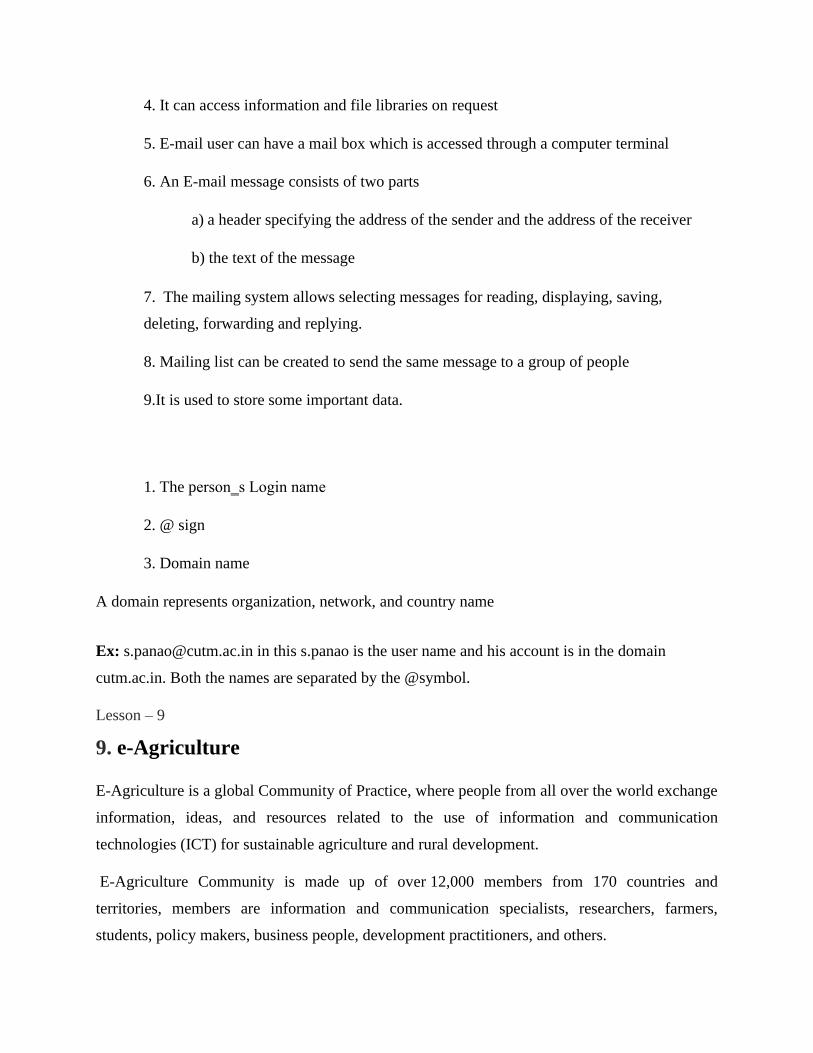
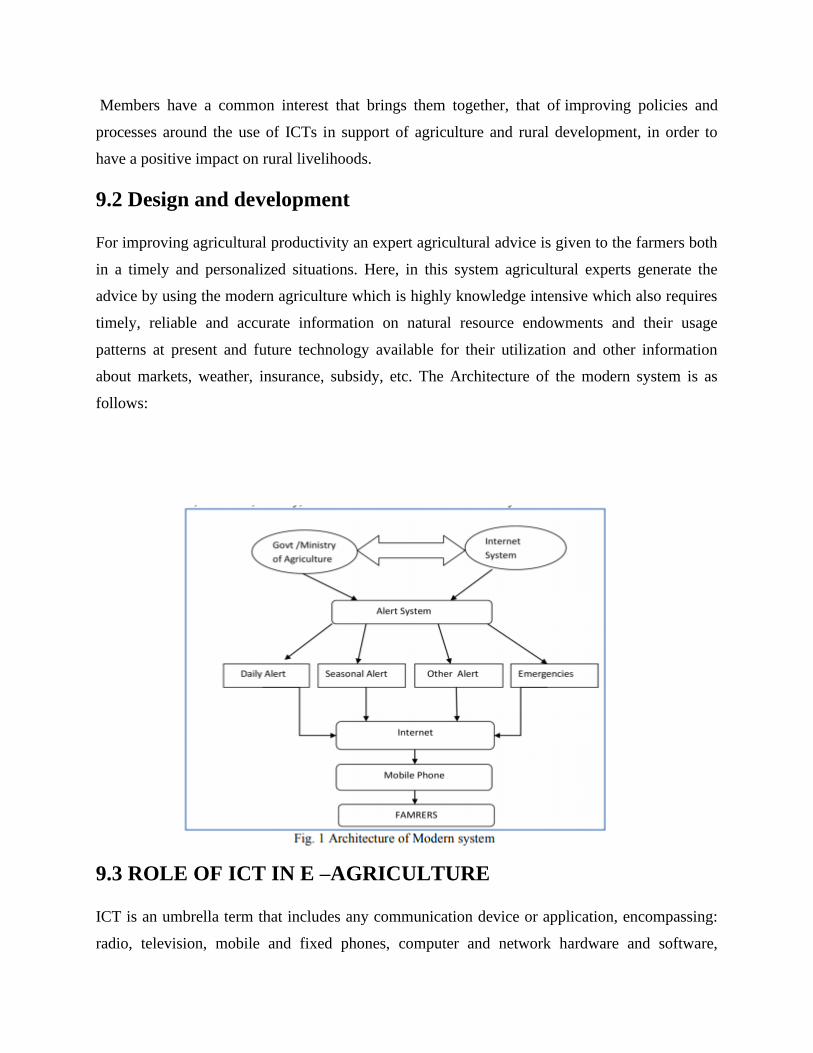
9.2 Design and development
For improving agricultural productivity an expert agricultural advice is given to the farmers both
in a timely and personalized situations. Here, in this system agricultural experts generate the
advice by using the modern agriculture which is highly knowledge intensive which also requires
timely, reliable and accurate information on natural resource endowments and their usage
patterns at present and future technology available for their utilization and other information
about markets, weather, insurance, subsidy, etc. The Architecture of the modern system is as
follows:
9.3 ROLE OF ICT IN E –AGRICULTURE
ICT is an umbrella term that includes any communication device or application, encompassing:
radio, television, mobile and fixed phones, computer and network hardware and software,
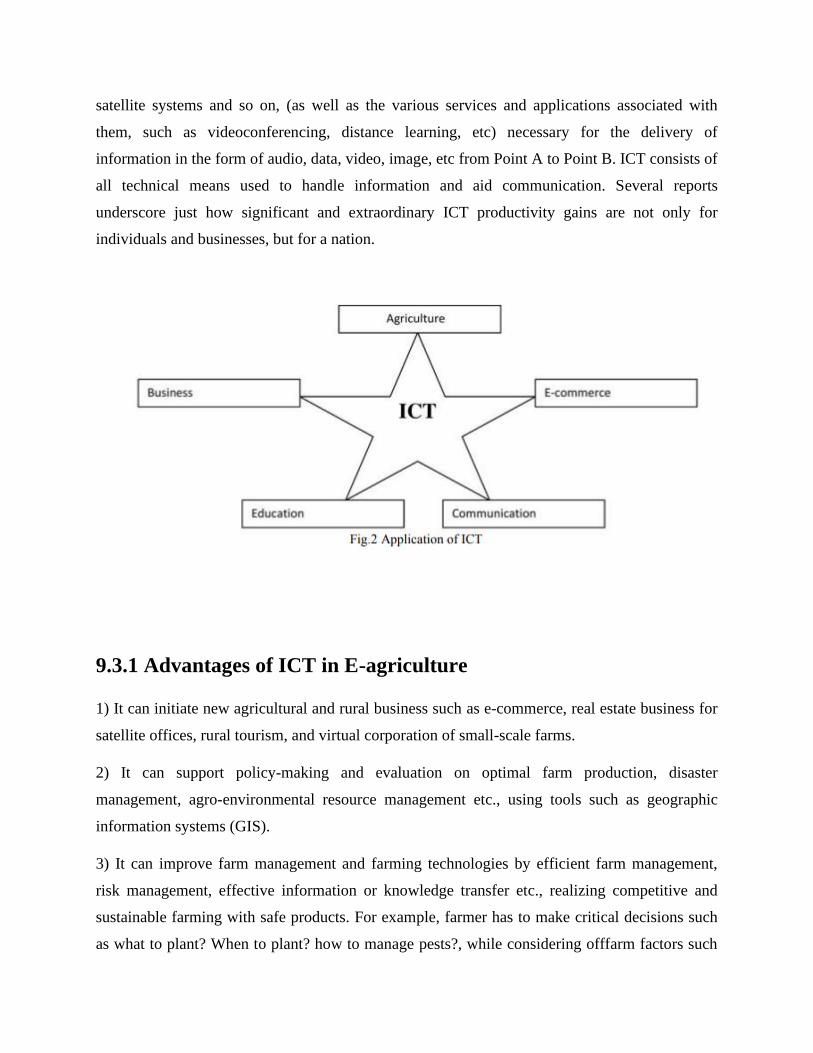
satellite systems and so on, (as well as the various services and applications associated with
them, such as videoconferencing, distance learning, etc) necessary for the delivery of
information in the form of audio, data, video, image, etc from Point A to Point B. ICT consists of
all technical means used to handle information and aid communication. Several reports
underscore just how significant and extraordinary ICT productivity gains are not only for
individuals and businesses, but for a nation.
9.3.1 Advantages of ICT in E-agriculture
1) It can initiate new agricultural and rural business such as e-commerce, real estate business for
satellite offices, rural tourism, and virtual corporation of small-scale farms.
2) It can support policy-making and evaluation on optimal farm production, disaster
management, agro-environmental resource management etc., using tools such as geographic
information systems (GIS).
3) It can improve farm management and farming technologies by efficient farm management,
risk management, effective information or knowledge transfer etc., realizing competitive and
sustainable farming with safe products. For example, farmer has to make critical decisions such
as what to plant? When to plant? how to manage pests?, while considering offfarm factors such
as environmental impacts, market access, and industry standards. IT-based decision support
system (DSS) can surely help their decisions.
4) It can provide systems and tools to secure food traceability and reliability that has been an
emerging issue concerning farm products since serious contamination such as chicken flu was
detected.
5) It can facilitate rural activities and provide more comfortable and safe rural life with
equivalent services to those in the urban areas, such as provision of distance education,
telemedicine, remote public services, remote entertainment etc.
6) Empowerment of Stakeholders (Government Officials, Research, Education & Extension
Scientists, farmers and other service providers such as Community Information centers.
7) Development of Knowledge Management, Decision Support and Advisory Systems to
strengthen Extension services and also used for Farmers Redressal system
8) Efficient management (Development, Conservation, allocation and utilization) of resources .
9) Improved productivity and profitability of farmers through better advisory systems.
9.4 Computer Models in Agriculture
Throughout history, numerous techniques and experiments were performed by meteorologists to
predict the weather with greater efficacy over time. Due to substantial advances in technology, it
is now possible to forecast the weather days and even months in advance—which was not truly
possible before the mid-20th century. The use of computer models became widespread mainly
throughout the 1960s, as the first weather satellites were launched. The types of computer
models that are used in forecasts depend mostly on the type of climate and weather conditions.
9.4.1 Types of computer models
Climate Models
Climate models are primarily used to forecast substantial changes in the earth's climate. Climate
is the average weather conditions in an area for a prolonged period of time. Therefore, climate
models use a combination of statistical and current data to provide a reasonable forecast. The
CFS is one of the primary climate models used for forecasting planetary scale weather conditions
such as: El Nino, Madden Julian Oscillations (MJO), and monsoons.
Mesoscale Models
Mesoscale models are mainly used to forecast the weather locally. Mesoscale in meteorological
terms means the atmospheric conditions ranging usually from two to 20 km. Synoptic and
climate models usually do not have enough resolution to forecast localized weather conditions
such as: single cellular thunderstorms and tornadoes. The North American Model (NAM) is
commonly used to forecast local weather conditions.
Dynamic Models
Dynamic models are the most sophisticated and costly tools used to forecast the weather.
Dynamic models use advanced fundamental equations of the atmosphere to predict changes in
the weather based on current conditions. Despite their efficiency, dynamic models can make
errors during the initial runs. According to the National Hurricane Center (NHC), the GFS,
ECMWF, NOGAPS, UKMET, and CMC, are some of the dynamic models used for forecasting.
Statistical Models
Statistical models are primarily used to help meteorologist provide accurate analog forecasts.
Statistical models use data from previous storms and weather conditions to help meteorologists
get a better idea of how to track current weather systems. Statistical models are commonly used
to track tropical and mid latitude cyclones. If the dynamical model consensus is not reasonable,
meteorologists often use statistical models to provide better forecasts.
Crop Simulation Model
A Crop Simulation Model (CSM) is a simulation model that describes processes of crop growth
and development as a function of weather conditions, soil conditions, and crop management.
IT application for computation of water and nutrient requirement of crops:
Introduction
Crop yield gaps quantify the potential for yield increases. Closing yield gaps may require more
inputs, and a question is: how much? In analogy with the yield gap, the input gap is the
difference between the minimum amount of input(s) required for a target yield and the input use
under current practice. We developed a methodology to calculate nitrogen fertilizer requirements
and input gaps and present preliminary results for maize in Africa.
Methodology
We have combined existing model approaches:
6. Potential yield and water use are calculated with a crop model as function of crop
characteristics and global grid-based data of weather and soils.
7. Minimum fertilizer N requirement is calculated as function of target yield, indigenous
soil N supply (SNS), applied animal manure (MAN) and grain recovery efficiency of applied
fertilizer N (GRE), while maintaining soil N equilibrium.
Calculation steps:
I. select target DM yield
II. II. calculate N yield
III. III. calculate N application
8. In maintaining soil N equilibrium, we have calculated SNS depending on the amount of
crop residues left in the field and MAN depending on part of the aboveground biomass fed to
animals, while GRE depends on the harvest index and N losses during the cropping cycle.
Basic equilibrium equations of annual crop and soil N balances: a) Nuptake = Nroots +
Ncropresidue + Nbyproduct + Ngrain b) Ndeposition + Nroots + Ncropresidue + Nmanure +
Napplication = Nuptake + NsoilLosses
IRRIGATION WATER NEED OF RICE
For all field crops, as has been explained in the previous section, the irrigation water need (IN) is
determined as follows:
Step 1: Determine the reference crop evapotranspiration: ETo
Step 2: Determine the crop factors: Kc
Step 3: Calculate the crop water need: ET crop = ETo × Kc
Step 4: Determine the effective rainfall: Pe
Step 5: Calculate the irrigation water need: IN = ET crop - Pe
Paddy rice, growing with "its feet in the water", is an exception. Not only has the crop water
need (ET crop) to be supplied by irrigation or rainfall, but also water is needed for:
saturation of the soil before planting
percolation and seepage losses
establishment of a water layer
In summary, the determination of the irrigation water need for paddy rice requires the following
steps:
Step 1: Determine the reference crop evapotranspiration: ETo
Step 2: Determine the crop factors: Kc
Step 3: Calculate the crop water need: ET crop = ETo × Kc
Step 4: Determine the amount of water needed to saturate the soil for land preparation by
puddling: SAT
Step 5: Determine the amount of percolation and seepage losses: PERC
Step 6: Determine the amount of water needed to establish a water layer: WL
Step 7: Determine the effective rainfall: Pe
Step 8: Calculate the irrigation water need: IN = ET crop + SAT + PERC + WL - Pe
These steps are discussed in detail below.
Step 1, 2 and 3: Determine ETo, Kc and ET crop
ET crop is determined similarly to all other field crops as discussed in Sections 3.1 to 3.3
Step 4: Determine the amount of water needed to saturate the soil for land preparation by
puddling: SAT
In the month before sowing or transplanting, water is needed to saturate the root zone. The
amount of water needed depends on the soil type and rooting depth. For the purpose of this
manual it is however assumed that the amount of water needed to saturate the root zone is 200
mm. Thus:
SAT = 200 mm
Step 5: Determine the amount of percolation and seepage losses: PERC
The percolation and seepage losses depend on the type of soil. They will be low in very heavy,
well-puddled clay soils and high in the case of sandy soils. The percolation and seepage losses
vary between 4 and 8 mm/day.
for heavy clay: PERC = 4 mm/day
for sandy soils: PERC = 8 mm/day
on average: PERC = 6 mm/day
Step 6: Determine the amount of water needed to establish a water layer: WL
A water layer is established during transplanting or sowing and maintained throughout the
growing season. The amount of water needed for maintaining the water layer has already been
taken into account with the determination of the percolation and seepage losses. The amount of
water needed to establish the water layer, however, still has to be considered. For the purpose of
this manual it is assumed that a water layer of 100 mm is established. Thus:
WL = 100 mm
Step 7: Determine the effective rainfall: Pe
The effective rainfall is calculated using the same formulae as described in Section 4.2.
Pe = 0.8 P - 25 if P > 75 mm/month
Pe = 0.6 P - 10 if p < 75 mm/month
Step 8: Calculate the irrigation water need: IN = ET crop + SAT + PERC + WL - Pe
The irrigation water need is calculated using the following formula;
IN = ET crop + SAT + PERC + WL - Pe
CALCULATION EXAMPLE
QUESTION
Calculate the irrigation water need (IN) of paddy rice for the month of April when given:
ETo = 6 mm/day
Kc = 1.1
the root zone has already been saturated in the previous month
PERC = 5 mm/day
the water layer (100 mm) needs to be established during April
Pe = 135 mm/month
ANSWER
IN = ET crop + SAT + PERC + WL - Pe
ET crop = ETo × Kc = 6 × 1.1 = 6.6 mm/day = 6.6 × 30 = 198 mm/month
SAT = 0 mm
PERC = 5 mm/day = 5 × 30 = 150 mm/month
WL = 100 mm
Pe = 135 mm/month
IN = 198 + 0 + 150 + 100 - 135 = 313 mm/month = 10.4 mm/day
Thus the irrigation water need during April is 313 mm or 10.4 mm/day.
9.5 Computer-controlled devices (automated systems) for Agri-input
management
Wireless technologies.
Wireless technologies have numerous applications in agriculture. One major
usage is the simplification of closed-circuit television camera systems; the use of wireless
communications eliminates the need for the installation of coaxial cables
Global Positioning System (GPS)
In agriculture, the use of the Global Positioning System provides benefits in geo-
fencing, map-making and surveying. GPS receivers dropped in price over the years,
making it more popular for civilian use. With the use of GPS, civilians can produce
simple yet highly accurate digitized map without the help of a professional cartographer.
In Kenya, for example, the solution to prevent an elephant bull from wandering into
farms and destroying precious crops was to tag the elephant with a device that sends a
text message when it crosses a geo-fence. Using the technology of SMS and GPS, the
elephant can roam freely and the authorities are alerted whenever it is near the farm.
Geographic information systems.
Geographic information systems, or GiS, are extensively used in agriculture, especially
in precision farming. Land is mapped digitally, and pertinent geodetic data such as
topography and contours are combined with other statistical data for easier analysis of the
soil. GIS is used in decision making such as what to plant and where to plant using
historical data and sampling.
Computer-controlled devices (automated systems)
Automatic milking systems are computer controlled stand alone systems that milk the
dairy cattle without human labor. The complete automation of the milking process is
controlled by an agricultural robot, complex herd management software, and specialized
computers. Automatic milking eliminates the farmer from the actual milking process,
allowing for more time for
supervision of the farm and the herd. Farmers can also improve herd management by
using the data gathered by the computer. By analyzing the effect of various animal
feeds on milk yield,farmers may adjust accordingly to obtain optimal milk yields. Since
the data is available down to individual level, each cow may be tracked and examined,
and the farmer may be alerted when there are unusual changes that could mean sickness
or injuries
Smartphone mobile apps in agriculture.
• The use of mobile technologies as a tool of intervention in agriculture is becoming
increasingly popular. Smartphone penetration enhances the multi-dimensional positive
impact on sustainable poverty reduction and identify accessibility as the main challenge
in harnessing the full potential (Silarszky et al., 2008) in agricultural space. The reach of
smartphone even in rural areas extended the ICT services beyond simple voice or text
messages. Several smartphone apps are available for agriculture, horticulture, animal
husbandry and farm machinery.
• Smartphone mobile applications designed and developed by Jayalaxmi agrotech Pvt Ltd
from India are the most commonly used agriculture apps in India. Their mobile apps are
in regional language are designed to break the literacy barrier and deliver the information
in most simple manner. Several thousands of farmers across Asia are empowered with
these apps.
RFID.
The Veterinary Department of Malaysia's Ministry of Agriculture introduced a livestock-tracking
program in 2009 to track the estimated 80,000 cattle all across the country. Each cattle is tagged
with the use of RFID technology for easier identification, providing access to relevant data such
as: bearer's location, name of breeder, origin of livestock, sex, and dates of movement. This
program is the first of its kind in Asia, and is expected to increase the competitiveness of
Malaysian livestock industry in international markets by satisfying the regulatory requirements
of importing countries like United States, Europe and Middle East. Tracking by RFID will also
help producers meet the dietary standards by the halal market. The program will also provide
improvements in controlling disease outbreaks in livestock
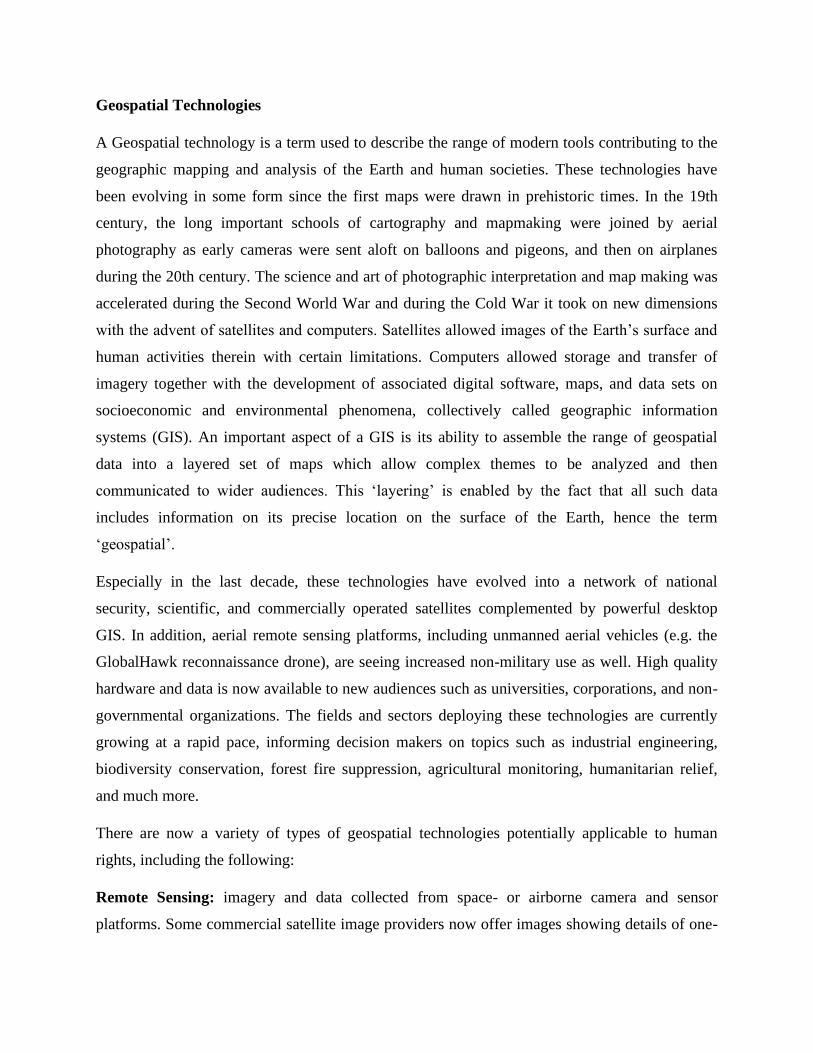
Geospatial Technologies
A Geospatial technology is a term used to describe the range of modern tools contributing to the
geographic mapping and analysis of the Earth and human societies. These technologies have
been evolving in some form since the first maps were drawn in prehistoric times. In the 19th
century, the long important schools of cartography and mapmaking were joined by aerial
photography as early cameras were sent aloft on balloons and pigeons, and then on airplanes
during the 20th century. The science and art of photographic interpretation and map making was
accelerated during the Second World War and during the Cold War it took on new dimensions
with the advent of satellites and computers. Satellites allowed images of the Earth’s surface and
human activities therein with certain limitations. Computers allowed storage and transfer of
imagery together with the development of associated digital software, maps, and data sets on
socioeconomic and environmental phenomena, collectively called geographic information
systems (GIS). An important aspect of a GIS is its ability to assemble the range of geospatial
data into a layered set of maps which allow complex themes to be analyzed and then
communicated to wider audiences. This ‘layering’ is enabled by the fact that all such data
includes information on its precise location on the surface of the Earth, hence the term
‘geospatial’.
Especially in the last decade, these technologies have evolved into a network of national
security, scientific, and commercially operated satellites complemented by powerful desktop
GIS. In addition, aerial remote sensing platforms, including unmanned aerial vehicles (e.g. the
GlobalHawk reconnaissance drone), are seeing increased non-military use as well. High quality
hardware and data is now available to new audiences such as universities, corporations, and non-
governmental organizations. The fields and sectors deploying these technologies are currently
growing at a rapid pace, informing decision makers on topics such as industrial engineering,
biodiversity conservation, forest fire suppression, agricultural monitoring, humanitarian relief,
and much more.
There are now a variety of types of geospatial technologies potentially applicable to human
rights, including the following:
Remote Sensing: imagery and data collected from space- or airborne camera and sensor
platforms. Some commercial satellite image providers now offer images showing details of one-
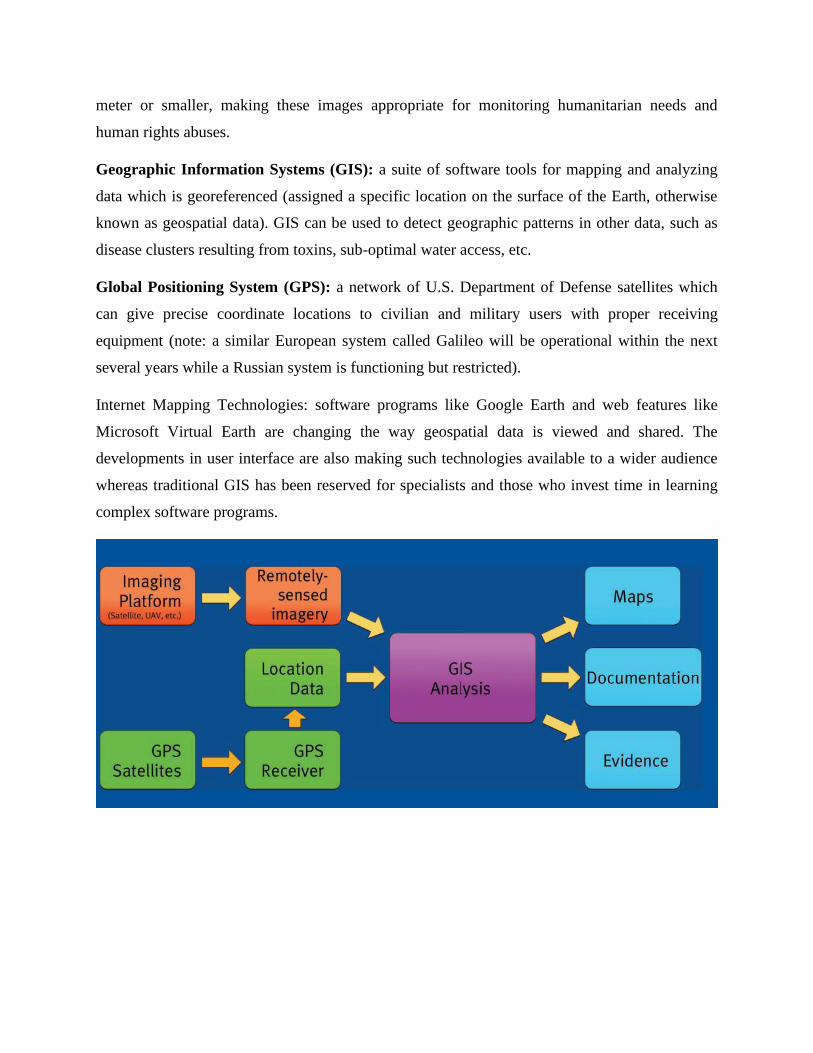
meter or smaller, making these images appropriate for monitoring humanitarian needs and
human rights abuses.
Geographic Information Systems (GIS): a suite of software tools for mapping and analyzing
data which is georeferenced (assigned a specific location on the surface of the Earth, otherwise
known as geospatial data). GIS can be used to detect geographic patterns in other data, such as
disease clusters resulting from toxins, sub-optimal water access, etc.
Global Positioning System (GPS): a network of U.S. Department of Defense satellites which
can give precise coordinate locations to civilian and military users with proper receiving
equipment (note: a similar European system called Galileo will be operational within the next
several years while a Russian system is functioning but restricted).
Internet Mapping Technologies: software programs like Google Earth and web features like
Microsoft Virtual Earth are changing the way geospatial data is viewed and shared. The
developments in user interface are also making such technologies available to a wider audience
whereas traditional GIS has been reserved for specialists and those who invest time in learning
complex software programs.
Questions for practice
1. What do you mean by network and internet?
2. Discuss about different types of network with examples.
3. What are the services provided by the internet?
4. What is TCP/IP?
5. What is WWW?
6. What is URL?
7. Define the terms Web Page, Web Site, Web browser and Web Server.
8. What is E-mail and write its advantages and disadvantages?
9. What is ICT? Write its role in agriculture.
10. Write about computer controlled devices for agri-input management.
11. Write short note on GPS and GIS.
12. Discuss about different types of computer models in agriculture.
Lesson-10
10. EXPERT SYSTEM FOR AGRICULTURE
10.1 Components of the Expert system:
The home page of the expert system has three important components viz., Information System,
Decision Support System, Diagnosing System (Crop Doctor)
A. Information System: Information system is web based static information wherein all the
technological and complementary information from A to Z about the crop are pooled and loaded
in this component. It is a ready reckoner and user-friendly navigation with image based
presentation, up scaling and updating the content at any time. The static information system is
highly useful for the extension officials, scientists, policy makers and administers.
B. Decision Support System: ¨ Decision support system is a computer-based information system
including knowledge based system that support decision making activities. A decision is a choice
between alternatives based on estimates of the values of those alternatives ¨ Accordingly, the
DSS has been contemplated and designed to get best possible options and decision by farmer
themselves for the day today agriculture operation. Customized tools such as Menus, Popup
Windows, Drop down Boxes or inter-related Multiple Combo Boxes, Video Plug-ins etc., were
incorporated using Dot net programme. ¨ The Decision Support System is consisting of details
about Season, Climate, Variety, Nursery Management, Cultivation Practices, Irrigation
Management, Nutrient Management, Crop Protection, Farm Implements, Post Harvest
Technology, Marketing, Institutions, Schemes and FAQ‟s.
C. Crop Doctor:Crop doctor is a vital component in the Expert system which acts as artificial
intelligence. It is picture and image based „if and then rule‟ based programme which has written
using Dot net programme. It deals with diagnosing the pest, disease and nutritional disorders
affecting the selected crops. The first obvious sign is given as thumbnail images in the Key
Visual Symptoms (Primary Symptom) with multiple sub levels (Secondary Symptoms). Farmers
by selecting the symptoms, they will make a conclusion on the causes for the damage,
identification of pest or pathogens, nutritional disorders and control measures to be taken in the
field. ¨ In crop doctor component of expert system, major pests, diseases and deficiency
disorders were included. ¨ Regarding management, different control methods like cultural 448
methods, chemical methods, biological methods, preventive methods, ecofriendly methods and
trap methods are given with suitable and relevant photographs. ¨ Nutrient management is the
major and most important practice that is to be carried out in correct time with suitable methods.
¨ Deficiency detection is the very crucial part in managing nutrients for proper crop production.
Crop doctor helps the user to decide the casual agent or reason behind the occurred symptom. ¨
After attaining the conclusion, different methods or choices to come out of the problem are given
in this system that is the main and vital role to ward off the problems of cultivation. ¨ Video
documentation of each and every method will guide the farmers to use the control measures in
proper way and it will give exposures like hands-on trainings. ¨ It provides flexibility in
management methods and gives autonomy state in the process of planning and execution of
control measures.
10.2 Soil Information System:
Soil Information System (SIS) solution is an industry leading soil map solution that uses
advanced sensors and intelligent targeting and geo-processing algorithms to produce high
resolution, accurate soil and topographic information. By providing a greater understanding of
the physical and chemical characterization of the soil, including how inputs move through the
soil, SIS enables farmers’ trusted advisors to implement more effective solutions to resolve the
unique challenges of each area of their fields. This soil map can be used to make critical farm
management decisions with irrigation, drainage, fertility, and more.
10.3 Key Features:
• Assess detailed soil properties for each field such as soil texture, compaction, root zone
depth, moisture retention and availability, and soil fertility.
• View soil analysis for the top 48 inches (122 cm) of the field’s surface in 3D.
• Download soil maps into your farm management software application, including Trimble
Ag Software or other third-party software systems.
• Create variable rate application maps from the soil map to help maximize plant growth.
10.4 Applications
➢ Pre –Purchase Land Evaluation
• SIS makes it possible to obtain a complete picture of the land you are considering before
purchase or development. With a SIS analysis you will be able to predict a field’s
potential for growing capacity and identify challenges that will come up in the course of
layout and planting. SIS helps growers avoid the pitfalls associated with sub-optimal soil
properties that can permanently limit crop quality and yield.
➢ Field Preparation and Field Design
The single greatest opportunity a grower has to influence the long-term output of any
field, vineyard, or orchard comes with the design and planting of a new field. Utilizing
the SIS ensures that growers are able to design and prepare fields that are optimized for
the long-term. SIS makes it possible to know precisely where to add deep-root
amendments, select and plant crop varieties based on known moisture holding
characteristics, and minimize in-field variability.
➢ Improve Crop Quality
SIS gives growers the tools they need to optimize growing conditions and improve
overall crop quality. Plant materials within a field may be uniform, but the soils in which
those crops grow are not. With SIS, growers can assess the variability within a field and
treat different zones according to their unique needs, thereby raising quality to the highest
grade achievable throughout the field.
➢ Optimize the Use of Water, Fertilizer and Amendments
Growers can immediately improve their bottom line by employing more efficient
watering, fertilizer, and amendment application strategies. The difficulty comes with
knowing where and to what degree you can reduce inputs without compromising crop
quality. SIS makes it possible to target applications – making sure expensive inputs are
used efficiently. Growers using SIS data no longer need to manage to the lowest common
denominator, instead they can take advantage of naturally occurring availability while
concentrating on helping low-productivity areas achieve higher yield and quality.
Questions for practice
1. What is expert system in agriculture?
2. What do you mean by DSS (decision support system)?
3. What is the role of crop doctor in agriculture?
4. What is SIS (soil information system)?
5. What are the key features of SIS?
6. What are the applications of SIS?
Lesson – 11
11. Preparation of contingent crop planning and crop calendars
using IT tools
11.1 Introduction
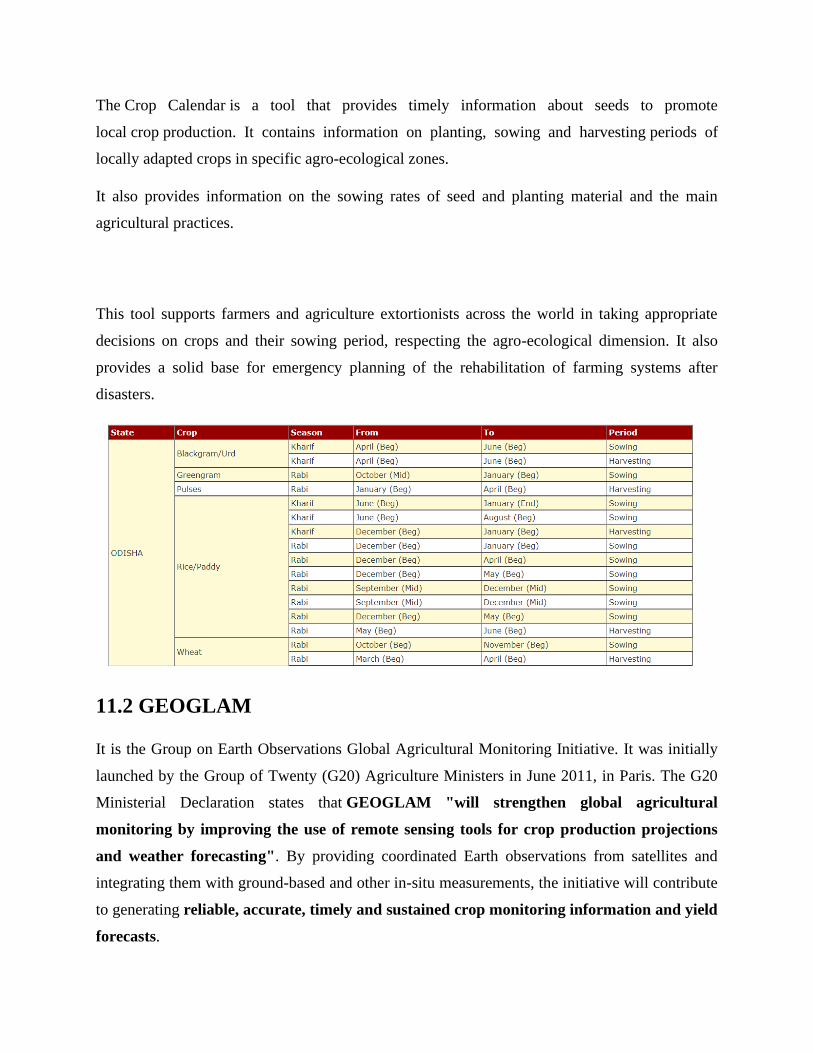
The Crop Calendar is a tool that provides timely information about seeds to promote
local crop production. It contains information on planting, sowing and harvesting periods of
locally adapted crops in specific agro-ecological zones.
It also provides information on the sowing rates of seed and planting material and the main
agricultural practices.
This tool supports farmers and agriculture extortionists across the world in taking appropriate
decisions on crops and their sowing period, respecting the agro-ecological dimension. It also
provides a solid base for emergency planning of the rehabilitation of farming systems after
disasters.
11.2 GEOGLAM
It is the Group on Earth Observations Global Agricultural Monitoring Initiative. It was initially
launched by the Group of Twenty (G20) Agriculture Ministers in June 2011, in Paris. The G20
Ministerial Declaration states that GEOGLAM "will strengthen global agricultural
monitoring by improving the use of remote sensing tools for crop production projections
and weather forecasting". By providing coordinated Earth observations from satellites and
integrating them with ground-based and other in-situ measurements, the initiative will contribute
to generating reliable, accurate, timely and sustained crop monitoring information and yield
forecasts.
GEOGLAM provides a framework which strengthens the international community’s capacity to
produce and disseminate relevant, timely and accurate forecasts of agricultural production at
national, regional and global scales through the use of Earth Observations (EO) including
satellite and ground-based observations. This initiative is designed to build on existing
agricultural monitoring programs and initiatives at national, regional and global levels and to
enhance and strengthen them through international networking, operationally focused research,
and data/method sharing.
Within this framework, GEOGLAM developed the Crop Monitor reports which provide global
crop condition assessments in support of the AMIS market monitoring activities. The first issue
of the Crop Monitor appeared in the September 2013 issue of the AMIS Market Monitor. Given
the success of the AMIS Crop Monitor, in 2016, GEOGLAM developed the Early Warning Crop
Monitor. The Early Warning Crop Monitor brings together international, regional, and national
organizations monitoring crop conditions within countries at risk of food insecurity.
11.3 IT application for computation of water and nutrient
requirement of crops
Crop yield gaps quantify the potential for yield increases. Closing yield gaps may require more
inputs, and a question is: how much? In analogy with the yield gap, the input gap is the
difference between the minimum amount of input(s) required for a target yield and the input use
under current practice. We developed a methodology to calculate nitrogen fertilizer requirements
and input gaps and present preliminary results for maize in Africa.
11.4 Methodology
We have combined existing model approaches:
Potential yield and water use are calculated with a crop model as function of crop characteristics
and global grid-based data of weather and soils.
Minimum fertilizer N requirement is calculated as function of target yield, indigenous soil N
supply (SNS), applied animal manure (MAN) and grain recovery efficiency of applied fertilizer
N (GRE), while maintaining soil N equilibrium, Calculation steps:
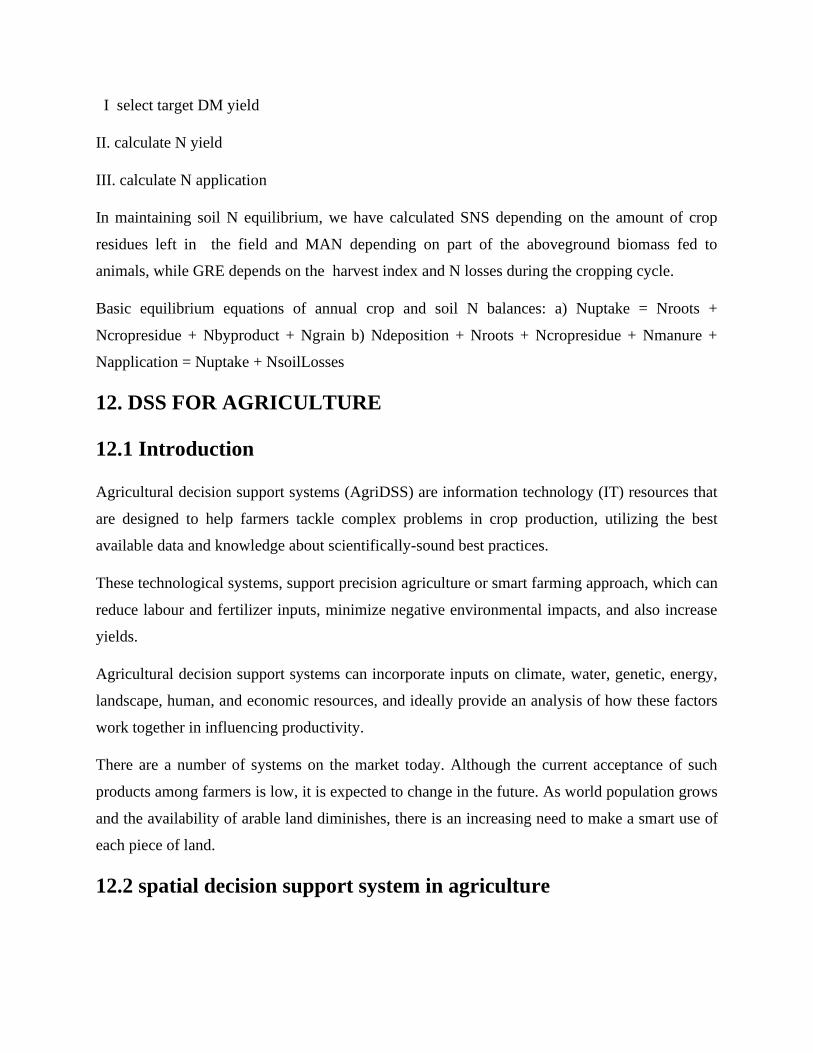
I select target DM yield
II. calculate N yield
III. calculate N application
In maintaining soil N equilibrium, we have calculated SNS depending on the amount of crop
residues left in the field and MAN depending on part of the aboveground biomass fed to
animals, while GRE depends on the harvest index and N losses during the cropping cycle.
Basic equilibrium equations of annual crop and soil N balances: a) Nuptake = Nroots +
Ncropresidue + Nbyproduct + Ngrain b) Ndeposition + Nroots + Ncropresidue + Nmanure +
Napplication = Nuptake + NsoilLosses
12. DSS FOR AGRICULTURE
12.1 Introduction
Agricultural decision support systems (AgriDSS) are information technology (IT) resources that
are designed to help farmers tackle complex problems in crop production, utilizing the best
available data and knowledge about scientifically-sound best practices.
These technological systems, support precision agriculture or smart farming approach, which can
reduce labour and fertilizer inputs, minimize negative environmental impacts, and also increase
yields.
Agricultural decision support systems can incorporate inputs on climate, water, genetic, energy,
landscape, human, and economic resources, and ideally provide an analysis of how these factors
work together in influencing productivity.
There are a number of systems on the market today. Although the current acceptance of such
products among farmers is low, it is expected to change in the future. As world population grows
and the availability of arable land diminishes, there is an increasing need to make a smart use of
each piece of land.
12.2 spatial decision support system in agriculture
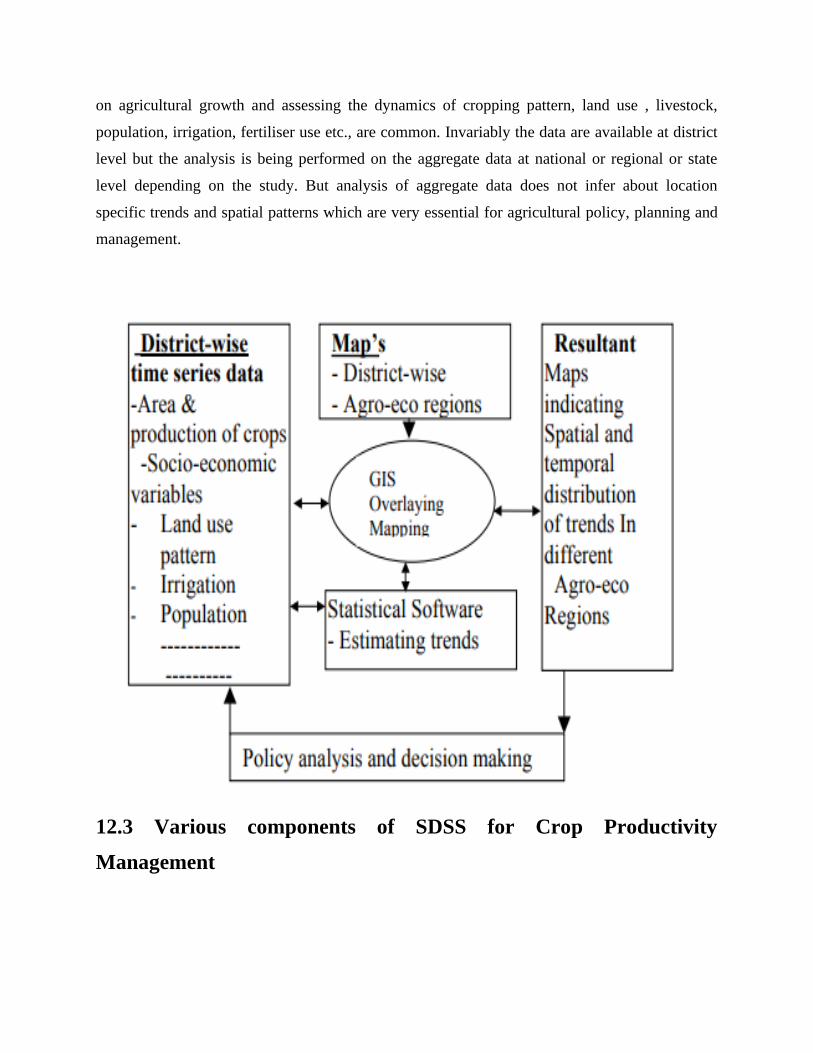
on agricultural growth and assessing the dynamics of cropping pattern, land use , livestock,
population, irrigation, fertiliser use etc., are common. Invariably the data are available at district
level but the analysis is being performed on the aggregate data at national or regional or state
level depending on the study. But analysis of aggregate data does not infer about location
specific trends and spatial patterns which are very essential for agricultural policy, planning and
management.
12.3 Various components of SDSS for Crop Productivity
Management
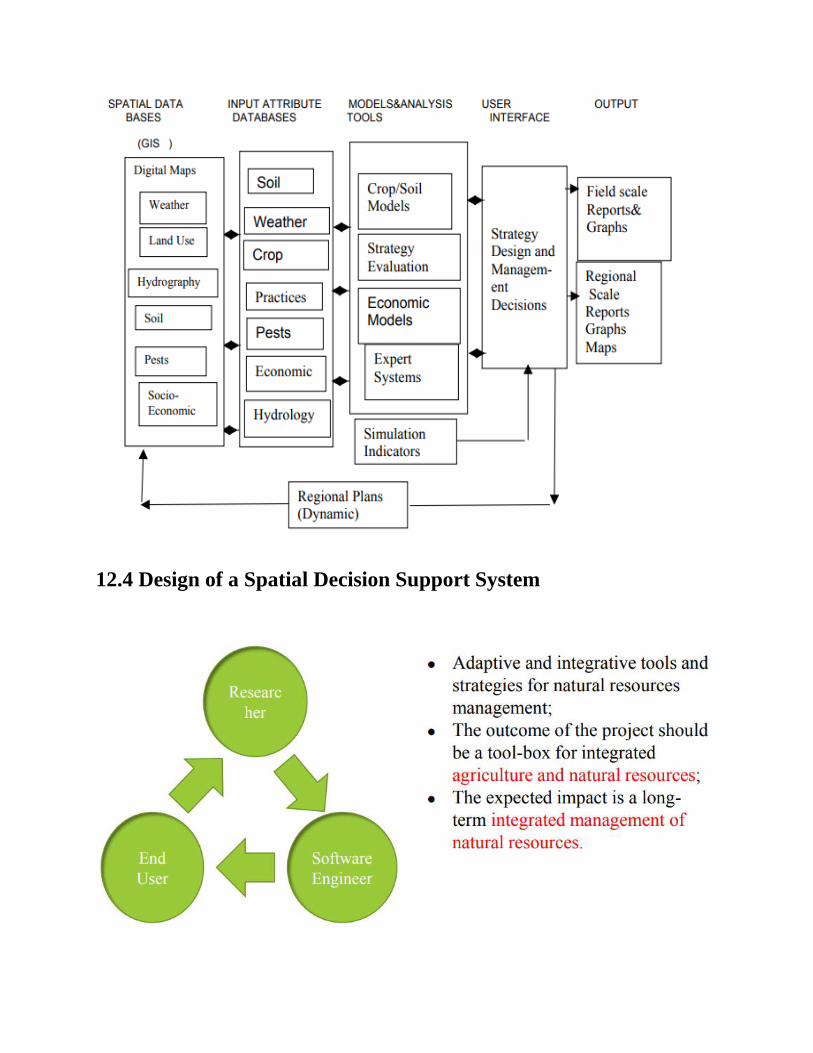
12.4 Design of a Spatial Decision Support System
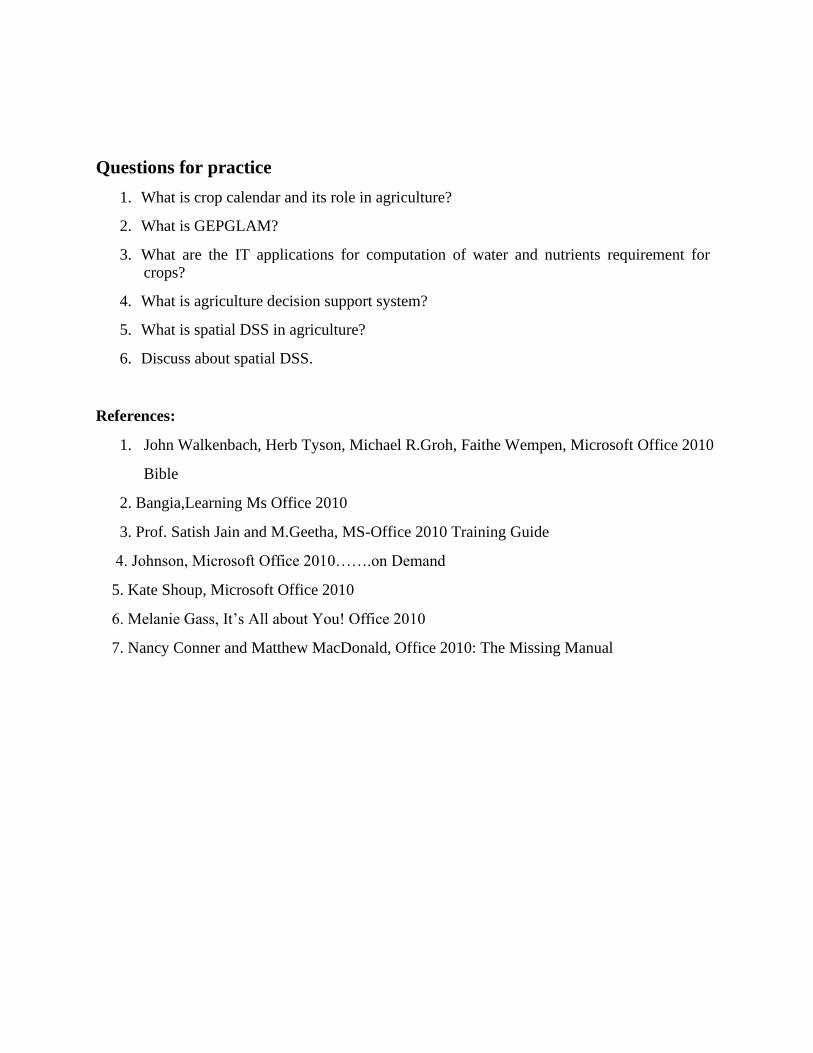
Questions for practice
1. What is crop calendar and its role in agriculture?
2. What is GEPGLAM?
3. What are the IT applications for computation of water and nutrients requirement for crops?
4. What is agriculture decision support system?
5. What is spatial DSS in agriculture?
6. Discuss about spatial DSS.
References:
1. John Walkenbach, Herb Tyson, Michael R.Groh, Faithe Wempen, Microsoft Office 2010
Bible
2. Bangia,Learning Ms Office 2010
3. Prof. Satish Jain and M.Geetha, MS-Office 2010 Training Guide
4. Johnson, Microsoft Office 2010…….on Demand
5. Kate Shoup, Microsoft Office 2010
6. Melanie Gass, It’s All about You! Office 2010
7. Nancy Conner and Matthew MacDonald, Office 2010: The Missing Manual