ms interpretation general interpretation strategies · fragmentation in api 25 rings and...
TRANSCRIPT

i Wherever you see this symbol, it is important to access the on-line course as there is interactive material that cannot be fully shown in this reference manual.
Mass Spectrometry
MS Interpretation
General Interpretation Strategies

Aims and Objectives
Aims and Objectives Aims • Introduces students to the principles of mass spectral interpretation. • Present fundamental concepts regarding mass spectral interpretation
Objectives At the end of this Section you should be able to:
• List and explain the main characteristics of the mass spectrum • Explain how mass spectrometric data can be used for structure analysis • Explain why is important to optimise ESI/APCI parameters

© Crawford Scientific www.chromacademy.com 2
Content Introduction 3 Mass to Charge Ratio 4 Mass Resolution 5 Doublet Method 6 Resolution of Single Peak 7 High Mass Resolution 8 Mass Accuracy 9 High Mass Accuracy 9 Mass Range 10 Multiply Charged Ions 11 Spectral Features 13 Isotopic abundances 14 High Mass Region –Brominated Sample 21 The Nitrogen Rule 23 Interpretation Strategy 24 Logical Losses 24 Illogical losses 25 Fragmentation in API 25 Rings and Insaturations 26 Number of Carbons 27 Cleavages –Ion Abundance 29 Cleavages –Simple Mechanisms 30 Electrospray Ionisation 32 ESI Considerations 33 APCI Considerations 35 APPI Considerations 36 LC-MS Structural Information Modes 37 MS/MS Overview 38 MS/MS Experiments 39 Product Ion Scanning 40 Overview 40 Application 41 Precursor Ion Scanning 42 Overview 42 Application 43 Constant Neutral Loss Scanning 44 Overview 44 Application 45 Single/Multiple Reaction Monitoring 46 Overview 46 Application 47 MS/MS Quantitative Considerations 48 References 49

© Crawford Scientific www.chromacademy.com
3
Introduction Mass Spectrometry is a wide-ranging analytical technique. It relates to the production and subsequent separation and identification of charged species that are produced by a variety of ionisation methods. The importance of learning how to identify mass spectra lies in the fact that we cannot create a standard library for the identification of any single chemical compound (the mass spectrum of a single compound could contain a huge amount of information and the number of chemical compounds is extremely huge). Nowadays standard libraries could include a few hundred thousands spectra. A simple mass spectrum is represented by a two dimensional bar plot, the height of the bar (y component) is related to the intensity of the mass fragment ion and its location on the spectra (x component) is related to the charge to mass ratio.[1]
Mass Spectrum
Remember: Ionisation is the process whereby electrons are either removed or added to atoms or molecules to produce ions. In LCMS, neutral molecules may be charged (producing cations in the positive ion mode or anions in the negative ion mode) by a number of different ways according to the selected ionisation interface.

© Crawford Scientific www.chromacademy.com
4
Mass to Charge Ratio The mass spectrum of an analyte species is represented by a bar graph that plots signal abundance of the ions against mass-to-charge (m/z). This represents the mass of a given particle (Da) to the number (z) of electrostatic charges (e) that the particle carries. The term m/z (measured in Da/e) is the parameter of the particle that is measured by the mass analyzer. Prior to 1980 the mass-to-charge ratio was often incorrectly defined as m/e, where e is the charge on an electron (1.6 x 10⁻¹⁹ Coulomb). The mass of a given particle is equal to the sum of the atomic masses in daltons (Da) of all of the elements that compose it.[1,2,3] Because many ions carry only one electrostatic charge the ratio m/z is frequently referred to as the particle ‘mass’; however, this can be misleading when dealing with certain analyte species such as proteins which readily carry more than one fundamental charge.
Dalton: One Dalton is the mass of a proton or neutron –an ethyl group has a mass of 27. The symbol for the mass unit is u, the use of u is no longer recommended by IUPAC (International Union of Pure and Applied Chemists) but Da.[2] The symbol u corresponds to 1/12 the mass of 12C, which is assigned the value 12.000000 under IUPAC convention. Naturally occurring carbon is 98.892% 12C and 1.108% 13C. The mass of 12C is 12 Da, and that of 13C is 13.00335 Da. Therefore, the average atomic mass of carbon is: (0.98892)×(12 Da) + (0.01108) × (13.00335 Da) ≈ 12.01 Da

© Crawford Scientific www.chromacademy.com
5
Mass Resolution Mass resolution (Rm) is the ability of a mass analyser to separate two adjacent peaks. The resolving power of a mass analyser is described by the equation below:[5] Rm = m/Δm Or in terms of parts-per-million: ppm = 106 x m/Δm = 106 x Rm In practice the resolving power of a mass analyser is determined by one of the next two methods:[6]
• Doublet method • Resolution of a single peak
Resolution is usually defined in one of two ways depending on the mass spectrometer being used.
Monoisotopic, nominal and average mass calculations: For the molecule of Butyric acid (C4H8O2) calculate:
• Monoisotopic mass • Nominal mass • Average mass
Table 1. Properties of atoms in CH3CH2CH2COOH.
Element Molecular weight (Da)
Average Lightest Isotope Most abundant H 1.00794 1.00783 1.00783 O 15.9994 15.9949 15.9949 C 12.0107 12 12
Monoisotopic mass: The mass of the ion or molecule calculated by summing the atomic masses of the lightest isotopes. 4×12+8×1.00783+2×15.9949 = 88.05244 Da Nominal mass: (the mass of an ion or molecule calculated using the mass of the most abundant isotope of each element rounded to the nearest integer value. 4×12 + 8×1 + 2×16 = 88 Da Average mass: (the value calculated from the average masses of the elements, weighted for abundance) 4×12.0107+8×1.00794+2×15.9994 = 88.10512 Da

© Crawford Scientific www.chromacademy.com
6
The 10% valley (intensity) definition states that two peaks are considered to be resolved when they are separated by a valley, which is 10% of the height of each. This definition is used with magnetic sector instruments. The definition used with quadrupole, ion trap and time of flight mass spectrometers is based on a peak width measured at 50% peak height (full width half maximum or FWHM) Doublet Method
Resolution of two peaks
The doublet method states that the two presented peaks are resolved if:
1. IVALLEY < 10% IMIN (magnetic sector instruments). 2. IVALLEY < 50% IMIN (quadrupole, ion trap and time of flight instruments)
Here m is the measured or average mass and Δm is the mass difference between the two adjacent peaks. Note that resolution will have slightly different values depending on whether the FWHM, 10% or 50% valley definitions are used. Two molecules of identical nominal (integral) mass and different elemental composition, such as Ar and C3H4 will differ significantly; e.g. 39.96239 and 40.06386. Any mass analyser which can operate with a resolving power of at least 394.3 will be able to distinguish between these two species.
Resolution of two molecules with the same nominal mass
m/z
Int
IMAX
IMIN
m1 m1
ΔmIVALLEY
m/z
%Int100
50
40[Ar] = 39.96239 Da
Δm
40[C3H4] = 40.06386 Da
39.9 40.0 40.1
Δm= 40.06386 - 39.96239 = 0.10147 Rm = m/Δm
Rm(required) = 40.013125 / 0.10147 = 394.3

© Crawford Scientific www.chromacademy.com
7
Resolution of Single Peak
Resolution of single peak
If IX = 50% IMAX, then Δm is designated Full Width at Half Maximum (FWHM). Usually Δm is taken to be at half of the peak height (50% of IMAX) and Δm is designated Full Width at Half Maximum (FWHM). In some cases the peak width is measured at 5% of the peak height.[7] Note that resolution will have different values depending on whether Δm is measured (5% or 50% of IMAX). The resolving power required to resolve a peak can be easily calculated.
Resolution of a single peak
m/z
Int
m
Δm
IMAX
IX
m/z
%Int100
50 Δm
501 502 503
Δm = 0.21734Da
m = 501.96431Da
m = 501.96431Da Δm = 0.21734Da
Rm = m/Δm Rm =501.96431/0.21734 = 2309.58089
© Crawford Scientific www.chromacademy.com
8
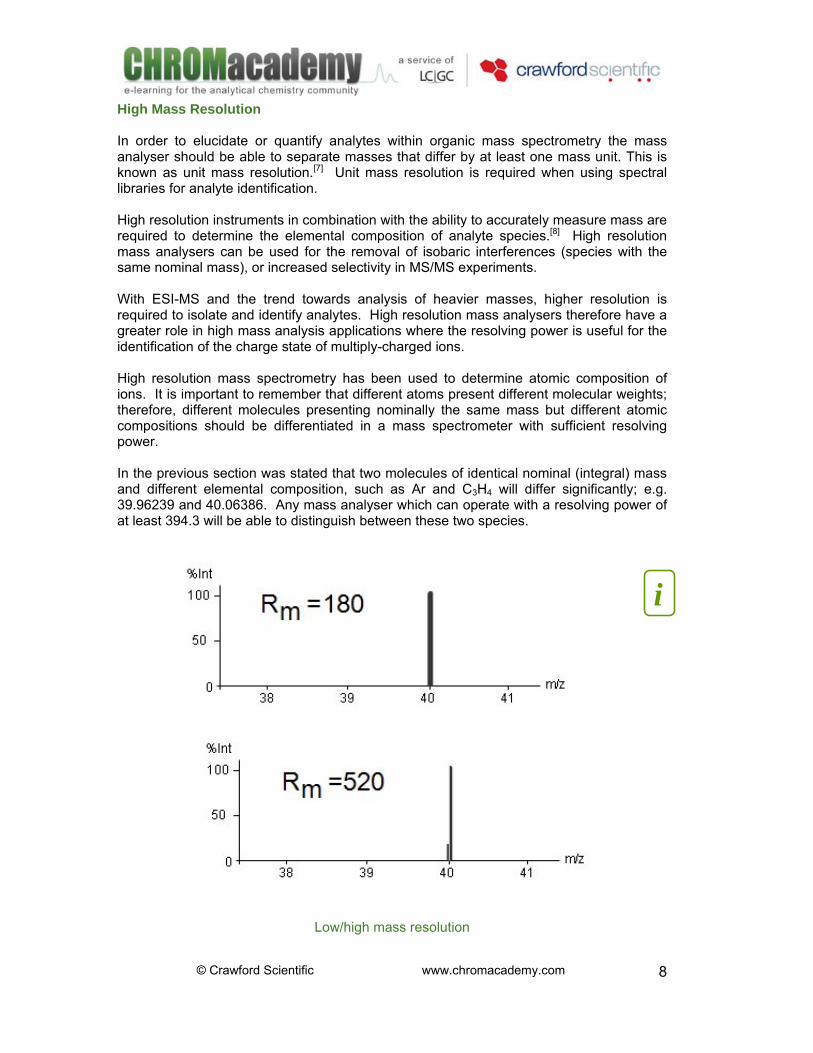
High Mass Resolution In order to elucidate or quantify analytes within organic mass spectrometry the mass analyser should be able to separate masses that differ by at least one mass unit. This is known as unit mass resolution.[7] Unit mass resolution is required when using spectral libraries for analyte identification. High resolution instruments in combination with the ability to accurately measure mass are required to determine the elemental composition of analyte species.[8] High resolution mass analysers can be used for the removal of isobaric interferences (species with the same nominal mass), or increased selectivity in MS/MS experiments. With ESI-MS and the trend towards analysis of heavier masses, higher resolution is required to isolate and identify analytes. High resolution mass analysers therefore have a greater role in high mass analysis applications where the resolving power is useful for the identification of the charge state of multiply-charged ions. High resolution mass spectrometry has been used to determine atomic composition of ions. It is important to remember that different atoms present different molecular weights; therefore, different molecules presenting nominally the same mass but different atomic compositions should be differentiated in a mass spectrometer with sufficient resolving power. In the previous section was stated that two molecules of identical nominal (integral) mass and different elemental composition, such as Ar and C3H4 will differ significantly; e.g. 39.96239 and 40.06386. Any mass analyser which can operate with a resolving power of at least 394.3 will be able to distinguish between these two species.
Low/high mass resolution
i

© Crawford Scientific www.chromacademy.com
9
Mass Accuracy Mass accuracy is the measurement of the closeness of the given measurement to the true mass of the analyte. In this instance Δ m accuracy denotes the difference between a measured value (mmeasured) and the true mass (mtrue) of a substance.[9] Δ maccuracy = mtrue — mmeasured
In practice all mass analysers should be calibrated to the nearest mass unit and accurate assignment of mass is essential to virtually every aspect of mass analysis. Instruments should be evaluated to assess drift over extended operating periods with figures of around 0.1Da being reasonable. Exact mass measurement is done with very high accuracy (ppm) and in practice this requires high resolution in conjunction with high mass accuracy in order to rule out the possibility of isobaric interferences. High Mass Accuracy Mass instability may arise from many sources including the stability of the instruments electronics, temperature fluctuations, tuning and contamination of the mass analyser etc. Mass accuracy must be maintained throughout the entire mass range and even small changes in mass accuracy can have an adverse effect on the interpretation of spectra, and quantitative results. High mass accuracy is referred to as exact mass measurement, and when measuring the mass of a particular compound at the ppm level in mass accuracy, it is possible to unambiguously determine elemental composition. Knowledge of the elemental composition of a molecular or fragment ion is one of the most powerful analytical tools for identifying and elucidating the structure of unknowns. In practice, mass accuracy and high resolution are closely related.

© Crawford Scientific www.chromacademy.com
10
To observe the isotopic profile of an ion, resolution must increase with m/z —a resolution of approximately twice the ion mass is required for isotopic resolution. The table below presents typical resolution, mass range and accuracy for several types of mass analyser Table 2 “resolution, mass range and accuracy for selected mass analyser types”
Instrument Resolution Mass Range Mass Accuracy
Quadrupole 500-2000 2 – 2000Da 0.1Da
Ion Trap 500-2000 100-2000Da 0.1Da
Time of Flight 500-12,000 50 – 1x10⁶Da 0.0001Da
Magnetic Sector 800-50,000 2 - 15,000Da 0.0001Da Mass spectra of species with mass greater than 2000 Da can change as the isotopic mass distribution from the heavier isotopes shifts.[10] In general, high mass range is considered as any species with a mass of more than 2,000 Da. Mass Range Mass analysers measure mass-to-charge ratio (m/z). The difference between the highest and lowest measurable m/z denotes the mass analyser range. The difference between mass resolution, mass accuracy and mass range is shown. Electrospray ionisation allows more than one fundamental charge to reside on the gas phase molecule of interest (allowing the molecule to be measured at a lower m/z). An increase in z will extend the upper mass limit of the analyzer Time-of-flight (TOF) mass analysers present no upper mass limit. Recent developments in rapid ion detection are promoting TOF to be the first choice for high mass analysis. The mass range of any particular analyser is governed by the instrument configuration and its ability to generate gas phase ionic species.
Remember: Accuracy: Degree of agreement between the best-estimated found value and its true value. Precision: Is defined as the extent to which results correspond to each other. Reproducibility: Refers to the agreement between analyses in different laboratories and include variations in equipments.

© Crawford Scientific www.chromacademy.com
11
Mass spectrum details Multiply Charged Ions It is possible that during the API process the analyte molecule will acquire two or more electrostatic charges, due to the molecular conformation, numbers of functional moieties capable of ionisation etc. Doubly charged ions are produced when gaseous species acquire two electrostatic charges per molecule. Doubly charged ions present a peak in the mass spectrum at an m/z value exactly half of the mass of the molecular (singly charged) ion. Some analyte species (high molecular weight proteins and peptides are good examples) may acquire many electrostatic charges during the API process. These species are known as ‘multiply-charged’ ions. Signals coming from multiply charged ions often need to be de-convoluted to establish the number of charges that the ion carries and to obtain information on its true molecular weight.[3] Certain high molecular weights compounds presenting the ability of holding multiple charges can be analysed with traditional mass analysers. The m/z ratio (the property that is measured by the analyzer) decreases with the number of electrostatic charges held by the ion. Hence compounds that would otherwise be beyond the mass range of typical instruments can be analysed since the m/z ratio of the multiply-charged ion is within the mass range of the instrument.
© Crawford Scientific www.chromacademy.com
12
S
NH2
O
N
O
NOO
NH
NH
HH
NH2O
OHN
O NH2
OO
N
NH
NH2
O
N
O
NH2 N NH2
NH2
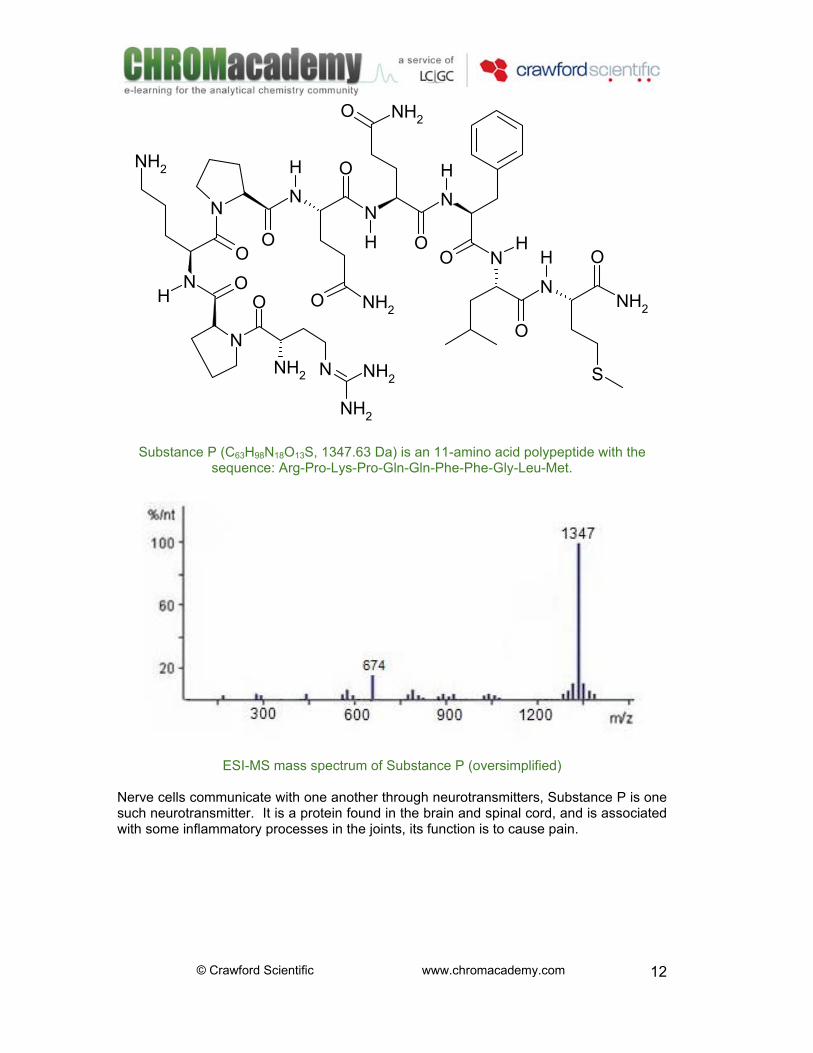
Substance P (C63H98N18O13S, 1347.63 Da) is an 11-amino acid polypeptide with the sequence: Arg-Pro-Lys-Pro-Gln-Gln-Phe-Phe-Gly-Leu-Met.
ESI-MS mass spectrum of Substance P (oversimplified) Nerve cells communicate with one another through neurotransmitters, Substance P is one such neurotransmitter. It is a protein found in the brain and spinal cord, and is associated with some inflammatory processes in the joints, its function is to cause pain.

© Crawford Scientific www.chromacademy.com
13
Spectral Features Molecular ions represent intact species. They are precursors for all fragment ions that constitute the spectrum. The molecular-ion peak appears at an m/z value numerically equal to the nominal molecular weight of the compound (the weight calculated by summing the atomic masses of the most abundant isotope of each atom composing the molecule). Very often in API-MS adducts ions are formed due to in-source gas phase reactions. Molecular species such as [M+H]+ or [M-H]- appear at one mass unit above or below the nominal molecular mass of the analyte species. The base peak refers to the most intense peak in the mass spectrum and is used as the reference peak when normalising all peaks within the spectrum.[4] The relative intensity of a peak expresses its intensity relative to the base peak. The relative intensity of any peak is conventionally displayed as either Abundance or % on the y-axis of the mass spectrum.
Acetone mass spectrum (oversimplified)
Important: Molecular Ion: The ionised form of the molecule
−+ +→ eMM ... The ion .+M is known as the molecular ion. An ion formed by the removal from (positive ions) or addition to (negative ions) a molecule of one electron without fragmentation of the molecular structure. Base Peak: This peak presents the highest intensity in the spectrum
i

© Crawford Scientific www.chromacademy.com
14
Isotopic abundances Isotopes are atoms with the same atomic number but different atomic weight. The difference in weight between isotopes of the same element is caused by a difference in the number of neutrons. The relative abundance of an isotope in nature compared to other isotopes of the same element is relatively constant.[5, 6, 7, 8, 9, 10, 11] The isotopic abundances of the elements can be classified into three general categories:
• "A": Elements with one natural isotope in appreciable abundance. • "A+1": Elements with two natural isotopes, the second being one mass unit
heavier than the most abundant isotope. • "A+2": Elements with two natural isotopes, the second being two mass units
heavier than the most abundant isotope. The high mass region in some cases permits infer if “A+2” elements are present:[5] Table 3. Relative abundances of selected isotopes
Atom Mass %R.A. “A” %R.A. “A+1” %R.A. “A+2”
Hydrogen 1.0078 100 Oxygen 15.9949 100 Fluorine 19.8884 100
Phosphorous 30.9738 100 Carbon 12.0000 100 1.1 Nitrogen 14.0031 100 0.37 Chlorine 34.9989 100 32.5 Bromine 78.9183 100 98 Iodine 126.9045 100
Sulphur 31.9720 100 0.8 4.4 Where %R.A. is the percentage of relative abundance Once the molecular ion is identified, then a normalization process must be done. Isotopic lines must be referred as a percentage of the molecular ion. The halogens are particularly useful as their isotope patterns are very characteristic and easy to recognise.
• Compounds containing single chlorine exhibits a pair of lines separated 2 Da and in relative abundance of 3:1.
• Compounds containing single bromine exhibits a pair of lines separated 2 Da and in relative abundance of 1:1.
• Similar analysis can be done with elements as Si or S. • If more than one “A+2” elements are present in a molecule, then the spectrum
becomes complex.

© Crawford Scientific www.chromacademy.com
15
The high mass region of the spectrum can be used to infer about the presence of certain isotopic elements. 1. Identify molecular ion and isotope cluster. 2. If A+2 abundance is lower than 98% of A abundance then NO bromines are present. 3. If A+2 abundance is lower than 33% of A abundance then NO chlorines are present. 4. If A+2 abundance is lower than 4.4% of A abundance then NO sulphur is present.
• Sulphur's A+1 isotope will provide a 0.8% contribution to A+1 abundance. 5. If A+2 abundance is lower than 3.4% of A abundance then NO silicon is present.
• Silicon's A+1 isotope will provide a 5.1% contribution to A+1 abundance. • This combination of A+1 and A+2 abundances make silicon easy to identify.
6. Multiple carbon atoms (and nitrogens) provide additional A+2 abundance that must be accounted for. Table 4. A+2 Intensities
Intensity of “A+2” peak lower than Sample 98% A abundance Bromine is not present 33% A abundance Chlorine is not present 4.4% A abundance Sulphur is not present 3.4% A abundance Silicon is not present
Characteristic high mass region spectrums for samples containing selected “A+2” elements are presented below.
Important: The high mass region of the spectrum in some cases permits infer if “A+2” elements are present:[5]
• Compounds containing single chlorine exhibits a pair of lines separated 2 Da and in relative abundance of 3:1.
• Compounds containing single bromine exhibits a pair of lines separated 2 Da and in relative abundance of 1:1.
• Similar analysis can be done with elements as Si or S. • If more than one “A+2” elements are present in a molecule, then
the spectrum becomes complex.

© Crawford Scientific www.chromacademy.com
16
High mass region of samples containing seleceted “A+2” elements

© Crawford Scientific www.chromacademy.com
17
Table 5. Relative abundances of selected isotopes Name Symbol Mass Abund. Symbol Mass Abund. Symbol Mass Abund. Symbol Mass Abund.
Aluminum. Al(27) 26.98154 100 Antimony. Sb(121) 120.9038 57.3 Sb(123) 122.9042 42.7
Argon. Ar(36) 35.96755 0.34 Ar(38) 37.96273 0.063 Ar(40) 39.96238 99.6 Arsenic. As(75) 74.9216 100 Barium. Ba(130) 129.9063 0.11 Ba(132) 131.905 0.1 Ba(134) 133.9045 2.42
Ba(135) 134.9057 6.59 Ba(136) 135.9046 7.85 Ba(137) 136.9058 11.23 Ba(138) 137.9052 71.7 Beryllium Be(9) 9.012183 100 Bismuth Bi(209) 208.9804 100 Boron B(10) 10.01294 19.8 B(11) 11.00931 80.2
Bromine Br(79) 78.91834 50.69 Br(81) 80.91629 49.31 Cadmium Cd(106) 105.9065 1.25 Cd(110) 109.903 12.49 Cd(111) 110.9042 12.8 Cd(112) 111.9028 24.13
Cd(113) 112.9044 12.22 Cd(114) 113.9034 28.73 Cd(116) 115.9048 7.49 Calcium Ca(40) 39.96259 96.95 Ca(42) 41.95862 0.65 Ca(43) 42.95877 0.14 Ca(44) 43.95549 2.086
Ca(46) 45.95369 0.004 Ca(48) 47.95253 0.19 Carbon C(12) 12 98.9 C(13) 13.00336 1.1 Cerium Ce(136) 135.9071 0.19 Ce(138) 137.906 0.25 Ce(140) 139.9054 88.48 Ce(142) 141.9092 11.08 Cesium Cs(133) 132.9054 100 Chlorine Cl(35) 34.96885 75.77 Cl(37) 36.9659 24.23
Chromium Cr(50) 49.94605 4.35 Cr(52) 51.94051 83.79 Cr(53) 52.94065 9.5 Cr(54) 53.93888 2.36 Cobalt Co(59) 58.9332 100 Copper Cu(63) 62.9296 69.17 Cu(65) 64.92779 30.83
Dysprosium Dy(156) 155.9243 0.06 Dy(158) 157.9244 0.1 Dy(160) 159.9252 2.34 Dy(161) 160.9269 18.9 Dy(162) 161.9268 25.5 Dy(163) 162.9287 24.9 Dy(164) 163.9292 28.2
Erbium Er(162) 161.9288 0.14 Er(164) 163.9292 1.61 Er(166) 165.9303 33.6 Er(167) 166.9321 22.95 Er(168) 167.9324 26.8 Er(170) 169.9355 14.9
Europium Eu(151) 150.9199 47.8 Eu(153) 152.9212 52.2 Fluorine F(19) 18.9984 100

© Crawford Scientific www.chromacademy.com
18
Table 5. Relative abundances of selected isotopes (cont.) Name Symbol Mass Abund. Symbol Mass Abund. Symbol Mass Abund. Symbol Mass Abund.
Gallium Ga(69) 68.92558 60.1 Ga(71) 70.9247 39.9 Gadolinium Gd(152) 151.9198 0.2 Gd(154) 153.9209 2.18 Gd(155) 154.8226 14.8 Gd(156) 155.9221 20.47
Gd(157) 156.924 15.65 Gd(158) 157.9241 24.84 Gd(160) 159.9271 21.86 Germanium Ge(70) 69.92425 20.5 Ge(72) 71.92208 27.4 Ge(73) 72.92346 7.8 Ge(74) 73.92118 36.5
Ge(76) 75.9214 7.8 Gold Au(197) 196.9666 100
Hafnium Hf(174) 173.9401 0.16 Hf(176) 175.9414 5.2 Hf(177) 176.9432 18.6 Hf(178) 177.9437 27.1 Hf(179) 178.9458 13.74 Hf(180) 179.9466 35.2
Helium He(3) 3.016029 0.0001 He(4) 4.002603 100 Holmium Ho(165) 164.9303 100 Hydrogen H(1) 1.007825 99.99 H(2) 2.014102 0.015
Indium In(113) 112.9041 4.3 In(115) 114.9039 95.7 Iodine I(127) 126.9045 100 Iridium Ir(191) 190.9606 37.3 Ir(193) 192.9629 62.7
Iron Fe(54) 53.93961 5.8 Fe(56) 55.93494 91.72 Fe(57) 56.9354 2.2 Fe(58) 57.93328 0.28 Krypton Kr(78) 77.9204 0.35 Kr(80) 79.91638 2.25 Kr(82) 81.91348 11.6 Kr(83) 82.91413 11.5
Kr(84) 83.91151 57 Kr(86) 85.91061 17.3 Lanthanum La(138) 137.9071 0.09 La(139) 138.9064 99.91
Lead Pb(204) 203.973 1.4 Pb(206) 205.9745 24.1 Pb(207) 206.9759 22.1 Pb(208) 207.9766 52.4 Lithium Li(6) 6.015123 7.42 Li(7) 7.016005 92.58
Lutetium Lu(175) 174.9408 97.4 Lu(176) 175.9427 2.6 Magnesium Mg(24) 23.98505 78.9 Mg(25) 24.98584 10 Mg(26) 25.9826 11.1 Manganese Mn(55) 54.93805 100
Mercury Hg(196) 195.9658 0.15 Hg(198) 197.9668 10.1 Hg(199) 198.9683 17 Hg(200) 199.9683 23.1 Hg(201) 200.9703 13.2 Hg(202) 201.9706 29.65 Hg(204) 203.9735 6.8
Molybdenum Mo(92) 91.90681 14.84 Mo(94) 93.90509 9.25 Mo(95) 94.90584 15.92 Mo(96) 95.90468 16.68 Mo(97) 96.90602 9.55 Mo(98) 97.90541 24.13 Mo(100) 99.90747 9.63
Neodymium Nd(142) 141.9077 27.13 Nd(143) 142.9098 12.18 Nd(144) 143.9101 23.8 Nd(145) 144.9126 8.3 Nd(146) 145.9131 17.19 Nd(148) 147.9169 5.76 Nd(150) 149.9209 5.64

© Crawford Scientific www.chromacademy.com
19
Table 5. Relative abundances of selected isotopes (cont.) Name Symbol Mass Abund. Symbol Mass Abund. Symbol Mass Abund. Symbol Mass Abund. Neon Ne(20) 19.99244 90.6 Ne(21) 20.99385 0.26 Ne(22) 21.99138 9.2 Nickel Ni(58) 57.93535 68.27 Ni(60) 59.93079 26.1 Ni(61) 60.93106 1.13 Ni(62) 61.92835 3.59
Ni(64) 63.92797 0.91 Niobium Nb(93) 92.90638 100 Nitrogen N(14) 14.00307 99.63 N(15) 15.00011 0.37 Osmium Os(184) 183.9525 0.02 Os(186) 185.9539 1.58 Os(187) 186.9558 1.6 Os(188) 187.9559 13.3
Os(189) 188.9582 16.1 Os(190) 189.9585 26.4 Os(192) 191.9615 41 Oxygen O(16) 15.99492 99.76 O(17) 16.99913 0.038 O(18) 17.99916 0.2
Palladium Pd(102) 101.9056 1.02 Pd(104) 103.904 11.14 Pd(105) 104.9051 22.33 Pd(106) 105.9035 27.33 Pd(108) 107.9039 26.46 Pd(110) 109.9052 11.72
Phosphorus P(31) 30.97376 100 Platinum Pt(190) 189.9599 0.01 Pt(192) 191.961 0.79 Pt(194) 193.9627 32.9 Pt(195) 194.9648 33.8
Pt(196) 195.9649 25.3 Pt(198) 197.9679 7.2 Potassium K(39) 38.96371 93.2 K(40) 39.964 0.012 K(41) 40.96183 6.73
Praseodymium Pr(141) 140.9077 100 Rhenium Re(185) 184.953 37.4 Re(187) 186.9558 62.6 Rhodium Rh(103) 102.9055 100 Rubidium Rb(85) 84.9118 72.17 Rb(87) 86.90918 27.84
Ruthenium Ru(96) 95.9076 5.52 Ru(98) 97.90529 1.88 Ru(99) 98.90594 12.7 Ru(100) 99.90422 12.6 Ru(101) 100.9056 17 Ru(102) 101.9043 31.6 Ru(104) 103.9054 18.7
Samarium Sm(144) 143.912 3.1 Sm(147) 146.9149 15 Sm(148) 147.9148 11.3 Sm(149) 148.9172 13.8 Sm(150) 149.9173 7.4 Sm(152) 151.9197 26.7 Sm(154) 153.9222 22.7
Scandium Sc(45) 44.95591 100 Selenium Se(74) 73.92248 0.9 Se(76) 75.91921 9 Se(77) 76.91991 7.6 Se(78) 77.9173 23.5
Se(80) 79.91652 49.6 Se(82) 81.91671 9.4 Silicon Si(28) 27.97693 92.23 Si(29) 28.9765 4.67 Si(30) 29.97377 3.1Silver Ag(107) 106.9051 51.84 Ag(109) 108.9048 48.16
Sodium Na(23) 22.98977 100 Strontium Sr(84) 83.91343 0.56 Sr(86) 85.90927 9.86 Sr(87) 86.9089 7 Sr(88) 87.90563 82.58

© Crawford Scientific www.chromacademy.com
20
Table 5. Relative abundances of selected isotopes (cont.) Name Symbol Mass Abund. Symbol Mass Abund. Symbol Mass Abund. Symbol Mass Abund. Sulfur S(32) 31.97207 95.02 S(33) 32.97146 0.75 S(34) 33.96787 4.21 S(36) 35.96708 0.02
Tantalum Ta(180) 179.9475 0.012 Ta(181) 180.948 99.99 Tellurium Te(122) 121.9031 2.6 Te(123) 122.9043 0.91 Te(124) 123.9028 4.82 Te(125) 124.9044 7.14
Te(126) 125.9033 18.95 Te(128) 127.9045 31.69 Te(130) 129.9062 33.8 Terbium Tb(159) 158.9254 100 Thallium Tl(203) 202.9723 29.52 Tl(205) 204.9744 70.48 Thorium Th(232) 232.0381 100 Thulium Tm(169) 168.9342 100
Tin Sn(112) 111.9048 0.97 Sn(114) 113.9028 0.65 Sn(115) 114.9033 0.36 Sn(116) 115.9017 14.7 Sn(117) 116.903 7.7 Sn(118) 117.9016 24.3 Sn(119) 118.9033 8.6 Sn(120) 119.9022 32.4 Sn(122) 121.9034 4.6 Sn(124) 123.9053 5.6
Titanium Ti(46) 45.95263 8 Ti(47) 46.95177 7.3 Ti(48) 47.94795 73.8 Ti(49) 48.94787 5.5 Ti(50) 49.94479 5.4
Tungsten W(180) 179.9467 0.13 W(182) 181.9482 26.3 W(183) 182.9502 14.3 W(184) 183.951 30.67 W(186) 185.9544 28.6
Uranium U(234) 234.0409 0.006 U(235) 235.0439 0.72 U(238) 238.0508 99.27 Vanadium V(50) 49.94716 0.25 V(51) 50.94396 99.75
Xenon Xe(124) 123.9059 0.1 X(126) 125.9043 0.09 Xe(128) 127.9035 1.91 Xe(129) 128.9048 26.4 Xe(130) 129.9035 4.1 Xe(131) 130.9051 21.2 Xe(132) 131.9041 26.9 Xe(134) 133.9054 10.4 Xe(136) 135.9072 8.9
Ytterbium Yb(168) 167.9339 0.13 Yb(170) 169.9348 3.05 Yb(171) 170.9363 14.3 Yb(172) 171.9364 21.9 Yb(173) 172.9382 16.12 Yb(174) 173.9389 31.8 Yb(176) 175.9426 12.7
Yttrium Y(89) 88.90586 100 Zinc Zn(64) 63.92915 48.6 Zn(66) 65.92604 27.9 Zn(67) 66.92713 4.1 Zn(68) 67.92485 18.8
Zn(70) 69.92533 0.6 Zirconium Zr(90) 89.90471 51.45 Zr(91) 90.90564 11.27 Zr(92) 91.90504 17.17 Zr(94) 93.90632 17.33
Zr(96) 95.90827 2.78

© Crawford Scientific www.chromacademy.com
21
High Mass Region –Brominated Sample In the present example we are going to explore the high mass region of a bromobenzene sample. As was explained before, in some cases, the high mass region (of a mass spectrum) permits infer if “A+2” elements are present. For practical purposes we are going to consider that our presented spectrum was obtained under the right conditions (all parameters optimised). Remember: When analysing high mass region signals, you should: 1. Identify the molecular Ion (“A” peak) 2. Calculate the Normalising Factor (NF), according to the formula:
IonMolecularIntensityNF 100
=
3. Normalise high mass region signals (multiply all intensities by NF) 4. Compare your spectrum (if possible) with generic high mass spectrums
Bromobenzene mass spectrum (oversimplified)
i

© Crawford Scientific www.chromacademy.com
22
1. Molecular Ion (“A” peak): • Located at m/z = 156. • Intensity 61.9
2. NF = 100/(Intensity Molecular Ion) = 100/61.9 3. Normalise signals (multiply intensities by NF) Table 6. Normalisation process
m/z signal Intensity Normalised Intensity 156 61.9 61.9 × 100 / 61.9 = 100 158 60.9 60.9 × 100 / 61.9 = 97.9
4. Compare with generic spectrums
Note that the general appearance of the high mass region closely matches the generic spectrum for compounds possessing one bromine atom per structure.

© Crawford Scientific www.chromacademy.com
23
The Nitrogen Rule The “Nitrogen Rule” states that:[13] “A compound with an odd molecular weight will have an odd number of nitrogen’s. Compounds with an even molecular weight will have either no nitrogen or an even number of nitrogen atoms”. Therefore if you have identified the molecular ion and it is odd you can assume an odd number of nitrogen atoms are present. Molecules with an ODD number of nitrogen atoms have ODD masses. Ions which result from simple fragmentation have EVEN masses. Molecules with an EVEN number of nitrogen atoms (cero is an even number) have EVEN molecular weights. Ions which result from simple fragmentation have ODD masses.
N-methyl-2-butanamine (C5H13N, 87.16 Da) mass spectrum (oversimplified)
Important: Molecules with an ODD number of nitrogen atoms have ODD masses. Ions which result from simple fragmentation have EVEN masses. Molecules with an EVEN number of nitrogen atoms (cero is an even number) have EVEN molecular weights. Ions which result from simple fragmentation have ODD masses.
i NH
N-methyl-2-butanamine
(C5H13N, 87.16 Da)
© Crawford Scientific www.chromacademy.com
24
Interpretation Strategy 1. Ionisation type. Consider what type of ion source was used to produce the MS spectrum (soft like ESI or harsh like electron impact). 2. General inspection of the spectrum. Does it have many lines (easily broken bonds) or does it have relatively few lines (stable ions). Information that needs to be considered from the mass spectrum:
• Mass of fragments • Presence of isotopes lines • Gaps between lines
3. Find the molecular ion if possible. Molecular ions are not always present in the spectrum. In some cases higher mass adduct ions can be formed making difficult the molecular ion identification. The presence of the molecular ion can be confirmed by the use of “logical and illogical losses” 4. Identify the highest m/z fragment. Is this fragment the molecular ion? If this fragment has an odd m/z value and effectively is the molecular ion, then the presence of an odd number of nitrogen atoms in the molecule can be expected (the nitrogen rule).[13] 5. Try to find “A+2” elements. By inspection (high mass region of the spectrum), try to find the number and the kind(s) of “A+2” elements. 6. Propose possible structures. Use all of the information available from the spectrum plus other available techniques. Logical Losses Logical losses are used to confirm the molecular ion. The use of the logical losses should only be considered as losses from the molecular ion. Table 7. Some important logical looses
From Bond Cleavage From rearrangements Fragment Mass Neutral Molecule Mass
H 1 H2 2 CH3 15 NH3 17
NH2 or O (from NO) 16 H2O 18 OH 17 C2H2 26 F 19 HCN 27
CN 26 CO or C2H4 28 C2H3 27 CH2O 30
C2H5 or CHO 29 CH3OH 32 NO 30 H2S 34
OCH3 or CH2OH 31 C3H6 or C2H2O 42 SH or H2O+CH3 33 CO2 44
Cl 35 C2H5OH 46 C3H7 or CH3CO 43 C3H7OH or CH3CO2H 60
NO2 46 C6H6 78 C4H9 57 HBr 80

© Crawford Scientific www.chromacademy.com
25
1. Losses of neutral molecules can occur from both radicals and cations. 2. Loss of a neutral molecule results in a fragment which is an odd electron ion. 3. The loss of a neutral molecule can only occur through "concerted“ intramolecular atom transfer and elimination. This is a less likely process than simple bond fragmentation. 4. The loss of a neutral molecule from an even mass molecular ion usually results in an even fragment in the mass spectrum. Illogical losses Illogical losses can be used to confirm the molecular ion. In compounds containing C, H, N, O it is virtually impossible to lose 5-13 Daltons Similarly losses of 21-25 Daltons are also virtually impossible Table 8. Some illogical looses
Fragment Mass Neutral Molecule Mass H3 3 B 11 He 4 BH or C 12
HeH 5 CH 13 ½ C 6 N or CH2 14 Li 7 NeH 21
LiH or He2 8 B2 22 Be 9 BC 23
BeH 10 C2 24 There are no possible losses from the molecular ion that would correspond to the masses presented in the previous table. These “rules” apply to losses from either the molecular ion or fragment ions, but only losses from the molecular ion are easy to identify. If you see ions in these regions from your proposed molecular ion then it isn’t the molecular ion!! Fragmentation in API ESI, APCI and APPI are soft ionisation techniques, i.e. the registered spectra tend to show very little fragmentation. That is during the formation of ions, the analyte molecules do not receive enough energy to break the intra-molecular bonds. However, under certain conditions these techniques can produce considerable fragmentation (especially with labile molecules or when API parameters are not optimised). The major problem with these ionisation techniques is that fragmentation and ion clustering can occur if the parameters are not optimised. An abundant molecular ion with low intensity fragment ions indicates a stable molecular structure e.g. aromatic, cyclic, and conjugated. A low intensity molecular ion with many intense fragment ions indicates a weak molecular structure e.g. aliphatic, acyclic, saturated, etc.

© Crawford Scientific www.chromacademy.com
26
The next table presents some typical fragments produced from common organic compounds. Table 9. Typical fragments on selected organic compounds Compound type Formula Typical Fragments Alkanes +
+12nnHC 15, 29, 43, 57, 71, 85…
Alkenes, Cycloalkanes +nn HC 2 28, 42, 56, 70, 84…
Cycloalkenes +−12nn HC 27, 41, 55, 69, 83…
Aldehydes, Ketones +− OHC nn 12 29, 41, 55, 69, 83…
Amines ++ NHC nn 22 30, 44, 58, 72, 86…
Alcohols, Ethers ++ OHC nn 12 31, 45, 59, 73, 87…
Acids, Esters +− OHC nn 12 45, 59, 73, 87…
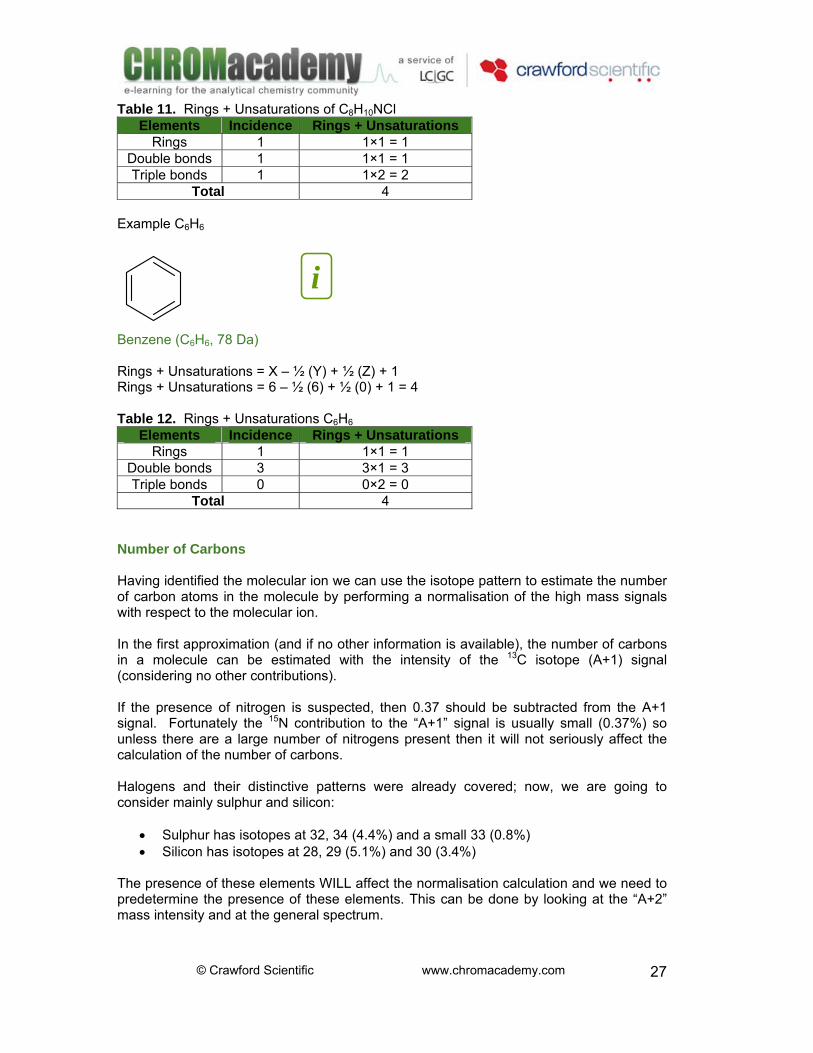
Aromatic compounds 91, 77 Rings and Insaturations The number of rings and insaturations (very useful for structural confirmation) can be calculated according to the expression: Rings + Insaturations = X – ½ (Y) + ½ (Z) + 1 X = Carbon and Silicon Y = Hydrogen, Chlorine, Fluorine and Iodine Z = Nitrogen and Phosphorous Table 10. Rings + Insaturations values
If the structure presents Rings + InsaturationsOne ring 1
One double bond 1 One triple bond 2
When applied to suspected molecular ion, It provides two pieces of information:
• If the answer is an integer then the proposed formula is an odd electron molecule and maybe the molecular ion
• If the answer is a non-integer then it is NOT the molecular ion Example C8H10NCl
Cl
NH2
Rings + Insaturations = X – ½ (Y) + ½ (Z) + 1 Rings + Insaturations = 8 – ½ (10+1) + ½ (1) + 1 = 4
i
© Crawford Scientific www.chromacademy.com
27
Table 11. Rings + Unsaturations of C8H10NCl Elements Incidence Rings + Unsaturations
Rings 1 1×1 = 1 Double bonds 1 1×1 = 1 Triple bonds 1 1×2 = 2
Total 4 Example C6H6
Benzene (C6H6, 78 Da) Rings + Unsaturations = X – ½ (Y) + ½ (Z) + 1 Rings + Unsaturations = 6 – ½ (6) + ½ (0) + 1 = 4 Table 12. Rings + Unsaturations C6H6
Elements Incidence Rings + Unsaturations Rings 1 1×1 = 1
Double bonds 3 3×1 = 3 Triple bonds 0 0×2 = 0
Total 4 Number of Carbons Having identified the molecular ion we can use the isotope pattern to estimate the number of carbon atoms in the molecule by performing a normalisation of the high mass signals with respect to the molecular ion. In the first approximation (and if no other information is available), the number of carbons in a molecule can be estimated with the intensity of the 13C isotope (A+1) signal (considering no other contributions). If the presence of nitrogen is suspected, then 0.37 should be subtracted from the A+1 signal. Fortunately the 15N contribution to the “A+1” signal is usually small (0.37%) so unless there are a large number of nitrogens present then it will not seriously affect the calculation of the number of carbons. Halogens and their distinctive patterns were already covered; now, we are going to consider mainly sulphur and silicon:
• Sulphur has isotopes at 32, 34 (4.4%) and a small 33 (0.8%) • Silicon has isotopes at 28, 29 (5.1%) and 30 (3.4%)
The presence of these elements WILL affect the normalisation calculation and we need to predetermine the presence of these elements. This can be done by looking at the “A+2” mass intensity and at the general spectrum.
i

© Crawford Scientific www.chromacademy.com
28
A sample containing only carbon and hydrogen was analysed under ESI/MS2 conditions (all parameters were optimised), giving the next spectrum. The molecular ion was identified to be located at m/z = 142. With the information provided, estimate the number of carbons present in the molecule.
Hydrocarbon MS/MS mass spectrum
In order to estimate the number of carbons in the molecule, we have to centre our attention into the high mass region of the spectrum. Molecular Ion (“A” peak):
• Located at m/z = 142. • Intensity 740
NF = 100/(Intensity Molecular Ion) = 100/740 Table 13. Normalise signals (multiply intensities by NF)
m/z signal Intensity Normalised Intensity 139 74 74 × 100/740 = 10 140 74 74 × 100/740 = 10 141 518.7 581.7 × 100/740 = 70.1 142 740 740 × 100/740 = 100 143 91 91 × 100/740 = 12.3
The total number of carbon atoms in the molecule is given by the normalised abundance of the “A+1” signal divided by the isotopic abundance of 13C that is 1.1: # Carbon atoms = 12.3/1.1 = 11.2 (±10% for statistical errors) # Carbon atoms = 11.2 ± 1.12 = 10.1 to 12.3 = 10 to 12
750
600
450
300
150
m/z40 70 100 130
High mass regionAb
unda
nce
i

© Crawford Scientific www.chromacademy.com
29
Hydrocarbon MS/MS High mass region
Table 14. Possible structures
No Carbon atoms No Hydrogen atoms Possibility 10 142 - 12×10 = 22 Yes 11 142 – 11×12 = 10 Yes 12 142 – 12×12 = -2 No
• Alkane C10H22 (zero “Rings + Unsaturations”) • Aromatic C11H10 (seven “Ring + Unsaturations”).
At this point, it is not possible to confirm which structure is the one responsible for the spectrum; however, alkanes produce a lot of fragmentation, the aromatic option is the most reasonable answer. Cleavages –Ion Abundance Ion abundance is a function of its stability. This is related to how easy it is for a charge to be delocalised through the ion. The general rule of thumb is that if a charge is very localised (all concentrated on one atom) the ion is much less stable than if the charge is spread out over several atoms. The cation stability is affected by the presence of hetero-atoms or functional groups. Alkyl groups present electron donating (stabilizing) effect.
C+ R
However certain groups withdraw electrons and destabilize the cation.
C+ X
100
80
60
40
20
%Int
m/z142 142
Abun
danc
e
100%
12.3%

© Crawford Scientific www.chromacademy.com
30
Table 14. Inductive effect of selected groups Electron Donating Electron Withdrawing
CH3- -NO2 CH3-CH2- -CN
CH3-CH-CH3 -COOH Important: Ion fragments can experience further fragmentations!!! Table 15. Ion stability
Ion Name Increasing Stability
CH2+
Benzyl
CH2=CH-CH2+ Allyl
CH3 C+
CH3
CH3
Tertiary
CH3
C+
CH3
H
Secondary
CH3CH2+ Primary
CH3+ Methyl
Cleavages –Simple Mechanisms An alpha cleavage is a mechanism which involves 2 one electron transfer processes. This results in a bond cleavage one bond away from the ionisation site (α position) whilst the charge remains at the site of ionisation.
i

© Crawford Scientific www.chromacademy.com
31
The process is radical initiated and can occur as a sequential fragmentation with cyclic compounds. Typical ionisation sites which can undergo this type of fragmentation include:
• Nitrogen • Phosphorous • Oxygen • Sulphur • C=C bonds
When alkenes fragment, they tend to give series of ions corresponding to allylic fragmentations (ß- to the double bond). It is well known that during the fragmentation of cyclo-alkanes olefins are eliminated. Cyclo-alkenes presenting a six member ring do show a characteristic retro Diels-Alder fragmentation.
i

© Crawford Scientific www.chromacademy.com
32
Electrospray Ionisation Electrospray ionization (ESI) has emerged as a very important ionisation technique capable of producing either singly as multiply charged ions (according to the chemical nature of the analyte and eluent system). It provides a rapid and accurate means of analysing a wide range of polar and ionisable molecules. Electrospray tend to show very little fragmentation due to the 'soft' nature of the processes. Analyte molecules do not receive enough energy to break the intra-molecular bonds. In general ESI produces protonated [M+H]+ in positive ion mode and deprotonated [M-H]- in negative ion mode. Comparing the registered ESI mass spectra in positive and negative ion mode should be done whenever possible; because, it could reveals the nature of the molecular ion.
ESI(-) mass spectra of α-naphthoic acid (20% methanol in water) Under ESI conditions, some molecules produce abundant adduct ions like [M+Na]+ or [M+NH4]+. Analysis conditions must be optimised and it is important NOT to assume that the highest recorded ion peak corresponds to an M+1 or M-1 ion.
i
© Crawford Scientific www.chromacademy.com
33
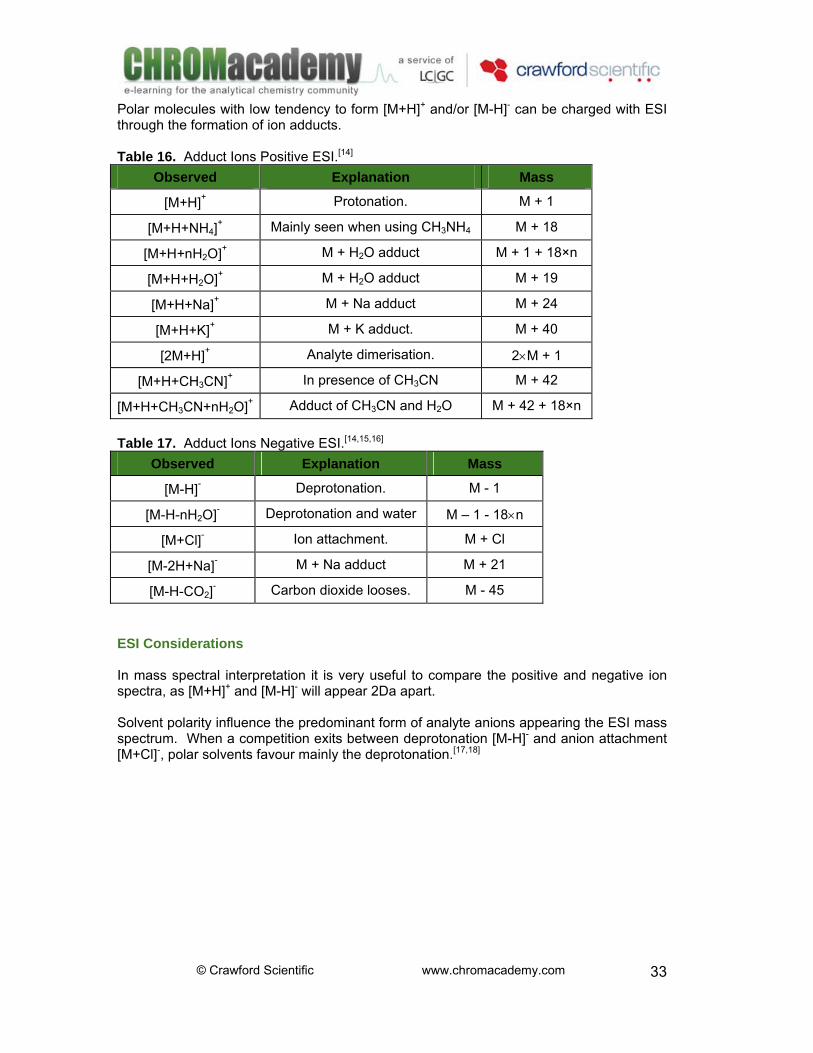
Polar molecules with low tendency to form [M+H]+ and/or [M-H]- can be charged with ESI through the formation of ion adducts. Table 16. Adduct Ions Positive ESI.[14]
Observed Explanation Mass
[M+H]+ Protonation. M + 1
[M+H+NH4]+ Mainly seen when using CH3NH4 M + 18
[M+H+nH2O]+ M + H2O adduct M + 1 + 18×n
[M+H+H2O]+ M + H2O adduct M + 19
[M+H+Na]+ M + Na adduct M + 24
[M+H+K]+ M + K adduct. M + 40
[2M+H]+ Analyte dimerisation. 2×M + 1
[M+H+CH3CN]+ In presence of CH3CN M + 42
[M+H+CH3CN+nH2O]+ Adduct of CH3CN and H2O M + 42 + 18×n Table 17. Adduct Ions Negative ESI.[14,15,16]
Observed Explanation Mass
[M-H]- Deprotonation. M - 1
[M-H-nH2O]- Deprotonation and water M – 1 - 18×n
[M+Cl]- Ion attachment. M + Cl
[M-2H+Na]- M + Na adduct M + 21
[M-H-CO2]- Carbon dioxide looses. M - 45
ESI Considerations In mass spectral interpretation it is very useful to compare the positive and negative ion spectra, as [M+H]+ and [M-H]- will appear 2Da apart. Solvent polarity influence the predominant form of analyte anions appearing the ESI mass spectrum. When a competition exits between deprotonation [M-H]- and anion attachment [M+Cl]-, polar solvents favour mainly the deprotonation.[17,18]

© Crawford Scientific www.chromacademy.com
34
ESI(-) of 1.0% aniline in different solvents (93 Da Da)
ESI(-) of 0.1gL/mL of galactosyl ceramide (697 Da)
i
i

© Crawford Scientific www.chromacademy.com
35
Care should be taken in the interpretation of electrospray spectra when the analysis has taken place in the presence of additives or contaminants (such as ammonium or sodium ions). Analytes with high molecular masses (typically up to 200,000Da) may acquire many electrostatic charges during the ESI process. A series of multiply charged species are thus produced. Multiply charged ions can be processed by the data system to give a molecular weight profile with a mass accuracy of ±0.01% (100ppm). This process is termed deconvolution. APCI Considerations APCI spectra tend to show very little fragmentation due to the 'soft' nature of the ionisation processes. That is during the formation of ions, the analyte molecules do not receive enough energy to break the intra-molecular bonds. The major problem with APCI is fragmentation and ion clustering that can occur if the parameters are not optimised. When using air the primary ions produced in the APCI interface are often limited to [H+(H2O)n] and [O2
-(H2O)n].[20] Depending on the reactant gas, hydrogen transfer may not occur and instead secondary ions react with analyte molecules to give adducts rather than protonated molecules.[21,22,23] Unlike ESI, APCI does not produce a multiply charged series, and so is unsuitable for the analysis of high molecular weight compounds such as proteins and polymers. Table 18. Adduct Ions Positive APCI.[20,21,22,23]
Observed Explanation Mass
[M+H]+ Protonation. M + 1
[M+H+nH2O]+ M + H2O adduct M + 1 + 18×n
[M+H+H2O]+ M + H2O adduct M + 19
[M+H+CH3CN]+ In presence of CH3CN M + 42
[M+H+CH3CN+nH2O]+ Adduct of CH3CN and H2O M +43 + 18×n
[M-R]+ Aliphatic or organic looses. M - R
[M+NH4]+ Ammonium adduct. M + 18
[M+NH4-R]+ Ammonium adduct. M + 18 - R Table 19. Adduct Ions Negative APCI.[20,21,22,23]
Observed Explanation Mass
[M-H]- Deprotonation. M - 1
[2M-H]- Analyte dimerisation. 2×M – 1
[M+Cl]- Ion attachment. M + Cl
© Crawford Scientific www.chromacademy.com
36
APPI Considerations The basic mechanism of photoionization is:
−+ +→+ eMhM ν In some instances, which seem to correlate with molecules of low proton affinity, the molecular ion M+ is observed; however, the predominant ion observed in APPI is [M+H]+ which suggests the possible involvement of a chemical reaction with the solvent S:
][][ HSHMSM −++→+ ++ However there is not certain if this process dominates at atmospheric pressure. In the presence of easily photo-ionised molecules (like toluene or acetone) that are called dopants the analyte of interest is indirectly ionised:
][][ HDHMDM −++→+ ++ Here D represents the dopant. When the last mechanism dominates the process is termed dopant assisted APP APPI is not limited to the positive ion mode. In negative ion mode, low energy electrons (produced from dopant molecules) can be absorbed by other species.
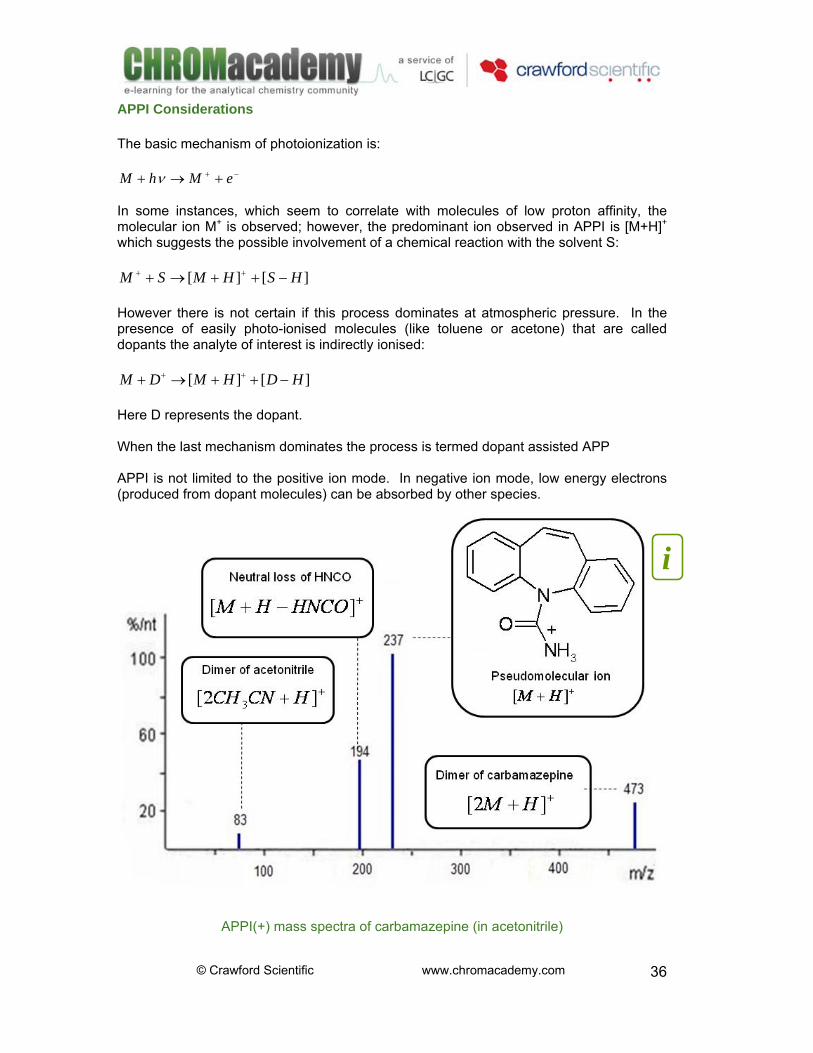
APPI(+) mass spectra of carbamazepine (in acetonitrile)
i

© Crawford Scientific www.chromacademy.com
37
Solvent molecules and other species present in the eluent system can form adduct ions with the analyte. Table 20. Selected common ions in APPI positive ion mode
Specie Mass +M M
++ ][ HM M + 1 ++ ]2[ HM 2 × M + 1 ++ ][ NaM M + Na
+−+ ][ 2OnHHM M + 1 – 18 × n +−+ ][ RHM M + 1 - R +++ ][ nSHM M + 1 – S × n
Solvent molecules and other species present in the eluent system can form adduct ions with the analyte. Table 21. Selected common ions in APPI negative ion mode
Specie Mass −M M
−− ][ HM M - 1 −− ]2[ HM 2 × M - 1 −−− ][ RHM M - 1 + R −+− ][ SHM M – 1 + S
−−+− ][ RSHM M – 1 + S - R −+ ][ ClM M + Cl
LC-MS Structural Information Modes As was pointed out API spectra tend to show very little fragmentation due to the 'soft' nature of the ionisation processes. That is during the formation of ions, the analyte molecules do not receive enough energy to break the intra-molecular bonds. By increasing the voltage difference ΔV(S-Q) or ΔV(N-S)], the frequency and energy of collisions imparted to the analyte molecule increase causing intra-molecular bonds to be broken and fragmentation to occur.[24,25]

© Crawford Scientific www.chromacademy.com
38
Erithromycin CID experiment MS/MS Overview API ionisation techniques (ESI, APCI, APPI) are soft ionisation techniques that produce spectra with little or no fragmentation, this simplifies the spectra considerably; however, this also means less structural information available (no fragmentation pattern). Fragmentation pattern is important when undertaken:
• Structure elucidation, the fragmentation pattern of any molecule is a very powerful tool to elucidate its structure.
• Identity confirmation, when preliminary information about existence of certain compound is available then its confirmation based on raw fragmentation data can be achieved.
Tandem mass spectrometry (or MS/MS analysis) is used to regain structural information by fragmenting ions (that in this case were produced in the API interface). The hardware used to perform MS/MS experiments usually includes a combination of two mass analysers and a collision cell:
• First mass analyser, used to select the initial ion(s) of interest. • Collision cell, where the ion(s) of interest receive enough collisional energy to
fragment. • Second mass analyser, used to collect and measure the fragment ions of interest.
MS/MS can also be performed in a single specially designed analyser (like ion trap mass analyser).
i
© Crawford Scientific www.chromacademy.com
39
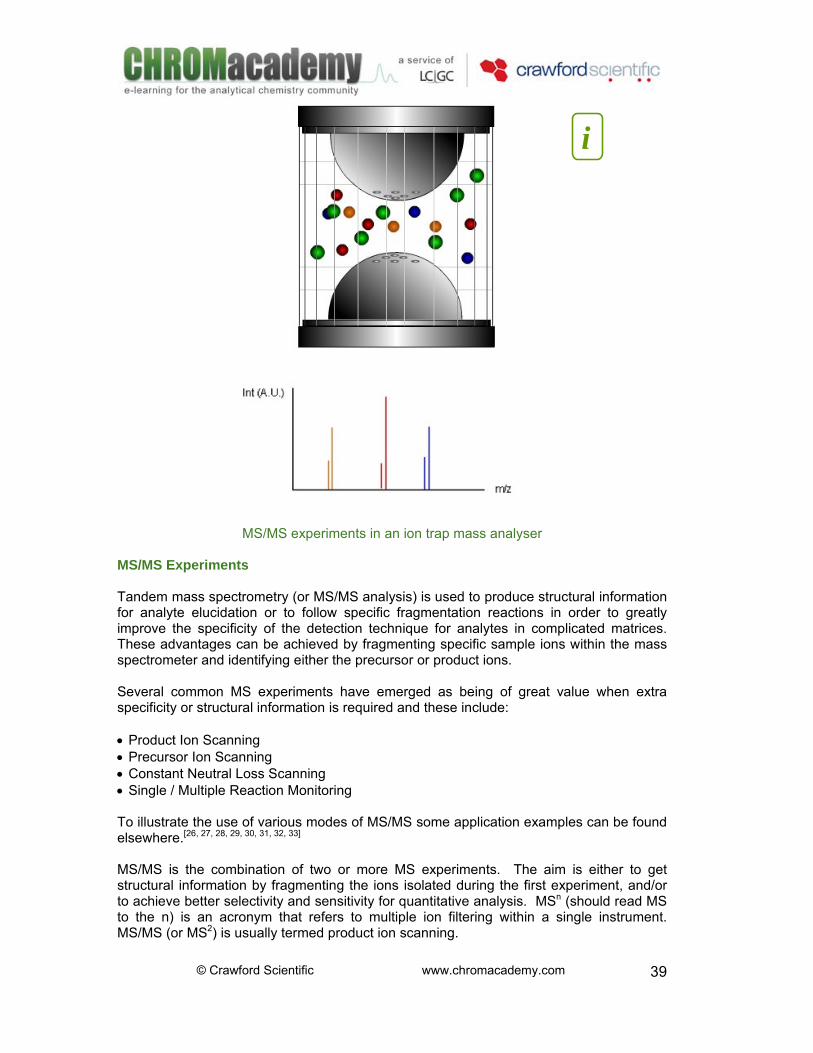
MS/MS experiments in an ion trap mass analyser
MS/MS Experiments Tandem mass spectrometry (or MS/MS analysis) is used to produce structural information for analyte elucidation or to follow specific fragmentation reactions in order to greatly improve the specificity of the detection technique for analytes in complicated matrices. These advantages can be achieved by fragmenting specific sample ions within the mass spectrometer and identifying either the precursor or product ions. Several common MS experiments have emerged as being of great value when extra specificity or structural information is required and these include: • Product Ion Scanning • Precursor Ion Scanning • Constant Neutral Loss Scanning • Single / Multiple Reaction Monitoring To illustrate the use of various modes of MS/MS some application examples can be found elsewhere.[26, 27, 28, 29, 30, 31, 32, 33]
MS/MS is the combination of two or more MS experiments. The aim is either to get structural information by fragmenting the ions isolated during the first experiment, and/or to achieve better selectivity and sensitivity for quantitative analysis. MSn (should read MS to the n) is an acronym that refers to multiple ion filtering within a single instrument. MS/MS (or MS2) is usually termed product ion scanning.
i

© Crawford Scientific www.chromacademy.com
40
Product Ion Scanning Overview The first mass analyser is set to transmit a specific ion (usually the pseudomolecular ion) to the collision cell where its fragmentation takes place. The fragment ions thus produced are then transmitted to the last mass analyser where structural information is gathered. This mode gives molecular weight and structural information about the specific ion selected.
In product ion scanning, the precursor ion (ion of interest) is focussed in Q1 and transferred to fragment into Q2. All fragment ions are then measured by scanning Q3 and structural information of original ion is gathered.
i
i

© Crawford Scientific www.chromacademy.com
41
This method is useful to identify compounds. Application Product Ion Scanning can be used as a confirmatory method for the presence certain analyte. In the present application, a wheat sample is going to be tested for the presence of trinexapac acid. The wheat sample is first extracted with acetonitrile in aqueous phosphate buffer and then injected to the analyser. If ions of m/z = 225 (ESI positive ion mode) are detected from the sample, then pseudomolecular ions ++ ][ HAcidTrinexapac can be suspected. The fragmentation pattern of these ions can be used to confirm identity.
Trinexapac acid:
Trinexapac acid is used to improve seed quality and shoot counts in some cultivars. Due regulations, its content in human food needs to be controlled.
OHO
O
O
OH
Trinexapac acid (C11H12O5, 224 Da)

© Crawford Scientific www.chromacademy.com
42
Only ions of m/z = 225 are allowed to pass through Q1, then they fragment in Q2 and all fragments pass through Q3 (see previous page for clarification on the meaning of Q’s). The fragmentation pattern of ions with m/z = 225 clearly matches the mass spectrum reported for trinexapac acid (regression coefficient of 99.9%). The sample contains trinexapac acid. Precursor Ion Scanning Overview In this mode, the first analyser is set to scan across all ions in the sample; these ions are transmitted (one at a time) to the collision cell, where fragmentation takes place. All fragmented ions are transmitted to the last mass analyser, which is held to measure the occurrence of a particular fragment ion (or more if needed). This mode identifies all ions capable of producing the specific fragment. In the example below, you can scan the first mass analyser (note that in real life you can programme your equipment to do it automatically) across the masses m1, m2 and m3 (allowing them to pass one at a time), the last analyser is set to measure only one fragment of interest (or more if needed). Consider that you are interested in identify alkyl-benzene compounds from certain sample, only ions that yield the characteristic tropylium ion (m/z = 91) would be of interest.
i

© Crawford Scientific www.chromacademy.com
43
In precursor ion scanning, Q1 is scanned to transmit ions to fragment into Q2. Fragmented ions are transmitted to Q3 which is fixed to transmit a specific fragment ion (or more if needed). This method is useful to identify compounds. Application Precursor Ion Scanning can be used to quickly identify molecules that probably belong to a chemical family (or with certain molecular structure). An alcoholic extract of certain plant was tested for the presence of chalcones. A preliminary experiment had revealed the presence of ions with m/z ration of 320, 343 and 551 (m/z scan range from 250 to 1000). Which of these three signals could be due to a chalcone? Q1 is programmed to allow to transmit only one type of ion at a time (320, 343 or 551). Q3 is programmed to allow to transmit only fragments of m/z ratio 93 AND 153. See previous page for clarification on the meaning of Q’s.
Chalcones:
Chalcones belong to a group of polyphenolic compounds called flavoniods with multiple biochemical applications. Important: Compounds belonging to the chalcones group will fragment producing signals at m/z = 93 and 153 (see opposite).
Chalcone important fragments

© Crawford Scientific www.chromacademy.com
44
In the example ions of m/z = 343 would probably correspond to a chalcone (note the produced fragments at m/z = 93 and 153). Constant Neutral Loss Scanning Overview In this mode, the first analyser is set to scan across all ions in the sample; these ions are transmitted to the collision cell, where fragmentation takes place. All fragmented ions are transmitted to the last mass analyser which in turn is scanned to produce a spectrum of precursor ions that undergo a particular neutral loss. In the example below, you can scan the first mass analyser (note that in real life you can programme your equipment to do it automatically) across the masses m1, m2 and m3, the last analyser is set to measure only ions with masses (m1-Z), (m2-Z) and (m3-Z), where the parameter Z is defined by the user. Consider that you are interested in identify primary alcohols from certain sample, only ions that present a characteristic loss of water (M - 18) would be of interest.
i

© Crawford Scientific www.chromacademy.com
45
In constant neutral loss scanning, Q1 is scanned to transmit ions to fragment into Q2. Fragmented ions are transmitted to Q3 which is also scanned for ions that had experienced certain neutral loss. This method is useful to identify compounds. Application Constant Neutral Loss Scanning can be used to quickly identify molecules that could fragment releasing neutral molecules. An alcoholic wood extract was obtained from milled oak wood and was tested for the presence of lactones. A preliminary experiment had revealed the presence of ions with m/z ration of 150, 157 and 171 (m/z scan range from 85 to 500). Which of these three signals could be due to a lactone? Q1 is programmed to allow to transmit only one type of ion at a time (150, 157 and 171). Q3 is programmed to allow to transmit not only the same masses as in Q1 but also these masses minus 18 and minus 28 (three signals at a time). See previous page for clarification on the meaning of Q’s.
Lactone:
Lactone: is an organic cyclic ester. These compounds have an economic impact as food flavourings and in medicinal activities. Important: Lactones will release carbon monoxide and water (neutral losses of 28 and/or 18 respectively).
O
O
Lactone

© Crawford Scientific www.chromacademy.com
46
In the example ions of m/z = 157 would probably correspond to a lactone (pseudomolecular ion m/z =157, neutral loss of water = 157 – 18 = 139 and neutral loss of CO = 157 – 28 = 129). Single/Multiple Reaction Monitoring Overview The first mass analyser is set to transmit a specific ion which is fragmented in the collision cell. The second analyser is set to transmit one specific fragment (or more if needed). Useful for identifying target compounds.
In single/multiple reaction monitoring, Q1 is fixed to transmit a specific precursor ion and Q3 to transmit a specific product ion. The method also allows quantitation to be done effectively. The method can be more sensitive than other MS/MS methods, as both of the analytical quadrupoles are static at fixed m/z, rather than scanning.
i

© Crawford Scientific www.chromacademy.com
47
Application The next mixture of lipids can be analysed by for the APPI(+)-MS/MS.
• Eicosapentaenoic acid methyl ester • Monoarachidin • Diarachidin • Trielaidin
Look at the APPI/MS/MS spectrum, the most intense signals of each analyte compound can be used in Single/Multiple Reaction Monitoring for quantitative purposes. Table 22. Analysis of lipids
Analyte/Structure Analyte/Structure
Eicosapentaenoic acid methyl ester
O
O
Monoarachidin O
(CH2)17
O
OHOH
Diarachidin O
(CH2)17
O
OOH
(CH2)17
Trielaidin O
(CH2)17
O
OO
(CH2)17(CH2)17
Lipids: Lipids comprise a family of biomolecules that play prominent roles in many critical metabolic and biochemical processes such as energy production and storage, the formation and functioning of cellular membranes, signal transduction, etcetera.

© Crawford Scientific www.chromacademy.com
48
Q1 is programmed to allow to transmit several ions at a time (317, 387, 681 and 885). Q3 is programmed to allow to transmit eight signals simultaneously: three signals for the acid (267, 285 and 317); one for monoarachidin (387); two for diarachidin (369 and 663) and two for trielaidin (603 and 885). See previous page for clarification on the meaning of Q’s. MS/MS Quantitative Considerations The rate of scanning over the mass range has an important effect on the instrument sensitivity; basically, slower scan rates result in improved sensitivity (the instrument takes longer collecting data for each ion). For quantitative analysis of target compounds instead of scanning the entire mass range, only specific ions that have been chosen in advance, and that are characteristic of the target compounds should be monitored. According to the ionisation type (soft or hard) used to produce ions, different ion signals should be considered; in general, for quantitative porpoises, when using:
• Soft ionisation techniques, only the pseudo-molecular ions of interest are chosen. • Strong ionisation techniques, it is highly recommended to use at least three
characteristic fragment ions (usually the most stable ones) coming from each compound of interest.
Finally, you have to consider that in API, acids ionise best in negative ion mode than in positive, whilst bases do the opposite. Avoid agents that can jeopardise your analysis; in positive ion mode signal suppression can arise when using certain additives (like DEA), whilst the same phenomenon could happen in negative ion mode if using acidic compounds (like TFA or HFBA).

© Crawford Scientific www.chromacademy.com
49
References 1. Pure & Appl. Chem., 1999, 71, 1594-1607. 2. G. Zerbi and G. H. Benyon. IUPAC Symbolism and nomenclature for MS. Org. Mass Spectrom. 12, (1977), 115-118. 3. Terrence A. Lee. “A Beginner’s Guide to Mass Spectral Interpretation.” John Wiley and Sons 1998, 1-20. 4. J. T. Watson. “Introduction to Mass Spectrmetry.” Chapter 2. Lippincott-Raven, Pa, USA, (1997), 16. 5. James Barker. “Mass Spectrometry” John Wiley and Sons 1999, 117-147. 6. E. De Hoffmann, J. Charette, and V. Stroobant. “Mass Spectrometry –Principles and Applications.” John Wiley and Sons 1996, 39-48. 7. F. W. McLafferty. “Interpretation of Mass Spectra.” 3rd Edition. University Science Books: Mill Valley, (1980), 15. 8. M. E. Bier and J. E. Schwartz in “Electrospray Ionisation Mass Spectrometry.” R. B. Cole [ed.], John Wiley and Sons Inc, (1997), 263. 9. E. Sheehan and S. Mitrovich in “A Global View of LC/MS”, 1st edition, (Appendix D), Global Publishing, PA, USA, (1998), 106. 10. J. Yergy, D. Heller, G. Hansen, R. J. Cotter, C. Fenselau. “Isotopic Distributions in MS of Large Molecules.” Anal. Chem. 55, (1983), 353-356. 11. Ross Willoughby, Ed Sheehan, Sam Mitrovich. “A Global View of LC/MS” Global View Publishing. 1998, 297-324 12. http://www.sisweb.com/referenc/source/exactmaa.htm 13. Reg Davis, Martin Frearson. “Mass Spectrometry” John Wiley and Sons 1990, 15-22 14. Susana Grimalt, Óscar J. Pozo, Jose M. Marín, Juan V. Sancho, and Félix Hernández. “Evaluation of Different Quantitative Approaches for the Determination of Noneasily Ionizable Molecules by Different Atmospheric Pressure Interfaces Used in Liquid Chromatography Tandem Mass Spectrometry: Abamectin as Case of Study.” J. Am. Soc Mass Spectrom. 2005, 16, 1619–1630.
i Important: For LC-MS, the ions being monitored can be changed during the course of the separation (using the expected retention time as part of the detection criteria) collecting more data for the ions of interest and increasing sensitivity. The major drawback with using this technique is that information on compounds other than the target ones is lost.
© Crawford Scientific www.chromacademy.com
50
15. Nicolas Fabre, Isabelle Rustan, Edmond de Hoffmann, Joëlle Quetin-Leclercq. “Determination of Flavone, Flavonol, and Flavanone Aglycones by Negative Ion Liquid Chromatography Electrospray Ion Trap Mass Spectrometry” J Am Soc Mass Spectrom. 12, (2001), 707–715. 16. Helena Keski-Hynnilä, Leena Luukkanen, Jyrki Taskinen, and Risto Kostiainen. “Mass Spectrometric and Tandem Mass Spectrometric Behavior of Nitrocatechol Glucuronides: A Comparison of Atmospheric Pressure Chemical Ionization and Electrospray Ionization” J Am Soc Mass Spectrom. 10, (1999), 537–545. 17. Richard B. Cole and A. Kamel Harrata. “Solvent effect on analyte charge state, signal intensity, and stability in negative ion electrospray mass spectrometry; implications for the mechanism of negative ion formation” J Am Soc Mass Spectrom. 4, (1993), 546-556. 18. Cole RB, Zhu J. Rapid Commun. Mass Spectrom. 1999; 13:607. 19. Junhua Zhu and Richard B. Cole. “Formation and Decompositions of Chloride Adduct Ions, [M + Cl]-, in Negative Ion Electrospray Ionization Mass Spectrometry” J Am Soc Mass Spectrom. 11, (2000), 932–941. 20. Christophe Guimbaud, Thorsten Bartels-Rausch, Markus Ammann. “An atmospheric pressure chemical ionization mass spectrometer (APCI-MS) combined with a chromatographic technique to measure the adsorption enthalpy of acetone on ice.” International Journal of Mass Spectrometry. 226, (2003) 279–290. 21. G. A. Eiceman, J. F. Bergloff, J. E. Rodriguez, W. Munro, and Z. Karpas. “Atmospheric Pressure Chemical Ionization of Fluorinated Phenols in Atmospheric Pressure Chemical Ionization Mass Spectrometry, Tandem Mass Spectrometry, and Ion Mobility Spectrometry” J Am Soc Mass Spectrom 1999, 10, 1157–1165. 22. Beata M. Kolakowski, J. Stuart Grossert, and Louis Ramaley. “Studies on the Positive-Ion Mass Spectra from Atmospheric Pressure Chemical Ionization of Gases and Solvents Used in Liquid Chromatography and Direct Liquid Injection” J Am Soc Mass Spectrom 2004, 15, 311–324. 23. Tiia Kuuranne, Mikko Vahermo, Antti Leinonen, Risto Kostiainen. “Electrospray and Atmospheric Pressure Chemical Ionization Tandem Mass Spectrometric Behavior of Eight Anabolic Steroid Glucuronides” J Am Soc Mass Spectrom 2000, 11, 722–730. 24. R. D. Smith, J. A. Loo, C. J. Barinaga, C. G. Edmonds and H. R. Hudspeth. J. Am. Soc. Mass Spectrom. 1, (1990), 53. 25. R. D. Smith and C. J. Barinaga. Rapid Commun. Mass Spectrom. 4, (1990), 54. 26. http://webbook.nist.gov/chemistry/ 27. Robert A. W. Johnstone and Malcolm E. Rose. “Mass spectrometry for chemists and biochemists”. Cambridge Univeristy Press. 1996. 28. Dynamic mass spectrometry, volume I. Edited by D. Price and J. E. Williams. Heyden and Son Ltd, London, US distribution: Sadtler Research Labs. Inc, Philadelphia, March 1970. 39. Dynamic mass spectrometry, volume II. Edited by D. Price and J. E. Williams. Heyden and Son Ltd, London, US distribution: Sadtler Research Labs. Inc, Philadelphia, March 1970 30. A. D. Postle. “The analysis of lung surfactant phospholipid by electrospray ionisation mass spectrometry –Applications to disease states.” Appl. Cardio. Path. 9, (2000), 286-289. 31. P. L. Haslam, K. Raymondas and C. S. Baker. “Measurement of pulmonary surfactant components and function in bronchoalveolar lavage fluid.” Eur. Respir. Rev. 9(66), (1999), 43-69. 32. http://www.soton.ac.uk/~msweb/
