mrs studies of human brain development apa 2007 annual meeting perry f. renshaw, m.d. ph.d....
Post on 19-Dec-2015
213 views
TRANSCRIPT

MRS Studies of MRS Studies of Human Brain Human Brain DevelopmentDevelopment
APA 2007 Annual MeetingAPA 2007 Annual MeetingPerry F. Renshaw, M.D. Ph.D.Perry F. Renshaw, M.D. Ph.D.
Young-Hoon Sung, M.D.Young-Hoon Sung, M.D.
In Kyoon Lyoo, M.D. Ph.D.In Kyoon Lyoo, M.D. Ph.D.
Brain Imaging CenterBrain Imaging Center
McLean Hospital / Harvard McLean Hospital / Harvard Medical SchoolMedical School

Brain Imaging Center Brain Imaging Center CollaboratorsCollaborators
Carl AndersonSuzann BabbTanya BarrosLino BecerraNicolas BoloDavid BorsookBarbara BradleyMelanie BrimsonKenroy CayetanoAshley CerneyChrissy CintronJeanette CohanSadie ColeMelissa DanielsBrian DunnChelsea FinnBrent Forester
Eric MoultonConstance MooreSusie MorrisDonna MurrayLisa NickersonDavid OlsenDost OngurGautam PendseSrini PillayAndrew PrescotPerry RenshawIka RogowskaMike RohanAmy RossIsabelle RossoMargaret RicciutiKatherine RudichKatherine Rudich
Blaise FrederickStaci GruberCharlotte HawsMike HenryBob IrvinEric JensenWilliam JonesGen KanayamaMark KaufmanMary KnapmanMatt LammensKim LindseyJohn LogueSteven LowenIn Kyoon LyooTerry ManciniCarissa Medeiros
Megan ShanahanMarisa SilveriJennifer SneiderChris StreeterYoung-Hoon SungDoug Hyun HanKathleen ThangarajJean ThebergeRose VillafuerteMegan WardropPaul WilsonRinah YamamotoDebroah Yurgelun-ToddChun Zuo

Outline What and Why MRS in human development?
What happens in the adolescent brain specifically?
Examples of MRS studies for neurodevelopment
The brief picture of metabolite changes through whole life
Applications

QuestionQuestion
Why MRS ?Why MRS ? Understanding Understanding in vivoin vivo Biochemistry Biochemistry in in
normal developing brains of humannormal developing brains of human Further, contribution to the biological Further, contribution to the biological
knowledge and application for knowledge and application for psychiatric disorderspsychiatric disorders
What can MR spectroscopy inform us What can MR spectroscopy inform us about brain and development?about brain and development? 1H MRS, 31P MRS, ...1H MRS, 31P MRS, ...

First AnswerFirst Answer
1H MRS 1H MRS NAA, Cr, Cho, mI, Glx, LacNAA, Cr, Cho, mI, Glx, Lac
Neuronal viability/funtionNeuronal viability/funtion Glial metabolism, NeurotransmitterGlial metabolism, Neurotransmitter
31P MRS31P MRS PME, Pi, PDE, PCr, α-,β-,γ-ATPPME, Pi, PDE, PCr, α-,β-,γ-ATP
Brain neuronal membrane metabolismBrain neuronal membrane metabolism High energy phosphate metabolismHigh energy phosphate metabolism

Proton MRSProton MRS
Now, let’s see what NAA, Cr,.. stands Now, let’s see what NAA, Cr,.. stands for and means before going to the for and means before going to the brain metabolites of adolescent.brain metabolites of adolescent.

The in vivo 4T The in vivo 4T 11H-MRS Brain H-MRS Brain SpectrumSpectrum

N-acetyl-aspartate (NAA)N-acetyl-aspartate (NAA) GM – neuronal viability or damageGM – neuronal viability or damage WM – diffuse axonal damage or lossWM – diffuse axonal damage or loss Neuronal death and/or dysfunction can also Neuronal death and/or dysfunction can also
cause reduced metabolite levels (Ende, 1997)cause reduced metabolite levels (Ende, 1997)
NAA is made in mitochondria by the membrane-NAA is made in mitochondria by the membrane-bound enzyme L-aspartate N-acetyltrasferase, a bound enzyme L-aspartate N-acetyltrasferase, a catalyst that is found only in the catalyst that is found only in the brain(Truckenmiller, 1985)brain(Truckenmiller, 1985)
The synthesis of NAA is energy dependent (Patel, The synthesis of NAA is energy dependent (Patel, 1979)1979)
Reductions in NAA are consistent with impaired Reductions in NAA are consistent with impaired mitochondrial energy production (Clark, 1998; mitochondrial energy production (Clark, 1998; Stork, 2005)Stork, 2005)

Creatine (Cr)Creatine (Cr) Measure of high energy phosphate storesMeasure of high energy phosphate stores Decrease meansDecrease means
reduction of the ATP supply and high-energy reduction of the ATP supply and high-energy phosphate poolphosphate pool
The resonance arises from The resonance arises from both creatine and phosphocreatineboth creatine and phosphocreatine
Higher concentration Higher concentration in glial cell than neurons in glial cell than neurons could mean glial proliferation with concurrent mI could mean glial proliferation with concurrent mI
increaseincrease Cr is synthesized in the liver Cr is synthesized in the liver
hepatic pathology may affect overall conc.hepatic pathology may affect overall conc. Historically used as an internal referencHistorically used as an internal referencee

Choline (Cho)Choline (Cho)
Choline-containing compoundsCholine-containing compounds Precursor for phosphatidylcholine Precursor for phosphatidylcholine
(constituent of cell membrane)(constituent of cell membrane) Phosphocholine + Phosphocholine +
GlycerophosphocholineGlycerophosphocholine Related with Related with
Cell membranes formation and Cell membranes formation and myelinationmyelination
Membrane turn-overMembrane turn-over Marker of cellular densityMarker of cellular density
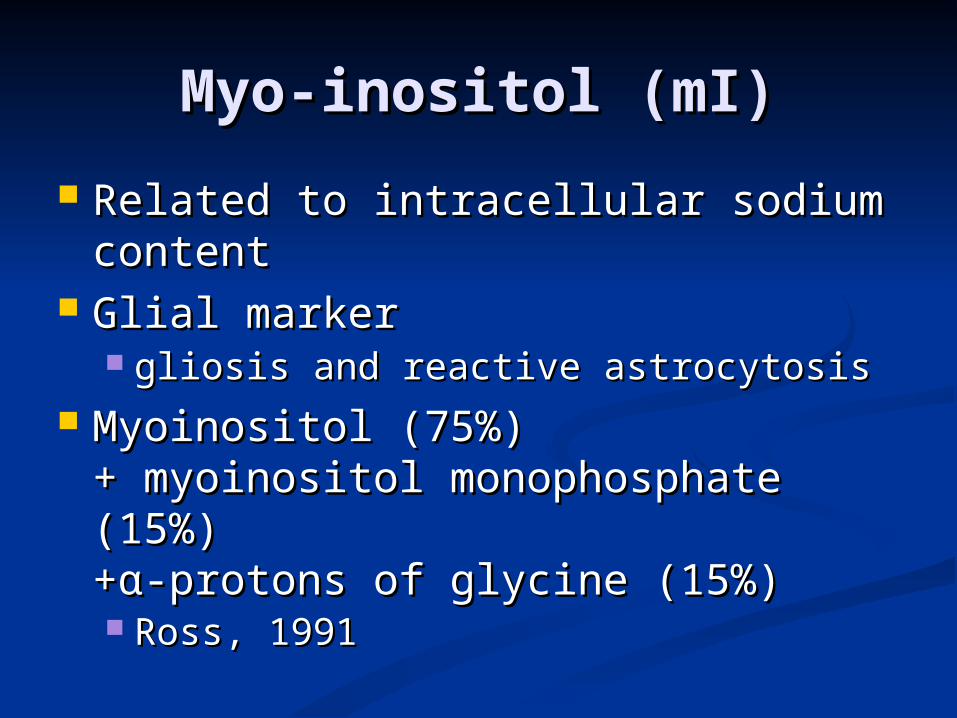
Myo-inositol (mI)Myo-inositol (mI)
Related to intracellular sodium Related to intracellular sodium contentcontent
Glial markerGlial marker gliosis and reactive astrocytosisgliosis and reactive astrocytosis
Myoinositol (75%) Myoinositol (75%) + myoinositol monophosphate (15%) + myoinositol monophosphate (15%)
+α-protons of glycine (15%) +α-protons of glycine (15%) Ross, 1991Ross, 1991

Lactate (Lac)Lactate (Lac)
Increases with impairments in Increases with impairments in oxidative metabolismoxidative metabolism

What happens in What happens in adolescent brain?adolescent brain?
Period of behavioral, Period of behavioral, cognitive and emotional cognitive and emotional reorganization/integrationreorganization/integration Which means notable changes Which means notable changes
in brainin brain Brain maturation may Brain maturation may
includeinclude Arborization, neuritic Arborization, neuritic
sproutingsprouting Myelination with Myelination with
oligodendrocyteoligodendrocyte Pruning, loss of dendrite Pruning, loss of dendrite
processprocess Let’s see how does MRS Let’s see how does MRS
provide above pictureprovide above picturess ??

van der Knaap et al (1990)van der Knaap et al (1990) Healthy children (41 subjects)Healthy children (41 subjects)
Age: 1 – 16 yearsAge: 1 – 16 years Paraventricular white matterParaventricular white matter
NAA/Cho, NAA/CrNAA/Cho, NAA/Cr increaseincrease
Cho/CrCho/Cr decreasedecrease
Rapid change for 3 years of lifeRapid change for 3 years of life Continued to age 16Continued to age 16

Kreis et al (1993)Kreis et al (1993) 50 children50 children 34.5 ~ 926 gestational 34.5 ~ 926 gestational
weeks weeks 1 to 18 years1 to 18 years
normal and pathologic normal and pathologic brainbrain
absolute quantitationabsolute quantitation presents normative presents normative
curvescurvesfor normal developmentfor normal development
ROIROI occipital cortexoccipital cortex parieto-occipital lobeparieto-occipital lobe

Kreis et al (1993)Kreis et al (1993)
NAA ↑NAA ↑ Cr ↑Cr ↑ Cho ↓Cho ↓ mI ↓mI ↓
Gestational Age
most rapid change – within most rapid change – within first 2 yearsfirst 2 years
Gestational Age

Hashimoto et al (1995)Hashimoto et al (1995)
Healthy 47 children and 6 adultsHealthy 47 children and 6 adults Frontal, ParietalFrontal, Parietal
NAA/Cho, NAA/Cr: increaseNAA/Cho, NAA/Cr: increase Cho/Cr: decreaseCho/Cr: decrease Rapid changes – 1 to 3 years of ageRapid changes – 1 to 3 years of age
Regional variationRegional variation Metabolite conc: Rt. Frontal < Rt. Metabolite conc: Rt. Frontal < Rt.
ParietalParietal

Pouwels et al Pouwels et al (1999)(1999) GM, WM, cerebllum, GM, WM, cerebllum,
thalamusthalamus Subjects Subjects
97 children97 children 1-18 years1-18 years HealthyHealthy Disease brain: unaffected areaDisease brain: unaffected area
72 adults 72 adults Healthy Healthy 18-39 years18-39 years

Pouwels et al (1999)Pouwels et al (1999) GM, cerebellum, GM, cerebellum,
thalamusthalamus NAA increaseNAA increase
WM, thalamusWM, thalamus NAAG increaseNAAG increase Glutamine decreaseGlutamine decrease
Cr, PCr, Cho, mI, Cr, PCr, Cho, mI, glutamateglutamate remain constant after first remain constant after first
yearyear Cr: Pcr=2:1Cr: Pcr=2:1
regardless of age or regionregardless of age or region

Kadota et al (2001)Kadota et al (2001) 90 normal 90 normal
subjectssubjects 4 to 88 years4 to 88 years WM, WM, GMGM
ant, mid, postant, mid, post Metabolite ratiosMetabolite ratios
NAA/ChoNAA/Cho Cr/ChoCr/Cho

Kadota et al (2001)Kadota et al (2001) WMWM
NAA/ChoNAA/Cho peak: average - 18.5 yearspeak: average - 18.5 years
fontal 21.9 years, precentral 17.6, parietal 15.9fontal 21.9 years, precentral 17.6, parietal 15.9 dorsal to rostral directiondorsal to rostral direction
increaseincrease first decade – thirdfirst decade – third
decreasedecrease after third decadeafter third decade
GMGM NAA/ChoNAA/Cho
gradual declinegradual decline

Kadota et al (2001)Kadota et al (2001)
Cerebral lateralizationCerebral lateralization Right side WM mature 1.1~4.0 years Right side WM mature 1.1~4.0 years
faster than left in terms of NAA/Cho faster than left in terms of NAA/Cho levelslevels
Gender differenceGender difference Male reached maximum level of Male reached maximum level of
NAA/Cho 1.4 ~ 3.2 years earlier than NAA/Cho 1.4 ~ 3.2 years earlier than female in WMfemale in WM
After peak, the NAA/Cho levels declined After peak, the NAA/Cho levels declined faster in male than in femalefaster in male than in female
may be due to sex hormone differencemay be due to sex hormone difference
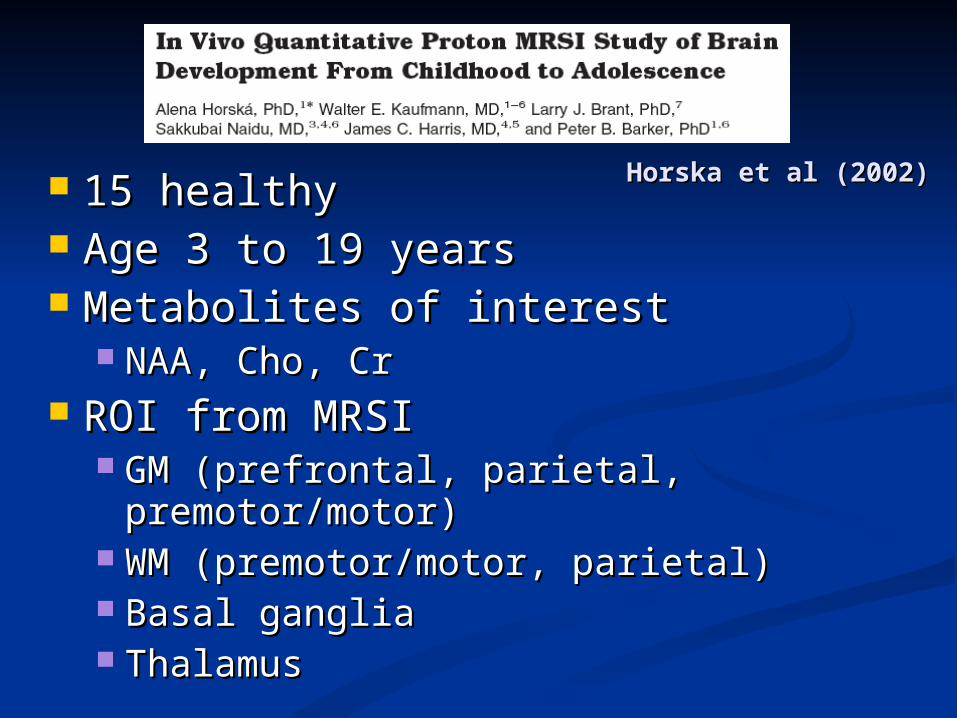
Horska et al (2002)Horska et al (2002) 15 healthy15 healthy Age 3 to 19 yearsAge 3 to 19 years Metabolites of interestMetabolites of interest
NAA, Cho, CrNAA, Cho, Cr ROI from MRSIROI from MRSI
GM (prefrontal, parietal, GM (prefrontal, parietal, premotor/motor)premotor/motor)
WM (premotor/motor, parietal)WM (premotor/motor, parietal) Basal gangliaBasal ganglia ThalamusThalamus

Horska et al (2002)Horska et al (2002)
GMGM NAA/ChoNAA/Cho
peak around 11 yearspeak around 11 years decrease thereafterdecrease thereafter
WMWM NAA/ChoNAA/Cho
increase (3 to 19 years)increase (3 to 19 years)
PutamenPutamen NAA/ChoNAA/Cho
increase until 10 yearsincrease until 10 years

Costa et al (2002)Costa et al (2002)
37 healthy subjects37 healthy subjects Age 3 – 18 yearsAge 3 – 18 years Cerebellum, Parietal WMCerebellum, Parietal WM NAA/Cr, Cho/CrNAA/Cr, Cho/Cr NAA/H2O, Cr/H2ONAA/H2O, Cr/H2O

Costa et al (2002)Costa et al (2002)
NAA/CrNAA/Cr increasing tendency increasing tendency
with age (p=0.062)with age (p=0.062) NAA/H2ONAA/H2O
increase with age in increase with age in cerebellum, cerebellum, parietoccipitalparietoccipital
Topologic variationTopologic variation NAA, ChoNAA, Cho
higher in cerebellum higher in cerebellum than parietoccipitalthan parietoccipital

Summary of Summary of 11H H metabolites[1]metabolites[1]
Brain metabolite profiles of lifeBrain metabolite profiles of life Rapid change of metabolite occurs first Rapid change of metabolite occurs first
several years in lifeseveral years in life But, some maturation such as But, some maturation such as
myelination continue to adolescencemyelination continue to adolescence Consideration in MRSConsideration in MRS
Inconsistencies in studies partially due Inconsistencies in studies partially due to …to …
Regional variations in each ROIRegional variations in each ROI Different acquisition parameters for different Different acquisition parameters for different
MRS studiesMRS studies Some conflicting MRS results but Some conflicting MRS results but
generally, ....generally, ....
Summary of Summary of 11H H metabolites [2]metabolites [2]
Before maturation Before maturation From fetus/neonate to adultsFrom fetus/neonate to adults
NAA ↑NAA ↑ d/t increasing neuronal function/densityd/t increasing neuronal function/density
Cr ↑Cr ↑ increased energy demandincreased energy demand
Cho ↓, mI ↓Cho ↓, mI ↓

Summary of Summary of 11H H metabolites[3]metabolites[3]
Aging (from adult to elderly, Aging (from adult to elderly, moore et al moore et al
19991999)) NAA ↓ or →NAA ↓ or →
slight decrease or stability of neuronal markerslight decrease or stability of neuronal marker Cr ↑, PCr ↑Cr ↑, PCr ↑
Due to increased energy demandDue to increased energy demand Cho ↑, mI ↑Cho ↑, mI ↑
Due to phospholipid breakdownDue to phospholipid breakdown

Summary of Summary of 11H H metabolites [3]metabolites [3]
AdolescenceAdolescence NAA levelsNAA levels Different profileDifferent profile
between ..between .. GMGM
Peak – 11 yearsPeak – 11 yearsHorska et al (2002)Horska et al (2002)
WMWM Peak – 19 yearsPeak – 19 years
Kadota et al (2001) Kadota et al (2001) Could mean…Could mean…
pruning, pruning, loss of loss of dendrite process dendrite process in GM, in GM, myelination in WMmyelination in WM
Schematic diagram of NAA with age in gray and white matterSchematic diagram of NAA with age in gray and white matter

3131P MR SpectrumP MR Spectrum Typical Typical 3131P MR spectrum at 4 P MR spectrum at 4
TeslaTesla

PhosphorusPhosphorus
Lower sensitivity than protonLower sensitivity than proton Require more sophisticated hardwareRequire more sophisticated hardware Relatively small number of studiesRelatively small number of studies

Phosphorus metabolitesPhosphorus metabolites PMEPME
Phospholipid precursorPhospholipid precursor phosphocholine (PCho) phosphocholine (PCho)
+phosphoethanolamine +phosphoethanolamine PDEPDE
Phospholipid breakdownPhospholipid breakdown glycerophosphocholine + glycerophosphocholine +
glycerophosphoethanolamineglycerophosphoethanolamine PME/PDE ratioPME/PDE ratio
Reflects membrane phospholipid turnoverReflects membrane phospholipid turnover PCr, ATP (NTP)PCr, ATP (NTP)
High energy phosphate metabolismHigh energy phosphate metabolism

Healthy children (41 Healthy children (41 subjects)subjects) Age: 1 – 16 yearsAge: 1 – 16 years
Before the age of threeBefore the age of three PME/β-ATP, PME/PCrPME/β-ATP, PME/PCr
decreasedecrease PDE/β-ATP, PCr/β-ATPPDE/β-ATP, PCr/β-ATP
increaseincrease PCr/PiPCr/Pi
increaseincrease
After the age of threeAfter the age of three No changeNo change
van der Knaap et al van der Knaap et al (1990)(1990)

Hanaoka et al (1998)Hanaoka et al (1998)
37 healthy children37 healthy children 4 month ~ 13 years4 month ~ 13 years Metabolites: PME/PDEMetabolites: PME/PDE TR: 3 or 15 secondsTR: 3 or 15 seconds ROIROI
Frontoparietal regionFrontoparietal region CerebellumCerebellum

Hanaoka et al (1998)Hanaoka et al (1998)
PME/PDE in cerebrum and PME/PDE in cerebrum and cerebellumcerebellum Rapid decrease during first 2 years.Rapid decrease during first 2 years. Slight decrease afterwards (adolescence)Slight decrease afterwards (adolescence) Regional differenceRegional difference
Higher in cerebellum than in cerebrumHigher in cerebellum than in cerebrum
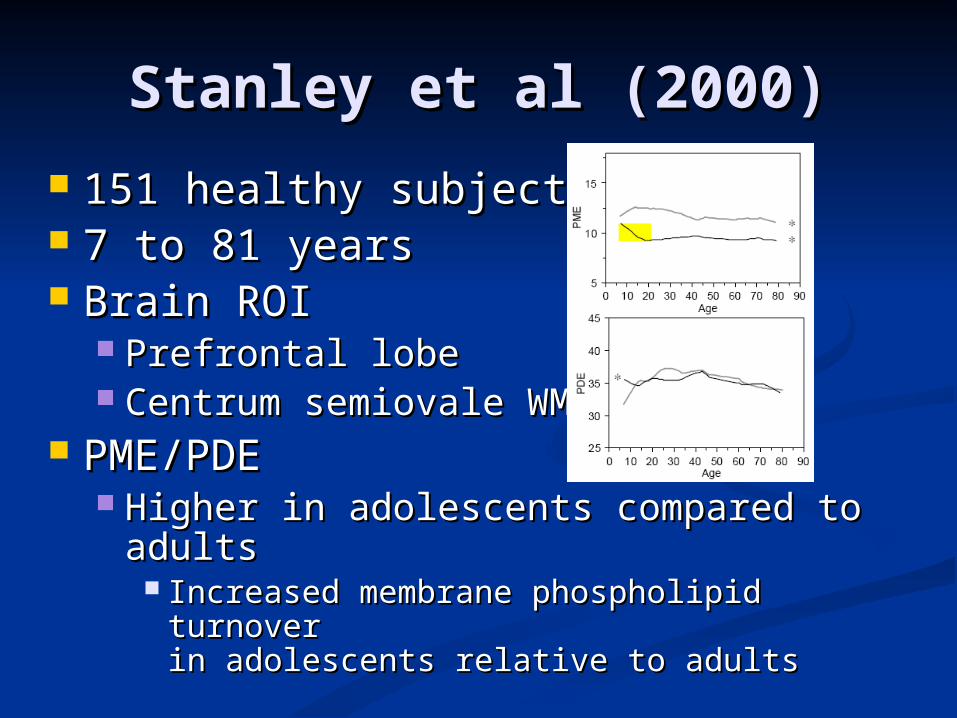
Stanley et al (2000)Stanley et al (2000)
151 healthy subjects151 healthy subjects 7 to 81 years7 to 81 years Brain ROIBrain ROI
Prefrontal lobePrefrontal lobe Centrum semiovale WMCentrum semiovale WM
PME/PDEPME/PDE Higher in adolescents compared to Higher in adolescents compared to
adultsadults Increased membrane phospholipid turnover Increased membrane phospholipid turnover
in adolescents relative to adultsin adolescents relative to adults

Hinsberger et al (1997)Hinsberger et al (1997)
P-31 MRS with MR volumetric study in P-31 MRS with MR volumetric study in schizophreniaschizophrenia
Prefrontal regionPrefrontal region 10 healthy subjects, 10 schizophrenics10 healthy subjects, 10 schizophrenics
PME decreased with age only in healthy PME decreased with age only in healthy subjectssubjects
PME of schizophrena had no correlation with PME of schizophrena had no correlation with ageage

Summary of Summary of 3131P P metabolites[1]metabolites[1]
Before maturationBefore maturation PME – high, PDE – low in youngPME – high, PDE – low in young
high membrane precursor, low breakdown producthigh membrane precursor, low breakdown product related to increased membrane turnoverrelated to increased membrane turnover
From neonates to adults (mmol/L), From neonates to adults (mmol/L), Buchli et Buchli et al. (1994)al. (1994)
PME ↓ (from 4.5 to 3.5)PME ↓ (from 4.5 to 3.5) PDE ↑ (3.2 to 11.7)PDE ↑ (3.2 to 11.7) PCr ↑ (1.4 to 3.4)PCr ↑ (1.4 to 3.4) Pi ↑ (0.6 to 1.0)Pi ↑ (0.6 to 1.0) ATP ↑ (1.6 to 2.9)ATP ↑ (1.6 to 2.9)

Summary of Summary of 3131P P metabolites[2]metabolites[2]
Aging (adults to elderly, Aging (adults to elderly, moore et al 1999moore et al 1999)) PME ↓, PDE ↑PME ↓, PDE ↑
Due to neuronal membrane degenerationDue to neuronal membrane degeneration Excessive synpatic prunning clinical Excessive synpatic prunning clinical
modelmodel SchizophreniaSchizophrenia
exaggerated normal process of neuro-exaggerated normal process of neuro-developmentdevelopment
PME decrease, PDE increasePME decrease, PDE increase might be related to pathophysiology of might be related to pathophysiology of
schizophrenia schizophrenia McGlashan, 1999; Keshavan 2003, 1994McGlashan, 1999; Keshavan 2003, 1994

Summary of Summary of 3131P P metabolites[3]metabolites[3]
Adolescence PME ↓↓ PDE ↑↑ Decreasing Decreasing
precursor, precursor, increasing increasing breakdown breakdown product of product of phospholipiphospholipid of d of membranemembrane
Schematic diagram of PME and PDE with ageSchematic diagram of PME and PDE with age

Conclusion
MRS, MRSI can provide valuable information of in vivo adolescent brain development through neuronal chemistry and can evaluate normal or diseased brain
The metabolite levels show different profile with maturation and topology, therefore the data of normal development provide fundamental and valuable basis for pathologic process or disorders

ApplicationApplication

.
MRS MRS as a component of as a component of
multimodal multimodal imaging studiesimaging studies
DA09448-09S1 Results DA09448-09S1 Results Neuroimaging of Neuroimaging of
Methamphetamine Dependent Methamphetamine Dependent SubjectsSubjects
2003-20052003-2005

Completed studies Seven neuroimaging studies with publications
A multimodal brain imaging approach enables in-depth and complementary understanding of prefrontal cortical deficits and the pattern of recovery with abstinence.

MRS study of brain chemistry (Sung MRS study of brain chemistry (Sung et al, 2007)et al, 2007)
30 MA dependent and 20 healthy comparison subjects30 MA dependent and 20 healthy comparison subjects NAA concentration was lower in the frontal white matter of MA users NAA concentration was lower in the frontal white matter of MA users
with greater MA dose compared to a smaller dose and to healthy with greater MA dose compared to a smaller dose and to healthy subjects subjects
myomyo-Inositol concentration in the frontal white matter was higher for -Inositol concentration in the frontal white matter was higher for the MA users compared to healthy subjectsthe MA users compared to healthy subjects
In MA dependent subjects, NAA concentrations correlated inversely In MA dependent subjects, NAA concentrations correlated inversely with MA dosewith MA dose
MA related abnormalities may, in part, recover with abstinence in gray MA related abnormalities may, in part, recover with abstinence in gray matter, but not in the white matter regionsmatter, but not in the white matter regions

MA dependent subjects had less gray matter MA dependent subjects had less gray matter density in the right middle frontal braindensity in the right middle frontal brain; Voxel-based morphometry study ; Voxel-based morphometry study (Kim et al, 2006)(Kim et al, 2006)
A BGray matter density reduction in right
middle frontal cortex (corrected p < 0.05)
Gray matter density reduction in right middle frontal cortex
(corrected p < 0.05)
Lower cerebral glucose Lower cerebral glucose metabolism levels in the right metabolism levels in the right superior frontal white matter superior frontal white matter ; FDG-PET study of brain glucose ; FDG-PET study of brain glucose metabolism (Kim et al., 2005)metabolism (Kim et al., 2005)
Decreased relative rCBF in the Decreased relative rCBF in the right anterior cingulate cortexright anterior cingulate cortex; SPECT study of relative blood ; SPECT study of relative blood flow in brain (Hwang et al., 2006)flow in brain (Hwang et al., 2006)
MA subjects are…

MA dependent adults had lower MA dependent adults had lower white matter integrity values in white matter integrity values in frontal WM compared to healthy frontal WM compared to healthy subjects subjects ; DTI study (Chung et al., In ; DTI study (Chung et al., In press)press)
MA users had greater severity of MA users had greater severity of WMH compared to healthy subjectsWMH compared to healthy subjects; White matter hyperintensities ; White matter hyperintensities study study (Bae et al, 2006)(Bae et al, 2006)
Increased curvature in the genu; Increased curvature in the genu; decreased width in posterior midbody; decreased width in posterior midbody; decreased width in isthmus areadecreased width in isthmus area; Corpus callosum shape and size ; Corpus callosum shape and size analysis analysis (Oh et al., 2005)(Oh et al., 2005)
MA subjects are…

Pilot studyPilot study
14 MA users (age=18.8±2.26 years; male/female=10/4) and 14 14 MA users (age=18.8±2.26 years; male/female=10/4) and 14 healthy comparison subjects (age=18.7±2.29 years; healthy comparison subjects (age=18.7±2.29 years; male/female=10/4) male/female=10/4) matching for age, sex, education and parent's socioeconomic statusmatching for age, sex, education and parent's socioeconomic status
Months of active MA use=21.0±7.65Months of active MA use=21.0±7.65lifetime cumulative number of intravenous shots=139.8±113.2. lifetime cumulative number of intravenous shots=139.8±113.2. (One intravenous shot of 0.3 gram is typically used at a time in South (One intravenous shot of 0.3 gram is typically used at a time in South Korea typically induces 3-5 hours of euphoria and 48-72 hours of Korea typically induces 3-5 hours of euphoria and 48-72 hours of excitement and hypervigilance.)excitement and hypervigilance.)
Structural T1, DTI and 1H-MRS Structural T1, DTI and 1H-MRS
Sponsored in part by a Strategic Priority Research Grant of Seoul Sponsored in part by a Strategic Priority Research Grant of Seoul National University Hospital (SNUH)(21-2003-007-0), matched National University Hospital (SNUH)(21-2003-007-0), matched funds for DA09448-09S1funds for DA09448-09S1

HypothesesHypotheses
MA dependent MA dependent adolescentsadolescents will have neurobiological deficits in the will have neurobiological deficits in the
frontal lobes (decreased gray matter density, white matter frontal lobes (decreased gray matter density, white matter integrity, and neuronal viability) integrity, and neuronal viability)
A more profound neurobiological deficit in adolescents with early-A more profound neurobiological deficit in adolescents with early-onset MA abuse will be observed when compared to those with onset MA abuse will be observed when compared to those with late-onset MA abuse. late-onset MA abuse.

MRS study in adolescent and young adult MA users MRS study in adolescent and young adult MA users
NAA concentrations lower in NAA concentrations lower in adolescentadolescent MA users (n=12) MA users (n=12) compared to healthy subjects (n=13) in frontal white matter ROI compared to healthy subjects (n=13) in frontal white matter ROI
Age of onset positively correlated with frontal white matter NAAAge of onset positively correlated with frontal white matter NAA
concentrationconcentration
NAA level

Gray matter density differences in Gray matter density differences in adolescentadolescent and and young adult MA usersyoung adult MA users
Adolescent MA users had decreased gray matter densities in the left Adolescent MA users had decreased gray matter densities in the left orbitofrontal lobeorbitofrontal lobe
Age of onset of MA exposure positively correlated with orbitofrontal Age of onset of MA exposure positively correlated with orbitofrontal gray matter densitiesgray matter densities

White matter integrity differences in White matter integrity differences in adolescentadolescent and and young adult MA usersyoung adult MA users
ROI analysis: ROI analysis: Adolescent MA users had smaller white matter integrity values in the Adolescent MA users had smaller white matter integrity values in the
frontal ROI compared to healthy subjectsfrontal ROI compared to healthy subjects
Voxel-based analysis:Voxel-based analysis: Decreased white matter integrity values in bilateral medial frontal Decreased white matter integrity values in bilateral medial frontal
regions of the brainregions of the brain Age of onset of MA abuse strongly correlated with left medial frontal Age of onset of MA abuse strongly correlated with left medial frontal
white matter integrity valueswhite matter integrity values

Summary of pilot study
Adolescent MA users may have neurobiological deficits in frontal regions of the brain: Gray matter density decrease in orbitofrontal region Neuronal viability decrease in the frontal white
matter White matter integrity decrease in several frontal
regions of the brain The pattern of MA-related toxicity on the
developing brain may differ from the adult brain
Age of MA exposure seems to play an important role in MA-induced neurobiological deficit