mox depletion calculation benchmark · mox depletion calculation benchmark ... pressurised water...
TRANSCRIPT

Nuclear Science NEA/NSC/R(2016)3 March 2017www.oecd-nea.org
MOx Depletion CalculationBenchmark

Unclassified NEA/NSC/R(2016)3 Organisation de Coopération et de Développement Économiques Organisation for Economic Co-operation and Development 21-Mar-2017
___________________________________________________________________________________________
_____________ English - Or. English NUCLEAR ENERGY AGENCY
NUCLEAR SCIENCE COMMITTEE
MOx Depletion Calculation Benchmark
This document exists only in pdf and will be published on the website of the NEA as of 22 March 2017.
JT03411102
Complete document available on OLIS in its original format
This document and any map included herein are without prejudice to the status of or sovereignty over any territory, to the delimitation of
international frontiers and boundaries and to the name of any territory, city or area.
NE
A/N
SC
/R(2
016)3
Un
classified
En
glish
- Or. E
ng
lish

Nuclear Science
MOx Depletion Calculation Benchmark
© OECD 2016
NUCLEAR ENERGY AGENCY
ORGANISATION FOR ECONOMIC CO-OPERATION AND DEVELOPMENT

ORGANISATION FOR ECONOMIC CO-OPERATION AND DEVELOPMENT
The OECD is a unique forum where the governments of 35 democracies work together to address the economic, social and environmental challenges of globalisation. The OECD is also at the forefront of efforts to understand and to help governments respond to new developments and concerns, such as corporate governance, the information economy and the challenges of an ageing population. The Organisation provides a setting where governments can compare policy experiences, seek answers to common problems, identify good practice and work to co-ordinate domestic and international policies.
The OECD member countries are: Australia, Austria, Belgium, Canada, Chile, the Czech Republic, Denmark, Estonia, Finland, France, Germany, Greece, Hungary, Iceland, Ireland, Israel, Italy, Japan, Korea, Latvia, Luxembourg, Mexico, the Netherlands, New Zealand, Norway, Poland, Portugal, the Slovak Republic, Slovenia, Spain, Sweden, Switzerland, Turkey, the United Kingdom and the United States. The European Commission takes part in the work of the OECD.
OECD Publishing disseminates widely the results of the Organisation’s statistics gathering and research on economic, social and environmental issues, as well as the conventions, guidelines and standards agreed by its members.
NUCLEAR ENERGY AGENCY
The OECD Nuclear Energy Agency (NEA) was established on 1 February 1958. Current NEA membership consists of 31 countries: Australia, Austria, Belgium, Canada, the Czech Republic, Denmark, Finland, France, Germany, Greece, Hungary, Iceland, Ireland, Italy, Japan, Korea, Luxembourg, Mexico, the Netherlands, Norway, Poland, Portugal, Russia, the Slovak Republic, Slovenia, Spain, Sweden, Switzerland, Turkey, the United Kingdom and the United States. The European Commission and the International Atomic Energy Agency also take part in the work of the Agency.
The mission of the NEA is: – to assist its member countries in maintaining and further developing, through international co-operation, the
scientific, technological and legal bases required for a safe, environmentally friendly and economical use of nuclear energy for peaceful purposes;
– to provide authoritative assessments and to forge common understandings on key issues, as input to government decisions on nuclear energy policy and to broader OECD policy analyses in areas such as energy and sustainable development.
Specific areas of competence of the NEA include the safety and regulation of nuclear activities, radioactive waste management, radiological protection, nuclear science, economic and technical analyses of the nuclear fuel cycle, nuclear law and liability, and public information. The NEA Data Bank provides nuclear data and computer program services for participating countries.
This document and any map included herein are without prejudice to the status of or sovereignty over any territory, to the delimitation of international frontiers and boundaries and to the name of any territory, city or area. Corrigenda to OECD publications may be found online at: www.oecd.org/publishing/corrigenda. © OECD 2016
You can copy, download or print OECD content for your own use, and you can include excerpts from OECD publications, databases and multimedia products in your own documents, presentations, blogs, websites and teaching materials, provided that suitable acknowledgment of the OECD as source and copyright owner is given. All requests for public or commercial use and translation rights should be submitted to [email protected]. Requests for permission to photocopy portions of this material for public or commercial use shall be addressed directly to the Copyright Clearance Center (CCC) at [email protected] or the Centre français d'exploitation du droit de copie (CFC) [email protected].

NEA/NSC/R(2016)3
3
Foreword
Under the auspices of the NEA Nuclear Science Committee (NSC), the Working Party on Scientific Issues of Reactor Systems (WPRS) has been established to study the reactor physics, fuel performance, radiation transport and shielding, and the uncertainties associated with modelling of these phenomena in present and future nuclear power systems. The WPRS has different expert groups to cover a wide range of scientific issues in these fields.
The Expert Group on Reactor Physics and Advanced Nuclear Systems (EGRPANS) was created in 2011 to perform specific tasks associated with reactor physics aspects of present and future nuclear power systems. EGRPANS provides expert advice to the WPRS and the nuclear community on the development needs (data and methods, validation experiments, scenario studies) for different reactor systems and also provides specific technical information regarding: core reactivity characteristics, including fuel depletion effects; core power/flux distributions; Core dynamics and reactivity control.
In 2013 EGRPANS published a report that investigated fuel depletion effects in a Pressurised Water Reactor (PWR). This was entitled “International Comparison of a Depletion Calculation Benchmark on Fuel Cycle Issues” NEA/NSC/DOC(2013)1 that documented a benchmark exercise for UO2 fuel rods. This report documents a complementary benchmark exercise that focused on PuO2/UO2 Mixed Oxide (MOX) fuel rods. The results are especially relevant to the back-end of the fuel cycle, including irradiated fuel transport, reprocessing, interim storage and waste repository.
Acknowledgements
The NEA expresses its sincere gratitude to the authors of the present report, Ms Laurence San Felice, Mr Romain Eschbach, Ms Ratna Dewi Syarifah and Ms Seif-Eddine Maryam, for their valuable contributions to the specifications of the benchmark reported here, the compilation and analysis of the results. Special thanks are extended to Mr Kevin Hesketh for co-ordinating and reviewing the report.

NEA/NSC/R(2016)3
4
Table of contents
List of abbreviations and acronyms ........................................................................................ 9
1. Introduction ......................................................................................................................... 10
2. Description of the benchmark ............................................................................................ 12
2.1 Description of SAINT-LAURENT B1 reactor ............................................................... 12 2.2 Geometry and fuel composition data .............................................................................. 13 2.3 Irradiation parameters and history ................................................................................... 17 2.4 Required quantities .......................................................................................................... 18
3. The DARWIN package ....................................................................................................... 19
4. Analysis method .................................................................................................................. 21
5. Participants and codes used ............................................................................................... 22
5.1. CEA ................................................................................................................................ 23 5.2 NNL ................................................................................................................................ 23 5.3. KURCHATOV ............................................................................................................... 23 5.4. GRNSPG (UNIPI) .......................................................................................................... 23 5.5. GRS-KENOREST .......................................................................................................... 24 5.6. GRS-TRITON ................................................................................................................ 25
6. Results and code-to-code comparison for isotopic concentrations ................................. 26
6.1. Actinides results ............................................................................................................. 26 6.2. Fission product results .................................................................................................... 40 6.3. Activation products results ............................................................................................. 45 6.4. Activation-fission product results .................................................................................. 48
7. Results and code-to-code comparison for decay heat and neutron emission calculations ............................................................................................................. 52
7.1. Results and code-to-code comparison for decay heat calculations ................................ 52 7.2. Results and code-to-code comparison for neutron emissions calculations .................... 55
8. Summary and conclusions .................................................................................................. 58
References ................................................................................................................................ 59
Appendix A: Tables providing detailed result of Q17 fuel .................................................. 61
Appendix B: Tables providing detailed results of L14 fuel ................................................. 90

NEA/NSC/R(2016)3
5
List of figures
Figure 1. Four fuel assembly super-cell (MOx fuel assembly with UOx environment) ........... 12 Figure 2. Location of the subject fuel pins Q17 and L14 .......................................................... 13 Figure 3. General outline and scope of DARWIN form ........................................................... 19 Figure 4. General diagram of DARWIN package ..................................................................... 20 Figure 5. NEWT/TRITON geometry model of benchmark case Q17 ...................................... 25 Figure 6. RSD versus cooling time for actinides in Q17 fuel rod ............................................. 26 Figure 7. Masses (g/tHMI) calculated by the participants for 235U, 238U and 239Pu ................... 28 Figure 8. Decay scheme of 237Np, 236Np, 236Pu and 232U ........................................................... 29 Figure 9. Masses (g/tHMI) calculated by the participants for 238Pu, 240Pu, 241Pu and 242Pu ..... 31 Figure 10. Masses (g/tHMI) calculated by the participants for 241Am and 242mAm .................. 32 Figure 11. Masses (g/tHMI) calculated by the participants for Cm isotopes ............................ 33 Figure 12. RSD versus cooling time for actinides in L14 fuel rod ........................................... 35 Figure 13. Masses (g/tHMI) calculated by the participants for 235U, 238U, 239Pu and 240Pu ....... 36 Figure 14. Masses (g/tHMI) calculated by the participants for 234U, 238Pu, 241Pu, 241Am,
242mAm and 244Cm .................................................................................................... 37 Figure 15. Result of RSD versus cooling time for actinides code-to-code comparison
without aberrant values ............................................................................................ 40 Figure 16. RSD versus cooling time for some fission products in Q17 rod .............................. 40 Figure 17. Masses (g/tHMI) for some fission products in Q17 fuel rod ................................... 41 Figure 18. RSD versus cooling time for some fission products ................................................ 43 Figure 19. RSD versus cooling time for some fission products in L14 rod .............................. 43 Figure 20. Masses (g/tHMI) of some fission products which have RSD >±50% (93mNb
and 109mAg) .............................................................................................................. 44 Figure 21. RSD versus cooling time for selected fission products ........................................... 45 Figure 22. RSD versus cooling time for activation products .................................................... 45 Figure 23. Calculated masses (g/tHMI) for some activations products which have RSD
>±50% (41Ca, 53Mn, 60Fe and 93Mo) ........................................................................ 46 Figure 24. RSD versus cooling time for activation products in L14 fuel rod ........................... 48 Figure 25. RSD versus cooling time for activation-fission products in Q17 fuel rod ............... 48 Figure 26. Calculated masses (g/tHMI) for some activation-fission products which have
RSD >±50% (191mSn, 121mSn, 126Sn and 125Sb) ......................................................... 49 Figure 27. RSD versus cooling time for activation-fission products in L14 fuel rod ............... 50 Figure 28. Calculated masses (g/tHMI) for some activation-fission products in L14 rod ........ 51 Figure 29. RSD versus cooling time for decay heat in Q17 fuel rod ........................................ 52 Figure 30. Calculated decay heat at each cooling time ............................................................. 53 Figure 31. RSD versus cooling time for decay heat in L14 fuel rod ......................................... 54 Figure 32. RSD versus cooling time for neutron emission rate in Q17 fuel rod ....................... 55 Figure 33. The neutron emission rate for each cooling time in Q17 fuel rod ........................... 55 Figure 34. RSD versus cooling time for neutron emission rate in L14 fuel rod ....................... 57

NEA/NSC/R(2016)3
6
List of tables
Table 1. Plutonium isotopic composition in fresh MOx fuel .................................................... 14 Table 2. Uranium isotopic composition in fresh MOx fuel ...................................................... 14 Table 3. Initial MOx fuel content .............................................................................................. 14 Table 4. Initial MOx fuel compositions (atoms/barn.cm) ......................................................... 14 Table 5. Initial composition for irradiated UO2 fuel (atoms/barn.cm) ...................................... 15 Table 6. Cladding and guide tubes; coolant/moderator (550 ppm boron) ................................. 16 Table 7. Initial fuel impurities ................................................................................................... 16 Table 8. List of the participants and codes used ....................................................................... 22 Table 9. Summary of RSD major trends at discharge for the actinides in Q17 fuel rod ........... 26 Table 10. Results at discharge for 235U, 238U and 239Pu (g/tHMI) ............................................. 27 Table 11. Comparison for 235U, 238U and 239Pu to the median value (M) at discharge .............. 27 Table 12. Trends on RSD with cooling time for actinides in Q17 fuel rod .............................. 27 Table 13. Results at discharge for 237Np, 236Np, 236Pu and 232U (g/tHMI) ................................. 29 Table 14. Masses comparison for 237Np, 236Np, 236Pu and 232U to the median value (M) at
discharge ................................................................................................................... 29 Table 15. RSD versus cooling time for 236Np, 236Pu and 232U ................................................... 29 Table 16. Comparison for 237Np, 236Np, 236Pu and 232U to the CEA value at discharge ............ 30 Table 17. Masses (g/tHMI) and RSD at 100 years cooling time for 243Pu ................................ 30 Table 18. Summary of RSD major trends at discharge for the actinides in L14 fuel rod ......... 35 Table 19. Summary of the main RSD trends for the fission products in Q17 fuel rod ............. 41 Table 20. Summary of the main RSD trends for the fission products in L14 fuel rod .............. 43 Table 21. 55Fe and 60Co masses (g/tHMI) and RSD at 300 years cooling time ........................ 46 Table 22. 54Mn masses (g/tHMI) and RSD at 100 years cooling time ...................................... 46 Table A.1. Results for actinides in assembly calculation at discharge (g/tHMI) ...................... 61 Table A.2. Results for actinides in assembly calculation at 5 years (g/tHMI) .......................... 62 Table A.3. Results for actinides in assembly calculation at 50 years (g/tHMI) ........................ 63 Table A.4. Results for actinides in assembly calculation at 100 years (g/tHMI) ...................... 64 Table A.5. Results for actinides in assembly calculation at 300 years (g/tHMI) ...................... 65 Table A.6. Trends of relative standard deviation versus cooling time for actinides in
assembly calculation ............................................................................................... 66 Table A.7. Results for fission products in assembly calculation at discharge (g/tHMI) ........... 67 Table A.8. Results for fission products in assembly calculation at 5 years (g/tHMI) ............... 69 Table A.9. Results for fission products in assembly calculation at 50 years (g/tHMI) ............. 71 Table A.10. Results for fission products in assembly calculation at 100 years (g/tHMI) ......... 73 Table A.11. Results for fission products in assembly calculation at 300 years (g/tHMI) ......... 75 Table A.12. Trends of relative standard deviation versus cooling time for fission
products in assembly calculation .......................................................................... 77 Table A.13. Results for activation products in assembly calculation at discharge
(g/tHMI) ................................................................................................................ 78 Table A.14. Results for activation products in assembly calculation at 5 years (g/tHMI) ........ 79

NEA/NSC/R(2016)3
7
Table A.15. Results for activation products in assembly calculation at 50 years (g/tHMI) ...... 79 Table A.16. Results for activation products in assembly calculation at 100 years
(g/tHMI) ................................................................................................................ 80 Table A.17. Results for activation products in assembly calculation at 300 years
(g/tHMI) ................................................................................................................ 80 Table A.18. Trends of relative standard deviation versus cooling time for activation
products in assembly calculation .......................................................................... 81 Table A.19. Results for activation-fission products in assembly calculation at discharge
(g/tHMI) ................................................................................................................ 81 Table A.20. Results for activation-fission products in assembly calculation at 5 years
(g/tHMI) ................................................................................................................ 82 Table A.21. Results for activation-fission products in assembly calculation at 50 years
(g/tHMI) ................................................................................................................ 83 Table A.22. Results for activation-fission products in assembly calculation at 100 years
(g/tHMI) ................................................................................................................ 84 Table A.23. Results for activation-fission products in assembly calculation at 300 years
(g/tHMI) ................................................................................................................ 85 Table A.24. Trends of relative standard deviation versus cooling time for activation-
fission products in assembly calculation ............................................................... 86 Table A.25. Results for decay heat in assembly calculation at discharge (W/tHMI) ............... 86 Table A.26. Results for decay heat in assembly calculation at 5 years (W/tHMI) ................... 86 Table A.27. Results for decay heat in assembly calculation at 50 years (W/tHMI) ................. 87 Table A.28. Results for decay heat in assembly calculation at 100 years (W/tHMI) ............... 87 Table A.29. Result for decay heat in assembly calculation at 300 years (W/tHMI) ................. 87 Table A.30. Trends of relative standard deviation versus cooling time for decay heat in
assembly calculation ............................................................................................. 87 Table A.31. Results for neutron emission rate in assembly calculation at discharge
(n/s/tHMI) ............................................................................................................. 88 Table A.32. Results for neutron emission rate in assembly calculation at 5 years
(n/s/tHMI) ............................................................................................................. 88 Table A.33. Results for neutron emission rate in assembly calculation at 50 years
(n/s/tHMI) ............................................................................................................. 88 Table A.34. Results for neutron emission rate in assembly calculation at 100 years
(n/s/tHMI) ............................................................................................................. 88 Table A.35. Results for neutron emission rate in assembly calculation at 300 years
(n/s/tHMI) ............................................................................................................. 89 Table A.36. Trends of relative standard deviation versus cooling time for neutron
emission rate ......................................................................................................... 89 Table B.1. Results for actinides in assembly calculation (g/tHMI) .......................................... 90 Table B.2. Results for actinides in assembly calculation (g/tHMI) .......................................... 91 Table B.3. Results for actinides in assembly calculation (g/tHMI) .......................................... 92 Table B.4. Results for actinides in assembly calculation (g/tHMI) .......................................... 93 Table B.5. Results for actinides in assembly calculation (g/tHMI) .......................................... 94 Table B.6. Results for actinides in assembly calculation (g/tHMI) .......................................... 95

NEA/NSC/R(2016)3
8
Table B.7. Trends of relative standard deviation versus cooling time for actinides masses ..... 96 Table B.8. Results for fission products in assembly calculation (g/tHMI) ............................... 97 Table B.9. Results for fission products in assembly calculation (g/tHMI) ............................... 99 Table B.10. Results for fission products in assembly calculation (g/tHMI) ........................... 101 Table B.11. Results for fission products in assembly calculation (g/tHMI) ........................... 103 Table B.12. Results for fission products in assembly calculation (g/tHMI) ........................... 105 Table B.13. Results for fission products in assembly calculation (g/tHMI) ........................... 107 Table B.14. Trends of relative standard deviation versus cooling time for FP masses ........... 109 Table B.15. Results for activation products in assembly calculation (g/tHMI) ...................... 110 Table B.16. Results for activation products in assembly calculation (g/tHMI) ...................... 111 Table B.17. Results for activation products in assembly calculation (g/tHMI) ...................... 111 Table B.18. Results for activation products in assembly calculation (g/tHMI) ...................... 112 Table B.19. Results for activation products in assembly calculation (g/tHMI) ...................... 112 Table B.20. Trends of relative standard deviation versus cooling time for AP masses .......... 112 Table B.21. Results for AP-FP in assembly calculation (g/tHMI) .......................................... 113 Table B.22. Results for AP-FP in assembly calculation (g/tHMI) .......................................... 114 Table B.23. Results for AP-FP in assembly calculation (g/tHMI) .......................................... 115 Table B.24. Results for AP-FP in assembly calculation (g/tHMI) .......................................... 115 Table B.25. Results for AP-FP in assembly calculation (g/tHMI) .......................................... 116 Table B.26. Results for AP-FP in assembly calculation (g/tHMI) .......................................... 117 Table B.27. Trends of relative standard deviation versus cooling time for AP-FP masses .... 118 Table B.28. Results for Neutronic emission rate in assembly calculation .............................. 118 Table B.29. Results for neutronic emission rate in assembly calculation ............................... 118 Table B.30. Results for neutronic emission rate in assembly calculation ............................... 118 Table B.31. Results for neutronic emission rate in assembly calculation ............................... 119 Table B.32. Results for neutronic emission rate in assembly calculation ............................... 119 Table B.33. Trends of relative standard deviation versus cooling time for neutronic
emission rate ....................................................................................................... 119 Table B.34. Results for decay heat in assembly calculation (CEA) ........................................ 119 Table B.35. Results for decay heat in assembly calculation (NNL) ....................................... 120 Table B.36. Results for decay heat in assembly calculation (GRS KENOREST) .................. 120 Table B.37. Results for decay heat in assembly calculation (KURCHATOV) ....................... 120 Table B.38. Results for decay heat in assembly calculation (UNIPI) ..................................... 121 Table B.39. Trends of relative standard deviation versus cooling time for decay heat........... 121

NEA/NSC/R(2016)3
9
List of abbreviations and acronyms
AP Activation Product
BWR Boiling Water Reactor
CEA Commissariat à l'énergie atomique et aux énergies alternatives
EDF Électricité de France
EGRPANS Expert Group on Reactor Physics and Advanced Nuclear Systems
FP Fission Product
MOX Mixed oxide
NEA Nuclear Energy Agency
NNL National Nuclear Laboratory
NSC Nuclear Science Committee
PIST Pre-Irradiation Storage Time
PWR Pressurised Water Reactor
RSD Relative Standard Deviation
SD Standard Deviation
UNIPI University of Pisa
WPRS Working Party on Scientific Issues of Reactor Systems

NEA/NSC/R(2016)3
10
1. Introduction
Some years ago, the NEA Working Party on Scientific Issues in Reactor Systems (WPRS), which is overseen by the Nuclear Science Committee (NSC), began a depletion benchmark which involved the calculation of isotopic inventories in an irradiated PWR-MOx fuel assembly and derived quantities such as decay heat, neutron emissions and the build-up of activation products. Previously, the WPRS had undertaken a similar depletion benchmark for UOx fuel that constituted the first phase of the benchmark [1]. This MOx benchmark represents the second phase of the original study as originally planned.
The MOx benchmark was started shortly before the UOx benchmark was completed, but was brought to a halt by movements of staff within CEA who initiated and led the work. More recently the WPRS asked if the benchmark could be resumed, so as not to lose the effort that had been invested in it and CEA kindly offered to do so. Though some of the results are now dated, they are still relevant today and it is intended that this report will record them and provide a benchmark for any researchers who might wish to apply more modern codes and nuclear data to this problem.
As in the UOx phase, the objective of this benchmark is to compare existing depletion calculations obtained with various codes and data libraries applied to fuel and back-end cycle configuration: transport, reprocessing, interim storage and waste repository. The benchmark focuses on nuclide densities for the most important nuclides in the fuel cycle (actinides, fission products and activation products) and the associated fuel cycle quantities (masses, neutron emission rate and decay heat) [2].
A benchmark exercise should ideally be able to compare calculations with measured data from an experiment. Unfortunately this is not always possible, because experimental results are often constrained by commercial restrictions. Though a suitable set of experimental results have been obtained on fuel irradiated in the SAINT-LAURENT B1 (SLB1) reactor, it has not proved possible to release the full experimental results and supporting information. Instead, CEA offered to specify a benchmark based on the SLB1 irradiation experiment and to use this for code-to-code comparisons rather than direct comparison against measured data. CEA offered to provide their own calculations as a surrogate for the experimental data that would provide an indication of the degree of consistency between the various depletion schemes, codes and nuclear data. This approach cannot provide a means of validating the different codes, for which the full experimental datasets would be required. Nevertheless, the fact that CEA’s calculation methods have been validated using the SLB1 data provides some degree of confidence that the surrogate data will not be very much in error and even with this limitation, the WPRS considered this benchmark to be a worthwhile exercise. The SLB1 problem specification was simplified somewhat to provide an approximate representation of the main fuel irradiation conditions, eliminating unnecessary detail while retaining the fundamental characterisation.
SAINT-LAURENT B1 (SLB1) was the first French reactor to use MOx assemblies. SLB1 is a 900 MWe PWR, with 30% MOx fuel loading. The standard MOx assemblies, used in Saint-Laurent B1 reactor, include three zones with different plutonium enrichments, high Pu

NEA/NSC/R(2016)3
11
content (5.64%) in the centre zone, medium Pu content (4.42%) in the intermediate zone and low Pu content (2.91%) in the peripheral zone. The objective of the different plutonium enrichments is to flatten the power distribution within assemblies and to attenuate fission rate discontinuities at the MOx-UOx interface.

NEA/NSC/R(2016)3
12
2. Description of the benchmark
2.1 Description of SAINT-LAURENT B1 reactor
The Saint Laurent Reactor is a PWR (Pressurised Water Reactor) which has a unit capacity of 900 MWe. There are two reactors in the Saint Laurent power plant, SLB1 and SLB2, which began commercial operation in 1983 and use the standard 17x17 PWR fuel rod assembly.
SLB1 is a production reactor which uses MOx fuel. The SLB1 core makes use of MOx and UO2 (UOx) assemblies, with approximately 30% MOx and 70% UOx. In the MOx assembly used in SLB1, plutonium is distributed in three zones with different plutonium enrichments, as noted above. Figure 1 shows a super-cell cluster of four assemblies in the reactor (one MOx assembly with three UO2 fuel assemblies). The MOx assembly has three zones with different plutonium contents (often referred to as enrichment zones), used to flatten the power peaking in peripheral fuel rods due to the diffusion of thermal neutrons from the UOx zones. The outer enrichment zone has the lowest plutonium enrichment, as indicated in the legend.
Figure 1. Four fuel assembly super-cell (MOx fuel assembly with UOx environment)

NEA/NSC/R(2016)3
13
Each assembly (that includes both UOx and MOx) has 24 control rod guide tubes (in black in the Figure 2) and 1 instrument tube (central position). The benchmark is based on the two fuel pins which are located in the peripheral zone of the assembly (position Q17 in Figure 2) and in the central zone of assembly (position L14). Q17 contains 2.91% Pu (low enrichment) and L14 contains 5.64% Pu (high enrichment). The inventory calculation for Q17 is strongly influenced by the UOx rods immediately adjacent to it in the UOx neighbouring UOx assembly in this mixed UOx-MOx core.
Figure 2. Location of the subject fuel pins Q17 and L14
2.2 Geometry and fuel composition data
The benchmark focuses on a fuel assembly which was irradiated to what was at the time a high burn-up of 40 GWd/t at discharge. As shown in Figure 2, the two subject fuel rods are located at positions Q17 (in the peripheral zone) and L14 (in the central zone).
2.2.1 MOx fuel compositions
The initial MOx composition selected is representative of realistic MOx and UO2 fuels irradiated in a mixed UO2-MOx PWR core. This MOx fuel contains plutonium with an isotopic composition that is typical of plutonium derived from reprocessing of thermal reactor UO2 fuels. The fuel has a stoichiometry of exactly 2.00 and a nominal density of 10.02 gcm-3. Table 1 shows the plutonium isotopic composition, with the same isotopic composition used in all three Pu content zones. Table 2 shows the uranium isotopic composition in the MOx pins. The initial MOx fuel enrichments for these zones and the fuel composition are given in Tables 3 and 4.

NEA/NSC/R(2016)3
14
Table 1. Plutonium isotopic composition in fresh MOx fuel
Nuclide Isotopic composition (atom%) 238Pu 0.8 239Pu 66.7 240Pu 20.6 241Pu 7.5 242Pu 2.9 241Am 1.5
Table 2. Uranium isotopic composition in fresh MOx fuel
Nuclide Isotopic composition (atom%) 234U 0.002 235U 0.22 236U 0.004 238U 99.774
Table 3. Initial MOx fuel content
Pu content zone MOx fuel plutonium content, w/o [Pu_total+Am]/[U+Pu+Am]
High 5.64 Medium 4.42
Low 2.91
Table 4. Initial MOx fuel compositions (atoms/barn.cm)
Nuclide High Medium Low 234U 4.2175E-07 4.2718E-07 4.3391E-07 235U 4.9766E-05 4.8271E-05 4.9682E-05 236U 4.2175E-07 8.5435E-07 8.6782E-07 238U 2.1037E-02 2.1309E-02 2.1644E-02
238Pu 1.0815E-05 8.1476E-06 5.4861E-06 239Pu 8.3501E-04 6.5555E-04 4.3144E-04 240Pu 2.5798E-04 2.0151E-04 1.3387E-04 241Pu 9.4430E-05 7.4065E-05 4.8185E-05 242Pu 3.6112E-05 2.7751E-05 1.8859E-05 241Am 1.7374E-05 1.4626E-05 9.1090E-06
16O 4.4678E-02 4.4681E-02 4.4685E-02 Fuel density (gcm-2) 10.020 10.020 10.020
2.2.2 UO2 fuel compositions
For the calculations, the adjacent UO2 fuel assemblies are modelled as previously burned. They have an initial enrichment of 3.25 w/o and are assumed to have a nominal burn-up of 24 GWd/t. The composition of this irradiated UO2 fuel is presented in Table 5.

NEA/NSC/R(2016)3
15
Table 5. Initial composition for irradiated UO2 fuel (atoms/barn.cm) 235U 3.0E-04 236U 8.0E-05 238U 2.0E-02
237Np 7.1E-06 238Pu 1.7E-06 239Pu 1.2E-04 240Pu 3.8E-05 241Pu 2.1E-05 242Pu 5.3E-06 241Am 4.2E-07 131Xe 1.4E-05 135Xe 8.0E-09 153Eu 2.8E-06 149Sm 9.0E-08 103Rh 1.8E-05 143Nd 2.5E-05 133Cs 3.5E-05 155Gd 8.4E-10 99Tc 3.2E-05 95Mo 3.2E-05
147Pm 6.4E-06 150Sm 7.5E-06 151Sm 4.1E-07 152Sm 3.2E-06
16O 4.51E-02
2.2.3 Geometry data
The assembly geometry relates to a typical 17 x 17 PWR fuel assembly, as detailed below:
• fuel pin pitch: 1.262 cm;
• fuel pin radius: 0.474 cm;
• fuel pellet radius: 0.4126 cm.
The air gap between fuel and cladding is not modelled. The inter-assembly water gap is 0.155 cm thick. In each assembly (both UOx and MOx assemblies), there are 24 guide tubes and 1 instrument tube modelled as water filled zircaloy tubes with the following dimensions:
• outer radius: 0.613 cm;
• inner radius: 0.571 cm.

NEA/NSC/R(2016)3
16
2.2.4 Non-fissile material data
The cladding and guide tubes are composed of zircaloy-4, and the coolant (moderator) is light water with 550 ppm boron. These compositions are presented in Table 6.
Table 6. Cladding and guide tubes; coolant/moderator (550 ppm boron)
Nuclide Atoms/barn.cm Zr (natural) 3.955E-02 Fe (natural) 1.383E-04 Cr (natural) 7.072E-05
16O 2.874E-04
Nuclide Atoms/barn.cm H 4.724E-02
16O 2.362E-02 10B 4.321E-06 11B 1.739E-05
2.2.5 Impurities for MOx fuels
The nominal number densities of impurities, analogous to those used in the UOx phase, are specified in Table 7. The activation products masses are derived from the specified initial fuel impurities used as the starting point.
Table 7. Initial fuel impurities
Isotopes atoms/tHM grams/tHM 1H 2.0491E+23 3.4026E-01 2H 3.0741E+19 1.0201E-04 10B 6.2931E+21 1.0454E-01 11B 2.5331E+22 4.6268E-01 12C 5.6257E+24 1.1210E+02 13C 6.2571E+22 1.3511E+00 14N 4.8610E+23 1.1301E+01 15N 1.7857E+21 4.4471E-02 35Cl 3.6473E+23 2.1198E+01 37Cl 1.1663E+23 7.1659E+00 40Ca 4.9532E+24 3.2900E+02 42Ca 3.3058E+22 2.3055E+00 43Ca 6.8978E+21 4.9252E-01 44Ca 1.0658E+23 7.7869E+00 46Ca 2.0438E+20 1.5610E-02 48Ca 9.5547E+21 7.6153E-01 54Fe 3.5435E+23 3.1776E+01 56Fe 5.6040E+24 5.2112E+02 57Fe 1.3441E+23 1.2722E+01 58Fe 1.7106E+22 1.6476E+00 59Co 1.3896E+23 1.3614E+01 58Ni 2.3817E+24 2.2939E+02

NEA/NSC/R(2016)3
17
Table 7. Initial fuel impurities (continued) 60Ni 9.1052E+23 9.0717E+01 61Ni 3.9421E+22 3.9931E+00 62Ni 1.2524E+23 1.2894E+01 64Ni 3.1746E+22 3.3739E+00 63Cu 7.4286E+23 7.7715E+01 65Cu 3.3110E+23 3.5739E+01 90Zr 3.8493E+23 5.7467E+01 91Zr 8.3944E+22 1.2672E+01 92Zr 1.2831E+23 1.9582E+01 94Zr 1.3003E+23 2.0277E+01 96Zr 2.0949E+22 3.3363E+00 93Nb 7.3465E+23 1.1334E+02 92Mo 3.1677E+23 4.8356E+01 94Mo 1.9745E+23 3.0796E+01 95Mo 3.3982E+23 5.3568E+01 96Mo 3.5604E+23 5.6716E+01 97Mo 2.0385E+23 3.2811E+01 98Mo 5.1507E+23 8.3759E+01 100Mo 2.0556E+23 3.4111E+01 112Sn 5.5781E+21 1.0365E+00 114Sn 3.7379E+21 7.0698E-01 115Sn 2.0702E+21 3.9500E-01 116Sn 8.3557E+22 1.6081E+01 117Sn 4.4165E+22 8.5733E+00 118Sn 1.3928E+23 2.7268E+01 119Sn 4.9341E+22 9.7419E+00 120Sn 1.8741E+23 3.7314E+01 122Sn 2.6626E+22 5.3896E+00 124Sn 3.3296E+22 6.8506E+00
16O 5.0502E+27 1.3418E+05 17O 1.9237E+24 5.4321E+01 18O 1.0125E+25 3.0272E+02
2.3 Irradiation parameters and history
The benchmark uses a nominal fuel temperature of 900 K, a cladding temperature of 620 K and a moderator temperature of 582 K. The experimental data indicate that the assembly was irradiated for three cycles. The power histories were specified such that target burn-ups of 38 GWd/t and 42 GWd/t are attained for the two subject MOx fuel pins Q17 or L14, respectively. The neutronic calculation is performed with an infinite lattice of the cluster of four fuel assemblies (Figure 1). The boundary conditions are reflective at the boundary of the super-cell and all the depletion calculations are made considering a fixed B2 buckling to simulate axial neutron leakage.

NEA/NSC/R(2016)3
18
• Q17 MOx fuel pin:
– cycle 1: 285 days full power, EOC (End Of Cycle) burn-up = 12 GWd/t, cooling time of 60 days;
– cycle 2: 300 days full power, EOC burn-up = 25 GWd/t, cooling time of 40 days;
– cycle 3: 280 days full power, EOC burn-up = 38 GWd/t;
• L14 MOx fuel pin:
– cycle 1: 285 days full power, EOC burn-up = 12 GWd/t, cooling time of 60 days;
– cycle 2: 300 days full power, EOC burn-up = 25 GWd/t, cooling time of 40 days;
– cycle 3: 280 days full power, EOC burn-up = 42 GWd/t;
2.4 Required quantities
The required quantities of the benchmark are the masses of nuclides (actinides, fission products, and activation products), neutron emission, and decay heat. The results are compared at discharge (zero cooling time), 5 years, 50 years, 100 years and 300 years cooling time.
2.4.1 Masses of the following nuclides
Actinides: 232U, 233U, 234U, 235U, 236U, 238U, 236Np, 237Np, 236Pu, 238Pu, 239Pu, 240Pu, 241Pu, 242Pu, 243Pu, 244Pu, 241Am, 242mAm, 243Am, 242Cm, 243Cm, 244Cm, 245Cm, 246Cm, 247Cm, 248Cm, 226Ra, 228Ra, 227Ac, 229Th, 230Th, 232Th, 252Cf.
Fission products: 79Se, 85Kr, 85Rb, 87Rb, 88Sr, 90Sr, 93mNb, 95Mo, 97Mo, 99Tc, 101Ru, 106Ru, 103Rh, 107Pd, 108mAg, 109Ag, 110mAg, 127I, 129I, 130Xe, 131Xe, 132Xe, 134Xe, 136Xe, 133Cs, 134Cs, 135Cs, 137Cs, 136Ba, 138Ba, 139La, 140Ce, 144Ce, 142Nd, 143Nd, 144Nd, 145Nd, 146Nd, 148Nd, 150Nd, 147Pm, 146Sm, 147Sm, 148Sm, 149Sm, 150Sm, 151Sm, 152Sm, 154Sm, 153Eu, 154Eu, 155Eu, 154Gd, 155Gd, 156Gd, 166mHo.
Activation products: 36Cl, 41Ca, 53Mn, 54Mn, 55Fe, 60Fe, 60Co, 59Ni, 63Ni, 93Mo
Some activation products are produced both by fission and activation reactions and these two contributions are evaluated separately for: 3H, 10Be, 14C, 93Zr, 94Nb, 119mSn, 121mSn, 126Sn, 125Sb.
2.4.2 Neutron emission:
(α,n) emission, spontaneous fission and total emission are calculated.
2.4.3 Decay heat:
α, β and γ decay heat are calculated as well as total decay heat.

NEA/NSC/R(2016)3
19
3. The DARWIN package
The DARWIN package has been developed by CEA and its French partners (AREVA and EDF) to estimate the physical quantities characterising spent fuel from reactors: material balance, decay heat, activity, neutron, α, β, γ sources and spectrum, radiotoxicity [3,4]. DARWIN is applicable to all cycle studies, with current fuels (uranium oxide, mixed oxide) or innovative fuels and for every reactor type (Pressurised Water Reactor, Fast Breeder Reactor, Boiling Water Reactor, Advanced Reactors). DARWIN is also used in the back-end cycle for actinide incineration or long-term interim storage studies (Figure 3).
Figure 3. General outline and scope of DARWIN form
In the CEA calculations for the benchmark, the DARWIN2.3 version based on JEFF3.1.1 [5] nuclear data is used. A summary of the DARWIN2.3 validation for PWR and BWR fuel inventory and decay heat can be found in [6].
The simplified DARWIN structure, based on new codes and libraries is illustrated in Figure 4.
The PEPIN2 programme performs the nuclide depletion calculations. Different libraries feed this module:
• neutronics data provided by French assembly transport codes APOLLO2 [7] (for Pressurised Water Reactor studies), ECCO-ERANOS system (for Fast Breeder Reactor studies): these are self-shielded cross-sections and neutron spectra;

NEA/NSC/R(2016)3
20
• nuclear data (decay data, fission and (α, n) yields) and evolution chains;
• complementary cross-sections, missing from the transport codes libraries, especially for activation products.
The basic nuclear data come from the JEFF-3.1.1 European evaluation; in the scope of our study, the neutronics data required for the depletion module are provided by the APOLLO2 [7] code and its CEA2005 library and benefits from its extensive experimental validation, for Pressurised Water Reactor (PWR) lattices. For PWR modelling, the CYCLE2008 [4] calculation scheme uses the CEA2005 cross-section library with the SHEM 281 group structure [8], which is processed from the JEFF3.1.1 evaluation. The neutron energy spectrum is calculated in 2D assembly geometry, using a Pij multi-cell model, specifically the UP1 Interface Current method based on linearly anisotropic interface fluxes. The fuel pellets are split into 4 rings (50%, 30% 15% and 5% of total volume), the objective is to give an accurate representation of absorption of 238U as well as the Fission Product (FP) concentration profile.
The local spectrum calculation is performed in the SHEM 281 energy group structure. Space dependent self-shielding (used only above 23eV which is the upper limit of the fine mesh in SHEM) is repeated at recommended burn-up steps, optimised consistently with the ‘REL2005’ recommendations (0, 4, 8, 12, 24, 36, 48, 60, 72 and 84 GWd/t). There are different self-shielding calculations depending of fuel location, five locations in the MOx and four location in UOx. Refined burn-up steps (units MWd/tHM) are used for the depletion calculation (0, 9.375, 18.75, 37.5, 75, 112.5, 150, 237.5, 325, 412.5, 500, 625, 750, 1000, each 250 up to 2000, each 500 up to 20000, and then each 2000). In MOx assembly calculations, the UO2 environment is taken into account.
DARWIN also enables the retrieval of cumulative reaction rates during irradiation so as to obtain the origin of every isotope build-up. Furthermore, a perturbation module for the main nuclear data, such as capture cross-section, initial isotopic composition, flux, is also available and allows sensitivity studies.
Figure 4. General diagram of DARWIN package

NEA/NSC/R(2016)3
21
4. Analysis method
For each dataset comprising N solutions from the various participants, the average value of each isotope and each cooling time, with Standard Deviation (SD) and Relative Standard Deviation (RSD) are calculated. The average and standard deviation are defined below:
According to the equations above, N is the number of the participants and x is the nuclide
density (or another data requested by the benchmark). To find the degree of consistency between the entire participants, the Relative Standard Deviation (RSD) is calculated:
The Relative Standard Deviation indicates the degree of consistency between the results
provided by the participants:
• a small RSD given by isotope indicates good agreement. It means that there is consistency between the various codes and data used (the value obtained by each participant is almost the same);
• a large RSD indicates poor agreement.
As in the first phase, in this benchmark it is assumed that good agreement between participants has been obtained when the RSD is less than 10%. Otherwise, if the quantities under comparison have a RSD greater than 10%, this was considered to indicate poor agreement between participant’s results. It should be understood that a small RSD does not mean that all participants calculate the correct value, but just they calculate the same value.
In some instances where one or more of the solutions are strongly discrepant with the other solutions, comparisons with the median are used instead because the median is less biased by outliers than the average.

NEA/NSC/R(2016)3
22
5. Participants and codes used
Six contributions were submitted to this benchmark exercise, from five different organisations and five countries. Six calculations were complete for assembly model calculation. They represented both deterministic and Monte-Carlo methods in their calculations. In the table below we summarised the participants, the organisations, codes and nuclear data libraries used.
Table 8. List of the participants and codes used
No Organisation Label
Organisation Codes used Nuclear data library used
1. CEA Commissariat à l’énergie atomique et aux énergies alternatives, France
DARWIN 2.3 (APOLLO2-PEPIN2)
JEFF3.1.1 EAF (Activation Products)
2. NNL National Nuclear Laboratory, United Kingdom
FISPIN JEF2.2
3. KURCHATOV Kurchatov-Institut Russia
MCU Monte Carlo Universal
RUSFOND Library
4. GRNSPG (UNIPI)
San Piero a Grado Nuclear Research Group (GRNSPG) University of Pisa, Italy
TRITON sequence of the SCALE 6.0 code package (NEWT+ORIGEN-S codes)
ENDF B-VII.0 (data library of the SCALE 6.0 code package)
5. GRS-KENOREST Gesellschaft fûr Anlagen-und-Reactorsicherheit, Germany
GRS KENOREST 2004
JEF2.2
6. GRS-TRITON Gesellschaft fûr Anlagen-und-Reactorsicherheit, Germany
TRITON (SCALE 5.0)
ENDF/B-V

NEA/NSC/R(2016)3
23
5.1. CEA (Commissariat à l’énergie atomique et aux énergies alternatives, France)
Institute: Commissariat à l’énergie atomique et aux énergies alternatives.
Country: France
Neutron data library: JEFF3.1.1
Neutron energy group: 281 groups (APOLLO2)
Neutron data processing code or method: APOLLO2-PEPIN2
Description of the code system: DARWIN2.3 (see Section 3.4).
5.2 NNL
Institute: National Nuclear Laboratory
Country: United Kingdom
Participant: Christopher Grove
Nuclear data library: JEF2.2
Neutron energy group: 70 groups (CASMO-4)
Description of the code system: CASMO-4/CAS2FIS/FISPIN
Geometry modelling:
2D representation of the complete full assembly with reflective boundary conditions, but with smearing of the MOx and UOx neutron spectra, following the standard calculation route used for industrial applications of FISPIN.
Omitted nuclides: None.
Cases: obligatory cases of Rod L14 and Rod Q17; no optional cases.
5.3. KURCHATOV
Institute: Kurchatov-Institut
Country: Russia
Participant: Mark S. Yudkevich
Nuclear data library: RUSFOND Library
Neutron energy group: unknown
Description of the code system: MCU Monte Carlo Universal
5.4. GRNSPG (UNIPI)
Institute: San Piero a Grado Nuclear Research Group (GRNSPG), University of Pisa
Country: Italy
Participant: Carlo Parisi
Nuclear data library: ENDF B-VII.0 (data library of SCALE 6.0)
Neutron energy group: 238

NEA/NSC/R(2016)3
24
Neutron data processing code or method: CENTRM 1D code for resonance self-shielding and MCDANCOFF for Dancoff factors calculations.
Description of the code system: TRITON sequence taken from SCALE 6.0
The calculation of GRNSPG/UNIPI is using TRITON taken from SCALE6.0 code package. The neutron transport code was the NEWT code coupled with the depletion code ORIGEN-S.
Geometry modelling: four assembly modelling (3 UOx and 1 MOx) with white boundary conditions imposed (periodic boundary conditions, as requested by benchmark specifications, not available for NEWT code).
5.5. GRS-KENOREST [9] [10] [11] [12] [13] [14] (15] [16] [17] [18]
Institute: Gesellschaft fûr Anlagen-und-Reactorsicherheit
Country: Germany
Participant: Robert Kilger, Ulrich Hesse, Siegfried Langenbuch
Neutron library: JEF2.2 based on the library KORLIB-V4 for KENO-Va; GRS-extended libraries for OREST-HAMMER -ORIGEN, based on JEF2.2/ENDFB-VI, JENDL3.2 and EAF97 for 500 Isotopes.
Neutron data processing code or method: Condensing KORLIB-V4 from 292 group library JEF2.2 for the infinite dilution case; Nordheim resonance treatment is done by the HAMMER code using resonance parameters. 83 neutron energy groups are used, herein 32 thermal groups up to 1,13 eV (KENO-Va); PL-order is 3.
Description of the code system: GRS KENOREST 2004
KENOREST Version 2004 includes KENO-Va code for two or three dimensional assembly calculations using the Monte Carlo Method, coupled to the one dimensional burn-up code system OREST Version 2004 (HAMMER/GRS-ORIGEN-X) for single rod burn-up calculations. The coupling in KENOREST is realised using flux and reaction rate conservation with the FEC method of GRS. The flux spectra and cross-sections calculations for the fuel rods are performed by the HAMMER code (THERMOS-HAMLET) using the method of integral Boltzmann neutron transport calculation and Nordheim resonance treatment in the resonance region. The cross-sections are directly fed back to KENO.
Notes:
First, decay heat and powers calculated by KENOREST are related to the complete set of nuclides in GRS-ORIGEN-X, not only to those specified for the benchmark.
Second, (α,n)- and spontaneous fission neutron emissions were calculated for the specified nuclide set of interest using the GRS code NGSRC taken from GRS ANITABL code system (thus not being part of KENOREST).
Geometry modelling:
2D full fuel element plus UOx environment with periodic boundaries; details exactly as proposed by specification. UOx environment was not depleted but was included in flux and reactivity calculations during burn-up.
Omitted nuclides: None.
Cases: Obligatory assembly cases L14 and Q17; no optional cases.

NEA/NSC/R(2016)3
25
5.6. GRS-TRITON [19]
Institute: Gesellschaft fûr Anlagen-und-Reactorsicherheit, Germany
Country: Germany
Participant: Robert Kilger, Ulrich Hesse, Siegfried Langenbuch
Neutron library:
ENDF/B-V based 44GROUPNDF5 library of SCALE 5.0; no activation data file included, thus no activation products being calculated.
Neutron data processing code or method:
Cross-section processing and Nordheim resonance treatment by BONAMI-NITAWL sequence of SCALE 5.0.
Description of the code system: TRITON taken from SCALE 5.0
The following modules are being part of the SCALE 5.0 code package: TRITON-sequence using BONAMI-NITAWL for pre-processing; two-dimensional discrete ordinates transport algorithm NEWT for 2D flux calculations, and ORIGEN-S depletion calculation code for single rod burn-up and decay steps. Flux coupling between NEWT and ORIGEN-S performed by the COUPLE module. OPUS module was used for refining the resulting data.
Geometry modelling:
2D quarter fuel element and respective UOx environment with reflective boundaries (see Figure 5). The UOx environment was not depleted but was included in flux and reactivity calculations during burn-up.
Omitted nuclides:
Due to omittance in the neutron library these nuclides were not used in the input file: fuel impurities C-13/14, O-17/18, Cl-35/37; all Ca, Fe, Ni, Cu. As a result of these omissions, the respective activation products in the results are not valid. Decay heats and neutron emission are not available up to now.
Cases: obligatory assembly cases L14 and Q17; no optional cases.
Figure 5. NEWT/TRITON geometry model of benchmark case Q17

NEA/NSC/R(2016)3
26
6. Results and code-to-code comparison for isotopic concentrations
6.1. Actinides results
6.1.1. Q17 Fuel rod
The actinides results for rod Q17 are listed in Appendix A, Tables A.1-A.6. These tables give the relative standard deviation (RSD) at different cooling times. Figure 6 shows RSD versus cooling time for selected actinides. Table 9 below summarises the main trends obtained for RSD, grouping the various nuclides into those with <10% RSD and >10%RSD.
Figure 6. RSD versus cooling time for actinides in Q17 fuel rod
Table 9. Summary of RSD major trends at discharge for the actinides in Q17 fuel rod
Relative standard deviation
≤ 10% > 10%
Isotopes 235U, 236U, 238U, 237Np, 240Pu, 241Pu, 242Pu, 243Am, 242Cm, 243Cm, 244Cm, 226Ra, 228Ra, 230Th, 232Th
232U, 233U, 234U, 236Np, 236Pu, 238Pu, 239Pu, 243Pu, 244Pu, 241Am, 242mAm, 245Cm, 246Cm, 247Cm, 248Cm, 227Ac, 229Th, 252Cf
Most of the actinides have a RSD in excess of 10%. As this is a relatively poor level of agreement, the following analysis focuses on some of the more important actinides:
235U, 238U, 239Pu: Table 10 shows the discharge inventories for 235U, 238U, and 239Pu.
0.00%
50.00%
100.00%
150.00%
200.00%
250.00%
300.00%
Relative Standard Deviation versus cooling time for Actinide (Q17 fuel rod)
Discharge
5 years
50 years
100 years
300 years

NEA/NSC/R(2016)3
27
Table 11 shows the comparison between calculated results for 235U, 238U, 239Pu and median value at discharge. We can see that results are consistent between all the participants. For 235U, most of the values are close to the median. At least, for 238U all participants are very consistent.
Table 10. Results at discharge for 235U, 238U and 239Pu (g/tHMI)
CEA NNL KURCHATOV UNIPI GRS (KENOREST)
GRS (TRITON)
MEDIAN SD RSD
235U 5.946E+02 6.180E+02 5.896E+02 7.085E+02 5.852E+02 5.857E+02 5.921E+02 4.81E+01 7.83% 238U 9.395E+05 9.394E+05 9.391E+05 9.352E+05 9.390E+05 9.387E+05 9.391E+05 1.63E+03 0.17%
239Pu 6.819E+03 7.054E+03 7.053E+03 9.489E+03 7.239E+03 7.133E+03 7.094E+03 1.00E+03 13.42%
Table 11. Comparison for 235U, 238U and 239Pu to the median value (M) at discharge MEDIAN (CEA-M)/M (NNL-M)/M (KURCH-M)/M (UNIPI-M)/M (GRSK-M)/M (GRST-M)/M
235U 5.921E+02 0% 4% 0% 20% -1% -1% 238U 9.391E+05 0% 0% 0% 0% 0% 0%
239Pu 7.094E+03 -4% -1% -1% 34% 2% 1%
Table 12 shows RSD versus cooling time for 235U, 238U, 239Pu. For 235U and 238U the RSD is less than 10% for all cooling times considered, implying good agreement between the participants for these actinides. For 239Pu, RSD is about 13%.
Table 12. Trends on RSD with cooling time for actinides in Q17 fuel rod
Even though these results are broadly consistent, we can see different trends on these major actinides due to the different modelling approaches. Figure 7 shows the calculated masses for 235U, 238U, 239Pu. We can see that for 238U, UNIPI has lower values than the others. Because of a greater capture in 238U for UNIPI calculations, we can observe a greater conversion into 239Pu and a lower consumption of 235U. These discrepancies are probably due to a different calculated spectrum in this rod due to a combination of: inconsistent self-shielding treatment; or incorrect modelling of the environment of the fuel rod. As Rod Q17 rod is located at the corner of the assembly, the depletion of actinides is very sensitive to the environment and it is important that the neutron spectrum takes account of the varying thermal neutron spectra in the MOx and UOx assemblies. For example, due to a limitation with the NEWT code, UNIPI is forced to use white boundary conditions instead of periodic ones and this could be one of the reasons why differences are seen. In the case of the NNL calculations, the spectra of the UOx and MOx regions were smeared, following the standard calculation method used in industrial applications. The thermal neutron spectrum for Rod Q17 is therefore harder than it should be, which results in slightly increased 239Pu production and a slightly slower depletion rate for 235U. These effects are consistent with the data shown in Figure 7. Due to a limitation of the NEWT code, white boundary conditions were used in the UNIPI solution instead of the periodic boundary conditions specified. The trends for 235U, 238U and 239Pu for the UNIPI solution are in the same sense as those of the NNL results and the boundary conditions may be a contributory factor.
Discharge 5 years 50 years 100 years 300 yearsU235 7.83% 7.85% 7.92% 7.99% 8.28%U238 0.17% 0.17% 0.17% 0.17% 0.17%Pu239 13.42% 13.18% 13.17% 13.17% 13.14%

NEA/NSC/R(2016)3
28
Figure 7. Masses (g/tHMI) calculated by the participants for 235U, 238U and 239Pu
0.00E+00
1.00E+02
2.00E+02
3.00E+02
4.00E+02
5.00E+02
6.00E+02
7.00E+02
8.00E+02
9.00E+02
Discharge 5 years 50 years 100 years 300 years
Mas
ses
235U Q17
CEA
NNL
KURCHATOV
UNIPI
GRS-KENOREST
GRS-TRITON
9.33E+05
9.34E+05
9.35E+05
9.36E+05
9.37E+05
9.38E+05
9.39E+05
9.40E+05
Discharge 5 years 50 years 100 years 300 years
Mas
ses
238U Q17
CEA
NNL
KURCHATOV
UNIPI
GRS-KENOREST
GRS-TRITON
0.00E+00
2.00E+03
4.00E+03
6.00E+03
8.00E+03
1.00E+04
1.20E+04
Discharge 5 years 50 years 100 years 300 years
239Pu Q17
CEA
NNL
KURCHATOV
UNIPI
KENOREST
GRS-TRITON

NEA/NSC/R(2016)3
29
232U, 236Np, 236Pu: These three isotopes are connected as shown with the chain below (see Figure 8). Table 13,
shows that 236Np and 236Pu each has an RSD around 50% and for 232U, RSD is almost 60%, indicating that there is poor agreement between the participants. The 237Np calculations are satisfactory with a RSD of 12%.
Figure 8. Decay scheme of 237Np, 236Np, 236Pu and 232U
Table 13. Results at discharge for 237Np, 236Np, 236Pu and 232U (g/tHMI)
CEA NNL KURCHATOV UNIPI GRS (KENOREST)
GRS (TRITON)
MEDIAN RSD
237Np 1.343E+02 1.238E+02 1.327E+02 1.686E+02 1.271E+02 1.360E+02 1.335E+02 11.75% 236Np 1.304E-04 2.246E-04 1.678E-04 2.916E-04 1.402E-04 7.071E-05 1.540E-04 45.39% 236Pu 4.618E-04 8.322E-04 6.618E-04 1.217E-03 4.735E-04 3.401E-04 5.677E-04 48.36% 232U 9.120E-05 2.873E-04 1.290E-04 2.624E-04 9.090E-05 7.855E-05 1.101E-04 59.73%
Table 14 shows that calculated results for 237Np are consistent between the participants. In MOx fuel, the major production route for 237Np is from the (n,2n) reaction with 238U. This implies that this reaction is well calculated by all the participants. For the other isotopes (236Np, 236Pu and 232U), CEA, KURCHATOV and GRS-KENOREST inventories are close to the median.
Table 14. Masses comparison for 237Np, 236Np, 236Pu and 232U to the median value (M) at discharge
MEDIAN (CEA-M)/M (NNL-M)/M (KURCH-M)/M (UNIPI-M)/M (GRSK-M)/M (GRST-M)/M 237Np 1.371E+02 1% -7% -1% 26% -5% 2% 236Np 1.709E-04 -15% 46% 9% 89% -9% -54% 236Pu 6.644E-04 -19% 47% 17% 114% -17% -40% 232U 1.566E-04 -17% 161% 17% 138% -17% -29%
Table 15 shows RSD versus cooling time for 236Np, 236Pu and 232U. The RSD at each cooling time is almost the same.
Table 15. RSD versus cooling time for 236Np, 236Pu and 232U Discharge 5 years 50 years 100 years 300 years
232U 59.73% 45.32% 49.41% 49.50% 49.86% 236Np 45.39% 45.38% 45.38% 45.38% 45.36% 236Pu 48.36% 48.93% 54.74% 52.52% 53.40%
Due to the significant discrepancies observed, it may be misleading to use the median or average as the reference and Table 16 compares the various discharge inventories against the CEA calculations instead. We can see that GRS-KENOREST calculations are in closest agreement with CEA.

NEA/NSC/R(2016)3
30
Table 16. Comparison for 237Np, 236Np, 236Pu and 232U to the CEA value at discharge
(NNL-CEA) /CEA
KURCHATOV-CEA) /CEA
(UNIPI-CEA) /CEA
(GRS'K-CEA) /CEA
(GRS'T-CEA) /CEA
237Np -8% -1% 26% -5% 1% 236Np 72% 29% 124% 8% -46% 236Pu 80% 43% 164% 3% -26% 232U 215% 41% 188% 0% -14%
The fact that 237Np is in good agreement between the participants shows that the cross-sections for 238U(n,2n)237Np are reasonably consistent. However, the poor agreement for 236Np and 236Pu indicates inconsistencies in the cross-sections for 237Np(n,2n)236Np. 236Np and 236Pu are quite closely correlated, as would be expected since they are linked by beta decay. The correlation for 232U is quite close to that for 236Np and 236Pu, except for the NNL result. There are multiple production routes for 232U, one of which depends on the Pre-Irradiation Storage Time (PIST) which may have been treated differently by the different participants.
243Pu: Figure 6 shows surprising behaviour of the RSD at 100 years cooling time for 243Pu. The
discrepancy is larger than at discharge, 5 years, 50 years and 300 years cooling time. The large RSD is due to the value of GRS-TRITON which is very different, in order 10-5, while the others are in order 10-12 (see Table 17). Since the GRS-TRITON results for other cooling times are not so discrepant, the value at 100 years is likely to be a simple transcription error.
Table 17. Masses (g/tHMI) and RSD at 100 years cooling time for 243Pu
CEA NNL KURCHATOV UNIPI GRS (KENOREST)
GRS (TRITON) MEDIAN RSD
243Pu 3.340E-12 1.934E-12 2.743E-12 4.916E-12 2.826E-12 6.892E-05 2.826E-12 35.13%
238Pu, 240Pu, 241Pu, 242Pu:
Figure 9 shows the masses calculated by the participants for 238Pu, 240Pu, 241Pu and 242Pu. In MOx fuels, 238Pu is produced by decay of 242Cm (which in turn comes from 241Am neutron capture, followed by 242Am decay). 242Cm is calculated with good agreement between the participants (RSD=3% at discharge). 238Pu is consistent between the participants except for the UNIPI calculations where it is overestimated. 240Pu, 241Pu and 242Pu are calculated consistently by the participants with RSDs below 10%. 240Pu is produced by neutron capture from 239Pu. The UNIPI calculations overestimate the inventory of 239Pu and this leads to a corresponding overestimate of 240Pu.
241Pu is produced by neutron capture from 240Pu and good agreement is obtained between the participants. 242Pu is mainly produced by neutron capture from 241Pu and there are some discrepancies between the participants.

NEA/NSC/R(2016)3
31
Figure 9. Masses (g/tHMI) calculated by the participants for 238Pu, 240Pu, 241Pu and 242Pu
0.00E+00
1.00E+02
2.00E+02
3.00E+02
4.00E+02
5.00E+02
6.00E+02
7.00E+02
Discharge 5 years 50 years 100 years 300 years
Mas
ses
238Pu Q17
CEANNLKURCHATOVUNIPIGRS-KENORESTGRS-TRITON
5.20E+03
5.40E+03
5.60E+03
5.80E+03
6.00E+03
6.20E+03
6.40E+03
6.60E+03
6.80E+03
7.00E+03
Discharge 5 years 50 years 100 years 300 years
240Pu Q17
CEA
NNL
KURCHATOV
UNIPI
GRS-KENOREST
GRS-TRITON
0.00E+005.00E+021.00E+031.50E+032.00E+032.50E+033.00E+033.50E+034.00E+034.50E+03
Discharge 5 years 50 years 100 years 300 years
241Pu Q17
CEA
NNL
KURCHATOV
UNIPI
GRS-KENOREST
GRS-TRITON

NEA/NSC/R(2016)3
32
Figure 9. Masses (g/tHMI) calculated by the participants for 238Pu, 240Pu, 241Pu and 242Pu (continued)
241Am, 242mAm:
Figure 10 shows masses obtained by the participants for 241Am and 242mAm. At this burn-up, 241Am is mainly produced by 241Pu decay. At discharge the RSD is 16.5% and this falls below 10% after cooling. For 242mAm the RSD is about 30% irrespective of the cooling time.
Figure 10. Masses (g/tHMI) calculated by the participants for 241Am and 242mAm
2.20E+032.30E+032.40E+032.50E+032.60E+032.70E+032.80E+032.90E+033.00E+033.10E+03
Discharge 5 years 50 years 100 years 300 years
242Pu Q17
CEA
NNL
KURCHATOV
UNIPI
GRS-KENOREST
GRS-TRITON
0.00E+00
5.00E+02
1.00E+03
1.50E+03
2.00E+03
2.50E+03
3.00E+03
3.50E+03
4.00E+03
Discharge 5 years 50 years 100 years 300 years
241Am Q17
CEA
NNL
KURCHATOV
UNIPI
GRS-KENOREST
GRS-TRITON

NEA/NSC/R(2016)3
33
Figure 10. Masses (g/tHMI) calculated by the participants for 241Am and 242mAm (continued)
242Cm, 234Cm, 244Cm and 245Cm:
Results for these isotopes are shown in Figure 11. 242Cm, 234Cm and 244Cm are consistent at discharge (RSD<10%). From 245Cm and beyond, there is an overestimation by the UNIPI calculations which explains why the RSD increases.
Figure 11. Masses (g/tHMI) calculated by the participants for Cm isotopes
0.00E+00
1.00E+00
2.00E+00
3.00E+00
4.00E+00
5.00E+00
6.00E+00
Discharge 5 years 50 years 100 years 300 years
242mAm Q17
CEA
NNL
KURCHATOV
UNIPI
GRS-KENOREST
GRS-TRITON
0.00E+00
2.00E+01
4.00E+01
6.00E+01
8.00E+01
1.00E+02
1.20E+02
Discharge 5 years 50 years 100 years 300 years
242Cm Q17
CEA
NNL
KURCATOV
UNIPI
GRS-KENOREST
GRS-TRITON

NEA/NSC/R(2016)3
34
Figure 11. Masses (g/tHMI) calculated by the participants for Cm isotopes (continued)
0.00E+00
1.00E+00
2.00E+00
3.00E+00
4.00E+00
5.00E+00
6.00E+00
Discharge 5 years 50 years 100 years 300 years
243Cm Q17
CEANNLKURCATOVUNIPIGRS-KENORESTGRS-TRITON
0.00E+00
1.00E+02
2.00E+02
3.00E+02
4.00E+02
5.00E+02
6.00E+02
Discharge 5 years 50 years 100 years 300 years
244Cm Q17
CEANNLKURCHATOVUNIPIGRS-KENORESTGRS-TRITON

NEA/NSC/R(2016)3
35
Figure 11. Masses (g/tHMI) calculated by the participants for Cm isotopes (continued)
6.1.2. L14 Fuel rod
The actinide results of L14 are listed in Appendix B, Tables B.1-B.7. These tables give masses and the relative standard deviations (RSD) versus cooling times. Figure 12 shows RSD versus cooling time for a selection of actinides. Table 18 summarises the major trends obtained in terms of the RSD.
Figure 12. RSD versus cooling time for actinides in L14 fuel rod
Table 18. Summary of RSD major trends at discharge for the actinides in L14 fuel rod
Relative standard deviation ≤ 10% > 10%
Isotopes 235U, 238U, 238Pu, 239Pu, 240Pu, 241Pu,
242Pu, 241Am, 243Am, 226Ra, 228Ra, 230Th, 232Th
232U, 233U, 234U, 236U 236Np, 237Np, 236Pu, 243Pu, 244Pu,
242mAm, 242Cm, 243Cm, 244Cm, 245Cm, 246Cm, 247Cm, 248Cm, 227Ac,
229Th, 252Cf
0.00E+00
1.00E+01
2.00E+01
3.00E+01
4.00E+01
5.00E+01
6.00E+01
Discharge 5 years 50 years 100 years 300 years
245Cm Q17
CEANNLKURCHATOVUNIPIGRS-KENORESTGRS-TRITON
0%
50%
100%
150%
200%
250%
300%
Relative Standard Deviation versus cooling time for Actinide (L14 fuel rod)
Discharge
5 years
50 years
100 years
300 years

NEA/NSC/R(2016)3
36
RSD values greater than 10%, imply poor agreement between the participants.
We can see that results are less satisfactory for this rod than for Q17, because many of the actinides have higher RSD (see Table 18), even though the spectral uncertainties should be less than for the corner rod Q17. It can be explained by some inconsistencies: In the Kurchatov calculations, we can see that 241Pu and 242mAm do not have beta decay. 238Pu does not decrease to 234U. The problem is the same for the Cm isotopes (see Figure 14).
Figure 13. Masses (g/tHMI) calculated by the participants for 235U, 238U, 239Pu and 240Pu
912000
913000
914000
915000
916000
917000
918000
919000
920000
Discharge 5 Years 50 Years 100 Years 300 Years
U238
CEA
NNL
GRS-KENOREST
GRS-TRITON
KURCHATOV
UNIPI
13000
13500
14000
14500
15000
15500
16000
Discharge 5 years 50 years 100 years 300 years
Pu239
CEA
NNL
GRS-KENOREST
GRS-TRITON
KURCHATOV
UNIPI

NEA/NSC/R(2016)3
37
Figure 13. Masses (g/tHMI) calculated by the participants for 235U, 238U, 239Pu and 240Pu (continued)
Figure 14. Masses (g/tHMI) calculated by the participants for 234U, 238Pu, 241Pu, 241Am, 242mAm and 244Cm
0
200
400
600
800
1000
1200
1400
Discharge 5 Years 50 Years 100 Years 300 Years
U235
CEA
NNL
GRS-KENOREST
GRS-TRITON
KURCHATOV
UNIPI
11400
11600
11800
12000
12200
12400
12600
12800
13000
13200
13400
Discharge 5 Years 50 Years 100 Years 300 Years
Pu240
CEA
NNL
GRS-KENOREST
GRS-TRITON
KURCHATOV
UNIPI
0
1000
2000
3000
4000
5000
6000
7000
8000
Discharge 5 Years 50 Years 100 Years 300 Years
Pu241
CEA
NNL
GRS KENOREST
GRS TRITON
KURCHATOV
UNIPI

NEA/NSC/R(2016)3
38
Figure 14. Masses (g/tHMI) calculated by the participants for 234U, 238Pu, 241Pu, 241Am, 242mAm and 244Cm (continued)
0
1000
2000
3000
4000
5000
6000
7000
Discharge 5 Years 50 Years 100 Years 300 Years
Am241
CEA
NNL
GRS-KENOREST
GRS-TRITON
KURCHATOV
UNIPI
0
2
4
6
8
10
12
14
16
Discharge 5 Years 50 Years 100 Years 300 Years
Am242m
CEA
NNL
GRS-KENOREST
GRS-TRITON
KURCHATOV
UNIPI
0
100
200
300
400
500
600
Discharge 5 Years 50 Years 100 Years 300 Years
Cm244
CEA
NNL
GRS KENOREST
GRS TRITON
KURCHATOV
UNIPI

NEA/NSC/R(2016)3
39
Figure 14. Masses (g/tHMI) calculated by the participants for 234U, 238Pu, 241Pu, 241Am, 242mAm and 244Cm (continued)
As shown in Figure 15, RSD is quite satisfactory for actinides if we exclude the aberrant values.
0
200
400
600
800
1000
1200
Discharge 5 Years 50 Years 100 Years 300 Years
Pu238
CEA
NNL
GRS KENOREST
GRS TRITON
KURCHATOV
UNIPI
0
100
200
300
400
500
600
700
800
900
1000
Discharge 5 Years 50 Years 100 Years 300 Years
U234
CEA
NNL
GRS-KENOREST
GRS-TRITON
KURCHATOV
UNIPI

NEA/NSC/R(2016)3
40
Figure 15. Result of RSD versus cooling time for actinides code-to-code comparison without aberrant values
6.2. Fission product results
6.2.1. Q17 Fuel rod
Tables A.7-A.12 (Appendix A) detail the isotopic concentrations and RSD versus cooling time for the fission products. Figure 16 shows RSD versus cooling times for some fission products. Table 19 summarises the main trends obtained for RSD.
Figure 16. RSD versus cooling time for some fission products in Q17 rod
0%
50%
100%
150%
200%
250%
RSD without aberrant values (L14 fuel rod)
Discharge
5 years
50 years
100 years
300 years
0.00%
50.00%
100.00%
150.00%
200.00%
250.00%
300.00%
Relative Standard Deviation versus cooling time fpr some Fission Products (Q17 fuel rod)
Discharge5 years50 years100 years300 years

NEA/NSC/R(2016)3
41
Table 19. Summary of the main RSD trends for the fission products in Q17 fuel rod
Relative standard deviation ≤ 10% > 10%
Isotopes
79Se, 85Kr, 85Rb, 87Rb, 88Sr, 90Sr, 95Mo, 97Mo, 99Tc, 101Ru, 107Pd, 127I, 129I,
132Xe, 134Xe,136Xe, 133Cs, 134Cs, 137Cs, 138Ba, 139La, 140Ce, 144Ce, 142Nd, 143Nd, 144Nd, 145Nd, 146Nd, 148Nd,
150Nd, 147Sm, 148Sm, 154Sm, 153Eu, 156Gd
93mNb, 95Mo, 106Ru, 103Rh, 108mAg, 109Ag, 110mAg, 130Xe, 131Xe, 135Cs,
136Ba, 147Pm, 146Sm, 149Sm, 150Sm, 151Sm, 152Sm, 154Eu, 155Eu, 154Gd,
155Gd, 166mHo
A lot of isotopes have a RSD greater than 10%, therefore just a few are analysed here.
There are, however, some discrepancies, as shown in Figure 17. In some cases, these discrepancies are probably due to inappropriate decay data (106Ru, 110mAg) or fission yields leading to incoherent values.
Figure 17. Masses (g/tHMI) for some fission products in Q17 fuel rod
0.00E+005.00E+011.00E+021.50E+022.00E+022.50E+023.00E+023.50E+024.00E+024.50E+025.00E+02
Discharge 5 years 50 years 100 years 300 years
106Ru Q17
CEANNLKURCHATOVUNIPIGRS (KENOREST)GRS (TRITON)
0.00E+00
5.00E-02
1.00E-01
1.50E-01
2.00E-01
2.50E-01
3.00E-01
3.50E-01
4.00E-01
Discharge 5 years 50 years 100 years 300 years
93mNb Q17
CEA
NNL
KURCHATOV
UNIPI
GRS (KERONEST)
GRS (TRITON)

NEA/NSC/R(2016)3
42
Figure 17. Masses (g/tHMI) for some fission products in Q17 fuel rod (continued)
Most fission products are in good agreement, meaning that the RSD is lower than 10%. Figure 18 shows RSD versus cooling time for fission products. The results are satisfactory for a large part of fission products, though there are some discrepancies.
0.00E+005.00E-011.00E+001.50E+002.00E+002.50E+003.00E+003.50E+004.00E+004.50E+005.00E+00
Discharge 5 years 50 years 100 years 300 years
110mAg Q17
CEA
NNL
KURCHATOV
UNIPI
GRS (KERONEST)
GRS (TRITON)
0.00E+00
2.00E+00
4.00E+00
6.00E+00
8.00E+00
1.00E+01
1.20E+01
1.40E+01
Discharge 5 years 50 years 100 years 300 years
130Xe Q17
CEA
NNL
KURCHATOV
UNIPI
GRS (KERONEST)
GRS (TRITON)
0.00E+00
5.00E+01
1.00E+02
1.50E+02
2.00E+02
2.50E+02
3.00E+02
3.50E+02
4.00E+02
Discharge 5 years 50 years 100 years 300 years
90Sr Q17
CEA
NNL
KURCHATOV
UNIPI
GRS (KERONEST)
GRS (TRITON)

NEA/NSC/R(2016)3
43
Figure 18. RSD versus cooling time for some fission products
6.2.2. L14 Fuel rod
Tables B.8-B.14 (Appendix B) give the isotopic concentrations and RSD trends versus cooling time for the fission products calculated. Figure 19 presents RSD versus cooling times for selected fission products. Table 20 summarises the main RSD trends.
Figure 19. RSD versus cooling time for some fission products in L14 rod
Table 20. Summary of the main RSD trends for the fission products in L14 fuel rod
Relative standard deviation ≤ 10% > 10%
Isotopes
79Se, 85Kr, 85Rb, 87Rb, 88Sr, 90Sr, 95Mo, 97Mo, 99Tc, 101Ru, 107Ru, 103Rh, 107Pd,
127I, 129I, 131Xe, 132Xe, 134Xe,136Xe, 133Cs, 135Cs, 137Cs, 138Ba, 139La, 140Ce,
144Ce, 142Nd, 143Nd, 144Nd, 145Nd, 146Nd, 148Nd, 150Nd, 147Sm, 148Sm,
150Sm, 154Sm, 153Eu, 156Gd
93mNb, 95Mo, 106Ru, 103Rh, 108mAg, 109Ag, 110mAg, 130Xe, 134Cs, 136Ba,
147Pm, 146Sm, 149Sm, 151Sm, 152Sm, 154Eu, 155Eu, 154Gd, 155Gd, 166mHo
0%
50%
100%
150%
200%
250%
Rela
tive
Stan
dard
Dev
iatio
n
Discharge5 years50 years100 years300 years
0%
50%
100%
150%
200%
250%
300%
Se79
Kr85
Rb85
Rb87
Sr88
Sr90
Nb9
3mM
o95
Mo9
7Tc
99Ru
101
Ru10
6Rh
103
Pd10
7Ag
108m
Ag10
9Ag
110m I127
I129
Xe13
0Xe
131
Xe13
2Xe
134
Xe13
6Cs
133
Cs13
4Cs
-135
Cs13
7Ba
136
Ba13
8La
139
Ce14
0Ce
144
Nd1
42N
d143
Nd1
44N
d145
Nd1
46N
d148
Nd1
50Pm
147
Sm14
6Sm
147
Sm14
8Sm
149
Sm15
0Sm
151
Sm15
2Sm
154
Eu15
3Eu
154
Eu15
5G
d154
Gd1
55G
d156
Ho16
6m
Relative Standard Deviation versus cooling time for Fission Product (L14 fuel rod)
Discharge
5 years
50 years
100 years
300 years

NEA/NSC/R(2016)3
44
A number of fission products have RSD in excess of 10%, but we analyse only some fission products which have RSD more than 50% (see Figure 20). For the L14 fuel rod, the reasons are the same as for the Q17 fuel rod.
Figure 20. Masses (g/tHMI) of some fission products which have RSD >±50% (93mNb and 109mAg)
Most fission products are in good agreement, meaning that the RSD is lower than 10%. Figure 21 shows RSD versus cooling time for fission products. There are only six fission products which have RSD significantly more than 20% at discharge i.e. 93mNb, 108mAg, 110mAg, 136Ba, 146Sm and 166mHo.
0
0.05
0.1
0.15
0.2
0.25
0.3
0.35
0.4
Discharge 5 years 50 years 100 years 300 years
Nb93m L14
CEA
NNL
GRS-KENOREST
GRS-TRITON
KURCHATOV
UNIPI
0
0.0002
0.0004
0.0006
0.0008
0.001
0.0012
Discharge 5 years 50 years 100 years 300 years
Ag108m L14
CEA
NNL
GRS-KENOREST
GRS-TRITON
KURCHATOV
UNIPI

NEA/NSC/R(2016)3
45
Figure 21. RSD versus cooling time for selected fission products
6.3. Activation products results
6.3.1. Q17 Fuel rod
Tables A.13-A.18 (Appendix A) detail the activation products results obtained by the participants at each cooling time. All participants calculated these isotopes except GRS-TRITON.
Figure 22. RSD versus cooling time for activation products
Figure 22 shows RSD versus cooling time for activation products. With the exception of 36Cl, 55Fe, 60Co and 63Ni, the activation products have RSD greater than 10% at discharge. However, the RSD of 55Fe and 60Co increase around 120% at 300 years cooling time. Tables 21 and 22 show results for 55Fe and 60Co at 300 years and 54Mn at 100 years but the RSDs are not significant because of the very low masses considered.
0.00%
20.00%
40.00%
60.00%
80.00%
100.00%
120.00%
140.00%
Cl36 Ca41 Mn53 Mn54 Fe55 Fe60 Co60 Ni59 Ni63 Mo93
Relative Standard Deviation versus cooling time for Activation Products (Q17 fuel rod)
Discharge
5 years
50 years
100 years
300 years

NEA/NSC/R(2016)3
46
Table 21. 55Fe and 60Co masses (g/tHMI) and RSD at 300 years cooling time
CEA NNL KURCHATOV UNIPI GRS (KENOREST) MEDIAN SD RSD
55Fe 1.112E-34 3.631E-35 1.222E-34 0.000E+00 0.000E+00 1.112E-34 4.674E-35 51.99% 60Co 4.742E-11 5.044E-11 1.057E-17 1.170E-17 4.625E-11 4.625E-11 2.636E-11 91.44%
Table 22. 54Mn masses (g/tHMI) and RSD at 100 years cooling time
CEA NNL KURCHATOV UNIPI GRS (KENOREST) MEDIAN SD RSD
54Mn 6.305E-38 1.109E-37 7.116E-38 0.000E+00 0.000E+00 7.116E-38 2.561E-38 31.34%
Figure 23 shows the calculated masses for 41Ca, 53Mn, 60Fe and 93Mo. The participants used different libraries for their calculations. Unlike actinides or fission products, little work has been done up to now to validate these cross-sections.
Figure 23. Calculated masses (g/tHMI) for some activations products which have RSD >±50% (41Ca, 53Mn, 60Fe and 93Mo)
0.00E+00
5.00E-06
1.00E-05
1.50E-05
2.00E-05
2.50E-05
3.00E-05
3.50E-05
4.00E-05
Discharge 5 years 50 years 100 years 300 years
Mn53 Q17
CEA
NNL
KURCHATOV
UNIPI
GRS-KENOREST
0.00E+001.00E-012.00E-013.00E-014.00E-015.00E-016.00E-017.00E-018.00E-019.00E-01
Discharge 5 years 50 years 100 years 300 years
Ca41 Q17
CEA
NNL
KURCHATOV
UNIPI
GRS-KENOREST

NEA/NSC/R(2016)3
47
Figure 23. Calculated masses (g/tHMI) for some activations products which have RSD >±50% (41Ca, 53Mn, 60Fe and 93Mo) (continued)
6.3.2. L14 Fuel rod
Tables B.15-B.20 (Appendix B) detail the activation products masses obtained by the participants at each cooling time and the associated RSD. All participants calculated these concentrations except GRS-TRITON. Figure 24 shows RSD versus cooling time for activation products. The RSD values tend to be larger at cooling times >5 years than at discharge.
0.00E+00
2.00E-05
4.00E-05
6.00E-05
8.00E-05
1.00E-04
1.20E-04
1.40E-04
Discharge 5 years 50 years 100 years 300 years
Fe60 Q17
CEA
NNL
KURCHATOV
UNIPI
GRS-KENOREST
0.00E+00
1.00E-02
2.00E-02
3.00E-02
4.00E-02
5.00E-02
6.00E-02
7.00E-02
8.00E-02
Discharge 5 years 50 years 100 years 300 years
Mo93 Q17
CEA
NNL
KURCHATOV
UNIPI
GRS-KENOREST

NEA/NSC/R(2016)3
48
Figure 24. RSD versus cooling time for activation products in L14 fuel rod
6.4. Activation-fission product results
6.4.1. Q17 Fuel rod
Tables A.19-A.24 (Appendix A) detail the activation-fission product results obtained by the participants at each cooling time. Figure 25 shows RSD versus cooling time for activation-fission products. Except for 94Nb, the activation products have an RSD greater than 10%.
Figure 25. RSD versus cooling time for activation-fission products in Q17 fuel rod
Figure 26 shows calculated masses for119mSn, 121mSn, 126Sn and 125Sb, which have RSD values greater than 50%. This figure suggests a decay data problem (period of 119mSn is 293 days) for 119mSn in the UNIPI calculation. For 121mSn, 126Sn and 125Sb, the CEA values are greater than the others. The 125Sb overestimation in CEA calculation is consistent with
0%
20%
40%
60%
80%
100%
120%
140%
160%
180%
200%
Cl36 Ca41 Mn53 Mn54 Fe55 Fe60 Co60 Ni59 Ni63 Mo93
Relative Standard Deviation versus cooling time for Activation Products (L14 fuel rod)
Discharge
5 years
50 years
100 years
300 years
0.00%
50.00%
100.00%
150.00%
200.00%
250.00%
300.00%
H3 Be10 C14 Zr93 Nb94 Sn119m Sn121m Sn126 Sb125
Relative Standard Deviation versus cooling time for Activation-Fission Products (Q17 fuel rod)
Discharge
5 years
50 years
100 years
300 years

NEA/NSC/R(2016)3
49
DARWIN2.3 experimental validation. As CEA is the only participant using JEFF3.1.1, the relevant fission yields and cross-sections should be verified in that library.
Figure 26. Calculated masses (g/tHMI) for some activation-fission products which have RSD >±50% (191mSn, 121mSn, 126Sn and 125Sb)
0.00E+00
2.00E+00
4.00E+00
6.00E+00
8.00E+00
1.00E+01
1.20E+01
1.40E+01
1.60E+01
1.80E+01
Discharge 5 Years 50 Years 100 Years 300 Years
Sn119m Q17
CEA
NNL
KURCHATOV
UNIPI
GRS-KENOREST
GRS-TRITON
0.00E+00
2.00E-01
4.00E-01
6.00E-01
8.00E-01
1.00E+00
1.20E+00
1.40E+00
1.60E+00
1.80E+00
2.00E+00
Discharge 5 Years 50 Years 100 Years 300 Years
Sn121m Q17
CEANNLKURCHATOVUNIPIGRS-KENORESTGRS-TRITON
0.00E+00
5.00E+00
1.00E+01
1.50E+01
2.00E+01
2.50E+01
3.00E+01
3.50E+01
4.00E+01
4.50E+01
Discharge 5 Years 50 Years 100 Years 300 Years
Sb125 Q17
CEA
NNL
KURCHATOV
UNIPI
GRS-KENOREST
GRS-TRITON
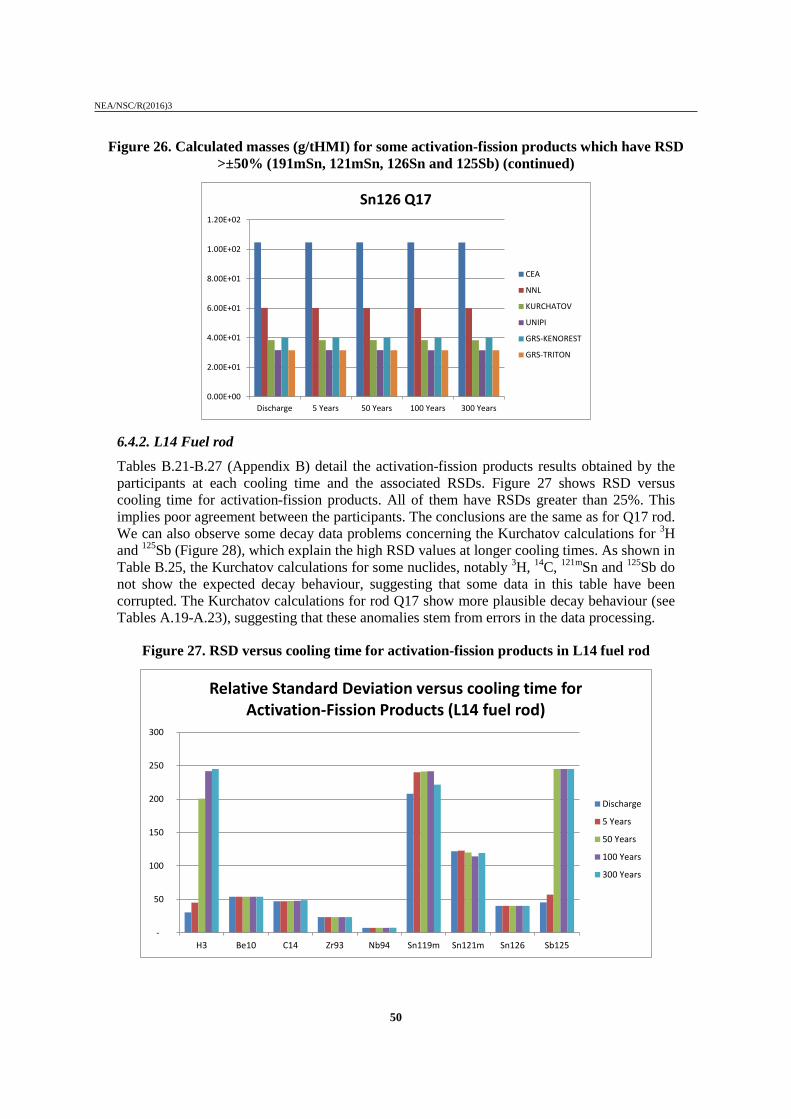
NEA/NSC/R(2016)3
50
Figure 26. Calculated masses (g/tHMI) for some activation-fission products which have RSD >±50% (191mSn, 121mSn, 126Sn and 125Sb) (continued)
6.4.2. L14 Fuel rod
Tables B.21-B.27 (Appendix B) detail the activation-fission products results obtained by the participants at each cooling time and the associated RSDs. Figure 27 shows RSD versus cooling time for activation-fission products. All of them have RSDs greater than 25%. This implies poor agreement between the participants. The conclusions are the same as for Q17 rod. We can also observe some decay data problems concerning the Kurchatov calculations for 3H and 125Sb (Figure 28), which explain the high RSD values at longer cooling times. As shown in Table B.25, the Kurchatov calculations for some nuclides, notably 3H, 14C, 121mSn and 125Sb do not show the expected decay behaviour, suggesting that some data in this table have been corrupted. The Kurchatov calculations for rod Q17 show more plausible decay behaviour (see Tables A.19-A.23), suggesting that these anomalies stem from errors in the data processing.
Figure 27. RSD versus cooling time for activation-fission products in L14 fuel rod
0.00E+00
2.00E+01
4.00E+01
6.00E+01
8.00E+01
1.00E+02
1.20E+02
Discharge 5 Years 50 Years 100 Years 300 Years
Sn126 Q17
CEA
NNL
KURCHATOV
UNIPI
GRS-KENOREST
GRS-TRITON
-
50
100
150
200
250
300
H3 Be10 C14 Zr93 Nb94 Sn119m Sn121m Sn126 Sb125
Relative Standard Deviation versus cooling time for Activation-Fission Products (L14 fuel rod)
Discharge
5 Years
50 Years
100 Years
300 Years

NEA/NSC/R(2016)3
51
Figure 28. Calculated masses (g/tHMI) for some activation-fission products in L14 rod
0
0.02
0.04
0.06
0.08
0.1
0.12
0.14
0.16
Discharge 5 years 50 years 100 years 300 years
H3
CEA
NNL
GRS-KENOREST
GRS TRITON
KURCHATOV
UNIPI
0
5
10
15
20
25
30
35
40
Discharge 5 years 50 years 100 years 300 years
Sb125
CEA
NNL
GRS KENOREST
GRS TRITON
KURCHATOV
UNIPI
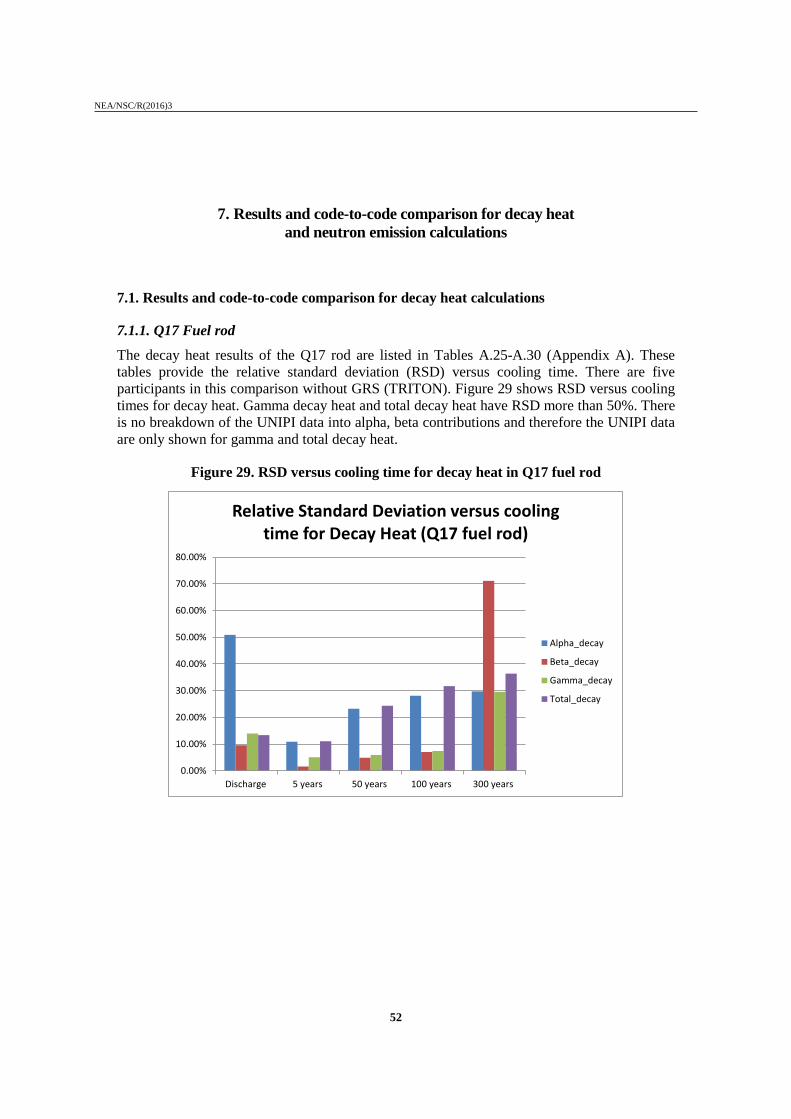
NEA/NSC/R(2016)3
52
7. Results and code-to-code comparison for decay heat and neutron emission calculations
7.1. Results and code-to-code comparison for decay heat calculations
7.1.1. Q17 Fuel rod
The decay heat results of the Q17 rod are listed in Tables A.25-A.30 (Appendix A). These tables provide the relative standard deviation (RSD) versus cooling time. There are five participants in this comparison without GRS (TRITON). Figure 29 shows RSD versus cooling times for decay heat. Gamma decay heat and total decay heat have RSD more than 50%. There is no breakdown of the UNIPI data into alpha, beta contributions and therefore the UNIPI data are only shown for gamma and total decay heat.
Figure 29. RSD versus cooling time for decay heat in Q17 fuel rod
0.00%
10.00%
20.00%
30.00%
40.00%
50.00%
60.00%
70.00%
80.00%
Discharge 5 years 50 years 100 years 300 years
Relative Standard Deviation versus cooling time for Decay Heat (Q17 fuel rod)
Alpha_decay
Beta_decay
Gamma_decay
Total_decay

NEA/NSC/R(2016)3
53
Figure 30. Calculated decay heat at each cooling time
1.00E+00
1.00E+01
1.00E+02
1.00E+03
1.00E+04
1.00E+05
Discharge 5 years 50 years 100 years 300 years
Deca
y he
at (W
atts
/ tH
M)
Alpha Decay Heat
CEA
NNL
KURCHATOV
GRS KENOREST
1.00E-01
1.00E+00
1.00E+01
1.00E+02
1.00E+03
1.00E+04
1.00E+05
1.00E+06
1.00E+07
Discharge 5 years 50 years 100 years 300 years
Deca
y he
at (W
atts
/ tH
M)
Beta Decay Heat
CEA
NNL
KURCHATOV
GRS KENOREST
1.00E+00
1.00E+01
1.00E+02
1.00E+03
1.00E+04
1.00E+05
1.00E+06
1.00E+07
Discharge 5 years 50 years 100 years 300 years
Deca
y he
at (W
atts
/ tH
M)
Gamma Decay Heat
CEANNLKURCHATOVUNIPIGRS KENOREST
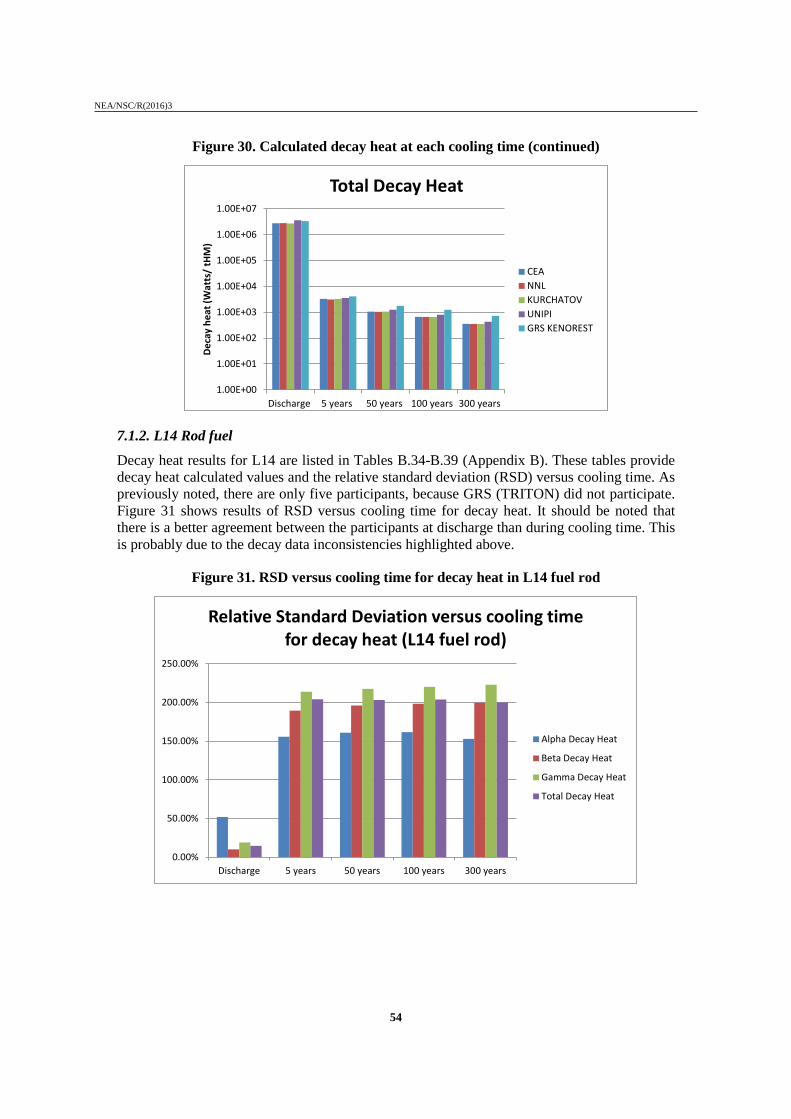
NEA/NSC/R(2016)3
54
Figure 30. Calculated decay heat at each cooling time (continued)
7.1.2. L14 Rod fuel
Decay heat results for L14 are listed in Tables B.34-B.39 (Appendix B). These tables provide decay heat calculated values and the relative standard deviation (RSD) versus cooling time. As previously noted, there are only five participants, because GRS (TRITON) did not participate. Figure 31 shows results of RSD versus cooling time for decay heat. It should be noted that there is a better agreement between the participants at discharge than during cooling time. This is probably due to the decay data inconsistencies highlighted above.
Figure 31. RSD versus cooling time for decay heat in L14 fuel rod
1.00E+00
1.00E+01
1.00E+02
1.00E+03
1.00E+04
1.00E+05
1.00E+06
1.00E+07
Discharge 5 years 50 years 100 years 300 years
Deca
y he
at (W
atts
/ tH
M)
Total Decay Heat
CEANNLKURCHATOVUNIPIGRS KENOREST
0.00%
50.00%
100.00%
150.00%
200.00%
250.00%
Discharge 5 years 50 years 100 years 300 years
Relative Standard Deviation versus cooling time for decay heat (L14 fuel rod)
Alpha Decay Heat
Beta Decay Heat
Gamma Decay Heat
Total Decay Heat

NEA/NSC/R(2016)3
55
7.2. Results and code-to-code comparison for neutron emissions calculations
7.2.1. Q17 Rod fuel
Tables A.31-A.36 (Appendix A) detail the neutron emission rate calculated by the participants at each cooling time. GRS (TRITON) did not participate. Figure 32 shows RSD versus cooling time for neutron emission rate. Figure 33 shows neutron emissions calculated at each cooling time.
Figure 32. RSD versus cooling time for neutron emission rate in Q17 fuel rod
Figure 33. The neutron emission rate for each cooling time in Q17 fuel rod
0.00%
5.00%
10.00%
15.00%
20.00%
25.00%
30.00%
35.00%
40.00%
45.00%
Discharge 5 years 50 years 100 years 300 years
Relative Standard Deviation versus cooling time for Neutron Emission (Q17 rod)
(alpha,n) (n/s)
Spont. Fission (n/s)
Total n emission (n/s)
0.00E+00
2.00E+08
4.00E+08
6.00E+08
8.00E+08
1.00E+09
1.20E+09
Discharge 5 Years 50 Years 100 Years 300 Years
Neu
tron
em
issi
on ra
te (n
eutr
on/s
/tHM
)
(α,n) emission rate CEANNLKURCHATOVUNIPIGRS KERONEST

NEA/NSC/R(2016)3
56
Figure 33. The neutron emission rate for each cooling time in Q17 fuel rod (continued)
7.2.2. L14 Rod fuel
Tables B.28-B.33 (Appendix B) detail the neutron emission rates calculated by the participants at each cooling time and the associated RSD. GRS (TRITON) did not participate. Figure 34 shows RSD versus cooling time for neutron emission rate. Almost perfect agreement is obtained at discharge.
0.00E+00
2.00E+09
4.00E+09
6.00E+09
8.00E+09
1.00E+10
1.20E+10
Discharge 5 Years 50 Years 100 Years 300 Years
Neu
tron
em
issi
on ra
te (n
eutr
on/s
/tHM
)Spontaneous fission rate
CEANNLKURCHATOVUNIPIGRS KERONEST
0.00E+00
2.00E+09
4.00E+09
6.00E+09
8.00E+09
1.00E+10
1.20E+10
Discharge 5 Years 50 Years 100 Years 300 Years
Neu
tron
em
issi
on ra
te (n
eutr
on/s
/tHM
)
Total emision rateCEANNLKURCHATOVUNIPIGRS KERONEST

NEA/NSC/R(2016)3
57
Figure 34. RSD versus cooling time for neutron emission rate in L14 fuel rod
0.00%
50.00%
100.00%
150.00%
200.00%
250.00%
Discharge 5 years 50 years 100 years 300 years
Relative Standard Deviation versus cooling time for Neutron Emission (L14 fuel rod)
(α,n) emission rate
Spontaneous Fission emissionrate
Total emission rate

NEA/NSC/R(2016)3
58
8. Summary and conclusions
This report focuses on nuclide densities for the most important nuclides in the fuel cycle (actinides, fission products, and activation products) and the associated fuel cycles quantities, i.e. masses, neutron emission rate and decay heat, from irradiated MOx fuel rods. There were six participants in this benchmark: CEA (France), NNL (UK), KURCHATOV (Russia), UNIPI (Italy), GRS-KENOREST (Germany) and GRS-TRITON (Germany).
Isotopic concentrations have been calculated for the MOx fuel rods at position Q17 and L14 irradiated in the SLB1 core, for actinides, fission products, activation products, and activation-fission products calculation. Code-to-code comparisons have been analysed. Most of the actinide and fission products have good agreement between the participants. In some cases (fission products), RSD (indicator of consistency) increased greatly, but if we exclude aberrant values, we have a good agreement between the participants.
The agreement between all participants for activation products and activation-fission products is much poorer than fission products and actinides. There is a lot uncertainty in the cross-sections for activation products and activation-fission products and the participants used different libraries for their calculations. Most of the time, little work has been done to obtain experimental validation of these cross-sections.
For decay heat, we observe some discrepancies between participants, partly due to manifest errors on decay data previously highlighted. But, with aberrant values excluded, there is good agreement between the participants.
There is moderate consistency between participants for neutron emission rates, i.e. RSD is around 55%-72% for Q17. Consistency for L14 is poor, which means RSD is around 60-200%.
Experimental measurements of irradiated fuel isotopic inventories are much more limited for LWR MOX fuel than for UO2 fuel rods, and much of the measured data that exists is proprietary. Developers of nuclear inventory codes need to be able to test their methods and nuclear data against experimental measurements to estimate calculational uncertainties, but struggle to do so without access to proprietary MOX measurements. This benchmark is based on proprietary inventory measurements that were made on commercial PWR spent fuel, though without being able to provide the actual measured data. Instead, CEA kindly offered their own calculated data as a surrogate for the actual measured data. The benchmark provides an opportunity for code developers to compare their own calculations with those CEA’s tested methods and with other methods from participants in the benchmark.
The benchmark does not purport to provide a reference solution, but potential users can be assured that CEA’s calculations are unlikely to suffer from gross discrepancies relative to the measurements. Therefore it is hoped that this benchmark will be able to provide inventory code developers with a high degree of reassurance that their results are not grossly in error, if they fall within the range of the solutions presented here.

NEA/NSC/R(2016)3
59
References
[1] B. Roque et al. (2013), “International Comparison of a Depletion Calculation Benchmark Devoted to Fuel Cycle Issues Result from the Phase 1 Dedicated to PWR-UOX Fuels”.
[2] B. Roque et al. (2007), “Specification for the Phase 2 of a Depletion Calculation Benchmark devoted to MOx Fuel Cycles”.
[3] A. Tsilanizara et al. (1999), “DARWIN: An evolution code system for a large range of applications”, Proceeding of ICRS-9, Tsukuba, Japan.
[4] L. San-Felice et al. (2012), “Experimental Validation of the Darwin2.3 Package for Fuel Cycle Application”, PHYSOR 2012 – Advance in Reactor Physics – Linking Research, Industry, and Education.
[5] A. Santamarina et al. (2009), “The JEFF-3.1.1 nuclear data library”, JEFF Report 22, NEA n°6807, OECD, Paris.
[6] L. San Felice, R. Eschbach, P. Bourdot (2013), “Experimental validation of the DARWIN2.3 package for fuel cycle applications”, Nuclear Technology, Vol. 184.
[7] A. Santamarina, D. Bernard, P. Blaise, L. Erradi, P. Leconte, R. Le Tellier, C. Vaglio, J.F. Vidal (2009), “APOLLO2.8: A validated code package for PWR neutronics calculations”, Proceedings of the International Conference ANFM 2009, Hilton, Head, Island, US.
[8] A. Santamarina, N.Hfaiedh (2007), “The SHEM energy mesh for accurate fuel depletion and BUC calculations”, Proceedings of the International Conference on Safety-Criticality ICNC 2007, St Peterburg (Russia), Vol. I pp. 446-452.
[9] U. Hesse et al. (2004), KENOREST – a new criticality and inventory system based on KENO and OREST, PHYSOR 2000, (GRS-extended Version KENOREST).
[10] L.M. Petrie, N.F. Landers (1983), KENO Va, an improved Monte Carlo Criticality Program with Supergrouping, NUREG/CR-0200, Volume 2, Section F11, ORNL Tennessee 37831.
[11] U. Hesse, W. Denk, H. Deitenbeck (1986), OREST – Eine direkte Kopplung von HAMMER und ORIGEN zur Abbrandsimulation von LWR-Brennstoffen, GRS-63, (GRS-extended Version OREST 2004).
[12] J.E. Suich, H.C. Honeck (1967), The HAMMER-System – heterogeneous analysis by multigroup methods of exponentials and reactors, TID-4500, (GRS-extended version, 2000).
[13] M.J. Bell (1973), ORIGEN – The ORNL isotope generation and depletion code, ORNL-4628, UC-32-Mathematics and computers, (GRS extended Version GRS-ORIGEN-X 2004).

NEA/NSC/R(2016)3
60
[14] W. Bernnat, D. Lutz, J. Kleinert, M. Mattes (1994), Erstellung und Validierung von Wirkungsquerschnittsbibliotheken auf Basis der evaluierten Daten JEF-2 und ENDF/B-VI für Kritikalitäts- und Reaktorauslegungsrechnungen sowie Störfallanalysen, IKE Institut für Kerntechnik und Energiesysteme, Universität Stuttgart, IKE 6-189.
[15] S.F. Mughabghab (1984), Neutron resonance parameters and thermal cross sections, Brookhaven National Laboratory, Upton New York, Academic Press, INC., Vol. 1.
[16] U. Hesse, K. Hummelsheim (1993), Detaillierte dreidimensionale Abbrandrechnungen für ein SWR-Atriumbrennelement, GRS-A-2116.
[17] U. Quade, U. Hesse (1992), Optimierung von Verfahren zur Berechnung der Ortsdosisleistung von Plutonium und plutoniumhaltigen Brennelementen, GRS-A-1969.
[18] U. Hesse, K. Hummelsheim, J. Sieberer (2001), Programmbeschreibung ANITABL-PC 2001, GRS-A-3004.
[19] GRS-TRITON (2005), “TRITON: A two-dimensional depletion sequence for characterization of spent nuclear fuel,” being part I/3/T1 of “SCALE 5.0: A Modular Code System for Performing Standardized Computer Analysis for Licensing Evaluation for Workstations and Personal Computers,” ORNL/TM-2005/39 Version 5, Vol. I, II and III.

NEA/NSC/R(2016)3
61
Appendix A: Tables providing detailed result of Q17 fuel
Table A.1. Results for actinides in assembly calculation at discharge (g/tHMI)
CEA NNL KURCHATOV UNIPI GRS GRS AVERAGE SD RSD(KENOREST) (TRITON)
U232 9.120E-05 2.873E-04 1.290E-04 2.624E-04 9.090E-05 7.855E-05 1.566E-04 9.35E-05 59.73%U233 2.832E-04 4.477E-03 1.630E-04 4.778E-04 2.404E-04 2.034E-04 9.741E-04 1.72E-03 176.52%U234 1.524E+01 8.995E+00 1.509E+01 1.873E+01 1.466E+01 1.453E+01 1.454E+01 3.13E+00 21.55%U235 5.946E+02 6.180E+02 5.896E+02 7.085E+02 5.852E+02 5.857E+02 6.136E+02 4.81E+01 7.83%U236 3.063E+02 3.222E+02 2.993E+02 3.050E+02 2.834E+02 3.064E+02 3.037E+02 1.26E+01 4.14%U238 9.395E+05 9.394E+05 9.391E+05 9.352E+05 9.390E+05 9.387E+05 9.385E+05 1.63E+03 0.17%
Np236 1.304E-04 2.246E-04 1.678E-04 2.916E-04 1.402E-04 7.071E-05 1.709E-04 7.76E-05 45.39%Np237 1.343E+02 1.238E+02 1.327E+02 1.686E+02 1.271E+02 1.360E+02 1.371E+02 1.61E+01 11.75%Pu236 4.618E-04 8.322E-04 6.618E-04 1.217E-03 4.735E-04 3.401E-04 6.644E-04 3.21E-04 48.36%Pu238 4.007E+02 3.947E+02 3.975E+02 5.856E+02 4.036E+02 3.739E+02 4.260E+02 7.89E+01 18.52%Pu239 6.819E+03 7.054E+03 7.053E+03 9.489E+03 7.239E+03 7.133E+03 7.464E+03 1.00E+03 13.42%Pu240 6.067E+03 5.827E+03 5.904E+03 6.498E+03 5.831E+03 5.968E+03 6.016E+03 2.53E+02 4.20%Pu241 3.451E+03 3.439E+03 3.423E+03 4.125E+03 3.561E+03 3.426E+03 3.571E+03 2.76E+02 7.74%Pu242 2.796E+03 2.756E+03 2.967E+03 2.499E+03 2.770E+03 2.873E+03 2.777E+03 1.57E+02 5.66%Pu243 8.107E-01 7.025E-01 7.879E-01 5.350E-01 7.248E-01 8.225E-01 7.306E-01 1.07E-01 14.65%Pu244 3.668E-01 3.363E-01 1.531E-01 1.633E-01 3.449E-01 1.689E-01 2.556E-01 1.03E-01 40.44%Am241 1.343E+02 1.592E+02 1.420E+02 2.104E+02 1.633E+02 1.625E+02 1.620E+02 2.65E+01 16.38%
Am242m 3.175E+00 2.507E+00 2.623E+00 5.364E+00 2.841E+00 3.821E+00 3.388E+00 1.08E+00 31.78%Am243 7.842E+02 7.066E+02 7.847E+02 7.884E+02 7.425E+02 8.506E+02 7.762E+02 4.86E+01 6.26%Cm242 1.094E+02 1.108E+02 1.088E+02 1.072E+02 1.141E+02 1.038E+02 1.090E+02 3.46E+00 3.18%Cm243 4.671E+00 4.935E+00 4.886E+00 4.822E+00 5.447E+00 5.199E+00 4.993E+00 2.82E-01 5.64%Cm244 4.538E+02 3.784E+02 4.378E+02 4.832E+02 4.368E+02 4.658E+02 4.426E+02 3.60E+01 8.14%Cm245 3.522E+01 2.946E+01 3.239E+01 5.071E+01 3.075E+01 2.768E+01 3.437E+01 8.41E+00 24.47%Cm246 5.199E+00 4.339E+00 5.034E+00 6.674E+00 4.575E+00 4.183E+00 5.001E+00 9.09E-01 18.17%Cm247 9.609E-02 5.564E-02 7.693E-02 1.415E-01 7.926E-02 7.788E-02 8.788E-02 2.92E-02 33.28%Cm248 7.722E-03 4.225E-03 9.105E-03 1.207E-02 5.284E-03 6.286E-03 7.449E-03 2.85E-03 38.26%Ra226 1.108E-09 9.865E-10 1.103E-09 1.250E-09 1.054E-09 1.146E-09 1.108E-09 8.86E-11 8.00%Ra228 6.573E-16 5.711E-16 6.308E-16 6.644E-16 6.134E-16 6.602E-16 6.329E-16 3.61E-17 5.71%Ac227 2.997E-10 1.642E-10 2.914E-10 3.118E-10 3.170E-10 2.325E-10 2.694E-10 5.98E-11 22.20%Th229 1.105E-07 5.990E-07 1.383E-07 4.126E-07 1.180E-07 1.160E-07 2.491E-07 2.08E-07 83.36%Th230 8.562E-05 7.315E-05 8.505E-05 9.554E-05 8.516E-05 8.486E-05 8.490E-05 7.10E-06 8.36%Th232 1.423E-05 1.501E-05 1.421E-05 1.455E-05 1.347E-05 1.460E-05 1.434E-05 5.19E-07 3.62%Cf252 1.098E-05 5.625E-06 2.118E-05 2.219E-05 9.199E-06 1.185E-05 1.350E-05 6.69E-06 49.57%

NEA/NSC/R(2016)3
62
Table A.2. Results for actinides in assembly calculation at 5 years (g/tHMI)
CEA NNL KURCHATOV UNIPI GRS GRS AVERAGE SD RSD(KENOREST) (TRITON)
U232 3.984E-04 8.283E-04 5.686E-04 2.624E-04 4.055E-04 3.021E-04 4.609E-04 2.09E-04 45.32%U233 5.041E-04 4.681E-03 3.806E-04 7.604E-04 4.492E-04 4.320E-04 1.201E-03 1.71E-03 142.35%U234 3.412E+01 2.770E+01 3.383E+01 4.458E+01 3.435E+01 3.220E+01 3.446E+01 5.55E+00 16.09%U235 5.955E+02 6.191E+02 5.905E+02 7.099E+02 5.863E+02 5.867E+02 6.147E+02 4.82E+01 7.85%U236 3.094E+02 3.252E+02 3.023E+02 3.084E+02 2.864E+02 3.096E+02 3.069E+02 1.26E+01 4.10%U238 9.395E+05 9.394E+05 9.391E+05 9.352E+05 9.390E+05 9.387E+05 9.385E+05 1.63E+03 0.17%
Np236 1.304E-04 2.246E-04 1.678E-04 2.915E-04 1.402E-04 7.071E-05 1.709E-04 7.75E-05 45.38%Np237 1.416E+02 1.311E+02 1.397E+02 1.774E+02 1.344E+02 1.434E+02 1.446E+02 1.67E+01 11.56%Pu236 1.382E-04 2.524E-04 1.977E-04 3.698E-04 1.417E-04 1.034E-04 2.005E-04 9.81E-05 48.93%Pu238 4.901E+02 4.857E+02 4.861E+02 6.658E+02 4.974E+02 4.588E+02 5.140E+02 7.55E+01 14.69%Pu239 6.946E+03 7.181E+03 7.179E+03 9.614E+03 7.365E+03 7.262E+03 7.591E+03 1.00E+03 13.18%Pu240 6.142E+03 5.889E+03 5.977E+03 6.577E+03 5.903E+03 6.045E+03 6.089E+03 2.57E+02 4.22%Pu241 2.710E+03 2.704E+03 2.686E+03 3.240E+03 2.797E+03 2.691E+03 2.805E+03 2.17E+02 7.74%Pu242 2.796E+03 2.756E+03 2.968E+03 2.499E+03 2.770E+03 2.873E+03 2.777E+03 1.57E+02 5.66%Pu243 3.340E-12 1.934E-12 2.743E-12 4.916E-12 2.826E-12 2.706E-12 3.078E-12 1.01E-12 32.72%Pu244 3.668E-01 3.363E-01 1.531E-01 1.633E-01 3.449E-01 1.689E-01 2.556E-01 1.03E-01 40.44%Am241 8.716E+02 8.907E+02 8.748E+02 1.091E+03 9.224E+02 8.935E+02 9.240E+02 8.38E+01 9.07%
Am242m 3.098E+00 2.446E+00 2.559E+00 5.234E+00 2.772E+00 3.727E+00 3.306E+00 1.05E+00 31.78%Am243 7.846E+02 7.070E+02 7.852E+02 7.886E+02 7.428E+02 8.511E+02 7.765E+02 4.86E+01 6.26%Cm242 5.456E-02 5.339E-02 5.253E-02 5.922E-02 5.582E-02 5.383E-02 5.489E-02 2.40E-03 4.36%Cm243 4.161E+00 4.397E+00 4.335E+00 4.270E+00 4.836E+00 4.605E+00 4.434E+00 2.46E-01 5.56%Cm244 3.744E+02 3.125E+02 3.623E+02 3.997E+02 3.608E+02 3.853E+02 3.658E+02 2.99E+01 8.18%Cm245 3.520E+01 2.945E+01 3.238E+01 5.069E+01 3.074E+01 2.766E+01 3.435E+01 8.41E+00 24.47%Cm246 5.195E+00 4.336E+00 5.029E+00 6.669E+00 4.572E+00 4.178E+00 4.997E+00 9.08E-01 18.17%Cm247 9.609E-02 5.564E-02 7.693E-02 1.415E-01 7.926E-02 7.788E-02 8.788E-02 2.92E-02 33.28%Cm248 7.730E-03 4.229E-03 9.119E-03 1.209E-02 5.290E-03 6.294E-03 7.459E-03 2.86E-03 38.29%Ra226 1.165E-08 8.994E-09 1.156E-08 1.407E-08 1.155E-08 1.131E-08 1.152E-08 1.61E-09 13.97%Ra228 7.373E-15 7.756E-15 6.480E-15 7.471E-15 6.926E-15 7.498E-15 7.251E-15 4.65E-16 6.41%Ac227 2.963E-09 1.971E-09 2.787E-09 3.495E-09 2.913E-09 2.815E-09 2.824E-09 4.91E-10 17.40%Th229 1.189E-07 6.966E-07 1.440E-07 4.258E-07 1.254E-07 1.228E-07 2.722E-07 2.40E-07 88.08%Th230 4.259E-04 3.256E-04 4.223E-04 5.328E-04 4.260E-04 4.069E-04 4.232E-04 6.61E-05 15.61%Th232 5.848E-05 6.211E-05 5.795E-05 5.915E-05 5.489E-05 5.939E-05 5.866E-05 2.34E-06 3.99%Cf252 2.961E-06 1.517E-06 5.711E-06 5.987E-06 2.483E-06 3.198E-06 3.643E-06 1.81E-06 49.56%

NEA/NSC/R(2016)3
63
Table A.3. Results for actinides in assembly calculation at 50 years (g/tHMI)
CEA NNL KURCHATOV UNIPI GRS GRS AVERAGE SD RSD(KENOREST) (TRITON)
U232 3.454E-04 6.954E-04 4.935E-04 9.224E-04 3.504E-04 2.612E-04 5.114E-04 2.53E-04 49.41%U233 3.573E-03 7.617E-03 3.416E-03 4.574E-03 3.457E-03 3.543E-03 4.363E-03 1.65E-03 37.86%U234 1.784E+02 1.707E+02 1.770E+02 2.406E+02 1.807E+02 1.673E+02 1.858E+02 2.73E+01 14.70%U235 6.044E+02 6.282E+02 5.998E+02 7.221E+02 5.956E+02 5.959E+02 6.243E+02 4.94E+01 7.92%U236 3.390E+02 3.535E+02 3.311E+02 3.400E+02 3.148E+02 3.386E+02 3.362E+02 1.27E+01 3.79%U238 9.395E+05 9.394E+05 9.391E+05 9.352E+05 9.390E+05 9.387E+05 9.385E+05 1.63E+03 0.17%
Np236 1.303E-04 2.245E-04 1.678E-04 2.915E-04 1.402E-04 7.068E-05 1.708E-04 7.75E-05 45.38%Np237 3.119E+02 3.023E+02 3.097E+02 3.844E+02 3.119E+02 3.146E+02 3.225E+02 3.06E+01 9.50%Pu236 2.805E-09 5.882E-09 3.878E-09 8.542E-09 2.828E-09 2.364E-09 4.383E-09 2.40E-09 54.74%Pu238 3.439E+02 3.407E+02 3.412E+02 4.673E+02 3.491E+02 3.220E+02 3.607E+02 5.30E+01 14.70%Pu239 6.943E+03 7.177E+03 7.174E+03 9.608E+03 7.361E+03 7.259E+03 7.587E+03 1.00E+03 13.17%Pu240 6.415E+03 6.113E+03 6.238E+03 6.868E+03 6.166E+03 6.326E+03 6.354E+03 2.74E+02 4.31%Pu241 3.074E+02 3.099E+02 3.028E+02 3.686E+02 3.187E+02 3.061E+02 3.189E+02 2.49E+01 7.81%Pu242 2.796E+03 2.756E+03 2.967E+03 2.499E+03 2.770E+03 2.873E+03 2.777E+03 1.57E+02 5.66%Pu243 3.340E-12 1.934E-12 2.743E-12 4.916E-12 2.826E-12 2.706E-12 3.078E-12 1.01E-12 32.72%Pu244 3.668E-01 3.363E-01 1.531E-01 1.633E-01 3.449E-01 1.689E-01 2.556E-01 1.03E-01 40.44%Am241 3.101E+03 3.111E+03 3.085E+03 3.751E+03 3.221E+03 3.106E+03 3.229E+03 2.60E+02 8.06%
Am242m 2.483E+00 1.961E+00 2.051E+00 4.195E+00 2.222E+00 2.987E+00 2.650E+00 8.42E-01 31.78%Am243 7.813E+02 7.040E+02 7.820E+02 7.852E+02 7.397E+02 8.474E+02 7.733E+02 4.84E+01 6.25%Cm242 6.526E-03 5.124E-03 5.357E-03 1.093E-02 5.790E-03 7.783E-03 6.918E-03 2.19E-03 31.62%Cm243 1.471E+00 1.554E+00 1.484E+00 1.429E+00 1.657E+00 1.541E+00 1.523E+00 8.03E-02 5.27%Cm244 6.619E+01 5.578E+01 6.466E+01 7.133E+01 6.447E+01 6.877E+01 6.520E+01 5.31E+00 8.14%Cm245 3.507E+01 2.934E+01 3.226E+01 5.051E+01 3.062E+01 2.756E+01 3.423E+01 8.38E+00 24.48%Cm246 5.161E+00 4.307E+00 4.997E+00 6.625E+00 4.542E+00 4.151E+00 4.964E+00 9.02E-01 18.17%Cm247 9.609E-02 5.564E-02 7.693E-02 1.415E-01 7.926E-02 7.788E-02 8.788E-02 2.92E-02 33.28%Cm248 7.732E-03 4.230E-03 9.124E-03 1.209E-02 5.292E-03 6.296E-03 7.461E-03 2.86E-03 38.27%Ra226 2.365E-06 2.148E-06 2.346E-06 3.148E-06 2.388E-06 2.225E-06 2.437E-06 3.61E-07 14.80%Ra228 1.602E-13 1.699E-13 1.104E-13 1.620E-13 1.502E-13 1.621E-13 1.525E-13 2.15E-14 14.13%Ac227 2.338E-08 1.896E-08 2.079E-08 2.788E-08 2.290E-08 2.276E-08 2.278E-08 3.00E-09 13.16%Th229 4.699E-07 1.835E-06 4.682E-07 8.887E-07 4.588E-07 4.650E-07 7.643E-07 5.51E-07 72.12%Th230 1.421E-02 1.323E-02 1.410E-02 1.904E-02 1.438E-02 1.335E-02 1.472E-02 2.17E-03 14.74%Th232 4.778E-04 5.064E-04 4.726E-04 4.835E-04 4.481E-04 4.836E-04 4.787E-04 1.89E-05 3.95%Cf252 2.239E-11 1.146E-11 4.319E-11 4.525E-11 1.892E-11 2.417E-11 2.756E-11 1.36E-11 49.46%

NEA/NSC/R(2016)3
64
Table A.4. Results for actinides in assembly calculation at 100 years (g/tHMI)
CEA NNL KURCHATOV UNIPI GRS GRS AVERAGE SD RSD(KENOREST) (TRITON)
U232 2.102E-04 4.232E-04 3.003E-04 5.615E-04 2.120E-04 1.589E-04 3.110E-04 1.54E-04 49.50%U233 1.051E-02 1.443E-02 1.030E-02 1.309E-02 1.046E-02 1.054E-02 1.156E-02 1.76E-03 15.24%U234 2.888E+02 2.801E+02 2.865E+02 3.906E+02 2.926E+02 2.709E+02 3.016E+02 4.43E+01 14.68%U235 6.142E+02 6.383E+02 6.095E+02 7.356E+02 6.060E+02 6.063E+02 6.350E+02 5.08E+01 7.99%U236 3.724E+02 3.853E+02 3.636E+02 3.758E+02 3.469E+02 3.717E+02 3.693E+02 1.30E+01 3.53%U238 9.395E+05 9.394E+05 9.391E+05 9.352E+05 9.390E+05 9.387E+05 9.385E+05 1.63E+03 0.17%
Np236 1.303E-04 2.245E-04 1.678E-04 2.914E-04 1.402E-04 7.068E-05 1.708E-04 7.75E-05 45.38%Np237 5.612E+02 5.525E+02 5.576E+02 6.860E+02 5.710E+02 5.643E+02 5.821E+02 5.13E+01 8.81%Pu236 2.891E-10 5.054E-10 2.771E-10 6.541E-10 2.289E-10 1.694E-10 3.540E-10 1.86E-10 52.52%Pu238 2.320E+02 2.297E+02 2.301E+02 3.154E+02 2.356E+02 2.174E+02 2.434E+02 3.58E+01 14.72%Pu239 6.938E+03 7.171E+03 7.170E+03 9.599E+03 7.355E+03 7.254E+03 7.581E+03 9.98E+02 13.17%Pu240 6.437E+03 6.127E+03 6.261E+03 6.892E+03 6.187E+03 6.351E+03 6.376E+03 2.76E+02 4.33%Pu241 2.743E+01 2.796E+01 2.683E+01 3.300E+01 2.857E+01 2.738E+01 2.853E+01 2.27E+00 7.95%Pu242 2.796E+03 2.755E+03 2.967E+03 2.499E+03 2.770E+03 2.873E+03 2.777E+03 1.57E+02 5.66%Pu243 3.340E-12 1.934E-12 2.743E-12 4.916E-12 2.826E-12 6.892E-05 1.149E-05 2.81E-05 244.95%Pu244 3.668E-01 3.363E-01 1.531E-01 1.633E-01 3.449E-01 1.689E-01 2.556E-01 1.03E-01 40.44%Am241 3.128E+03 3.138E+03 3.109E+03 3.780E+03 3.248E+03 3.131E+03 3.256E+03 2.62E+02 8.04%
Am242m 1.942E+00 1.533E+00 1.604E+00 3.282E+00 1.738E+00 2.336E+00 2.073E+00 6.59E-01 31.80%Am243 7.776E+02 7.007E+02 7.783E+02 7.815E+02 7.362E+02 8.434E+02 7.696E+02 4.81E+01 6.26%Cm242 5.104E-03 4.007E-03 4.188E-03 8.547E-03 4.529E-03 6.100E-03 5.413E-03 1.71E-03 31.62%Cm243 4.634E-01 4.896E-01 4.511E-01 4.237E-01 5.040E-01 4.568E-01 4.648E-01 2.86E-02 6.16%Cm244 9.652E+00 8.219E+00 9.527E+00 1.052E+01 9.513E+00 1.014E+01 9.595E+00 7.82E-01 8.15%Cm245 3.493E+01 2.922E+01 3.213E+01 5.030E+01 3.050E+01 2.746E+01 3.409E+01 8.34E+00 24.47%Cm246 5.123E+00 4.276E+00 4.960E+00 6.576E+00 4.509E+00 4.121E+00 4.928E+00 8.95E-01 18.17%Cm247 9.609E-02 5.564E-02 7.693E-02 1.415E-01 7.926E-02 7.788E-02 8.788E-02 2.92E-02 33.28%Cm248 7.731E-03 4.230E-03 9.124E-03 1.209E-02 5.292E-03 6.296E-03 7.460E-03 2.86E-03 38.27%Ra226 1.547E-05 1.457E-05 1.535E-05 2.078E-05 1.565E-05 1.452E-05 1.606E-05 2.36E-06 14.71%Ra228 3.626E-13 3.829E-13 2.416E-13 4.038E-13 3.405E-13 3.664E-13 3.496E-13 5.70E-14 16.30%Ac227 4.330E-08 3.861E-08 3.771E-08 5.167E-08 4.248E-08 4.236E-08 4.269E-08 4.95E-09 11.60%Th229 1.900E-06 4.109E-06 1.860E-06 2.690E-06 1.870E-06 1.899E-06 2.388E-06 9.03E-07 37.81%Th230 4.709E-02 4.496E-02 4.672E-02 6.346E-02 4.771E-02 4.417E-02 4.902E-02 7.20E-03 14.69%Th232 9.890E-04 1.044E-03 9.779E-04 1.004E-03 9.291E-04 1.000E-03 9.907E-04 3.76E-05 3.79%Cf252 4.567E-17 2.334E-17 8.806E-17 9.229E-17 3.892E-17 4.303E-12 7.171E-13 1.76E-12 244.93%

NEA/NSC/R(2016)3
65
Table A.5. Results for actinides in assembly calculation at 300 years (g/tHMI)
CEA NNL KURCHATOV UNIPI GRS GRS AVERAGE SD RSD(KENOREST) (TRITON)
U232 2.886E-05 5.808E-05 4.124E-05 7.708E-05 2.839E-05 2.182E-05 4.258E-05 2.12E-05 49.86%U233 7.467E-02 7.819E-02 7.397E-02 9.119E-02 7.625E-02 7.498E-02 7.821E-02 6.53E-03 8.35%U234 4.703E+02 4.597E+02 4.665E+02 6.376E+02 4.768E+02 4.409E+02 4.920E+02 7.24E+01 14.71%U235 6.533E+02 6.788E+02 6.502E+02 7.898E+02 6.475E+02 6.472E+02 6.778E+02 5.61E+01 8.28%U236 5.048E+02 5.113E+02 4.923E+02 5.176E+02 4.742E+02 5.023E+02 5.004E+02 1.54E+01 3.08%U238 9.395E+05 9.394E+05 9.391E+05 9.352E+05 9.390E+05 9.387E+05 9.385E+05 1.63E+03 0.17%
Np236 1.302E-04 2.242E-04 1.676E-04 2.910E-04 1.401E-04 7.058E-05 1.706E-04 7.74E-05 45.36%Np237 1.411E+03 1.405E+03 1.403E+03 1.713E+03 1.455E+03 1.415E+03 1.467E+03 1.22E+02 8.32%Pu236 2.888E-10 5.049E-10 2.768E-10 6.533E-10 2.287E-10 1.584E-10 3.518E-10 1.88E-10 53.40%Pu238 4.819E+01 4.763E+01 4.772E+01 6.567E+01 4.896E+01 4.528E+01 5.058E+01 7.50E+00 14.82%Pu239 6.913E+03 7.143E+03 7.143E+03 9.558E+03 7.327E+03 7.227E+03 7.552E+03 9.92E+02 13.14%Pu240 6.311E+03 6.007E+03 6.139E+03 6.757E+03 6.067E+03 6.227E+03 6.251E+03 2.71E+02 4.33%Pu241 5.881E-02 4.983E-02 5.403E-02 8.442E-02 5.175E-02 4.668E-02 5.759E-02 1.38E-02 23.90%Pu242 2.795E+03 2.755E+03 2.966E+03 2.498E+03 2.770E+03 2.873E+03 2.776E+03 1.57E+02 5.66%Pu243 3.341E-12 1.934E-12 2.743E-12 4.917E-12 2.826E-12 2.706E-12 3.078E-12 1.01E-12 32.73%Pu244 3.668E-01 3.363E-01 1.531E-01 1.633E-01 3.449E-01 1.689E-01 2.556E-01 1.03E-01 40.44%Am241 2.291E+03 2.299E+03 2.277E+03 2.769E+03 2.379E+03 2.293E+03 2.385E+03 1.92E+02 8.04%
Am242m 7.265E-01 5.736E-01 6.004E-01 1.228E+00 6.508E-01 8.742E-01 7.756E-01 2.47E-01 31.79%Am243 7.631E+02 6.876E+02 7.637E+02 7.670E+02 7.225E+02 8.277E+02 7.553E+02 4.73E+01 6.26%Cm242 1.910E-03 1.494E-03 1.567E-03 3.198E-03 1.696E-03 2.277E-03 2.024E-03 6.41E-04 31.67%Cm243 4.562E-03 4.817E-03 3.849E-03 3.270E-03 4.313E-03 3.525E-03 4.056E-03 6.07E-04 14.97%Cm244 4.364E-03 3.875E-03 4.495E-03 4.960E-03 4.511E-03 4.782E-03 4.498E-03 3.74E-04 8.32%Cm245 3.437E+01 2.875E+01 3.161E+01 4.948E+01 3.001E+01 2.701E+01 3.354E+01 8.20E+00 24.46%Cm246 4.975E+00 4.152E+00 4.817E+00 6.387E+00 4.379E+00 4.002E+00 4.785E+00 8.70E-01 18.17%Cm247 9.610E-02 5.564E-02 7.693E-02 1.415E-01 7.926E-02 7.788E-02 8.788E-02 2.92E-02 33.28%Cm248 7.728E-03 4.228E-03 9.119E-03 1.208E-02 5.290E-03 6.294E-03 7.456E-03 2.85E-03 38.26%Ra226 2.775E-04 2.683E-04 2.754E-04 3.752E-04 2.811E-04 2.602E-04 2.896E-04 4.26E-05 14.71%Ra228 1.365E-12 1.421E-12 8.898E-13 1.450E-12 1.334E-12 1.425E-12 1.314E-12 2.12E-13 16.15%Ac227 1.225E-07 1.207E-07 1.053E-07 1.469E-07 1.207E-07 1.207E-07 1.228E-07 1.34E-08 10.93%Th229 3.423E-05 3.955E-05 3.384E-05 4.238E-05 3.473E-05 3.441E-05 3.652E-05 3.57E-06 9.76%Th230 2.700E-01 2.624E-01 2.678E-01 3.655E-01 2.738E-01 2.532E-01 2.821E-01 4.15E-02 14.70%Th232 3.512E-03 3.654E-03 3.470E-03 3.605E-03 3.318E-03 3.543E-03 3.517E-03 1.17E-04 3.34%Cf252 7.905E-40 4.019E-40 0.000E+00 0.000E+00 7.438E-35 1.488E-35 3.33E-35 223.60%

NEA/NSC/R(2016)3
66
Table A.6. Trends of relative standard deviation versus cooling time for actinides in assembly calculation
Discharge 5 years 50 years 100 years 300 yearsU232 59.73% 45.32% 49.41% 49.50% 49.86%U233 176.52% 142.35% 37.86% 15.24% 8.35%U234 21.55% 16.09% 14.70% 14.68% 14.71%U235 7.83% 7.85% 7.92% 7.99% 8.28%U236 4.14% 4.10% 3.79% 3.53% 3.08%U238 0.17% 0.17% 0.17% 0.17% 0.17%
Np236 45.39% 45.38% 45.38% 45.38% 45.36%Np237 11.75% 11.56% 9.50% 8.81% 8.32%Pu236 48.36% 48.93% 54.74% 52.52% 53.40%Pu238 18.52% 14.69% 14.70% 14.72% 14.82%Pu239 13.42% 13.18% 13.17% 13.17% 13.14%Pu240 4.20% 4.22% 4.31% 4.33% 4.33%Pu241 7.74% 7.74% 7.81% 7.95% 23.90%Pu242 5.66% 5.66% 5.66% 5.66% 5.66%Pu243 14.65% 32.72% 32.72% 244.95% 32.73%Pu244 40.44% 40.44% 40.44% 40.44% 40.44%Am241 16.38% 9.07% 8.06% 8.04% 8.04%
Am242m 31.78% 31.78% 31.78% 31.80% 31.79%Am243 6.26% 6.26% 6.25% 6.26% 6.26%Cm242 3.18% 4.36% 31.62% 31.62% 31.67%Cm243 5.64% 5.56% 5.27% 6.16% 14.97%Cm244 8.14% 8.18% 8.14% 8.15% 8.32%Cm245 24.47% 24.47% 24.48% 24.47% 24.46%Cm246 18.17% 18.17% 18.17% 18.17% 18.17%Cm247 33.28% 33.28% 33.28% 33.28% 33.28%Cm248 38.26% 38.29% 38.27% 38.27% 38.26%Ra226 8.00% 13.97% 14.80% 14.71% 14.71%Ra228 5.71% 6.41% 14.13% 16.30% 16.15%Ac227 22.20% 17.40% 13.16% 11.60% 10.93%Th229 83.36% 88.08% 72.12% 37.81% 9.76%Th230 8.36% 15.61% 14.74% 14.69% 14.70%Th232 3.62% 3.99% 3.95% 3.79% 3.34%Cf252 49.57% 49.56% 49.46% 244.93% 223.60%

NEA/NSC/R(2016)3
67
Table A.7. Results for fission products in assembly calculation at discharge (g/tHMI)
CEA NNL KURCHATOV UNIPI GRS (KENOREST)
GRS (TRITON) AVERAGE SD RSD
Se79 4.857E+00 4.337E+00 4.627E+00 5.120E+00 4.781E+00 4.506E+00 4.705E+00 2.764E-01 5.88%
Kr85 1.696E+01 1.664E+01 1.563E+01 1.757E+01 1.546E+01 1.591E+01 1.636E+01 8.303E-01 5.07%
Rb85 6.438E+01 6.384E+01 6.356E+01 6.734E+01 6.090E+01 6.152E+01 6.359E+01 2.292E+00 3.60%
Rb87 1.461E+02 1.431E+02 1.478E+02 1.608E+02 1.493E+02 1.476E+02 1.491E+02 6.095E+00 4.09%
Sr88 1.985E+02 1.959E+02 1.971E+02 2.146E+02 2.038E+02 1.974E+02 2.012E+02 7.113E+00 3.53%
Sr90 2.958E+02 2.999E+02 3.038E+02 3.365E+02 3.011E+02 3.086E+02 3.076E+02 1.477E+01 4.80%
Nb93m 3.292E-04 3.072E-04 3.201E-04 2.499E-02 3.400E-01 4.598E-02 6.865E-02 1.342E-01 195.48%
Mo95 5.712E+02 5.624E+02 5.662E+02 6.665E+02 6.118E+02 6.147E+02 5.988E+02 4.038E+01 6.74%
Mo97 8.043E+02 8.095E+02 8.255E+02 9.613E+02 8.683E+02 8.672E+02 8.560E+02 5.853E+01 6.84%
Tc99 8.449E+02 8.544E+02 8.619E+02 9.896E+02 8.898E+02 8.757E+02 8.860E+02 5.315E+01 6.00%
Ru101 9.407E+02 9.444E+02 9.432E+02 1.051E+03 9.108E+02 9.454E+02 9.559E+02 4.840E+01 5.06%
Ru106 3.582E+02 3.609E+02 3.692E+02 4.376E+02 3.734E+02 3.719E+02 3.785E+02 2.957E+01 7.81%
Rh103 6.773E+02 6.810E+02 6.792E+02 8.572E+02 6.331E+02 6.793E+02 7.012E+02 7.864E+01 11.21%
Pd107 5.731E+02 5.447E+02 5.603E+02 6.403E+02 5.777E+02 5.723E+02 5.781E+02 3.274E+01 5.66%
Ag108m 1.043E-03 4.888E-06 7.215E-06 2.126E-06 8.101E-06 2.188E-06 1.779E-04 4.238E-04 238.20%
Ag109 1.950E+02 1.304E+02 2.075E+02 2.297E+02 1.995E+02 1.960E+02 1.930E+02 3.327E+01 17.24%
Ag110m 3.010E+00 4.475E+00 2.812E+00 2.214E+00 3.568E+00 2.348E+00 3.071E+00 8.422E-01 27.42%
I127 8.110E+01 8.046E+01 8.238E+01 8.552E+01 7.283E+01 7.448E+01 7.946E+01 4.852E+00 6.11%
I129 2.511E+02 2.586E+02 2.393E+02 2.699E+02 2.456E+02 2.357E+02 2.500E+02 1.273E+01 5.09%
Xe130 1.162E+01 1.170E+01 9.876E+00 9.332E+00 1.158E+01 1.133E+01 1.091E+01 1.031E+00 9.45%
Xe131 4.911E+02 4.193E+02 4.950E+02 6.161E+02 4.689E+02 4.874E+02 4.963E+02 6.503E+01 13.10%
Xe132 1.299E+03 1.388E+03 1.320E+03 1.455E+03 1.349E+03 1.372E+03 1.364E+03 5.535E+01 4.06%
Xe134 1.526E+03 1.650E+03 1.685E+03 1.869E+03 1.648E+03 1.692E+03 1.678E+03 1.109E+02 6.61%
Xe136 2.680E+03 2.622E+03 2.760E+03 2.768E+03 2.698E+03 2.758E+03 2.714E+03 5.791E+01 2.13%
Cs133 1.217E+03 1.244E+03 1.235E+03 1.408E+03 1.208E+03 1.253E+03 1.261E+03 7.400E+01 5.87%
Cs134 1.651E+02 1.490E+02 1.738E+02 1.670E+02 1.812E+02 1.528E+02 1.648E+02 1.223E+01 7.42%
Cs135 4.098E+02 4.514E+02 4.238E+02 7.502E+02 4.348E+02 4.298E+02 4.833E+02 1.315E+02 27.20%
Cs137 1.380E+03 1.376E+03 1.415E+03 1.572E+03 1.393E+03 1.416E+03 1.425E+03 7.377E+01 5.18%
Ba136 2.802E+01 3.366E+01 2.788E+01 5.763E+01 3.103E+01 4.727E+01 3.758E+01 1.216E+01 32.36%
Ba138 1.373E+03 1.387E+03 1.394E+03 1.539E+03 1.388E+03 1.394E+03 1.412E+03 6.249E+01 4.42%
La139 1.315E+03 1.221E+03 1.290E+03 1.431E+03 1.267E+03 1.292E+03 1.303E+03 7.053E+01 5.41%
Ce140 1.226E+03 1.233E+03 1.246E+03 1.354E+03 1.279E+03 1.240E+03 1.263E+03 4.823E+01 3.82%
Ce144 3.696E+02 3.696E+02 3.727E+02 4.424E+02 3.780E+02 3.744E+02 3.844E+02 2.857E+01 7.43%
Nd142 2.026E+01 1.877E+01 2.115E+01 1.635E+01 2.015E+01 2.084E+01 1.959E+01 1.785E+00 9.11%
Nd143 7.313E+02 7.773E+02 7.520E+02 9.395E+02 7.579E+02 7.475E+02 7.843E+02 7.751E+01 9.88%
Nd144 8.295E+02 7.972E+02 8.296E+02 7.563E+02 8.184E+02 8.285E+02 8.099E+02 2.907E+01 3.59%
Nd145 6.475E+02 6.613E+02 6.556E+02 7.328E+02 6.478E+02 6.510E+02 6.660E+02 3.314E+01 4.98%
Nd146 7.119E+02 7.144E+02 7.115E+02 7.680E+02 7.208E+02 7.168E+02 7.239E+02 2.187E+01 3.02%
Nd148 4.246E+02 4.327E+02 4.248E+02 4.655E+02 4.229E+02 4.201E+02 4.318E+02 1.705E+01 3.95%
Nd150 2.471E+02 2.495E+02 2.504E+02 2.767E+02 2.508E+02 2.508E+02 2.542E+02 1.110E+01 4.37%

NEA/NSC/R(2016)3
68
Table A.7. Results for fission products in assembly calculation at discharge (g/tHMI) (continued)
CEA NNL KURCHATOV UNIPI GRS (KENOREST)
GRS (TRITON) AVERAGE SD RSD
Pm147 1.894E+02 1.529E+02 1.756E+02 2.317E+02 1.770E+02 1.770E+02 1.839E+02 2.623E+01 14.26%
Sm146 8.269E-03 5.283E-08 9.040E-07 2.911E-03 9.873E-03 6.040E-03 4.516E-03 4.206E-03 93.15%
Sm147 6.414E+01 5.639E+01 6.237E+01 7.239E+01 6.054E+01 6.167E+01 6.292E+01 5.316E+00 8.45%
Sm148 1.489E+02 1.629E+02 1.556E+02 1.603E+02 1.404E+02 1.346E+02 1.505E+02 1.125E+01 7.48%
Sm149 2.442E+00 3.342E+00 1.698E+00 5.444E+00 2.903E+00 2.905E+00 3.122E+00 1.267E+00 40.58%
Sm150 3.591E+02 3.496E+02 2.704E+02 3.838E+02 3.586E+02 3.622E+02 3.473E+02 3.935E+01 11.33%
Sm151 1.463E+01 2.259E+01 1.329E+01 2.766E+01 1.872E+01 1.984E+01 1.945E+01 5.274E+00 27.11%
Sm152 1.427E+02 1.958E+02 1.379E+02 1.696E+02 1.737E+02 1.726E+02 1.654E+02 2.161E+01 13.06%
Sm154 7.298E+01 7.543E+01 6.940E+01 7.828E+01 7.333E+01 7.098E+01 7.340E+01 3.161E+00 4.31%
Eu153 1.805E+02 1.887E+02 1.825E+02 1.990E+02 1.862E+02 1.813E+02 1.864E+02 6.928E+00 3.72%
Eu154 4.270E+01 6.630E+01 3.783E+01 5.468E+01 3.919E+01 4.156E+01 4.704E+01 1.118E+01 23.76%
Eu155 1.333E+01 1.606E+01 1.382E+01 1.497E+01 1.536E+01 9.320E+00 1.381E+01 2.417E+00 17.50%
Gd154 3.053E+00 4.134E+00 2.785E+00 3.298E+00 2.714E+00 2.912E+00 3.149E+00 5.254E-01 16.68%
Gd155 8.180E-02 1.176E-01 8.498E-02 1.530E-01 9.457E-02 6.395E-02 9.932E-02 3.163E-02 31.85%
Gd156 1.451E+02 1.377E+02 1.564E+02 1.214E+02 1.497E+02 1.472E+02 1.429E+02 1.218E+01 8.52%
Ho166m 2.116E-02 3.224E-02 9.017E-04 5.073E-04 1.871E-03 7.292E-04 9.569E-03 1.373E-02 143.53%

NEA/NSC/R(2016)3
69
Table A.8. Results for fission products in assembly calculation at 5 years (g/tHMI)
CEA NNL KURCHATOV UNIPI GRS (KENOREST)
GRS (TRITON) AVERAGE SD RSD
Se79 4.857E+00 4.337E+00 4.627E+00 5.120E+00 4.781E+00 4.506E+00 4.705E+00 2.764E-01 5.88%
Kr85 1.229E+01 1.205E+01 1.131E+01 1.272E+01 1.121E+01 1.151E+01 1.185E+01 6.009E-01 5.07%
Rb85 6.907E+01 6.846E+01 6.790E+01 7.223E+01 6.517E+01 6.594E+01 6.813E+01 2.506E+00 3.68%
Rb87 1.461E+02 1.431E+02 1.478E+02 1.608E+02 1.493E+02 1.476E+02 1.491E+02 6.093E+00 4.09%
Sr88 1.985E+02 1.959E+02 1.971E+02 2.146E+02 2.038E+02 1.975E+02 2.012E+02 7.096E+00 3.53%
Sr90 2.622E+02 2.663E+02 2.686E+02 2.975E+02 2.668E+02 2.729E+02 2.724E+02 1.279E+01 4.69%
Nb93m 1.410E-03 1.430E-03 1.397E-03 2.147E-02 2.648E-01 3.828E-02 5.480E-02 1.040E-01 189.71%
Mo95 6.916E+02 6.854E+02 6.838E+02 8.222E+02 7.330E+02 7.344E+02 7.251E+02 5.288E+01 7.29%
Mo97 8.053E+02 8.106E+02 8.266E+02 9.628E+02 8.694E+02 8.682E+02 8.571E+02 5.870E+01 6.85%
Tc99 8.499E+02 8.594E+02 8.668E+02 9.960E+02 8.950E+02 8.806E+02 8.913E+02 5.370E+01 6.03%
Ru101 9.407E+02 9.444E+02 9.432E+02 1.052E+03 9.108E+02 9.454E+02 9.561E+02 4.879E+01 5.10%
Ru106 1.199E+01 1.159E+01 1.223E+01 1.449E+01 1.264E+01 1.232E+01 1.254E+01 1.016E+00 8.10%
Rh103 7.526E+02 7.568E+02 7.544E+02 9.588E+02 7.046E+02 7.567E+02 7.806E+02 8.960E+01 11.48%
Pd107 5.732E+02 5.447E+02 5.603E+02 6.404E+02 5.777E+02 5.723E+02 5.781E+02 3.277E+01 5.67%
Ag108m 1.034E-03 4.848E-06 7.022E-06 2.069E-06 7.883E-06 2.129E-06 1.763E-04 4.202E-04 238.30%
Ag109 1.954E+02 1.308E+02 2.079E+02 2.301E+02 1.999E+02 1.964E+02 1.934E+02 3.328E+01 17.21%
Ag110m 1.895E-02 2.823E-02 1.771E-02 1.394E-02 2.260E-02 1.478E-02 1.937E-02 5.337E-03 27.56%
I127 8.451E+01 8.412E+01 8.573E+01 8.953E+01 7.567E+01 7.751E+01 8.285E+01 5.241E+00 6.33%
I129 2.564E+02 2.613E+02 2.417E+02 2.733E+02 2.482E+02 2.383E+02 2.532E+02 1.311E+01 5.18%
Xe130 1.165E+01 1.172E+01 9.895E+00 9.350E+00 1.160E+01 1.135E+01 1.093E+01 1.034E+00 9.46%
Xe131 5.018E+02 4.306E+02 5.056E+02 6.307E+02 4.796E+02 4.985E+02 5.078E+02 6.631E+01 13.06%
Xe132 1.305E+03 1.394E+03 1.326E+03 1.463E+03 1.354E+03 1.378E+03 1.370E+03 5.606E+01 4.09%
Xe134 1.526E+03 1.650E+03 1.685E+03 1.870E+03 1.648E+03 1.692E+03 1.678E+03 1.113E+02 6.63%
Xe136 2.680E+03 2.622E+03 2.760E+03 2.768E+03 2.698E+03 2.758E+03 2.714E+03 5.791E+01 2.13%
Cs133 1.233E+03 1.260E+03 1.250E+03 1.429E+03 1.223E+03 1.268E+03 1.277E+03 7.623E+01 5.97%
Cs134 3.082E+01 2.775E+01 3.236E+01 3.107E+01 3.378E+01 2.845E+01 3.070E+01 2.288E+00 7.45%
Cs135 4.107E+02 4.523E+02 4.245E+02 7.515E+02 4.357E+02 4.308E+02 4.842E+02 1.316E+02 27.18%
Cs137 1.230E+03 1.226E+03 1.260E+03 1.401E+03 1.242E+03 1.261E+03 1.270E+03 6.581E+01 5.18%
Ba136 2.894E+01 3.495E+01 2.865E+01 5.923E+01 3.219E+01 4.839E+01 3.872E+01 1.239E+01 32.01%
Ba138 1.373E+03 1.387E+03 1.394E+03 1.539E+03 1.388E+03 1.394E+03 1.412E+03 6.248E+01 4.42%
La139 1.315E+03 1.221E+03 1.290E+03 1.431E+03 1.267E+03 1.292E+03 1.303E+03 7.050E+01 5.41%
Ce140 1.257E+03 1.269E+03 1.280E+03 1.396E+03 1.312E+03 1.272E+03 1.298E+03 5.164E+01 3.98%
Ce144 4.353E+00 4.344E+00 4.390E+00 5.202E+00 4.451E+00 4.402E+00 4.524E+00 3.345E-01 7.39%
Nd142 2.033E+01 1.883E+01 2.122E+01 1.642E+01 2.022E+01 2.091E+01 1.966E+01 1.785E+00 9.08%
Nd143 7.581E+02 8.047E+02 7.781E+02 9.752E+02 7.850E+02 7.749E+02 8.127E+02 8.105E+01 9.97%
Nd144 1.195E+03 1.163E+03 1.198E+03 1.194E+03 1.192E+03 1.199E+03 1.190E+03 1.376E+01 1.16%
Nd145 6.479E+02 6.616E+02 6.562E+02 7.332E+02 6.481E+02 6.512E+02 6.664E+02 3.316E+01 4.98%
Nd146 7.119E+02 7.145E+02 7.115E+02 7.680E+02 7.208E+02 7.168E+02 7.239E+02 2.187E+01 3.02%
Nd148 4.246E+02 4.327E+02 4.248E+02 4.655E+02 4.229E+02 4.201E+02 4.318E+02 1.705E+01 3.95%
Nd150 2.471E+02 2.495E+02 2.504E+02 2.767E+02 2.508E+02 2.508E+02 2.542E+02 1.110E+01 4.37%

NEA/NSC/R(2016)3
70
Table A.8. Results for fission products in assembly calculation at 5 years (g/tHMI) (continued)
CEA NNL KURCHATOV UNIPI GRS (KENOREST)
GRS (TRITON) AVERAGE SD RSD
Pm147 5.314E+01 4.344E+01 4.935E+01 6.524E+01 4.989E+01 4.985E+01 5.182E+01 7.291E+00 14.07%
Sm146 9.351E-03 1.898E-07 9.040E-07 3.172E-03 1.010E-02 6.192E-03 4.803E-03 4.460E-03 92.87%
Sm147 2.100E+02 1.758E+02 1.979E+02 2.515E+02 1.975E+02 1.986E+02 2.052E+02 2.525E+01 12.30%
Sm148 1.524E+02 1.667E+02 1.593E+02 1.657E+02 1.438E+02 1.380E+02 1.543E+02 1.173E+01 7.60%
Sm149 4.350E+00 5.473E+00 2.915E+00 7.747E+00 4.975E+00 4.995E+00 5.076E+00 1.582E+00 31.16%
Sm150 3.591E+02 3.496E+02 2.704E+02 3.838E+02 3.586E+02 3.622E+02 3.473E+02 3.935E+01 11.33%
Sm151 1.447E+01 2.212E+01 1.317E+01 2.713E+01 1.844E+01 1.948E+01 1.913E+01 5.114E+00 26.73%
Sm152 1.427E+02 1.958E+02 1.379E+02 1.696E+02 1.737E+02 1.726E+02 1.654E+02 2.161E+01 13.07%
Sm154 7.298E+01 7.544E+01 6.940E+01 7.828E+01 7.333E+01 7.098E+01 7.340E+01 3.162E+00 4.31%
Eu153 1.822E+02 1.906E+02 1.841E+02 2.010E+02 1.880E+02 1.831E+02 1.882E+02 7.048E+00 3.75%
Eu154 2.853E+01 4.431E+01 2.527E+01 3.653E+01 2.644E+01 2.776E+01 3.147E+01 7.438E+00 23.63%
Eu155 6.428E+00 7.982E+00 6.591E+00 7.135E+00 7.422E+00 4.444E+00 6.667E+00 1.227E+00 18.40%
Gd154 1.722E+01 2.612E+01 1.534E+01 2.144E+01 1.546E+01 1.670E+01 1.871E+01 4.256E+00 22.74%
Gd155 6.982E+00 8.198E+00 7.314E+00 7.982E+00 8.035E+00 4.941E+00 7.242E+00 1.221E+00 16.86%
Gd156 1.539E+02 1.454E+02 1.654E+02 1.295E+02 1.587E+02 1.560E+02 1.515E+02 1.259E+01 8.31%
Ho166m 2.110E-02 3.215E-02 8.992E-04 5.059E-04 1.866E-03 7.272E-04 9.542E-03 1.369E-02 143.53%

NEA/NSC/R(2016)3
71
Table A.9. Results for fission products in assembly calculation at 50 years (g/tHMI)
CEA NNL KURCHATOV UNIPI GRS (KENOREST) GRS (TRITON) AVERAGE SD RSD
Se79 4.857E+00 4.335E+00 4.627E+00 5.119E+00 4.781E+00 4.504E+00 4.704E+00 2.770E-01 5.89%
Kr85 6.755E-01 6.563E-01 6.165E-01 6.931E-01 6.185E-01 6.274E-01 6.479E-01 3.208E-02 4.95%
Rb85 8.069E+01 7.985E+01 7.859E+01 8.426E+01 7.576E+01 7.682E+01 7.933E+01 3.034E+00 3.82%
Rb87 1.461E+02 1.431E+02 1.478E+02 1.608E+02 1.493E+02 1.476E+02 1.491E+02 6.093E+00 4.09%
Sr88 1.985E+02 1.959E+02 1.971E+02 2.146E+02 2.038E+02 1.975E+02 2.012E+02 7.096E+00 3.53%
Sr90 8.874E+01 9.123E+01 8.872E+01 9.824E+01 8.985E+01 9.010E+01 9.115E+01 3.599E+00 3.95%
Nb93m 5.268E-03 5.488E-03 5.242E-03 8.928E-03 3.166E-02 1.082E-02 1.123E-02 1.027E-02 91.41%
Mo95 6.916E+02 6.854E+02 6.838E+02 8.222E+02 7.330E+02 7.344E+02 7.251E+02 5.288E+01 7.29%
Mo97 8.053E+02 8.106E+02 8.266E+02 9.628E+02 8.694E+02 8.682E+02 8.571E+02 5.870E+01 6.85%
Tc99 8.497E+02 8.593E+02 8.668E+02 9.960E+02 8.949E+02 8.806E+02 8.912E+02 5.375E+01 6.03%
Ru101 9.407E+02 9.444E+02 9.432E+02 1.052E+03 9.108E+02 9.454E+02 9.561E+02 4.879E+01 5.10%
Ru106 1.769E-07 4.220E-13 5.853E-13 6.931E-13 7.363E-13 5.891E-13 2.948E-08 7.222E-08 244.94%
Rh103 7.526E+02 7.568E+02 7.544E+02 9.588E+02 7.046E+02 7.567E+02 7.806E+02 8.960E+01 11.48%
Pd107 5.732E+02 5.447E+02 5.603E+02 6.404E+02 5.777E+02 5.723E+02 5.781E+02 3.277E+01 5.67%
Ag108m 9.597E-04 4.499E-06 5.493E-06 1.619E-06 6.167E-06 1.665E-06 1.632E-04 3.902E-04 239.11%
Ag109 1.954E+02 1.308E+02 2.079E+02 2.301E+02 1.999E+02 1.964E+02 1.934E+02 3.328E+01 17.21%
Ag110m 5.018E-12 4.467E-22 2.760E-22 2.173E-22 3.701E-22 2.304E-22 8.363E-13 2.049E-12 244.95%
I127 8.451E+01 8.412E+01 8.573E+01 8.953E+01 7.567E+01 7.751E+01 8.285E+01 5.241E+00 6.33%
I129 2.564E+02 2.613E+02 2.417E+02 2.733E+02 2.482E+02 2.383E+02 2.532E+02 1.311E+01 5.18%
Xe130 1.165E+01 1.172E+01 9.895E+00 9.350E+00 1.160E+01 1.135E+01 1.093E+01 1.034E+00 9.46%
Xe131 5.018E+02 4.306E+02 5.056E+02 6.307E+02 4.796E+02 4.985E+02 5.078E+02 6.631E+01 13.06%
Xe132 1.305E+03 1.394E+03 1.326E+03 1.463E+03 1.354E+03 1.378E+03 1.370E+03 5.606E+01 4.09%
Xe134 1.526E+03 1.650E+03 1.685E+03 1.870E+03 1.648E+03 1.692E+03 1.678E+03 1.113E+02 6.63%
Xe136 2.680E+03 2.622E+03 2.760E+03 2.768E+03 2.698E+03 2.758E+03 2.714E+03 5.791E+01 2.13%
Cs133 1.233E+03 1.260E+03 1.250E+03 1.429E+03 1.223E+03 1.268E+03 1.277E+03 7.623E+01 5.97%
Cs134 8.496E-06 7.468E-06 8.723E-06 8.366E-06 9.195E-06 7.664E-06 8.319E-06 6.508E-07 7.82%
Cs135 4.107E+02 4.523E+02 4.245E+02 7.515E+02 4.357E+02 4.308E+02 4.842E+02 1.316E+02 27.18%
Cs137 4.353E+02 4.335E+02 4.455E+02 4.953E+02 4.419E+02 4.459E+02 4.496E+02 2.299E+01 5.11%
Ba136 2.894E+01 3.495E+01 2.865E+01 5.923E+01 3.219E+01 4.839E+01 3.872E+01 1.239E+01 32.01%
Ba138 1.373E+03 1.387E+03 1.394E+03 1.539E+03 1.388E+03 1.394E+03 1.412E+03 6.248E+01 4.42%
La139 1.315E+03 1.221E+03 1.290E+03 1.431E+03 1.267E+03 1.292E+03 1.303E+03 7.050E+01 5.41%
Ce140 1.257E+03 41.269E+03 1.280E+03 1.396E+03 1.312E+03 1.272E+03 1.298E+03 5.164E+01 3.98%
Ce144 9.567E-08 1.860E-17 1.912E-17 2.235E-17 1.938E-17 1.891E-17 1.595E-08 3.906E-08 244.95%
Nd142 2.033E+01 1.883E+01 2.122E+01 1.642E+01 2.022E+01 2.091E+01 1.966E+01 1.785E+00 9.08%
Nd143 7.581E+02 8.047E+02 7.781E+02 9.752E+02 7.850E+02 7.749E+02 8.127E+02 8.105E+01 9.97%
Nd144 1.199E+03 1.167E+03 1.202E+03 1.199E+03 1.196E+03 1.203E+03 1.194E+03 1.370E+01 1.15%
Nd145 6.479E+02 6.616E+02 6.562E+02 7.332E+02 6.481E+02 6.512E+02 6.664E+02 3.316E+01 4.98%
Nd146 7.119E+02 7.145E+02 7.115E+02 7.680E+02 7.208E+02 7.168E+02 7.239E+02 2.187E+01 3.02%
Nd148 4.246E+02 4.327E+02 4.248E+02 4.655E+02 4.229E+02 4.201E+02 4.318E+02 1.705E+01 3.95%
Nd150 2.471E+02 2.495E+02 2.504E+02 2.767E+02 2.508E+02 2.508E+02 2.542E+02 1.110E+01 4.37%

NEA/NSC/R(2016)3
72
Table A.9. Results for fission products in assembly calculation at 50 years (g/tHMI) (continued)
CEA NNL KURCHATOV UNIPI GRS (KENOREST) GRS (TRITON) AVERAGE SD RSD
Pm147 3.647E-04 2.972E-04 3.379E-04 4.467E-04 3.443E-04 3.414E-04 3.554E-04 4.987E-05 14.03%
Sm146 1.059E-02 3.464E-07 9.040E-07 3.471E-03 1.036E-02 6.363E-03 5.131E-03 4.776E-03 93.09%
Sm147 2.632E+02 2.192E+02 2.472E+02 3.168E+02 2.474E+02 2.485E+02 2.571E+02 3.256E+01 12.67%
Sm148 1.524E+02 1.667E+02 1.593E+02 1.657E+02 1.438E+02 1.380E+02 1.543E+02 1.173E+01 7.60%
Sm149 4.350E+00 5.473E+00 2.915E+00 7.747E+00 4.975E+00 4.995E+00 5.076E+00 1.582E+00 31.16%
Sm150 3.591E+02 3.496E+02 2.704E+02 3.838E+02 3.586E+02 3.622E+02 3.473E+02 3.935E+01 11.33%
Sm151 1.023E+01 1.556E+01 9.315E+00 1.918E+01 1.319E+01 1.378E+01 1.354E+01 3.602E+00 26.60%
Sm152 1.427E+02 1.958E+02 1.379E+02 1.697E+02 1.737E+02 1.726E+02 1.654E+02 2.162E+01 13.07%
Sm154 7.299E+01 7.544E+01 6.943E+01 7.829E+01 7.334E+01 7.098E+01 7.341E+01 3.158E+00 4.30%
Eu153 1.822E+02 1.906E+02 1.841E+02 2.010E+02 1.880E+02 1.831E+02 1.882E+02 7.048E+00 3.75%
Eu154 7.566E-01 1.178E+00 6.691E-01 9.682E-01 7.654E-01 7.356E-01 8.455E-01 1.914E-01 22.64%
Eu155 9.079E-03 1.476E-02 8.402E-03 9.096E-03 1.062E-02 5.666E-03 9.603E-03 3.002E-03 31.26%
Gd154 4.499E+01 6.925E+01 3.994E+01 5.700E+01 4.113E+01 4.372E+01 4.934E+01 1.150E+01 23.31%
Gd155 1.340E+01 1.617E+01 1.390E+01 1.510E+01 1.545E+01 9.380E+00 1.390E+01 2.435E+00 17.52%
Gd156 1.539E+02 1.454E+02 1.654E+02 1.295E+02 1.587E+02 1.560E+02 1.515E+02 1.259E+01 8.31%
Ho166m 2.056E-02 3.133E-02 8.761E-04 4.928E-04 1.818E-03 7.083E-04 9.297E-03 1.334E-02 143.53%

NEA/NSC/R(2016)3
73
Table A.10. Results for fission products in assembly calculation at 100 years (g/tHMI)
CEA NNL KURCHATOV UNIPI GRS (KENOREST)
GRS (TRITON) AVERAGE SD RSD
Se79 4.856E+00 4.333E+00 4.625E+00 5.119E+00 4.781E+00 4.504E+00 4.703E+00 2.776E-01 5.90%
Kr85 2.690E-02 2.588E-02 2.432E-02 2.733E-02 2.474E-02 2.475E-02 2.565E-02 1.253E-03 4.88%
Rb85 8.133E+01 8.048E+01 7.918E+01 8.492E+01 7.635E+01 7.741E+01 7.994E+01 3.062E+00 3.83%
Rb87 1.461E+02 1.431E+02 1.478E+02 1.608E+02 1.493E+02 1.476E+02 1.491E+02 6.093E+00 4.09%
Sr88 1.985E+02 1.959E+02 1.971E+02 2.146E+02 2.038E+02 1.975E+02 2.012E+02 7.096E+00 3.53%
Sr90 2.663E+01 2.775E+01 2.590E+01 2.868E+01 2.681E+01 2.629E+01 2.701E+01 1.026E+00 3.80%
Nb93m 5.844E-03 6.112E-03 5.816E-03 7.053E-03 7.498E-03 6.718E-03 6.507E-03 6.925E-04 10.64%
Mo95 6.916E+02 6.854E+02 6.838E+02 8.222E+02 7.330E+02 7.344E+02 7.251E+02 5.288E+01 7.29%
Mo97 8.053E+02 8.106E+02 8.266E+02 9.628E+02 8.694E+02 8.682E+02 8.571E+02 5.870E+01 6.85%
Tc99 8.496E+02 8.592E+02 8.666E+02 9.960E+02 8.947E+02 8.804E+02 8.911E+02 5.380E+01 6.04%
Ru101 9.407E+02 9.444E+02 9.432E+02 1.052E+03 9.108E+02 9.454E+02 9.561E+02 4.879E+01 5.10%
Ru106 2.581E-08 4.935E-28 9.279E-28 1.099E-27 1.864E-05 3.733E-06 8.333E-06 223.22%
Rh103 7.526E+02 7.568E+02 7.544E+02 9.588E+02 7.046E+02 7.567E+02 7.806E+02 8.960E+01 11.48%
Pd107 5.732E+02 5.447E+02 5.603E+02 6.404E+02 5.777E+02 5.723E+02 5.781E+02 3.277E+01 5.67%
Ag108m 8.833E-04 4.141E-06 4.180E-06 1.232E-06 4.695E-06 1.267E-06 1.498E-04 3.593E-04 239.88%
Ag109 1.954E+02 1.308E+02 2.079E+02 2.301E+02 1.999E+02 1.964E+02 1.934E+02 3.328E+01 17.21%
Ag110m 7.344E-13 0.000E+00 0.000E+00 0.000E+00 3.722E-07 7.444E-08 1.665E-07 223.61%
I127 8.451E+01 8.412E+01 8.573E+01 8.953E+01 7.567E+01 7.751E+01 8.285E+01 5.241E+00 6.33%
I129 2.564E+02 2.613E+02 2.417E+02 2.733E+02 2.482E+02 2.383E+02 2.532E+02 1.311E+01 5.18%
Xe130 1.165E+01 1.172E+01 9.895E+00 9.350E+00 1.160E+01 1.135E+01 1.093E+01 1.034E+00 9.46%
Xe131 5.018E+02 4.306E+02 5.056E+02 6.307E+02 4.796E+02 4.985E+02 5.078E+02 6.631E+01 13.06%
Xe132 1.305E+03 1.394E+03 1.326E+03 1.463E+03 1.354E+03 1.378E+03 1.370E+03 5.606E+01 4.09%
Xe134 1.526E+03 1.650E+03 1.685E+03 1.870E+03 1.648E+03 1.692E+03 1.678E+03 1.113E+02 6.63%
Xe136 2.680E+03 2.622E+03 2.760E+03 2.768E+03 2.698E+03 2.758E+03 2.714E+03 5.791E+01 2.13%
Cs133 1.233E+03 1.260E+03 1.250E+03 1.429E+03 1.223E+03 1.268E+03 1.277E+03 7.623E+01 5.97%
Cs134 2.613E-11 3.743E-13 4.378E-13 4.311E-13 4.666E-13 1.611E-05 2.685E-06 6.577E-06 244.95%
Cs135 4.107E+02 4.523E+02 4.245E+02 7.515E+02 4.357E+02 4.308E+02 4.842E+02 1.316E+02 27.18%
Cs137 1.373E+02 1.365E+02 1.404E+02 1.560E+02 1.402E+02 1.405E+02 1.418E+02 7.155E+00 5.05%
Ba136 2.894E+01 3.495E+01 2.865E+01 5.923E+01 3.219E+01 4.839E+01 3.872E+01 1.239E+01 32.01%
Ba138 1.373E+03 1.387E+03 1.394E+03 1.539E+03 1.388E+03 1.394E+03 1.412E+03 6.248E+01 4.42%
La139 1.315E+03 1.221E+03 1.290E+03 1.431E+03 1.267E+03 1.292E+03 1.303E+03 7.050E+01 5.41%
Ce140 1.257E+03 1.269E+03 1.280E+03 1.396E+03 1.312E+03 1.272E+03 1.298E+03 5.164E+01 3.98%
Ce144 1.396E-08 9.361E-37 9.867E-37 0.000E+00 2.464E-05 4.931E-06 1.102E-05 223.45%
Nd142 2.033E+01 1.883E+01 2.122E+01 1.642E+01 2.022E+01 2.091E+01 1.966E+01 1.785E+00 9.08%
Nd143 7.581E+02 8.047E+02 7.781E+02 9.752E+02 7.850E+02 7.749E+02 8.127E+02 8.105E+01 9.97%
Nd144 1.199E+03 1.167E+03 1.202E+03 1.199E+03 1.196E+03 1.203E+03 1.194E+03 1.370E+01 1.15%
Nd145 6.479E+02 6.616E+02 6.562E+02 7.332E+02 6.481E+02 6.512E+02 6.664E+02 3.316E+01 4.98%
Nd146 7.119E+02 7.145E+02 7.115E+02 7.680E+02 7.208E+02 7.168E+02 7.239E+02 2.187E+01 3.02%
Nd148 4.246E+02 4.327E+02 4.248E+02 4.655E+02 4.229E+02 4.201E+02 4.318E+02 1.705E+01 3.95%
Nd150 2.471E+02 2.495E+02 2.504E+02 2.767E+02 2.508E+02 2.508E+02 2.542E+02 1.110E+01 4.37%

NEA/NSC/R(2016)3
74
Table A.10. Results for fission products in assembly calculation at 100 years (g/tHMI) (continued)
CEA NNL KURCHATOV UNIPI GRS (KENOREST)
GRS (TRITON) AVERAGE SD RSD
Pm147 2.436E-08 5.424E-10 6.174E-10 8.158E-10 6.346E-10 3.545E-08 1.040E-08 1.551E-08 149.07%
Sm146 1.059E-02 3.470E-07 9.040E-07 3.472E-03 1.036E-02 6.366E-03 5.132E-03 4.776E-03 93.08%
Sm147 2.632E+02 2.192E+02 2.472E+02 3.168E+02 2.474E+02 2.485E+02 2.571E+02 3.256E+01 12.67%
Sm148 1.524E+02 1.667E+02 1.593E+02 1.657E+02 1.438E+02 1.380E+02 1.543E+02 1.173E+01 7.60%
Sm149 4.350E+00 5.473E+00 2.915E+00 7.747E+00 4.975E+00 4.995E+00 5.076E+00 1.582E+00 31.16%
Sm150 3.591E+02 3.496E+02 2.704E+02 3.838E+02 3.586E+02 3.622E+02 3.473E+02 3.935E+01 11.33%
Sm151 6.962E+00 1.053E+01 6.339E+00 1.305E+01 9.088E+00 9.375E+00 9.224E+00 2.442E+00 26.48%
Sm152 1.427E+02 1.958E+02 1.379E+02 1.697E+02 1.737E+02 1.726E+02 1.654E+02 2.162E+01 13.07%
Sm154 7.299E+01 7.544E+01 6.943E+01 7.829E+01 7.334E+01 7.101E+01 7.342E+01 3.154E+00 4.30%
Eu153 1.822E+02 1.906E+02 1.841E+02 2.010E+02 1.880E+02 1.831E+02 1.882E+02 7.048E+00 3.75%
Eu154 1.340E-02 2.094E-02 1.184E-02 1.714E-02 1.495E-02 1.304E-02 1.522E-02 3.345E-03 21.98%
Eu155 6.192E-06 1.356E-05 5.108E-06 5.529E-06 7.357E-06 4.422E-06 7.027E-06 3.351E-06 47.68%
Gd154 4.573E+01 7.041E+01 4.058E+01 5.795E+01 4.188E+01 4.444E+01 5.016E+01 1.169E+01 23.30%
Gd155 1.341E+01 1.618E+01 1.391E+01 1.511E+01 1.546E+01 9.385E+00 1.391E+01 2.438E+00 17.53%
Gd156 1.539E+02 1.454E+02 1.654E+02 1.295E+02 1.587E+02 1.560E+02 1.515E+02 1.259E+01 8.31%
Ho166m 1.997E-02 3.043E-02 8.511E-04 4.788E-04 1.766E-03 6.882E-04 9.031E-03 1.296E-02 143.53%
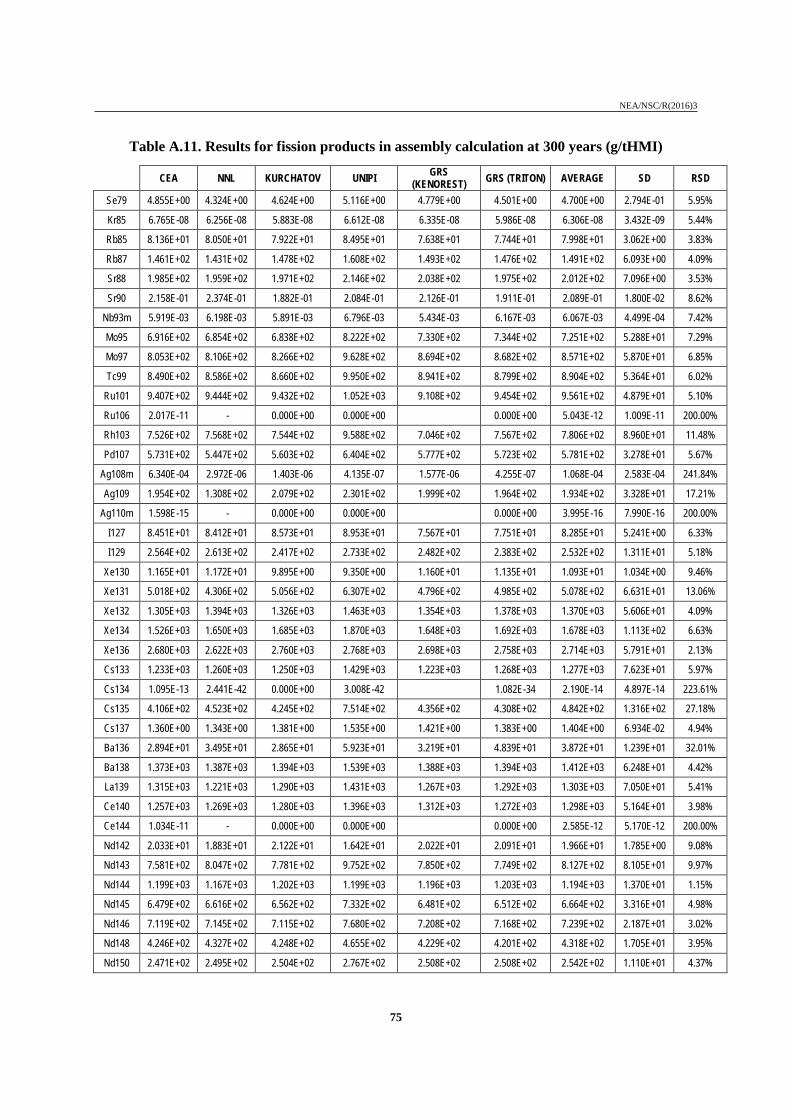
NEA/NSC/R(2016)3
75
Table A.11. Results for fission products in assembly calculation at 300 years (g/tHMI)
CEA NNL KURCHATOV UNIPI GRS (KENOREST) GRS (TRITON) AVERAGE SD RSD
Se79 4.855E+00 4.324E+00 4.624E+00 5.116E+00 4.779E+00 4.501E+00 4.700E+00 2.794E-01 5.95%
Kr85 6.765E-08 6.256E-08 5.883E-08 6.612E-08 6.335E-08 5.986E-08 6.306E-08 3.432E-09 5.44%
Rb85 8.136E+01 8.050E+01 7.922E+01 8.495E+01 7.638E+01 7.744E+01 7.998E+01 3.062E+00 3.83%
Rb87 1.461E+02 1.431E+02 1.478E+02 1.608E+02 1.493E+02 1.476E+02 1.491E+02 6.093E+00 4.09%
Sr88 1.985E+02 1.959E+02 1.971E+02 2.146E+02 2.038E+02 1.975E+02 2.012E+02 7.096E+00 3.53%
Sr90 2.158E-01 2.374E-01 1.882E-01 2.084E-01 2.126E-01 1.911E-01 2.089E-01 1.800E-02 8.62%
Nb93m 5.919E-03 6.198E-03 5.891E-03 6.796E-03 5.434E-03 6.167E-03 6.067E-03 4.499E-04 7.42%
Mo95 6.916E+02 6.854E+02 6.838E+02 8.222E+02 7.330E+02 7.344E+02 7.251E+02 5.288E+01 7.29%
Mo97 8.053E+02 8.106E+02 8.266E+02 9.628E+02 8.694E+02 8.682E+02 8.571E+02 5.870E+01 6.85%
Tc99 8.490E+02 8.586E+02 8.660E+02 9.950E+02 8.941E+02 8.799E+02 8.904E+02 5.364E+01 6.02%
Ru101 9.407E+02 9.444E+02 9.432E+02 1.052E+03 9.108E+02 9.454E+02 9.561E+02 4.879E+01 5.10%
Ru106 2.017E-11 - 0.000E+00 0.000E+00 0.000E+00 5.043E-12 1.009E-11 200.00%
Rh103 7.526E+02 7.568E+02 7.544E+02 9.588E+02 7.046E+02 7.567E+02 7.806E+02 8.960E+01 11.48%
Pd107 5.731E+02 5.447E+02 5.603E+02 6.404E+02 5.777E+02 5.723E+02 5.781E+02 3.278E+01 5.67%
Ag108m 6.340E-04 2.972E-06 1.403E-06 4.135E-07 1.577E-06 4.255E-07 1.068E-04 2.583E-04 241.84%
Ag109 1.954E+02 1.308E+02 2.079E+02 2.301E+02 1.999E+02 1.964E+02 1.934E+02 3.328E+01 17.21%
Ag110m 1.598E-15 - 0.000E+00 0.000E+00 0.000E+00 3.995E-16 7.990E-16 200.00%
I127 8.451E+01 8.412E+01 8.573E+01 8.953E+01 7.567E+01 7.751E+01 8.285E+01 5.241E+00 6.33%
I129 2.564E+02 2.613E+02 2.417E+02 2.733E+02 2.482E+02 2.383E+02 2.532E+02 1.311E+01 5.18%
Xe130 1.165E+01 1.172E+01 9.895E+00 9.350E+00 1.160E+01 1.135E+01 1.093E+01 1.034E+00 9.46%
Xe131 5.018E+02 4.306E+02 5.056E+02 6.307E+02 4.796E+02 4.985E+02 5.078E+02 6.631E+01 13.06%
Xe132 1.305E+03 1.394E+03 1.326E+03 1.463E+03 1.354E+03 1.378E+03 1.370E+03 5.606E+01 4.09%
Xe134 1.526E+03 1.650E+03 1.685E+03 1.870E+03 1.648E+03 1.692E+03 1.678E+03 1.113E+02 6.63%
Xe136 2.680E+03 2.622E+03 2.760E+03 2.768E+03 2.698E+03 2.758E+03 2.714E+03 5.791E+01 2.13%
Cs133 1.233E+03 1.260E+03 1.250E+03 1.429E+03 1.223E+03 1.268E+03 1.277E+03 7.623E+01 5.97%
Cs134 1.095E-13 2.441E-42 0.000E+00 3.008E-42 1.082E-34 2.190E-14 4.897E-14 223.61%
Cs135 4.106E+02 4.523E+02 4.245E+02 7.514E+02 4.356E+02 4.308E+02 4.842E+02 1.316E+02 27.18%
Cs137 1.360E+00 1.343E+00 1.381E+00 1.535E+00 1.421E+00 1.383E+00 1.404E+00 6.934E-02 4.94%
Ba136 2.894E+01 3.495E+01 2.865E+01 5.923E+01 3.219E+01 4.839E+01 3.872E+01 1.239E+01 32.01%
Ba138 1.373E+03 1.387E+03 1.394E+03 1.539E+03 1.388E+03 1.394E+03 1.412E+03 6.248E+01 4.42%
La139 1.315E+03 1.221E+03 1.290E+03 1.431E+03 1.267E+03 1.292E+03 1.303E+03 7.050E+01 5.41%
Ce140 1.257E+03 1.269E+03 1.280E+03 1.396E+03 1.312E+03 1.272E+03 1.298E+03 5.164E+01 3.98%
Ce144 1.034E-11 - 0.000E+00 0.000E+00 0.000E+00 2.585E-12 5.170E-12 200.00%
Nd142 2.033E+01 1.883E+01 2.122E+01 1.642E+01 2.022E+01 2.091E+01 1.966E+01 1.785E+00 9.08%
Nd143 7.581E+02 8.047E+02 7.781E+02 9.752E+02 7.850E+02 7.749E+02 8.127E+02 8.105E+01 9.97%
Nd144 1.199E+03 1.167E+03 1.202E+03 1.199E+03 1.196E+03 1.203E+03 1.194E+03 1.370E+01 1.15%
Nd145 6.479E+02 6.616E+02 6.562E+02 7.332E+02 6.481E+02 6.512E+02 6.664E+02 3.316E+01 4.98%
Nd146 7.119E+02 7.145E+02 7.115E+02 7.680E+02 7.208E+02 7.168E+02 7.239E+02 2.187E+01 3.02%
Nd148 4.246E+02 4.327E+02 4.248E+02 4.655E+02 4.229E+02 4.201E+02 4.318E+02 1.705E+01 3.95%
Nd150 2.471E+02 2.495E+02 2.504E+02 2.767E+02 2.508E+02 2.508E+02 2.542E+02 1.110E+01 4.37%

NEA/NSC/R(2016)3
76
Table A.11. Results for fission products in assembly calculation at 300 years (g/tHMI) (continued)
CEA NNL KURCHATOV UNIPI GRS (KENOREST)
GRS (TRITON) AVERAGE SD RSD
Pm147 1.570E-11 6.019E-33 6.876E-33 0.000E+00 1.561E-28 3.140E-12 7.021E-12 223.61%
Sm146 1.059E-02 3.470E-07 9.040E-07 3.472E-03 1.036E-02 6.366E-03 5.132E-03 4.776E-03 93.08%
Sm147 2.632E+02 2.192E+02 2.472E+02 3.168E+02 2.474E+02 2.485E+02 2.571E+02 3.256E+01 12.67%
Sm148 1.524E+02 1.667E+02 1.593E+02 1.657E+02 1.438E+02 1.380E+02 1.543E+02 1.173E+01 7.60%
Sm149 4.350E+00 5.473E+00 2.915E+00 7.747E+00 4.975E+00 4.995E+00 5.076E+00 1.582E+00 31.16%
Sm150 3.591E+02 3.496E+02 2.704E+02 3.838E+02 3.586E+02 3.622E+02 3.473E+02 3.935E+01 11.33%
Sm151 1.492E+00 2.207E+00 1.358E+00 2.797E+00 2.049E+00 2.009E+00 1.985E+00 5.195E-01 26.17%
Sm152 1.427E+02 1.958E+02 1.379E+02 1.697E+02 1.737E+02 1.726E+02 1.654E+02 2.162E+01 13.07%
Sm154 7.299E+01 7.544E+01 6.943E+01 7.829E+01 7.334E+01 7.101E+01 7.342E+01 3.154E+00 4.30%
Eu153 1.822E+02 1.906E+02 1.841E+02 2.010E+02 1.880E+02 1.831E+02 1.882E+02 7.048E+00 3.75%
Eu154 1.321E-09 2.088E-09 1.160E-09 1.686E-09 2.176E-09 1.282E-09 1.619E-09 4.353E-10 26.89%
Eu155 5.519E-12 9.653E-18 6.979E-19 7.548E-19 1.696E-18 6.405E-19 9.198E-13 2.253E-12 244.95%
Gd154 4.575E+01 7.043E+01 4.061E+01 5.796E+01 4.189E+01 4.447E+01 5.018E+01 1.169E+01 23.29%
Gd155 1.341E+01 1.618E+01 1.391E+01 1.511E+01 1.546E+01 9.385E+00 1.391E+01 2.438E+00 17.53%
Gd156 1.539E+02 1.454E+02 1.654E+02 1.295E+02 1.587E+02 1.560E+02 1.515E+02 1.259E+01 8.31%
Ho166m 1.779E-02 2.711E-02 7.584E-04 4.266E-04 1.573E-03 6.132E-04 8.046E-03 1.155E-02 143.53%

NEA/NSC/R(2016)3
77
Table A.12. Trends of relative standard deviation versus cooling time for fission products in assembly calculation
Discharge 5 years 50 years 100 years 300 years Se79 5.77% 5.77% 5.78% 5.80% 5.84% Kr85 5.05% 5.05% 4.94% 4.87% 5.46% Rb85 3.60% 3.67% 3.82% 3.82% 3.82% Rb87 4.16% 4.16% 4.16% 4.16% 4.16% Sr88 3.59% 3.59% 3.59% 3.59% 3.59% Sr90 4.85% 4.74% 3.95% 3.74% 8.48%
Nb93m 195.47% 189.65% 90.75% 10.19% 7.90% Mo95 5.98% 6.71% 6.71% 6.71% 6.71% Mo97 6.35% 6.37% 6.37% 6.37% 6.37% Tc99 5.97% 5.99% 6.00% 6.01% 5.99%
Ru101 5.06% 5.10% 5.10% 5.10% 5.10% Ru106 7.75% 8.01% 244.94% 223.22% 223.61% Rh103 11.26% 11.52% 11.52% 11.52% 11.52% Pd107 5.51% 5.51% 5.51% 5.51% 5.51%
Ag108m 238.20% 238.30% 239.11% 239.88% 241.83% Ag109 16.56% 16.55% 16.55% 16.55% 16.55%
Ag110m 27.59% 27.73% 244.95% 223.61% 223.61% I127 6.15% 6.37% 6.37% 6.37% 6.37% I129 5.11% 5.20% 5.20% 5.20% 5.20%
Xe130 10.74% 10.76% 10.76% 10.76% 10.76% Xe131 12.87% 12.84% 12.84% 12.84% 12.84% Xe132 4.03% 4.06% 4.06% 4.06% 4.06% Xe134 6.61% 6.63% 6.63% 6.63% 6.63% Xe136 1.76% 1.76% 1.76% 1.76% 1.76% Cs133 5.86% 5.96% 5.96% 5.96% 5.96% Cs134 7.89% 7.92% 8.29% 244.95% 223.61% Cs135 27.93% 27.91% 27.91% 27.91% 27.91% Cs137 5.18% 5.18% 5.11% 5.05% 4.94% Ba136 32.92% 32.55% 32.55% 32.55% 32.55% Ba138 4.42% 4.42% 4.42% 4.42% 4.42% La139 5.45% 5.45% 5.45% 5.45% 5.45% Ce140 3.81% 3.97% 3.97% 3.97% 3.97% Ce144 7.43% 7.40% 244.95% 223.45% 223.61% Nd142 8.81% 8.78% 8.78% 8.78% 8.78% Nd143 10.02% 10.11% 10.11% 10.11% 10.11% Nd144 3.50% 0.54% 0.55% 0.55% 0.55% Nd145 4.98% 4.98% 4.98% 4.98% 4.98% Nd146 3.06% 3.05% 3.05% 3.05% 3.05% Nd148 3.95% 3.95% 3.95% 3.95% 3.95% Nd150 4.38% 4.38% 4.38% 4.38% 4.38%

NEA/NSC/R(2016)3
78
Table A.12. Trends of relative standard deviation versus cooling time for fission products in assembly calculation (continued)
Discharge 5 years 50 years 100 years 300 years Pm147 14.07% 13.89% 13.85% 149.05% 223.61% Sm146 94.30% 109.61% 122.73% 122.79% 122.79% Sm147 7.93% 12.01% 12.40% 12.40% 12.40% Sm148 7.02% 7.15% 7.15% 7.15% 7.15% Sm149 41.27% 31.30% 31.30% 31.30% 31.30% Sm150 11.33% 11.33% 11.33% 11.33% 11.33% Sm151 26.65% 26.28% 26.21% 26.15% 26.08% Sm152 13.41% 13.41% 13.42% 13.42% 13.42% Sm154 4.33% 4.33% 4.33% 4.32% 4.32% Eu153 3.74% 3.77% 3.77% 3.77% 3.77% Eu154 22.98% 22.85% 21.87% 21.23% 26.50% Eu155 16.46% 17.06% 28.08% 43.31% 244.95% Gd154 15.16% 21.85% 22.49% 22.48% 22.47% Gd155 31.58% 16.10% 16.47% 16.48% 16.48% Gd156 8.38% 8.15% 8.15% 8.15% 8.15%
Ho166m 144.06% 144.05% 144.05% 144.06% 144.06%
Table A.13. Results for activation products in assembly calculation at discharge (g/tHMI)
CEA NNL KURCHATOV UNIPI GRS (KENOREST)
GRS (TRITON) AVERAGE SD RSD
Cl36 1.682E+00 1.598E+00 1.680E+00 1.565E+00 1.551E+00 1.615E+00 6.245E-02 3.87% Ca41 2.759E-01 2.451E-01 7.950E-01 2.642E-01 2.554E-01 3.671E-01 2.395E-01 65.23% Mn53 3.382E-05 1.785E-05 N/A 4.455E-08 1.724E-05 1.690E-05 98.02% Mn54 1.060E-02 1.705E-02 1.243E-02 1.543E-02 1.433E-02 1.397E-02 2.524E-03 18.07% Fe55 1.164E-01 1.465E-01 1.470E-01 1.276E-01 1.331E-01 1.341E-01 1.301E-02 9.70% Fe60 1.353E-05 1.209E-04 N/A 1.316E-05 4.920E-05 6.210E-05 126.22% Co60 1.411E+00 1.314E+00 1.437E+00 1.605E+00 1.385E+00 1.430E+00 1.078E-01 7.54% Ni59 1.819E+00 1.780E+00 2.417E+00 1.737E+00 1.686E+00 1.888E+00 2.999E-01 15.89% Ni63 3.603E-01 3.238E-01 3.522E-01 3.378E-01 3.288E-01 3.406E-01 1.543E-02 4.53% Mo93 7.058E-02 7.557E-02 7.147E-02 0.000E+00 6.784E-02 5.709E-02 3.204E-02 56.11%

NEA/NSC/R(2016)3
79
Table A.14. Results for activation products in assembly calculation at 5 years (g/tHMI)
CEA NNL KURCHATOV UNIPI GRS (KENOREST)
GRS (TRITON) AVERAGE SD RSD
Cl36 1.682E+00 1.598E+00 1.680E+00 1.565E+00 1.551E+00 1.615E+00 6.245E-02 3.87%
Ca41 2.758E-01 2.451E-01 7.950E-01 2.642E-01 2.554E-01 3.671E-01 2.395E-01 65.23%
Mn53 3.382E-05 1.785E-05 N/A 4.455E-08 1.724E-05 1.690E-05 98.02%
Mn54 1.836E-04 2.968E-04 2.153E-04 2.676E-04 2.492E-04 2.425E-04 4.425E-05 18.25%
Fe55 3.277E-02 4.059E-02 4.131E-02 3.583E-02 3.743E-02 3.759E-02 3.507E-03 9.33%
Fe60 1.353E-05 1.209E-04 N/A 1.316E-05 4.920E-05 6.210E-05 126.22%
Co60 7.312E-01 6.802E-01 7.442E-01 8.315E-01 7.182E-01 7.411E-01 5.593E-02 7.55%
Ni59 1.819E+00 1.780E+00 2.417E+00 1.737E+00 1.686E+00 1.888E+00 2.999E-01 15.89%
Ni63 3.481E-01 3.128E-01 3.402E-01 3.263E-01 3.176E-01 3.290E-01 1.492E-02 4.53%
Mo93 7.052E-02 7.549E-02 7.140E-02 0.000E+00 6.777E-02 5.704E-02 3.200E-02 56.11%
Table A.15. Results for activation products in assembly calculation at 50 years (g/tHMI)
CEA NNL KURCHATOV UNIPI GRS (KENOREST)
GRS (TRITON) AVERAGE SD RSD
Cl36 1.681E+00 1.598E+00 1.679E+00 1.565E+00 1.551E+00 1.615E+00 6.192E-02 3.83%
Ca41 2.758E-01 2.450E-01 7.950E-01 2.641E-01 2.554E-01 3.671E-01 2.395E-01 65.25%
Mn53 3.382E-05 1.785E-05 N/A 4.455E-08 1.724E-05 1.690E-05 98.02%
Mn54 2.585E-20 4.348E-20 3.016E-20 3.774E-20 3.623E-20 3.469E-20 6.848E-21 19.74%
Fe55 3.652E-07 3.899E-07 4.507E-07 3.908E-07 4.116E-07 4.016E-07 3.197E-08 7.96%
Fe60 1.353E-05 1.209E-04 N/A 1.316E-05 4.920E-05 6.210E-05 126.22%
Co60 1.968E-03 1.823E-03 2.003E-03 2.235E-03 1.943E-03 1.994E-03 1.506E-04 7.55%
Ni59 1.818E+00 1.779E+00 2.416E+00 1.736E+00 1.685E+00 1.887E+00 2.999E-01 15.90%
Ni63 2.553E-01 2.290E-01 2.491E-01 2.389E-01 2.325E-01 2.410E-01 1.108E-02 4.60%
Mo93 6.997E-02 7.482E-02 7.075E-02 0.000E+00 6.717E-02 5.654E-02 3.173E-02 56.11%

NEA/NSC/R(2016)3
80
Table A.16. Results for activation products in assembly calculation at 100 years (g/tHMI)
CEA NNL KURCHATOV UNIPI GRS (KENOREST)
GRS (TRITON) AVERAGE SD RSD
Cl36 1.681E+00 1.598E+00 1.679E+00 1.565E+00 1.551E+00 1.615E+00 6.192E-02 3.83%
Ca41 2.757E-01 2.450E-01 7.943E-01 2.640E-01 2.553E-01 3.669E-01 2.392E-01 65.21%
Mn53 3.382E-05 1.785E-05 N/A 4.455E-08 1.724E-05 1.690E-05 98.02%
Mn54 6.305E-38 1.109E-37 7.116E-38 0.000E+00 0.000E+00 4.902E-38 4.828E-38 98.48%
Fe55 1.146E-12 1.037E-12 1.382E-12 1.198E-12 1.273E-12 1.207E-12 1.301E-13 10.78%
Fe60 1.353E-05 1.209E-04 N/A 1.316E-05 4.920E-05 6.210E-05 126.22%
Co60 2.745E-06 2.530E-06 2.794E-06 3.112E-06 2.725E-06 2.781E-06 2.105E-07 7.57%
Ni59 1.818E+00 1.778E+00 2.415E+00 1.736E+00 1.684E+00 1.886E+00 2.998E-01 15.89%
Ni63 1.809E-01 1.619E-01 1.762E-01 1.691E-01 1.645E-01 1.705E-01 7.946E-03 4.66%
Mo93 6.937E-02 7.409E-02 7.007E-02 0.000E+00 6.651E-02 5.601E-02 3.143E-02 56.11%
Table A.17. Results for activation products in assembly calculation at 300 years (g/tHMI)
CEA NNL KURCHATOV UNIPI GRS (KENOREST)
GRS (TRITON) AVERAGE SD RSD
Cl36 1.680E+00 1.597E+00 1.679E+00 1.564E+00 1.550E+00 1.614E+00 6.218E-02 3.85%
Ca41 2.753E-01 2.446E-01 7.935E-01 2.636E-01 2.549E-01 3.664E-01 2.390E-01 65.24%
Mn53 3.381E-05 1.784E-05 N/A 4.455E-08 1.723E-05 1.689E-05 98.02%
Mn54 0.000E+00 0.000E+00 0.000E+00 0.000E+00 0.000E+00 - - -
Fe55 1.112E-34 5.196E-35 1.222E-34 0.000E+00 0.000E+00 5.707E-35 5.855E-35 102.59%
Fe60 1.353E-05 1.209E-04 N/A 1.316E-05 4.920E-05 6.210E-05 126.22%
Co60 4.742E-11 8.483E-11 1.057E-17 1.170E-17 4.625E-11 3.570E-11 3.610E-11 101.11%
Ni59 1.814E+00 1.775E+00 2.410E+00 1.732E+00 1.681E+00 1.882E+00 2.991E-01 15.89%
Ni63 4.559E-02 4.049E-02 4.410E-02 4.231E-02 4.115E-02 4.273E-02 2.106E-03 4.93%
Mo93 6.701E-02 7.121E-02 6.734E-02 0.000E+00 6.393E-02 5.390E-02 3.024E-02 56.11%

NEA/NSC/R(2016)3
81
Table A.18. Trends of relative standard deviation versus cooling time for activation products in assembly calculation
Discharge 5 years 50 years 100 years 300 years
Cl36 3.87% 3.87% 3.83% 3.83% 3.85% Ca41 65.23% 65.23% 65.25% 65.21% 65.24% Mn53 98.02% 98.02% 98.02% 98.02% 98.02% Mn54 18.07% 18.25% 19.74% 98.48% - Fe55 9.70% 9.33% 7.96% 10.78% 102.59% Fe60 126.22% 126.22% 126.22% 126.22% 126.22% Co60 7.54% 7.55% 7.55% 7.57% 101.11% Ni59 15.89% 15.89% 15.90% 15.89% 15.89% Ni63 4.53% 4.53% 4.60% 4.66% 4.93% Mo93 56.11% 56.11% 56.11% 56.11% 56.11%
Table A.19. Results for activation-fission products in assembly calculation at discharge (g/tHMI)
CEA NNL KURCHATOV UNIPI GRS (KENOREST)
GRS (TRITON) AVERAGE SD RSD
H3 FP 6.217E-02 6.350E-02 1.415E-01 7.441E-02 8.540E-02 3.780E-02 44.27% AP 7.249E-02 8.894E-08 4.375E-10 8.361E-07 1.812E-02 3.624E-02 200.00%
FP + AP 1.347E-01 6.350E-02 1.415E-01 7.441E-02 7.303E-02 7.577E-02 9.382E-02 3.464E-02 36.92%
Be10 FP 1.106E-02 1.132E-02 1.613E-02 1.137E-02 1.247E-02 2.444E-03 19.60% AP 1.127E-02 2.799E-08 1.814E-06 1.061E-04 2.844E-03 5.617E-03 197.48%
FP + AP 2.234E-02 1.132E-02 1.613E-02 1.148E-02 1.652E-04 1.140E-02 1.214E-02 7.280E-03 59.97%
C14 FP 4.441E-03 4.485E-03 8.210E-02 4.836E-02 3.485E-02 3.769E-02 108.16% AP 1.075E-01 8.678E-02 1.203E-01 9.084E-02 1.014E-01 1.549E-02 15.28%
FP + AP 1.119E-01 9.127E-02 2.024E-01 1.392E-01 1.154E-01 4.856E-02 1.181E-01 5.129E-02 43.42%
Zr93 FP 5.757E+02 5.778E+02 5.585E+02 5.612E+02 5.683E+02 9.857E+00 1.73% AP 5.796E+02 2.338E-02 2.340E-02 0.000E+00 1.449E+02 2.898E+02 199.98%
FP + AP 1.155E+03 5.778E+02 5.585E+02 5.612E+02 5.829E+02 5.606E+02 6.660E+02 2.398E+02 36.00%
Nb94 FP 2.293E-03 9.417E-04 1.135E-03 1.685E+00 4.223E-01 8.418E-01 199.31% AP 1.383E+00 1.351E+00 1.492E+00 0.000E+00 1.057E+00 7.069E-01 66.91%
FP + AP 1.385E+00 1.352E+00 1.493E+00 1.685E+00 1.302E+00 1.325E+00 1.424E+00 1.444E-01 10.14%
Sn119m FP 1.183E+00 1.061E-02 1.451E-01 1.699E+01 4.582E+00 8.288E+00 180.88% AP 1.057E+00 6.102E-03 8.971E-02 0.000E+00 2.882E-01 5.142E-01 178.40%
FP + AP 2.240E+00 1.671E-02 2.348E-01 1.699E+01 4.662E-02 1.625E-01 3.282E+00 6.770E+00 206.28%
Sn121m FP 9.537E-01 9.222E-01 6.031E-02 1.168E-02 4.870E-01 5.213E-01 107.05% AP 9.197E-01 4.405E-04 4.652E-04 0.000E+00 2.302E-01 4.597E-01 199.74%
FP + AP 1.873E+00 9.226E-01 6.077E-02 1.168E-02 1.119E-02 4.300E-01 5.515E-01 7.380E-01 133.80%

NEA/NSC/R(2016)3
82
Table A.19. Results for activation-fission products in assembly calculation at discharge (g/tHMI) (continued)
CEA NNL KURCHATOV UNIPI GRS (KENOREST)
GRS (TRITON) AVERAGE SD RSD
Sn126 FP 5.222E+01 6.030E+01 3.849E+01 3.168E+01 4.567E+01 1.296E+01 28.39% AP 5.257E+01 5.173E-06 1.441E-05 N/A 1.752E+01 3.035E+01 173.20%
FP + AP 1.048E+02 6.030E+01 3.849E+01 3.168E+01 4.029E+01 3.160E+01 5.119E+01 2.829E+01 55.26%
Sb125 FP 2.014E+01 2.985E+01 1.331E+01 1.307E+01 1.909E+01 7.885E+00 41.30% AP 1.955E+01 2.622E-02 3.959E-02 0.000E+00 4.904E+00 9.764E+00 199.11%
FP + AP 3.969E+01 2.988E+01 1.335E+01 1.307E+01 1.275E+01 1.297E+01 2.029E+01 1.165E+01 57.45%
Table A.20. Results for activation-fission products in assembly calculation at 5 years (g/tHMI)
CEA NNL KURCHATOV UNIPI GRS
(KENOREST) GRS
(TRITON) AVERAGE SD RSD
H3 FP 4.694E-02 4.794E-02 1.068E-01 5.618E-02 6.447E-02 2.853E-02 44.25% AP 5.473E-02 6.714E-08 3.304E-10 6.312E-07 1.368E-02 2.736E-02 200.00%
FP + AP 1.017E-01 4.794E-02 1.068E-01 5.618E-02 5.514E-02 5.720E-02 7.083E-02 2.614E-02 36.91%
Be10 FP 1.106E-02 1.132E-02 1.613E-02 1.137E-02 1.247E-02 2.444E-03 19.60% AP 1.127E-02 2.799E-08 1.814E-06 1.061E-04 2.844E-03 5.617E-03 197.48%
FP + AP 2.234E-02 1.132E-02 1.613E-02 1.148E-02 1.652E-04 1.140E-02 1.214E-02 7.280E-03 59.97%
C14 FP 4.439E-03 4.482E-03 8.205E-02 4.833E-02 3.483E-02 3.767E-02 108.16% AP 1.074E-01 8.672E-02 1.202E-01 9.079E-02 1.013E-01 1.546E-02 15.27%
FP + AP 1.118E-01 9.120E-02 2.023E-01 1.391E-01 1.153E-01 4.851E-02 1.180E-01 5.127E-02 43.44%
Zr93 FP 5.761E+02 5.783E+02 5.589E+02 5.615E+02 5.687E+02 9.913E+00 1.74% AP 5.799E+02 2.338E-02 2.340E-02 0.000E+00 1.450E+02 2.899E+02 199.98%
FP + AP 1.156E+03 5.783E+02 5.589E+02 5.615E+02 5.834E+02 5.611E+02 6.665E+02 2.400E+02 36.01%
Nb94 FP 2.292E-03 9.415E-04 1.135E-03 1.685E+00 4.223E-01 8.418E-01 199.31% AP 1.382E+00 1.351E+00 1.491E+00 0.000E+00 1.056E+00 7.066E-01 66.91%
FP + AP 1.385E+00 1.352E+00 1.493E+00 1.685E+00 1.302E+00 1.325E+00 1.424E+00 1.444E-01 10.14%
Sn119m FP 1.573E-02 1.411E-04 1.932E-03 1.714E+01 4.289E+00 8.567E+00 199.72% AP 1.406E-02 8.110E-05 1.194E-03 0.000E+00 3.834E-03 6.839E-03 178.39%
FP + AP 2.978E-02 2.222E-04 3.126E-03 1.714E+01 6.216E-04 2.160E-03 2.863E+00 6.994E+00 244.33%
Sn121m FP 8.954E-01 8.604E-01 5.662E-02 1.770E-05 4.531E-01 4.913E-01 108.42% AP 8.635E-01 4.110E-04 4.367E-04 0.000E+00 2.161E-01 4.316E-01 199.74%
FP + AP 1.759E+00 8.608E-01 5.706E-02 1.770E-05 1.051E-02 4.039E-01 5.152E-01 6.941E-01 134.72%
Sn126 FP 5.221E+01 6.029E+01 3.849E+01 3.168E+01 4.567E+01 1.296E+01 28.38% AP 5.257E+01 5.173E-06 1.441E-05 N/A 1.752E+01 3.035E+01 173.20%
FP + AP 1.048E+02 6.029E+01 3.849E+01 3.168E+01 4.029E+01 3.160E+01 5.119E+01 2.829E+01 55.26%
Sb125 FP 5.790E+00 8.521E+00 3.790E+00 3.710E+00 5.453E+00 2.261E+00 41.46% AP 5.607E+00 7.462E-03 1.140E-02 0.000E+00 1.406E+00 2.800E+00 199.11%
FP + AP 1.140E+01 8.528E+00 3.801E+00 3.710E+00 3.695E+00 3.682E+00 5.803E+00 3.349E+00 57.72%

NEA/NSC/R(2016)3
83
Table A.21. Results for activation-fission products in assembly calculation at 50 years (g/tHMI)
CEA NNL KURCHATOV UNIPI GRS (KENOREST) GRS (TRITON) AVERAGE SD RSD
H3
FP 3.740E-03 3.819E-03 8.514E-03 4.476E-03 5.137E-03 2.275E-03 44.29% AP 4.361E-03 5.349E-09 2.632E-11 5.030E-08 1.090E-03 2.180E-03 200.00%
FP + AP 8.101E-03 3.819E-03 8.514E-03 4.476E-03 4.392E-03 4.558E-03 5.643E-03 2.084E-03 36.93%
Be10
FP 1.106E-02 1.132E-02 1.613E-02 1.137E-02 1.247E-02 2.444E-03 19.60% AP 1.127E-02 2.799E-08 1.814E-06 1.061E-04 2.844E-03 5.617E-03 197.48%
FP + AP 2.234E-02 1.132E-02 1.613E-02 1.148E-02 1.652E-04 1.140E-02 1.214E-02 7.280E-03 59.97%
C14
FP 4.414E-03 4.458E-03 8.160E-02 4.807E-02 3.464E-02 3.746E-02 108.16% AP 1.068E-01 8.625E-02 1.196E-01 9.029E-02 1.007E-01 1.540E-02 15.29%
FP + AP 1.112E-01 9.071E-02 2.012E-01 1.384E-01 1.147E-01 4.826E-02 1.174E-01 5.099E-02 43.43%
Zr93
FP 5.761E+02 5.783E+02 5.589E+02 5.615E+02 5.687E+02 9.913E+00 1.74% AP 5.799E+02 2.337E-02 2.340E-02 0.000E+00 1.450E+02 2.899E+02 199.98%
FP + AP 1.156E+03 5.783E+02 5.589E+02 5.615E+02 5.833E+02 5.611E+02 6.665E+02 2.400E+02 36.01%
Nb94
FP 2.289E-03 9.401E-04 1.133E-03 1.683E+00 4.218E-01 8.408E-01 199.31% AP 1.380E+00 1.349E+00 1.489E+00 0.000E+00 1.055E+00 7.056E-01 66.91%
FP + AP 1.382E+00 1.350E+00 1.490E+00 1.683E+00 1.300E+00 1.323E+00 1.421E+00 1.444E-01 10.16%
Sn119m
FP 3.663E-10 1.825E-21 2.540E-20 1.714E+01 4.285E+00 8.570E+00 200.00% AP 1.826E-19 1.049E-21 1.570E-20 0.000E+00 4.984E-20 8.880E-20 178.18%
FP + AP 3.663E-10 2.874E-21 4.110E-20 1.714E+01 8.284E-21 2.803E-20 2.857E+00 6.997E+00 244.95%
Sn121m
FP 5.079E-01 4.611E-01 3.211E-02 1.004E-05 2.503E-01 2.714E-01 108.46% AP 4.898E-01 2.203E-04 2.478E-04 0.000E+00 1.226E-01 2.448E-01 199.75%
FP + AP 9.976E-01 4.613E-01 3.236E-02 1.004E-05 5.961E-03 2.290E-01 2.877E-01 3.911E-01 135.95%
Sn126
FP 5.221E+01 6.027E+01 3.846E+01 3.167E+01 4.565E+01 1.296E+01 28.39% AP 5.256E+01 5.171E-06 1.440E-05 N/A 1.752E+01 3.035E+01 173.20%
FP + AP 1.048E+02 6.027E+01 3.846E+01 3.167E+01 4.028E+01 3.158E+01 5.118E+01 2.830E+01 55.29%
Sb125
FP 7.114E-05 9.219E-05 4.135E-05 4.049E-05 6.129E-05 2.505E-05 40.86% AP 6.887E-05 8.073E-08 1.245E-07 0.000E+00 1.727E-05 3.440E-05 199.21%
FP + AP 1.400E-04 9.227E-05 4.148E-05 4.049E-05 4.792E-05 4.017E-05 6.706E-05 4.100E-05 61.15%

NEA/NSC/R(2016)3
84
Table A.22. Results for activation-fission products in assembly calculation at 100 years (g/tHMI)
CEA NNL KURCHATOV UNIPI GRS (KENOREST)
GRS (TRITON) AVERAGE SD RSD
H3 FP 2.250E-04 2.297E-04 5.121E-04 2.693E-04 3.090E-04 1.368E-04 44.28% AP 2.624E-04 3.217E-10 1.583E-12 3.026E-09 6.560E-05 1.312E-04 200.00%
FP + AP 4.874E-04 2.297E-04 5.121E-04 2.693E-04 2.641E-04 2.741E-04 3.395E-04 1.254E-04 36.94%
Be10 FP 1.106E-02 1.132E-02 1.613E-02 1.137E-02 1.247E-02 2.444E-03 19.60% AP 1.127E-02 2.799E-08 1.814E-06 1.061E-04 2.844E-03 5.617E-03 197.48%
FP + AP 2.234E-02 1.132E-02 1.613E-02 1.148E-02 1.652E-04 1.140E-02 1.214E-02 7.280E-03 59.97%
C14 FP 4.388E-03 4.431E-03 8.110E-02 4.778E-02 3.442E-02 3.723E-02 108.16% AP 1.062E-01 8.573E-02 1.189E-01 8.974E-02 1.001E-01 1.532E-02 15.30%
FP + AP 1.106E-01 9.016E-02 2.000E-01 1.375E-01 1.140E-01 4.797E-02 1.167E-01 5.068E-02 43.43%
Zr93 FP 5.761E+02 5.782E+02 5.589E+02 5.615E+02 5.687E+02 9.881E+00 1.74% AP 5.799E+02 2.337E-02 2.340E-02 0.000E+00 1.450E+02 2.899E+02 199.98%
FP + AP 1.156E+03 5.782E+02 5.589E+02 5.615E+02 5.833E+02 5.611E+02 6.665E+02 2.400E+02 36.01%
Nb94 FP 2.285E-03 9.385E-04 1.131E-03 1.680E+00 4.211E-01 8.393E-01 199.31% AP 1.378E+00 1.347E+00 1.487E+00 0.000E+00 1.053E+00 7.046E-01 66.91%
FP + AP 1.380E+00 1.348E+00 1.488E+00 1.680E+00 1.298E+00 1.321E+00 1.419E+00 1.440E-01 10.15%
Sn119m FP 5.348E-11 3.138E-40 0.000E+00 1.714E+01 4.285E+00 8.570E+00 200.00% AP 3.154E-38 1.804E-40 0.000E+00 0.000E+00 7.930E-39 1.574E-38 198.49%
FP + AP 5.348E-11 4.942E-40 0.000E+00 1.714E+01 1.665E-08 3.428E+00 7.665E+00 223.61%
Sn121m FP 2.705E-01 2.305E-01 1.710E-02 5.346E-06 1.295E-01 1.408E-01 108.71% AP 2.608E-01 1.101E-04 1.320E-04 0.000E+00 6.526E-02 1.304E-01 199.75%
FP + AP 5.313E-01 2.306E-01 1.723E-02 5.346E-06 3.176E-03 1.220E-01 1.507E-01 2.071E-01 137.38%
Sn126 FP 5.220E+01 6.025E+01 3.846E+01 3.165E+01 4.564E+01 1.296E+01 28.39% AP 5.256E+01 5.169E-06 1.440E-05 N/A 1.752E+01 3.035E+01 173.20%
FP + AP 1.048E+02 6.025E+01 3.846E+01 3.165E+01 4.028E+01 3.158E+01 5.117E+01 2.830E+01 55.30%
Sb125 FP 1.410E-09 2.800E-10 1.268E-10 1.241E-10 4.852E-10 6.208E-10 127.94% AP 2.409E-10 2.452E-13 3.816E-13 0.000E+00 6.038E-11 1.203E-10 199.31%
FP + AP 1.651E-09 2.802E-10 1.272E-10 1.241E-10 1.780E-10 2.617E-07 4.401E-08 1.066E-07 242.33%

NEA/NSC/R(2016)3
85
Table A.23. Results for activation-fission products in assembly calculation at 300 years (g/tHMI)
CEA NNL KURCHATOV UNIPI GRS (KENOREST)
GRS (TRITON) AVERAGE SD RSD
H3 FP 2.947E-09 3.006E-09 6.703E-09 3.524E-09 4.045E-09 1.791E-09 44.27% AP 3.436E-09 4.209E-15 2.073E-17 3.961E-14 8.590E-10 1.718E-09 200.00%
FP + AP 6.383E-09 3.006E-09 6.703E-09 3.524E-09 3.452E-09 3.590E-09 4.443E-09 1.643E-09 36.97%
Be10 FP 1.106E-02 1.131E-02 1.613E-02 1.137E-02 1.247E-02 2.445E-03 19.61% AP 1.127E-02 2.799E-08 1.814E-06 1.061E-04 2.844E-03 5.617E-03 197.48%
FP + AP 2.233E-02 1.131E-02 1.613E-02 1.148E-02 1.652E-04 1.140E-02 1.214E-02 7.278E-03 59.97%
C14 FP 4.282E-03 4.325E-03 7.918E-02 4.664E-02 3.361E-02 3.635E-02 108.17% AP 1.036E-01 8.368E-02 1.160E-01 8.760E-02 9.772E-02 1.493E-02 15.27%
FP + AP 1.079E-01 8.801E-02 1.952E-01 1.342E-01 1.113E-01 4.682E-02 1.139E-01 4.947E-02 43.43%
Zr93 FP 5.760E+02 5.782E+02 5.589E+02 5.615E+02 5.687E+02 9.856E+00 1.73% AP 5.798E+02 2.337E-02 2.340E-02 0.000E+00 1.450E+02 2.899E+02 199.98%
FP + AP 1.156E+03 5.782E+02 5.589E+02 5.615E+02 5.833E+02 5.611E+02 6.665E+02 2.400E+02 36.01%
Nb94 FP 2.269E-03 9.321E-04 1.123E-03 1.668E+00 4.181E-01 8.333E-01 199.31% AP 1.368E+00 1.338E+00 1.476E+00 0.000E+00 1.046E+00 6.995E-01 66.91%
FP + AP 1.371E+00 1.339E+00 1.478E+00 1.668E+00 1.289E+00 1.312E+00 1.410E+00 1.428E-01 10.13%
Sn119m FP 5.213E-14 - 0.000E+00 1.714E+01 5.713E+00 9.896E+00 173.21% AP 0.000E+00 - 0.000E+00 0.000E+00 0.000E+00 0.000E+00 -
FP + AP 5.213E-14 - 0.000E+00 1.714E+01 0.000E+00 4.285E+00 8.570E+00 200.00%
Sn121m FP 2.175E-02 1.440E-02 1.376E-03 4.299E-07 9.382E-03 1.049E-02 111.84% AP 2.097E-02 6.881E-06 1.061E-05 0.000E+00 5.247E-03 1.048E-02 199.78%
FP + AP 4.272E-02 1.441E-02 1.387E-03 4.299E-07 2.558E-04 9.807E-03 1.143E-02 1.641E-02 143.60%
Sn126 FP 5.217E+01 6.017E+01 3.842E+01 3.161E+01 4.559E+01 1.295E+01 28.39% AP 5.252E+01 5.162E-06 1.438E-05 N/A 1.751E+01 3.032E+01 173.20%
FP + AP 1.047E+02 6.017E+01 3.842E+01 3.161E+01 4.025E+01 3.153E+01 5.111E+01 2.827E+01 55.31%
Sb125 FP 1.098E-12 2.381E-32 1.121E-32 0.000E+00 2.745E-13 5.490E-13 200.00% AP 3.602E-32 2.085E-35 3.374E-35 0.000E+00 9.019E-33 1.800E-32 199.60%
FP + AP 1.098E-12 2.383E-32 1.125E-32 0.000E+00 4.874E-29 2.196E-13 4.910E-13 223.61%

NEA/NSC/R(2016)3
86
Table A.24. Trends of relative standard deviation versus cooling time for activation-fission products in assembly calculation
Discharge 5 years 50 years 100 years 300 years
H3 FP + AP 36.92% 36.91% 36.93% 36.94% 36.97% Be10 FP + AP 59.97% 59.97% 59.97% 59.97% 59.97% C14 FP + AP 43.42% 43.44% 43.43% 43.43% 43.43% Zr93 FP + AP 36.00% 36.01% 36.01% 36.01% 36.01% Nb94 FP + AP 10.14% 10.14% 10.16% 10.15% 10.13%
Sn119m FP + AP 206.28% 244.33% 244.95% 223.61% 200.00% Sn121m FP + AP 133.80% 134.72% 135.95% 137.38% 143.60% Sn126 FP + AP 55.26% 55.26% 55.29% 55.30% 55.31% Sb125 FP + AP 57.45% 57.72% 61.15% 242.33% 223.61%
Table A.25. Results for decay heat in assembly calculation at discharge (W/tHMI)
CEA NNL KURCHATOV UNIPI GRS (KENOREST)
GRS (TRITON) AVERAGE SD RSD
Alpha Decay 1.493E+04 3.986E+04 1.460E+04 N/A 2.362E+04 2.326E+04 1.185E+04 50.95% Beta Decay 1.504E+06 1.466E+06 1.374E+06 N/A 1.718E+06 1.517E+06 1.452E+05 9.57%
Gamma Decay 1.255E+06 1.313E+06 1.338E+06 1.755E+06 1.451E+06 1.4223E+06 1.991E+05 14.00%
Total Decay Heat 2.774E+06 2.818E+06 2.726E+06 3.624E+06 3.383E+06 3.065E+06 4.103E+05 13.38%
Table A.26. Results for decay heat in assembly calculation at 5 years (W/tHMI)
CEA NNL KURCHATOV UNIPI GRS (KENOREST)
GRS (TRITON) AVERAGE SD RSD
Alpha Decay 1.517E+03 1.334E+03 1.476E+03 N/A 1.732E+03 1.515E+03 1.647E+02 10.87% Beta Decay 9.275E+02 9.284E+02 9.543E+02 N/A 9.547E+02 9.412E+02 1.533E+01 1.63%
Gamma Decay 8.545E+02 8.598E+02 8.848E+02 8.984E+02 9.685E+02 8.932E+02 4.577E+01 5.12% Total Decay
Heat 3.299E+03 3.122E+03 3.315E+03 3.593E+03 4.111E+03 3.488E+03 3.869E+02 11.09%

NEA/NSC/R(2016)3
87
Table A.27. Results for decay heat in assembly calculation at 50 years (W/tHMI)
CEA NNL KURCHATOV UNIPI GRS (KENOREST)
GRS (TRITON) AVERAGE SD RSD
Alpha Decay 8.006E+02 7.677E+02 7.946E+02 N/A 1.201E+03 8.910E+02 2.072E+02 23.25% Beta Decay 1.409E+02 1.436E+02 1.427E+02 N/A 1.289E+02 1.390E+02 6.843E+00 4.92%
Gamma Decay 1.304E+02 1.307E+02 1.335E+02 1.346E+02 1.499E+02 1.358E+02 8.073E+00 5.94% Total Decay
Heat 1.072E+03 1.042E+03 1.071E+03 1.256E+03 1.758E+03 1.240E+03 3.019E+02 24.35%
Table A.28. Results for decay heat in assembly calculation at 100 years (W/tHMI)
CEA NNL KURCHATOV UNIPI GRS (KENOREST)
GRS (TRITON) AVERAGE SD RSD
Alpha Decay 5.777E+02 5.718E+02 5.764E+02 N/A 9.518E+02 6.694E+02 1.883E+02 28.12% Beta Decay 4.489E+01 4.598E+01 4.285E+01 N/A 3.906E+01 4.320E+01 3.047E+00 7.05%
Gamma Decay 4.206E+01 4.191E+01 4.309E+01 4.359E+01 4.982E+01 4.409E+01 3.277E+00 7.43%
Total Decay Heat 6.646E+02 6.597E+02 6.624E+02 8.047E+
02 1.255E+03 8.093E+02 2.567E+02 31.72%
Table A.29. Result for decay heat in assembly calculation at 300 years (W/tHMI)
CEA NNL KURCHATOV UNIPI GRS (KENOREST)
GRS (TRITON) AVERAGE SD RSD
Alpha Decay 3.496E+02 3.485E+02 3.492E+02 N/A 5.928E+02 4.100E+02 1.219E+02 29.72% Beta Decay 2.650E+00 2.659E+00 6.091E-01 N/A 6.544E-01 1.643E+00 1.168E+00 71.08%
Gamma Decay 1.928E+00 1.952E+00 1.990E+00 2.297E+00 3.555E+00 2.344E+00 6.930E-01 29.56% Total Decay
Heat 3.542E+02 3.531E+02 3.518E+02 4.300E+02 7.247E+02 4.428E+02 1.611E+02 36.38%
Table A.30. Trends of relative standard deviation versus cooling time for decay heat in assembly calculation
Discharge 5 years 50 years 100 years 300 years
Alpha decay 50.95% 10.87% 23.25% 28.12% 29.72% Beta decay 9.57% 1.63% 4.92% 7.05% 71.08%
Gamma decay 14.00% 5.12% 5.94% 7.43% 29.56% Total decay
heat 13.38% 11.09% 24.35% 31.72% 36.38%

NEA/NSC/R(2016)3
88
Table A.31. Results for neutron emission rate in assembly calculation at discharge (n/s/tHMI)
CEA NNL KURCHATOV UNIPI GRS (KENOREST)
GRS (TRITON) AVERAGE SD RSD
(α,n) emission rate 5.034E+08 4.800E+08 4.843E+08 4.83E+08 9.906E+08 5.8815E+08 2.252E+08 38.28% Spontaneous fission rate 7.221E+09 6.340E+09 7.223E+09 7.65E+09 1.001E+10 7.6889E+09 1.382E+09 17.98%
Total emision rate 7.724E+09 6.820E+09 7.708E+09 8.13E+09 1.100E+10 8.2770E+09 1.596E+09 19.28%
Table A.32. Results for neutron emission rate in assembly calculation at 5 years (n/s/tHMI)
CEA NNL KURCHATOV UNIPI GRS (KENOREST)
GRS (TRITON) AVERAGE SD RSD
(α,n) emission rate 4.425E+07 3.567E+07 4.264E+07 4.720E+07 5.793E+07 4.554E+07 8.120E+06 17.83% Spontaneous fission rate 4.248E+09 3.444E+09 4.141E+09 4.558E+09 4.379E+09 4.154E+09 4.263E+08 10.26%
Total emision rate 4.292E+09 3.480E+09 4.184E+09 4.562E+09 4.437E+09 4.191E+09 4.225E+08 10.29%
Table A.33. Results for neutron emission rate in assembly calculation at 50 years (n/s/tHMI)
CEA NNL KURCHATOV UNIPI GRS (KENOREST)
GRS (TRITON) AVERAGE SD RSD
(α,n) emission rate 2.177E+07 1.908E+07 2.123E+07 2.454E+07 3.828E+07 2.498E+07 7.685E+06 30.77%
Spontaneous fission rate 7.972E+08 6.548E+08 7.841E+08 8.714E+08 8.230E+08 7.861E+08 8.063E+07 10.26%
Total emision rate 8.190E+08 6.739E+08 8.053E+08 8.96E+08 8.612E+08 8.1106E+08 8.460E+07 10.43%
Table A.34. Results for neutron emission rate in assembly calculation at 100 years (n/s/tHMI)
CEA NNL KURCHATOV UNIPI GRS (KENOREST)
GRS (TRITON) AVERAGE SD RSD
(α,n) emission rate 1.522E+07 1.379E+07 1.487E+07 1.742E+07 2.983E+07 1.823E+07 6.620E+06 36.32%
Spontaneous fission rate 1.651E+08 1.385E+08 1.643E+08 1.929E+08 1.633E+08 1.648E+08 1.926E+07 11.69%
Total emision rate 1.804E+08 1.523E+08 1.792E+08 2.10E+08 1.931E+08 1.8305E+08 2.129E+07 11.63%

NEA/NSC/R(2016)3
89
Table A.35. Results for neutron emission rate in assembly calculation at 300 years (n/s/tHMI)
CEA NNL KURCHATOV UNIPI GRS (KENOREST)
GRS (TRITON) AVERAGE SD RSD
(α,n) emission rate 9.0459E+06 8.258E+06 8.832E+06 1.01E+07 1.829E+07 1.0913E+07 4.180E+06 38.30%
Spontaneous fission rate 5.5432E+07 4.770E+07 5.540E+07 7.33E+07 4.707E+07 5.5778E+07 1.058E+07 18.97%
Total emision rate 6.4478E+07 5.596E+07 6.423E+07 8.34E+07 6.535E+07 6.6690E+07 1.010E+07 15.15%
Table A.36. Trends of relative standard deviation versus cooling time for neutron emission rate
Discharge 5 years 50 years 100 years 300 years
(α,n) emission rate 38.28% 17.83% 30.77% 36.32% 38.30% Spontaneous fission
rate 17.98% 10.26% 10.26% 11.69% 18.97%
Total emision rate 19.28% 10.29% 10.43% 11.63% 15.15%

NEA/NSC/R(2016)3
90
Appendix B: Tables providing detailed results of L14 fuel
Table B.1. Results for actinides in assembly calculation (g/tHMI)
CEA MASSES OF ACTINIDES (g/tHM)
Nuclide Discharge 5 years 50 years 100 years 300 years U232 8.7215E-05 3.7136E-04 3.2138E-04 1.9561E-04 2.6854E-05 U233 4.0334E-04 6.1867E-04 4.7445E-03 1.6314E-02 1.3424E-01 U234 2.1956E+01 5.7566E+01 3.2924E+02 5.3748E+02 8.8140E+02 U235 1.1033E+03 1.1055E+03 1.1254E+03 1.1475E+03 1.2356E+03 U236 2.5427E+02 2.6101E+02 3.2238E+02 3.9087E+02 6.6169E+02 U238 9.1878E+05 9.1878E+05 9.1878E+05 9.1878E+05 9.1878E+05
Np236 1.8974E-04 1.8974E-04 1.8970E-04 1.8965E-04 1.8948E-04 Np237 1.2928E+02 1.4139E+02 4.8207E+02 9.7342E+02 2.6459E+03 Pu236 4.2776E-04 1.2789E-04 2.7497E-09 4.2081E-10 4.2041E-10 Pu238 7.7264E+02 9.2207E+02 6.4796E+02 4.3799E+02 9.2034E+01 Pu239 1.5559E+04 1.5649E+04 1.5636E+04 1.5619E+04 1.5545E+04 Pu240 1.2944E+04 1.3003E+04 1.3194E+04 1.3171E+04 1.2903E+04 Pu241 6.5693E+03 5.1581E+03 5.8509E+02 5.2154E+01 5.4874E-02 Pu242 3.2395E+03 3.2397E+03 3.2399E+03 3.2400E+03 3.2397E+03 Pu243 6.3596E-01 1.2127E-12 1.2127E-12 1.2127E-12 1.2127E-12 Pu244 2.6444E-01 2.6446E-01 2.6446E-01 2.6446E-01 2.6446E-01 Am241 4.9701E+02 1.8984E+03 6.1250E+03 6.1584E+03 4.5101E+03
Am242m 1.3543E+01 1.3214E+01 1.0592E+01 8.2838E+00 3.0992E+00 Am243 8.2068E+02 8.2093E+02 8.1747E+02 8.1364E+02 7.9847E+02 Cm242 1.8739E+02 1.1427E-01 2.7839E-02 2.1773E-02 8.1457E-03 Cm243 6.9310E+00 6.1749E+00 2.1832E+00 6.8768E-01 6.7696E-03 Cm244 3.7934E+02 3.1297E+02 5.5327E+01 8.0679E+00 3.6480E-03 Cm245 3.1831E+01 3.1818E+01 3.1701E+01 3.1572E+01 3.1062E+01 Cm246 2.3437E+00 2.3419E+00 2.3266E+00 2.3096E+00 2.2429E+00 Cm247 3.4886E-02 3.4886E-02 3.4886E-02 3.4886E-02 3.4886E-02 Cm248 1.8301E-03 1.8305E-03 1.8305E-03 1.8303E-03 1.8295E-03 Ra226 1.3391E-09 1.6890E-08 4.2208E-06 2.8253E-05 5.1564E-04 Ra228 5.1808E-16 6.0366E-15 1.4140E-13 3.4096E-13 1.5331E-12 Ac227 4.0729E-10 3.3966E-09 3.2700E-08 6.7628E-08 2.1582E-07 Th229 8.8425E-08 9.9280E-08 5.3375E-07 2.6394E-06 5.9039E-05 Th230 1.1222E-04 6.6030E-04 2.5782E-02 8.6777E-02 5.0357E-01 Th232 1.1313E-05 4.8348E-05 4.2564E-04 9.3829E-04 3.9671E-03 Cf252 6.0473E-07 1.6313E-07 1.2335E-12 2.5159E-18 4.3545E-41

NEA/NSC/R(2016)3
91
Table B.2. Results for actinides in assembly calculation (g/tHMI)
NNL MASSES OF ACTINIDES (g/tHM)
Nuclide Discharge 5 Years 50 Years 100 Years 300 Years U232 4.762E-04 1.460E-03 1.235E-03 7.514E-04 1.031E-04 U233 7.474E-03 7.682E-03 1.180E-02 2.353E-02 1.438E-01 U234 1.431E+01 5.024E+01 3.252E+02 5.357E+02 8.823E+02 U235 1.036E+03 1.038E+03 1.056E+03 1.076E+03 1.157E+03 U236 2.848E+02 2.911E+02 3.485E+02 4.125E+02 6.660E+02 U238 9.166E+05 9.166E+05 9.166E+05 9.166E+05 9.166E+05
Np236 3.383E-04 3.383E-04 3.382E-04 3.382E-04 3.379E-04 Np237 1.242E+02 1.369E+02 4.844E+02 9.873E+02 2.701E+03 Pu236 1.512E-03 4.580E-04 1.052E-08 7.614E-10 7.606E-10 Pu238 7.568E+02 9.335E+02 6.553E+02 4.424E+02 9.232E+01 Pu239 1.423E+04 1.435E+04 1.434E+04 1.432E+04 1.425E+04 Pu240 1.205E+04 1.212E+04 1.234E+04 1.233E+04 1.208E+04 Pu241 6.759E+03 5.313E+03 6.089E+02 5.492E+01 6.604E-02 Pu242 3.386E+03 3.386E+03 3.386E+03 3.386E+03 3.385E+03 Pu243 8.120E-01 1.361E-12 1.361E-12 1.361E-12 1.361E-12 Pu244 3.394E-01 3.394E-01 3.394E-01 3.394E-01 3.394E-01 Am241 4.754E+02 1.911E+03 6.262E+03 6.305E+03 4.618E+03
Am242m 9.123E+00 8.901E+00 7.135E+00 5.580E+00 2.087E+00 Am243 8.665E+02 8.669E+02 8.632E+02 8.592E+02 8.431E+02 Cm242 2.152E+02 1.146E-01 1.864E-02 1.458E-02 5.437E-03 Cm243 8.153E+00 7.263E+00 2.568E+00 8.087E-01 7.958E-03 Cm244 4.177E+02 3.450E+02 6.156E+01 9.072E+00 4.277E-03 Cm245 3.832E+01 3.831E+01 3.816E+01 3.801E+01 3.739E+01 Cm246 3.336E+00 3.333E+00 3.311E+00 3.287E+00 3.192E+00 Cm247 3.915E-02 3.915E-02 3.915E-02 3.915E-02 3.915E-02 Cm248 2.110E-03 2.111E-03 2.111E-03 2.111E-03 2.110E-03 Ra226 1.216E-09 1.369E-08 4.016E-06 2.760E-05 5.129E-04 Ra228 4.650E-16 6.647E-15 1.574E-13 3.738E-13 1.613E-12 Ac227 2.313E-10 2.510E-09 2.769E-08 5.989E-08 1.987E-07 Th229 8.527E-07 1.014E-06 2.800E-06 6.415E-06 6.969E-05 Th230 9.675E-05 5.404E-04 2.497E-02 8.558E-02 5.025E-01 Th232 1.214E-05 5.404E-05 4.727E-04 1.026E-03 4.168E-03 Cf252 1.303E-06 3.516E-07 2.655E-12 5.409E-18 9.323E-41

NEA/NSC/R(2016)3
92
Table B.3. Results for actinides in assembly calculation (g/tHMI)
GRS KENOREST MASSES OF ACTINIDES (g/ tHM)
Nuclide Discharge 5 Years 50 Years 100 Years 300 Years U232 9.1920E-05 4.3530E-04 3.7770E-04 2.2850E-04 3.0600E-05 U233 3.4670E-04 5.5960E-04 4.7840E-03 1.6870E-02 1.4120E-01 U234 2.0040E+01 5.7760E+01 3.3820E+02 5.5310E+02 9.0740E+02 U235 9.4730E+02 9.4940E+02 9.6830E+02 9.8930E+02 1.0730E+03 U236 2.4660E+02 2.5290E+02 3.1030E+02 3.7460E+02 6.2920E+02 U238 9.1550E+05 9.1550E+05 9.1550E+05 9.1550E+05 9.1550E+05
Np236 2.0650E-04 2.0650E-04 2.0640E-04 2.0640E-04 2.0620E-04 Np237 1.2750E+02 1.4030E+02 5.0070E+02 1.0220E+03 2.8000E+03 Pu236 5.1630E-04 1.5450E-04 3.1710E-09 3.3710E-10 3.3680E-10 Pu238 7.6950E+02 9.5300E+02 6.6940E+02 4.5230E+02 9.4660E+01 Pu239 1.4770E+04 1.4890E+04 1.4880E+04 1.4860E+04 1.4790E+04 Pu240 1.2050E+04 1.2130E+04 1.2390E+04 1.2380E+04 1.2130E+04 Pu241 7.0190E+03 5.5140E+03 6.2830E+02 5.6290E+01 7.0750E-02 Pu242 3.4460E+03 3.4470E+03 3.4470E+03 3.4470E+03 3.4460E+03 Pu243 8.4020E-01 2.0000E-12 2.0000E-12 2.0000E-12 2.0000E-12 Pu244 3.4840E-01 3.4840E-01 3.4840E-01 3.4840E-01 3.4840E-01 Am241 4.7740E+02 1.9720E+03 6.4920E+03 6.5340E+03 4.7850E+03
Am242m 1.0230E+01 9.9800E+00 8.0000E+00 6.2580E+00 2.3430E+00 Am243 8.9210E+02 8.9250E+02 8.8870E+02 8.8460E+02 8.6810E+02 Cm242 2.2290E+02 1.2100E-01 2.0840E-02 1.6310E-02 6.1040E-03 Cm243 9.4200E+00 8.3630E+00 2.8650E+00 8.7150E-01 7.4600E-03 Cm244 4.8070E+02 3.9710E+02 7.0950E+01 1.0470E+01 4.9640E-03 Cm245 4.1360E+01 4.1340E+01 4.1190E+01 4.1020E+01 4.0360E+01 Cm246 3.5250E+00 3.5220E+00 3.4990E+00 3.4730E+00 3.3730E+00 Cm247 5.6100E-02 5.6100E-02 5.6100E-02 5.6100E-02 5.6100E-02 Cm248 2.6670E-03 2.6680E-03 2.6680E-03 2.6680E-03 2.6670E-03 Ra226 1.2030E-09 1.6100E-08 4.2990E-06 2.8950E-05 5.3030E-04 Ra228 4.8230E-16 5.8310E-15 1.3800E-13 3.3200E-13 1.5420E-12 Ac227 3.9230E-10 3.5120E-09 3.1110E-08 6.1750E-08 1.8990E-07 Th229 1.1050E-07 1.2020E-07 5.4870E-07 2.7110E-06 6.1880E-05 Th230 1.0340E-04 6.4470E-04 2.6390E-02 8.9150E-02 5.1850E-01 Th232 1.0700E-05 4.7010E-05 4.1530E-04 9.1320E-04 3.8340E-03 Cf252 2.0120E-06 5.4320E-07 4.1390E-12 8.5140E-18

NEA/NSC/R(2016)3
93
Table B.4. Results for actinides in assembly calculation (g/tHMI)
GRS TRITON MASSES OF ACTINIDES (g/ tHM)
Nuclide Discharge 5 Years 50 Years 100 Years 300 Years U232 1.0446E-04 4.1770E-04 3.6209E-04 2.2033E-04 3.0250E-05 U233 3.0064E-04 5.3388E-04 4.7604E-03 1.6385E-02 1.3369E-01 U234 1.9960E+01 5.3686E+01 3.1181E+02 5.0980E+02 8.3663E+02 U235 9.8323E+02 9.8522E+02 1.0033E+03 1.0233E+03 1.1033E+03 U236 2.5633E+02 2.6278E+02 3.2100E+02 3.8629E+02 6.4448E+02 U238 9.1608E+05 9.1608E+05 9.1608E+05 9.1608E+05 9.1608E+05
Np236 9.9763E-05 9.9763E-05 9.9738E-05 9.9713E-05 9.9589E-05 Np237 1.3679E+02 1.4945E+02 4.8609E+02 9.7231E+02 2.6278E+03 Pu236 4.7641E-04 1.4474E-04 3.3118E-09 2.2393E-10 2.2356E-10 Pu238 7.1126E+02 8.7636E+02 6.1581E+02 4.1633E+02 8.7449E+01 Pu239 1.4076E+04 1.4188E+04 1.4188E+04 1.4176E+04 1.4114E+04 Pu240 1.2232E+04 1.2306E+04 1.2562E+04 1.2550E+04 1.2299E+04 Pu241 6.5131E+03 5.1154E+03 5.8180E+02 5.2023E+01 5.5002E-02 Pu242 3.6134E+03 3.6134E+03 3.6134E+03 3.6134E+03 3.6134E+03 Pu243 9.3842E-01 1.7217E-12 5.4567E-06 1.7217E-12 1.7217E-12 Pu244 1.4722E-01 1.4722E-01 1.4722E-01 1.4722E-01 1.4722E-01 Am241 4.7579E+02 1.8632E+03 6.0550E+03 6.0910E+03 4.4600E+03
Am242m 1.2674E+01 1.2363E+01 9.9105E+00 7.7507E+00 2.8997E+00 Am243 1.0089E+03 1.0094E+03 1.0052E+03 1.0005E+03 9.8187E+02 Cm242 2.0121E+02 1.1781E-01 2.5819E-02 2.0196E-02 7.5545E-03 Cm243 9.0404E+00 8.0064E+00 2.6800E+00 7.9431E-01 6.1308E-03 Cm244 4.6834E+02 3.8753E+02 6.9165E+01 1.0194E+01 4.8088E-03 Cm245 3.1852E+01 3.1839E+01 3.1715E+01 3.1591E+01 3.1082E+01 Cm246 2.9158E+00 2.9146E+00 2.8947E+00 2.8736E+00 2.7904E+00 Cm247 4.9515E-02 4.9515E-02 4.9515E-02 4.9515E-02 4.9515E-02 Cm248 3.1976E-03 3.1988E-03 3.1988E-03 3.1988E-03 3.1976E-03 Ra226 1.3356E-09 1.5640E-08 3.9796E-06 2.6725E-05 4.8907E-04 Ra228 4.5084E-16 5.9247E-15 1.4300E-13 3.4347E-13 1.5864E-12 Ac227 3.1976E-10 3.5799E-09 3.2336E-08 6.4138E-08 1.9650E-07 Th229 1.5566E-07 1.6460E-07 5.9458E-07 2.7147E-06 5.9086E-05 Th230 1.0309E-04 6.0997E-04 2.4354E-02 8.2186E-02 4.7777E-01 Th232 1.0501E-05 4.8262E-05 4.3023E-04 9.4475E-04 3.9461E-03 Cf252 2.8376E-06 7.6526E-07 5.8788E-12 1.1987E-17 1.7105E-36

NEA/NSC/R(2016)3
94
Table B.5. Results for actinides in assembly calculation (g/tHMI)
KURCHATOV INSTITUT MASSES OF ACTINIDES (g/ tHM)
Nuclide Discharge 5 years 50 years 100 years 300 years U232 1.3557E-04 1.3815E-04 1.6000E-04 1.8347E-04 2.6962E-04 U233 2.3196E-04 2.3253E-04 2.3775E-04 2.4375E-04 2.6806E-04 U234 2.0859E+01 2.0938E+01 2.1695E+01 2.2566E+01 2.6310E+01 U235 1.0043E+03 1.0043E+03 1.0043E+03 1.0043E+03 1.0043E+03 U236 2.6149E+02 2.6149E+02 2.6166E+02 2.6184E+02 2.6255E+02 U238 9.1600E+05 9.1600E+05 9.1600E+05 9.1600E+05 9.1600E+05
Np236 2.6774E-04 2.6774E-04 2.6774E-04 2.6774E-04 2.6774E-04 Np237 1.3644E+02 1.3765E+02 1.3952E+02 1.3965E+02 1.4019E+02 Pu236 7.6010E-04 7.6099E-04 7.3880E-04 7.1484E-04 6.2565E-04 Pu238 7.6385E+02 7.6878E+02 8.0413E+02 8.3590E+02 9.1152E+02 Pu239 1.4335E+04 1.4420E+04 1.4447E+04 1.4447E+04 1.4447E+04 Pu240 1.2536E+04 1.2536E+04 1.2536E+04 1.2540E+04 1.2549E+04 Pu241 6.5114E+03 6.5069E+03 6.4706E+03 6.4253E+03 6.2576E+03 Pu242 3.6268E+03 3.6268E+03 3.6268E+03 3.6268E+03 3.6268E+03 Pu243 8.2376E-01 4.2353E-08 1.7910E-12 1.7910E-12 1.7910E-12 Pu244 1.2859E-01 1.2859E-01 1.2859E-01 1.2859E-01 1.2859E-01 Am241 4.3165E+02 4.3595E+02 4.7442E+02 5.1747E+02 6.8512E+02
Am242m 9.3549E+00 9.3549E+00 9.3503E+00 9.3412E+00 9.3185E+00 Am243 9.2565E+02 9.2610E+02 9.2610E+02 9.2610E+02 9.2610E+02 Cm242 2.1408E+02 2.1044E+02 1.7377E+02 1.4046E+02 5.9970E+01 Cm243 8.5757E+00 8.5712E+00 8.5483E+00 8.5163E+00 8.4067E+00 Cm244 4.4743E+02 4.4812E+02 4.4601E+02 4.4367E+02 4.3450E+02 Cm245 3.9625E+01 3.9625E+01 3.9625E+01 3.9620E+01 3.9620E+01 Cm246 3.5064E+00 3.5064E+00 3.5064E+00 3.5064E+00 3.5059E+00 Cm247 5.0249E-02 5.0249E-02 5.0249E-02 5.0249E-02 5.0249E-02 Cm248 4.6218E-03 4.6218E-03 4.6223E-03 4.6223E-03 4.6228E-03 Ra226 1.2930E-09 1.3062E-09 1.4282E-09 1.5735E-09 2.2653E-09 Ra228 4.9513E-16 5.0113E-16 5.6029E-16 6.3102E-16 9.6282E-16 Ac227 3.8229E-10 3.9069E-10 4.6607E-10 5.5015E-10 8.8561E-10 Th229 1.2973E-07 1.2973E-07 1.2986E-07 1.2999E-07 1.3059E-07 Th230 1.0534E-04 1.0612E-04 1.1343E-04 1.2182E-04 1.5888E-04 Th232 1.1346E-05 1.1446E-05 1.2384E-05 1.3426E-05 1.7605E-05 Cf252 4.5694E-06 4.5533E-06 4.4088E-06 4.2534E-06 3.6848E-06

NEA/NSC/R(2016)3
95
Table B.6. Results for actinides in assembly calculation (g/tHMI)
UNIPI MASSES OF ACTINIDES (grams/THM)
Nuclide Discharge 5 years 50 years 100 years 300 years U232 2.2340E-04 1.0080E-03 8.8230E-04 5.3710E-04 7.3730E-05 U233 5.3870E-04 8.0630E-04 5.4530E-03 1.7930E-02 1.4280E-01 U234 2.0540E+01 5.5000E+01 3.1860E+02 5.2080E+02 8.5470E+02 U235 1.0150E+03 1.0170E+03 1.0370E+03 1.0590E+03 1.1450E+03 U236 2.7280E+02 2.7940E+02 3.3880E+02 4.0530E+02 6.6860E+02 U238 9.1470E+05 9.1470E+05 9.1470E+05 9.1470E+05 9.1470E+05
Np236 3.2000E-04 3.2000E-04 3.1990E-04 3.1980E-04 3.1940E-04 Np237 1.5730E+02 1.7090E+02 5.2670E+02 1.0410E+03 2.7910E+03 Pu236 1.1900E-03 3.6190E-04 8.4360E-09 7.1790E-10 7.1700E-10 Pu238 7.2960E+02 8.9490E+02 6.2900E+02 4.2520E+02 8.9410E+01 Pu239 1.5210E+04 1.5340E+04 1.5330E+04 1.5310E+04 1.5240E+04 Pu240 1.2450E+04 1.2530E+04 1.2810E+04 1.2800E+04 1.2540E+04 Pu241 6.8970E+03 5.4170E+03 6.1610E+02 5.5110E+01 8.5860E-02 Pu242 3.3460E+03 3.3460E+03 3.3460E+03 3.3460E+03 3.3460E+03 Pu243 9.4010E-01 2.7710E-12 2.7710E-12 2.7710E-12 2.7710E-12 Pu244 1.5130E-01 1.5130E-01 1.5130E-01 1.5130E-01 1.5130E-01 Am241 4.9310E+02 1.9630E+03 6.4020E+03 6.4410E+03 4.7160E+03
Am242m 1.3570E+01 1.3240E+01 1.0620E+01 8.3040E+00 3.1060E+00 Am243 9.6170E+02 9.6220E+02 9.5810E+02 9.5360E+02 9.3590E+02 Cm242 2.0210E+02 1.2050E-01 2.7660E-02 2.1630E-02 8.0940E-03 Cm243 7.7220E+00 6.8380E+00 2.2890E+00 6.7840E-01 5.2360E-03 Cm244 4.9900E+02 4.1290E+02 7.3690E+01 1.0870E+01 5.1240E-03 Cm245 5.0740E+01 5.0710E+01 5.0530E+01 5.0320E+01 4.9500E+01 Cm246 4.4400E+00 4.4360E+00 4.4070E+00 4.3750E+00 4.2490E+00 Cm247 7.9710E-02 7.9710E-02 7.9710E-02 7.9710E-02 7.9710E-02 Cm248 5.3250E-03 5.3280E-03 5.3290E-03 5.3280E-03 5.3260E-03 Ra226 1.3390E-09 1.5900E-08 4.0680E-06 2.7310E-05 4.9960E-04 Ra228 5.2520E-16 6.4330E-15 1.5170E-13 4.0120E-13 1.6590E-12 Ac227 3.3610E-10 3.7610E-09 3.3710E-08 6.6630E-08 2.0370E-07 Th229 3.1350E-07 3.2790E-07 8.4490E-07 3.1950E-06 6.3640E-05 Th230 1.0290E-04 6.2290E-04 2.4900E-02 8.3970E-02 4.8810E-01 Th232 1.1740E-05 5.1910E-05 4.5640E-04 9.9800E-04 4.1240E-03 Cf252 4.7350E-06 1.2780E-06 9.6550E-12 1.9690E-17 0.0000E+00

NEA/NSC/R(2016)3
96
Table B.7. Trends of relative standard deviation versus cooling time for actinides masses
RSD Nuclide Discharge 5 years 50 years 100 years 300 years
U232 81% 77% 74% 67% 105% U233 187% 168% 70% 51% 49% U234 14% 29% 45% 47% 47% U235 5% 5% 5% 6% 7% U236 5% 5% 10% 15% 27% U238 0% 0% 0% 0% 0%
Np236 38% 38% 38% 38% 38% Np237 9% 9% 34% 41% 46% Pu236 54% 74% 245% 245% 245% Pu238 3% 7% 10% 33% 147% Pu239 4% 4% 4% 4% 4% Pu240 3% 3% 3% 2% 2% Pu241 3% 9% 151% 233% 245% Pu242 4% 4% 4% 4% 4% Pu243 13% 245% 245% 31% 31% Pu244 44% 44% 44% 44% 44% Am241 5% 36% 45% 44% 41%
Am242m 18% 18% 15% 19% 72% Am243 7% 7% 7% 7% 8% Cm242 6% 244% 245% 245% 245% Cm243 11% 12% 70% 154% 244% Cm244 10% 13% 120% 216% 245% Cm245 18% 18% 18% 18% 18% Cm246 21% 21% 21% 21% 21% Cm247 31% 31% 31% 31% 31% Cm248 43% 43% 43% 43% 43% Ra226 5% 45% 49% 49% 49% Ra228 6% 45% 49% 50% 49% Ac227 19% 45% 49% 49% 49% Th229 107% 115% 105% 68% 49% Th230 5% 40% 49% 49% 49% Th232 5% 37% 48% 48% 49% Cf252 64% 129% 245% 245% 224%

NEA/NSC/R(2016)3
97
Table B.8. Results for fission products in assembly calculation (g/tHMI)
CEA MASSES OF FISSION PRODUCTS (g/tHM)
Nuclide discharge 5 years 50 years 100 years 300 years Se79 5.2580E+00 5.2580E+00 5.2576E+00 5.2571E+00 5.2552E+00 Kr85 1.6953E+01 1.2286E+01 6.7531E-01 2.6892E-02 6.7630E-08 Rb85 6.4108E+01 6.8801E+01 8.0411E+01 8.1059E+01 8.1086E+01 Rb87 1.4425E+02 1.4426E+02 1.4426E+02 1.4426E+02 1.4426E+02 Sr88 1.9567E+02 1.9572E+02 1.9572E+02 1.9572E+02 1.9572E+02 Sr90 2.9236E+02 2.5920E+02 8.7724E+01 2.6322E+01 2.1335E-01
Nb93m 3.3011E-04 1.4171E-03 5.2953E-03 5.8740E-03 5.9499E-03 Mo95 5.8583E+02 7.0800E+02 7.0800E+02 7.0800E+02 7.0800E+02 Mo97 8.1264E+02 8.1370E+02 8.1370E+02 8.1370E+02 8.1370E+02 Tc99 8.7941E+02 8.8442E+02 8.8429E+02 8.8415E+02 8.8357E+02
Ru101 9.6308E+02 9.6312E+02 9.6312E+02 9.6312E+02 9.6312E+02 Ru106 3.6159E+02 1.2100E+01 1.4793E-07 2.1650E-08 4.6032E-11 Rh103 8.0701E+02 8.8342E+02 8.8342E+02 8.8342E+02 8.8342E+02 Pd107 5.8112E+02 5.8114E+02 5.8114E+02 5.8114E+02 5.8113E+02
Ag108m 9.8532E-04 9.7718E-04 9.0692E-04 8.3476E-04 5.9914E-04 Ag109 2.1414E+02 2.1452E+02 2.1452E+02 2.1452E+02 2.1452E+02
Ag110m 2.4065E+00 1.5152E-02 4.2091E-12 6.2554E-13 5.6829E-15 I127 8.4107E+01 8.7599E+01 8.7599E+01 8.7599E+01 8.7599E+01 I129 2.6232E+02 2.6780E+02 2.6780E+02 2.6780E+02 2.6780E+02
Xe130 6.9347E+00 6.9478E+00 6.9478E+00 6.9478E+00 6.9478E+00 Xe131 5.6329E+02 5.7424E+02 5.7424E+02 5.7424E+02 5.7424E+02 Xe132 1.2563E+03 1.2623E+03 1.2623E+03 1.2623E+03 1.2623E+03 Xe134 1.5309E+03 1.5311E+03 1.5311E+03 1.5311E+03 1.5311E+03 Xe136 2.4104E+03 2.4104E+03 2.4104E+03 2.4104E+03 2.4104E+03 Cs133 1.2873E+03 1.3033E+03 1.3033E+03 1.3033E+03 1.3033E+03 Cs134 1.3199E+02 2.4644E+01 6.7926E-06 2.2722E-11 4.2781E-13 Cs135 6.9447E+02 6.9552E+02 6.9551E+02 6.9550E+02 6.9546E+02 Cs137 1.3945E+03 1.2425E+03 4.3991E+02 1.3878E+02 1.3746E+00 Ba136 3.2075E+01 3.3133E+01 3.3133E+01 3.3133E+01 3.3133E+01 Ba138 1.3800E+03 1.3801E+03 1.3801E+03 1.3801E+03 1.3801E+03 La139 1.3311E+03 1.3312E+03 1.3312E+03 1.3312E+03 1.3312E+03 Ce140 1.2211E+03 1.2528E+03 1.2528E+03 1.2528E+03 1.2528E+03 Ce144 3.6916E+02 4.3479E+00 8.0018E-08 1.1706E-08 2.2492E-11 Nd142 1.2548E+01 1.2589E+01 1.2589E+01 1.2589E+01 1.2589E+01 Nd143 8.6303E+02 8.9016E+02 8.9016E+02 8.9016E+02 8.9016E+02 Nd144 6.9918E+02 1.0640E+03 1.0683E+03 1.0683E+03 1.0683E+03

NEA/NSC/R(2016)3
98
Table B.8. Results for fission products in assembly calculation (g/tHMI) (continued)
CEA MASSES OF FISSION PRODUCTS (g/tHM)
Nuclide discharge 5 years 50 years 100 years 300 years Nd145 6.7369E+02 6.7402E+02 6.7402E+02 6.7402E+02 6.7402E+02 Nd146 6.8410E+02 6.8413E+02 6.8413E+02 6.8413E+02 6.8413E+02 Nd148 4.2192E+02 4.2192E+02 4.2192E+02 4.2192E+02 4.2192E+02 Nd150 2.4837E+02 2.4837E+02 2.4837E+02 2.4837E+02 2.4837E+02 Pm147 2.2245E+02 6.1993E+01 4.2542E-04 2.0628E-08 3.0250E-11 Sm146 8.0153E-03 9.0711E-03 1.0279E-02 1.0283E-02 1.0283E-02 Sm147 7.6393E+01 2.4661E+02 3.0860E+02 3.0860E+02 3.0860E+02 Sm148 1.3673E+02 1.4092E+02 1.4092E+02 1.4092E+02 1.4092E+02 Sm149 4.8265E+00 6.5536E+00 6.5536E+00 6.5536E+00 6.5536E+00 Sm150 3.4776E+02 3.4776E+02 3.4776E+02 3.4776E+02 3.4776E+02 Sm151 2.6593E+01 2.5985E+01 1.8375E+01 1.2502E+01 2.6794E+00 Sm152 1.6704E+02 1.6705E+02 1.6707E+02 1.6707E+02 1.6707E+02 Sm154 7.3001E+01 7.3004E+01 7.3010E+01 7.3010E+01 7.3010E+01 Eu153 1.7947E+02 1.8095E+02 1.8095E+02 1.8095E+02 1.8095E+02 Eu154 4.4693E+01 2.9859E+01 7.9182E-01 1.4028E-02 1.3824E-09 Eu155 1.2659E+01 6.1063E+00 8.6240E-03 5.8811E-06 1.1166E-11 Gd154 2.9971E+00 1.7828E+01 4.6889E+01 4.7667E+01 4.7681E+01 Gd155 1.5757E-01 6.7118E+00 1.2809E+01 1.2818E+01 1.2818E+01 Gd156 9.9551E+01 1.0487E+02 1.0487E+02 1.0487E+02 1.0487E+02
Ho166m 9.5900E-03 9.5624E-03 9.3170E-03 9.0518E-03 8.0642E-03

NEA/NSC/R(2016)3
99
Table B.9. Results for fission products in assembly calculation (g/tHMI)
NNL MASSES OF FISSION PRODUCTS (g/ tHM)
Nuclide Discharge 5 Years 50 Years 100 Years 300 Years Se79 4.863E+00 4.862E+00 4.860E+00 4.857E+00 4.847E+00 Kr85 1.814E+01 1.313E+01 7.154E-01 2.821E-02 6.819E-08 Rb85 6.884E+01 7.388E+01 8.629E+01 8.698E+01 8.701E+01 Rb87 1.542E+02 1.542E+02 1.542E+02 1.542E+02 1.542E+02 Sr88 2.108E+02 2.108E+02 2.108E+02 2.108E+02 2.108E+02 Sr90 3.224E+02 2.862E+02 9.805E+01 2.982E+01 2.552E-01
Nb93m 3.188E-04 1.552E-03 6.010E-03 6.696E-03 6.790E-03 Mo95 6.068E+02 7.657E+02 7.657E+02 7.657E+02 7.657E+02 Mo97 8.940E+02 8.954E+02 8.954E+02 8.954E+02 8.954E+02 Tc99 9.668E+02 9.735E+02 9.733E+02 9.732E+02 9.725E+02
Ru101 1.055E+03 1.055E+03 1.055E+03 1.055E+03 1.055E+03 Ru106 4.266E+02 1.370E+01 4.989E-13 5.834E-28 - Rh103 8.471E+02 9.467E+02 9.467E+02 9.467E+02 9.467E+02 Pd107 6.138E+02 6.139E+02 6.139E+02 6.139E+02 6.138E+02
Ag108m 5.702E-06 5.655E-06 5.248E-06 4.831E-06 3.467E-06 Ag109 1.644E+02 1.649E+02 1.649E+02 1.649E+02 1.649E+02
Ag110m 4.863E+00 3.068E-02 4.854E-22 0.000E+00 - I127 9.123E+01 9.598E+01 9.598E+01 9.598E+01 9.598E+01 I129 2.938E+02 2.973E+02 2.973E+02 2.973E+02 2.973E+02
Xe130 9.271E+00 9.293E+00 9.293E+00 9.293E+00 9.293E+00 Xe131 5.199E+02 5.347E+02 5.347E+02 5.347E+02 5.347E+02 Xe132 1.486E+03 1.494E+03 1.494E+03 1.494E+03 1.494E+03 Xe134 1.819E+03 1.819E+03 1.819E+03 1.819E+03 1.819E+03 Xe136 2.660E+03 2.660E+03 2.660E+03 2.660E+03 2.660E+03 Cs133 1.417E+03 1.438E+03 1.438E+03 1.438E+03 1.438E+03 Cs134 1.411E+02 2.627E+01 7.070E-06 3.543E-13 2.253E-42 Cs135 7.279E+02 7.292E+02 7.292E+02 7.292E+02 7.291E+02 Cs137 1.526E+03 1.360E+03 4.807E+02 1.514E+02 1.490E+00 Ba136 4.274E+01 4.466E+01 4.466E+01 4.466E+01 4.466E+01 Ba138 1.529E+03 1.529E+03 1.529E+03 1.529E+03 1.529E+03 La139 1.353E+03 1.353E+03 1.353E+03 1.353E+03 1.353E+03 Ce140 1.344E+03 1.391E+03 1.391E+03 1.391E+03 1.391E+03 Ce144 4.360E+02 5.125E+00 2.194E-17 1.104E-36 - Nd142 1.496E+01 1.502E+01 1.502E+01 1.502E+01 1.502E+01 Nd143 9.447E+02 9.803E+02 9.803E+02 9.803E+02 9.803E+02 Nd144 7.470E+02 1.178E+03 1.183E+03 1.183E+03 1.183E+03

NEA/NSC/R(2016)3
100
Table B.9. Results for fission products in assembly calculation (g/tHMI) (continued)
NNL MASSES OF FISSION PRODUCTS (g/ tHM)
Nuclide Discharge 5 Years 50 Years 100 Years 300 Years Nd145 7.436E+02 7.440E+02 7.440E+02 7.440E+02 7.440E+02 Nd146 7.603E+02 7.604E+02 7.604E+02 7.604E+02 7.604E+02 Nd148 4.723E+02 4.723E+02 4.723E+02 4.723E+02 4.723E+02 Nd150 2.749E+02 2.749E+02 2.749E+02 2.749E+02 2.749E+02 Pm147 1.977E+02 5.619E+01 3.844E-04 7.017E-10 7.785E-33
Sm146 2.560E-02 3.548E-02 4.679E-02 4.683E-02 4.683E-02
Sm147 6.775E+01 2.222E+02 2.784E+02 2.784E+02 2.784E+02
Sm148 1.744E+02 1.798E+02 1.798E+02 1.798E+02 1.798E+02
Sm149 5.846E+00 8.475E+00 8.475E+00 8.475E+00 8.475E+00
Sm150 3.760E+02 3.760E+02 3.760E+02 3.760E+02 3.760E+02
Sm151 3.595E+01 3.509E+01 2.469E+01 1.671E+01 3.502E+00
Sm152 2.280E+02 2.281E+02 2.281E+02 2.281E+02 2.281E+02
Sm154 8.322E+01 8.322E+01 8.323E+01 8.323E+01 8.323E+01
Eu153 1.993E+02 2.015E+02 2.015E+02 2.015E+02 2.015E+02
Eu154 6.420E+01 4.291E+01 1.141E+00 2.027E-02 2.022E-09
Eu155 1.954E+01 9.713E+00 1.796E-02 1.650E-05 1.175E-17
Gd154 3.489E+00 2.478E+01 6.654E+01 6.766E+01 6.768E+01
Gd155 1.871E-01 1.002E+01 1.972E+01 1.973E+01 1.973E+01
Gd156 1.212E+02 1.285E+02 1.285E+02 1.285E+02 1.285E+02
Ho166m 2.055E-02 2.049E-02 1.996E-02 1.939E-02 1.728E-02

NEA/NSC/R(2016)3
101
Table B.10. Results for fission products in assembly calculation (g/tHMI)
GRS KENOREST MASSES OF FISSION PRODUCTS (g/ tHM)
Nuclide Discharge 5 Years 50 Years 100 Years 300 Years Se79 5.4460E+00 5.4460E+00 5.4460E+00 5.4460E+00 5.4440E+00 Kr85 1.7080E+01 1.2390E+01 6.8360E-01 2.7350E-02 7.0030E-08 Rb85 6.6780E+01 7.1510E+01 8.3210E+01 8.3870E+01 8.3890E+01 Rb87 1.6240E+02 1.6250E+02 1.6250E+02 1.6250E+02 1.6250E+02 Sr88 2.2170E+02 2.2170E+02 2.2170E+02 2.2170E+02 2.2170E+02 Sr90 3.2820E+02 2.9080E+02 9.7940E+01 2.9220E+01 2.3170E-01
Nb93m 3.3700E-01 2.6260E-01 3.1920E-02 8.0090E-03 5.9670E-03 Mo95 6.6040E+02 8.1620E+02 8.1620E+02 8.1620E+02 8.1620E+02 Mo97 9.6390E+02 9.6530E+02 9.6530E+02 9.6530E+02 9.6530E+02 Tc99 1.0080E+03 1.0150E+03 1.0150E+03 1.0150E+03 1.0140E+03
Ru101 1.0190E+03 1.0190E+03 1.0190E+03 1.0190E+03 1.0190E+03 Ru106 4.4250E+02 1.4980E+01 8.7260E-13
Rh103 7.8360E+02 8.7670E+02 8.7670E+02 8.7670E+02 8.7670E+02 Pd107 6.4970E+02 6.4970E+02 6.4970E+02 6.4970E+02 6.4970E+02
Ag108m 9.8570E-06 9.5910E-06 7.5040E-06 5.7130E-06 1.9190E-06 Ag109 2.4160E+02 2.4210E+02 2.4210E+02 2.4210E+02 2.4210E+02
Ag110m 3.8140E+00 2.4150E-02 3.9550E-22 I127 8.3940E+01 8.7670E+01 8.7670E+01 8.7670E+01 8.7670E+01
I129 2.8270E+02 2.8620E+02 2.8620E+02 2.8620E+02 2.8620E+02 Xe130 8.8030E+00 8.8200E+00 8.8200E+00 8.8200E+00 8.8200E+00 Xe131 5.6410E+02 5.7790E+02 5.7790E+02 5.7790E+02 5.7790E+02 Xe132 1.4700E+03 1.4780E+03 1.4780E+03 1.4780E+03 1.4780E+03 Xe134 1.8290E+03 1.8290E+03 1.8290E+03 1.8290E+03 1.8290E+03 Xe136 2.7040E+03 2.7040E+03 2.7040E+03 2.7040E+03 2.7040E+03 Cs133 1.3830E+03 1.4030E+03 1.4030E+03 1.4030E+03 1.4030E+03 Cs134 1.8250E+02 3.4020E+01 9.2590E-06 4.6980E-13
Cs135 7.6100E+02 7.6230E+02 7.6230E+02 7.6230E+02 7.6230E+02 Cs137 1.5540E+03 1.3850E+03 4.9300E+02 1.5640E+02 1.5850E+00 Ba136 4.2550E+01 4.4380E+01 4.4380E+01 4.4380E+01 4.4380E+01 Ba138 1.5370E+03 1.5370E+03 1.5370E+03 1.5370E+03 1.5370E+03 La139 1.4090E+03 1.4100E+03 1.4100E+03 1.4100E+03 1.4100E+03 Ce140 1.4040E+03 1.4460E+03 1.4460E+03 1.4460E+03 1.4460E+03 Ce144 4.4840E+02 5.2810E+00 2.2990E-17
Nd142 1.5860E+01 1.5920E+01 1.5920E+01 1.5920E+01 1.5920E+01 Nd143 9.4790E+02 9.8300E+02 9.8300E+02 9.8300E+02 9.8300E+02 Nd144 7.5330E+02 1.1960E+03 1.2020E+03 1.2020E+03 1.2020E+03

NEA/NSC/R(2016)3
102
Table B.10. Results for fission products in assembly calculation (g/tHMI) (continued)
GRS KENOREST MASSES OF FISSION PRODUCTS (g/ tHM)
Nuclide Discharge 5 Years 50 Years 100 Years 300 Years Nd145 7.3210E+02 7.3250E+02 7.3250E+02 7.3250E+02 7.3250E+02 Nd146 7.7410E+02 7.7410E+02 7.7410E+02 7.7410E+02 7.7410E+02 Nd148 4.6460E+02 4.6460E+02 4.6460E+02 4.6460E+02 4.6460E+02 Nd150 2.7780E+02 2.7780E+02 2.7780E+02 2.7780E+02 2.7780E+02 Pm147 2.2340E+02 6.3040E+01 4.3510E-04 8.0180E-10
Sm146 1.1530E-02 1.2030E-02 1.2590E-02 1.2590E-02 1.2590E-02 Sm147 6.9580E+01 2.4260E+02 3.0560E+02 3.0560E+02 3.0560E+02 Sm148 1.5370E+02 1.5890E+02 1.5890E+02 1.5890E+02 1.5890E+02 Sm149 5.8520E+00 8.3500E+00 8.3500E+00 8.3500E+00 8.3500E+00 Sm150 3.8640E+02 3.8640E+02 3.8640E+02 3.8640E+02 3.8640E+02 Sm151 3.3910E+01 3.3190E+01 2.3740E+01 1.6360E+01 3.6880E+00 Sm152 2.0030E+02 2.0030E+02 2.0040E+02 2.0040E+02 2.0040E+02 Sm154 8.1310E+01 8.1310E+01 8.1320E+01 8.1320E+01 8.1320E+01 Eu153 2.0330E+02 2.0540E+02 2.0540E+02 2.0540E+02 2.0540E+02 Eu154 4.9830E+01 3.3620E+01 9.7320E-01 1.9010E-02 2.7660E-09 Eu155 1.6950E+01 8.1900E+00 1.1760E-02 8.1470E-06 1.8780E-18 Gd154 2.9300E+00 1.9140E+01 5.1780E+01 5.2730E+01 5.2750E+01 Gd155 1.7240E-01 8.9350E+00 1.7110E+01 1.7130E+01 1.7130E+01 Gd156 1.2410E+02 1.3220E+02 1.3220E+02 1.3220E+02 1.3220E+02
Ho166m 1.1830E-03 1.1790E-03 1.1490E-03 1.1160E-03 9.9450E-04

NEA/NSC/R(2016)3
103
Table B.11. Results for fission products in assembly calculation (g/tHMI)
GRS TRITON MASSES OF FISSION PRODUCTS (g/ tHM)
Nuclide Discharge 5 Years 50 Years 100 Years 300 Years Se79 5.1017E+00 5.1017E+00 5.1017E+00 5.1005E+00 5.0980E+00 Kr85 1.7552E+01 1.2711E+01 6.9240E-01 2.7309E-02 6.6049E-08 Rb85 6.7303E+01 7.2181E+01 8.4197E+01 8.4867E+01 8.4892E+01 Rb87 1.6050E+02 1.6050E+02 1.6050E+02 1.6050E+02 1.6050E+02 Sr88 2.1437E+02 2.1437E+02 2.1437E+02 2.1437E+02 2.1437E+02 Sr90 3.3602E+02 2.9704E+02 9.8100E+01 2.8637E+01 2.0804E-01
Nb93m 4.4289E-02 3.7028E-02 1.1143E-02 7.2752E-03 6.7551E-03 Mo95 6.6149E+02 8.1677E+02 8.1677E+02 8.1677E+02 8.1677E+02 Mo97 9.5915E+02 9.6052E+02 9.6052E+02 9.6052E+02 9.6052E+02 Tc99 9.8844E+02 9.9502E+02 9.9477E+02 9.9465E+02 9.9403E+02
Ru101 1.0555E+03 1.0556E+03 1.0556E+03 1.0556E+03 1.0556E+03 Ru106 4.4054E+02 1.4585E+01 1.8682E-06 2.9779E-21 0.0000E+00 Rh103 8.4607E+02 9.4723E+02 9.4723E+02 9.4723E+02 9.4723E+02 Pd107 6.4597E+02 6.4597E+02 6.4597E+02 6.4597E+02 6.4597E+02
Ag108m 2.6539E-06 2.5831E-06 2.0196E-06 1.5380E-06 5.1613E-07 Ag109 2.3088E+02 2.3138E+02 2.3138E+02 2.3138E+02 2.3138E+02
Ag110m 2.4789E+00 1.5616E-02 2.9257E-08 2.8724E-30 0.0000E+00 I127 8.5352E+01 8.9336E+01 8.9336E+01 8.9336E+01 8.9336E+01 I129 2.6949E+02 2.7296E+02 2.7296E+02 2.7296E+02 2.7296E+02
Xe130 9.3308E+00 9.3482E+00 9.3482E+00 9.3482E+00 9.3482E+00 Xe131 5.9259E+02 6.0687E+02 6.0687E+02 6.0687E+02 6.0687E+02 Xe132 1.4784E+03 1.4871E+03 1.4871E+03 1.4871E+03 1.4871E+03 Xe134 1.8731E+03 1.8731E+03 1.8731E+03 1.8731E+03 1.8731E+03 Xe136 2.7979E+03 2.7979E+03 2.7979E+03 2.7979E+03 2.7979E+03 Cs133 1.4300E+03 1.4498E+03 1.4498E+03 1.4498E+03 1.4498E+03 Cs134 1.4995E+02 2.7929E+01 8.7425E-06 4.4227E-13 8.7549E-36 Cs135 7.2901E+02 7.3025E+02 7.3025E+02 7.3025E+02 7.3025E+02 Cs137 1.5764E+03 1.4039E+03 4.9652E+02 1.5640E+02 1.5392E+00 Ba136 5.8924E+01 6.0600E+01 6.0600E+01 6.0600E+01 6.0600E+01 Ba138 1.5442E+03 1.5442E+03 1.5442E+03 1.5442E+03 1.5442E+03 La139 1.4349E+03 1.4349E+03 1.4349E+03 1.4349E+03 1.4349E+03 Ce140 1.4287E+03 1.4697E+03 1.4697E+03 1.4697E+03 1.4697E+03 Ce144 4.4327E+02 5.2122E+00 2.3771E-06 1.2100E-25 0.0000E+00 Nd142 1.6311E+01 1.6373E+01 1.6373E+01 1.6373E+01 1.6373E+01 Nd143 9.3631E+02 9.7045E+02 9.7045E+02 9.7045E+02 9.7045E+02 Nd144 7.6675E+02 1.2048E+03 1.2100E+03 1.2100E+03 1.2100E+03

NEA/NSC/R(2016)3
104
Table B.11. Results for fission products in assembly calculation (g/tHMI) (continued)
GRS TRITON MASSES OF FISSION PRODUCTS (g/ tHM)
Nuclide Discharge 5 Years 50 Years 100 Years 300 Years Nd145 7.3559E+02 7.3596E+02 7.3596E+02 7.3596E+02 7.3596E+02 Nd146 7.6762E+02 7.6762E+02 7.6762E+02 7.6762E+02 7.6762E+02 Nd148 4.6362E+02 4.6362E+02 4.6362E+02 4.6362E+02 4.6362E+02 Nd150 2.7755E+02 2.7755E+02 2.7755E+02 2.7755E+02 2.7755E+02 Pm147 2.2319E+02 6.2946E+01 4.3085E-04 7.8946E-10 1.5566E-29 Sm146 7.1735E-03 7.4900E-03 7.8500E-03 7.8512E-03 7.8512E-03 Sm147 7.1834E+01 2.4466E+02 3.0759E+02 3.0759E+02 3.0759E+02 Sm148 1.4486E+02 1.4982E+02 1.4982E+02 1.4982E+02 1.4982E+02 Sm149 5.4381E+00 7.9679E+00 7.9679E+00 7.9679E+00 7.9679E+00 Sm150 3.8964E+02 3.8964E+02 3.8964E+02 3.8964E+02 3.8964E+02 Sm151 3.3366E+01 3.2609E+01 2.3063E+01 1.5690E+01 3.3627E+00 Sm152 2.0270E+02 2.0270E+02 2.0283E+02 2.0283E+02 2.0283E+02 Sm154 7.8574E+01 7.8586E+01 7.8586E+01 7.8586E+01 7.8586E+01 Eu153 1.9426E+02 1.9625E+02 1.9625E+02 1.9625E+02 1.9625E+02 Eu154 4.9515E+01 3.3081E+01 8.7673E-01 1.5529E-02 1.5268E-09 Eu155 1.0339E+01 4.9304E+00 6.2847E-03 3.8207E-06 5.3835E-19 Gd154 2.9977E+00 1.9426E+01 5.1626E+01 5.2482E+01 5.2494E+01 Gd155 1.0453E-01 5.5138E+00 1.0439E+01 1.0446E+01 1.0446E+01 Gd156 1.2438E+02 1.3245E+02 1.3245E+02 1.3245E+02 1.3245E+02
Ho166m 4.9081E-04 4.8932E-04 4.7678E-04 4.6325E-04 4.1273E-04

NEA/NSC/R(2016)3
105
Table B.12. Results for fission products in assembly calculation (g/tHMI)
KURCHATOV INSTITUT MASSES OF FISSION PRODUCTS (g/ tHM)
Nuclide Discharge 5 years 50 years 100 years 300 years Se79 5.2136E+00 5.2136E+00 5.2136E+00 5.2136E+00 5.2136E+00 Kr85 1.7260E+01 1.2466E+01 6.7922E-01 2.6849E-02 6.4725E-08 Rb85 6.9200E+01 7.3995E+01 8.5821E+01 8.6460E+01 8.6460E+01 Rb87 1.6030E+02 1.6030E+02 1.6030E+02 1.6030E+02 1.6030E+02 Sr88 2.1344E+02 2.1344E+02 2.1344E+02 2.1344E+02 2.1344E+02 Sr90 3.2997E+02 2.9105E+02 9.6284E+01 2.8090E+01 2.0475E-01
Nb93m 3.2523E-04 1.5160E-03 5.7528E-03 6.3998E-03 6.4697E-03 Mo95 6.0551E+02 7.6091E+02 7.6091E+02 7.6091E+02 7.6091E+02 Mo97 9.1371E+02 9.1554E+02 9.1554E+02 9.1554E+02 9.1554E+02 Tc99 9.6978E+02 9.7723E+02 9.7723E+02 9.7723E+02 9.7536E+02
Ru101 1.0482E+03 1.0482E+03 1.0482E+03 1.0482E+03 1.0482E+03 Ru106 4.3647E+02 1.4449E+01 6.9157E-13 1.0961E-27 0.0000E+00 Rh103 8.4823E+02 9.4893E+02 9.4893E+02 9.4893E+02 9.4893E+02 Pd107 6.2567E+02 6.2567E+02 6.2567E+02 6.2567E+02 6.2567E+02
Ag108m 8.4473E-06 8.2239E-06 6.4370E-06 4.8937E-06 1.6428E-06 Ag109 2.4798E+02 2.4798E+02 2.4798E+02 2.4798E+02 2.4798E+02
Ag110m 2.9575E+00 1.8552E-02 2.8955E-22 0.0000E+00 0.0000E+00 I127 9.4558E+01 9.9095E+01 9.9095E+01 9.9095E+01 9.9095E+01 I129 2.7165E+02 2.7650E+02 2.7650E+02 2.7650E+02 2.7650E+02
Xe130 7.6260E+00 7.6505E+00 7.6505E+00 7.6505E+00 7.6505E+00 Xe131 5.8867E+02 6.0344E+02 6.0344E+02 6.0344E+02 6.0344E+02 Xe132 1.4246E+03 1.4320E+03 1.4320E+03 1.4320E+03 1.4320E+03 Xe134 1.8568E+03 1.8568E+03 1.8568E+03 1.8568E+03 1.8568E+03 Xe136 2.7616E+03 2.7616E+03 2.7616E+03 2.7616E+03 2.7616E+03 Cs133 1.4079E+03 1.4279E+03 1.4279E+03 1.4279E+03 1.4279E+03 Cs134 1.7283E+02 3.2249E+01 8.6669E-06 4.3586E-13 0.0000E+00 Cs135 7.4624E+02 7.4624E+02 7.4624E+02 7.4624E+02 7.4624E+02 Cs137 1.5687E+03 1.3961E+03 4.9456E+02 1.5558E+02 1.5326E+00 Ba136 3.9123E+01 4.0146E+01 4.0146E+01 4.0146E+01 4.0146E+01 Ba138 1.5360E+03 1.5360E+03 1.5360E+03 1.5360E+03 1.5360E+03 La139 1.4269E+03 1.4269E+03 1.4269E+03 1.4269E+03 1.4269E+03 Ce140 1.3582E+03 1.4030E+03 1.4030E+03 1.4030E+03 1.4030E+03 Ce144 4.4132E+02 5.1983E+00 2.2689E-17 0.0000E+00 0.0000E+00 Nd142 1.6366E+01 1.6420E+01 1.6420E+01 1.6420E+01 1.6420E+01 Nd143 9.4103E+02 9.7598E+02 9.7598E+02 9.7598E+02 9.7598E+02 Nd144 7.5538E+02 1.1913E+03 1.1967E+03 1.1967E+03 1.1967E+03

NEA/NSC/R(2016)3
106
Table B.12. Results for fission products in assembly calculation (g/tHMI) (continued)
KURCHATOV INSTITUT MASSES OF FISSION PRODUCTS (g/ tHM)
Nuclide Discharge 5 years 50 years 100 years 300 years Nd-45 7.3609E+02 7.3609E+02 7.3609E+02 7.3609E+02 7.3609E+02 Nd146 7.6038E+02 7.6038E+02 7.6038E+02 7.6038E+02 7.6038E+02 Nd148 4.6471E+02 4.6471E+02 4.6471E+02 4.6471E+02 4.6471E+02 Nd150 2.7582E+02 2.7582E+02 2.7582E+02 2.7582E+02 2.7582E+02 Pm147 2.1890E+02 6.1911E+01 4.2287E-04 7.7388E-10 0.0000E+00 Sm146 1.0486E-06 1.0486E-06 1.0486E-06 1.0486E-06 1.0486E-06 Sm147 7.0202E+01 2.3990E+02 3.0126E+02 3.0126E+02 3.0126E+02 Sm148 1.6696E+02 1.7253E+02 1.7253E+02 1.7253E+02 1.7253E+02 Sm149 3.7540E+00 5.4068E+00 5.4068E+00 5.4068E+00 5.4068E+00 Sm150 3.1305E+02 3.1305E+02 3.1305E+02 3.1305E+02 3.1305E+02 Sm151 2.5921E+01 2.5467E+01 1.8028E+01 1.2265E+01 2.6261E+00 Sm152 1.6919E+02 1.6919E+02 1.6919E+02 1.6919E+02 1.6919E+02 Sm154 7.6730E+01 7.6730E+01 7.6730E+01 7.6730E+01 7.6730E+01 Eu153 1.9907E+02 2.0108E+02 2.0108E+02 2.0108E+02 2.0108E+02 Eu154 4.9513E+01 3.3008E+01 8.7733E-01 1.5520E-02 1.5201E-09 Eu155 1.5387E+01 7.3440E+00 9.3549E-03 5.6829E-06 7.7811E-19 Gd154 3.0403E+00 1.9487E+01 5.1829E+01 5.2698E+01 5.2698E+01 Gd155 1.5242E-01 8.2183E+00 1.5533E+01 1.5533E+01 1.5533E+01 Gd156 1.2759E+02 1.3610E+02 1.3610E+02 1.3610E+02 1.3610E+02
Ho166m 5.7428E-04 5.7428E-04 5.5868E-04 5.4307E-04 4.8377E-04

NEA/NSC/R(2016)3
107
Table B.13. Results for fission products in assembly calculation (g/tHMI)
UNIPI MASSES OF FISSION PRODUCTS (grams/THM)
Nuclide Discharge 5 years 50 years 100 years 300 years Se79 5.120E+00 5.120E+00 5.119E+00 5.119E+00 5.116E+00 Kr85 1.757E+01 1.272E+01 6.931E-01 2.733E-02 6.612E-08 Rb85 6.734E+01 7.223E+01 8.426E+01 8.492E+01 8.495E+01 Rb87 1.608E+02 1.608E+02 1.608E+02 1.608E+02 1.608E+02 Sr88 2.146E+02 2.146E+02 2.146E+02 2.146E+02 2.146E+02 Sr90 3.365E+02 2.975E+02 9.824E+01 2.868E+01 2.084E-01
Nb93m 2.499E-02 2.147E-02 8.928E-03 7.053E-03 6.796E-03 Mo95 6.665E+02 8.222E+02 8.222E+02 8.222E+02 8.222E+02 Mo97 9.613E+02 9.628E+02 9.628E+02 9.628E+02 9.628E+02 Tc99 9.896E+02 9.960E+02 9.960E+02 9.960E+02 9.950E+02
Ru101 1.051E+03 1.052E+03 1.052E+03 1.052E+03 1.052E+03 Ru106 4.376E+02 1.449E+01 6.931E-13 1.099E-27 0.000E+00 Rh103 8.572E+02 9.588E+02 9.588E+02 9.588E+02 9.588E+02 Pd107 6.403E+02 6.404E+02 6.404E+02 6.404E+02 6.404E+02
Ag108m 2.126E-06 2.069E-06 1.619E-06 1.232E-06 4.135E-07 Ag109 2.297E+02 2.301E+02 2.301E+02 2.301E+02 2.301E+02
Ag110m 2.214E+00 1.394E-02 2.173E-22 0.000E+00 0.000E+00 I127 8.552E+01 8.953E+01 8.953E+01 8.953E+01 8.953E+01 I129 2.699E+02 2.733E+02 2.733E+02 2.733E+02 2.733E+02
Xe130 9.332E+00 9.350E+00 9.350E+00 9.350E+00 9.350E+00 Xe131 6.161E+02 6.307E+02 6.307E+02 6.307E+02 6.307E+02 Xe132 1.455E+03 1.463E+03 1.463E+03 1.463E+03 1.463E+03 Xe134 1.869E+03 1.870E+03 1.870E+03 1.870E+03 1.870E+03 Xe136 2.768E+03 2.768E+03 2.768E+03 2.768E+03 2.768E+03 Cs133 1.408E+03 1.429E+03 1.429E+03 1.429E+03 1.429E+03 Cs134 1.670E+02 3.107E+01 8.366E-06 4.311E-13 3.008E-42 Cs135 7.502E+02 7.515E+02 7.515E+02 7.515E+02 7.514E+02 Cs137 1.572E+03 1.401E+03 4.953E+02 1.560E+02 1.535E+00 Ba136 5.763E+01 5.923E+01 5.923E+01 5.923E+01 5.923E+01 Ba138 1.539E+03 1.539E+03 1.539E+03 1.539E+03 1.539E+03 La139 1.431E+03 1.431E+03 1.431E+03 1.431E+03 1.431E+03 Ce140 1.354E+03 1.396E+03 1.396E+03 1.396E+03 1.396E+03 Ce144 4.424E+02 5.202E+00 2.235E-17 0.000E+00 0.000E+00 Nd142 1.635E+01 1.642E+01 1.642E+01 1.642E+01 1.642E+01 Nd143 9.395E+02 9.752E+02 9.752E+02 9.752E+02 9.752E+02 Nd144 7.563E+02 1.194E+03 1.199E+03 1.199E+03 1.199E+03

NEA/NSC/R(2016)3
108
Table B.13. Results for fission products in assembly calculation (g/tHMI) (continued)
UNIPI MASSES OF FISSION PRODUCTS (grams/THM)
Nuclide Discharge 5 years 50 years 100 years 300 years Nd145 7.328E+02 7.332E+02 7.332E+02 7.332E+02 7.332E+02 Nd146 7.680E+02 7.680E+02 7.680E+02 7.680E+02 7.680E+02 Nd148 4.655E+02 4.655E+02 4.655E+02 4.655E+02 4.655E+02 Nd150 2.767E+02 2.767E+02 2.767E+02 2.767E+02 2.767E+02 Pm147 2.317E+02 6.524E+01 4.467E-04 8.158E-10 0.000E+00 Sm146 2.911E-03 3.172E-03 3.471E-03 3.472E-03 3.472E-03 Sm147 7.239E+01 2.515E+02 3.168E+02 3.168E+02 3.168E+02 Sm148 1.603E+02 1.657E+02 1.657E+02 1.657E+02 1.657E+02 Sm149 5.444E+00 7.747E+00 7.747E+00 7.747E+00 7.747E+00 Sm150 3.838E+02 3.838E+02 3.838E+02 3.838E+02 3.838E+02 Sm151 2.766E+01 2.713E+01 1.918E+01 1.305E+01 2.797E+00 Sm152 1.696E+02 1.696E+02 1.697E+02 1.697E+02 1.697E+02 Sm154 7.828E+01 7.828E+01 7.829E+01 7.829E+01 7.829E+01 Eu153 1.990E+02 2.010E+02 2.010E+02 2.010E+02 2.010E+02 Eu154 5.468E+01 3.653E+01 9.682E-01 1.714E-02 1.686E-09 Eu155 1.497E+01 7.135E+00 9.096E-03 5.529E-06 7.548E-19 Gd154 3.298E+00 2.144E+01 5.700E+01 5.795E+01 5.796E+01 Gd155 1.530E-01 7.982E+00 1.510E+01 1.511E+01 1.511E+01 Gd156 1.214E+02 1.295E+02 1.295E+02 1.295E+02 1.295E+02
Ho166m 5.073E-04 5.059E-04 4.928E-04 4.788E-04 4.266E-04

NEA/NSC/R(2016)3
109
Table B.14. Trends of relative standard deviation versus cooling time for FP masses
RSD Nuclide Discharge 5 years 50 years 100 years 300 years
Se79 4% 4% 4% 4% 4% Kr85 2% 2% 2% 2% 3% Rb85 3% 3% 3% 2% 2% Rb87 4% 4% 4% 4% 4% Sr88 4% 4% 4% 4% 4% Sr90 5% 5% 4% 4% 9%
Nb93m 196% 190% 89% 11% 6% Mo95 6% 6% 6% 6% 6% Mo97 6% 6% 6% 6% 6% Tc99 5% 5% 5% 5% 5%
Ru101 4% 4% 4% 4% 4% Ru106 7% 7% 224% 224% 200% Rh103 4% 4% 4% 4% 4% Pd107 4% 4% 4% 4% 4%
Ag108m 237% 237% 238% 239% 241% Ag109 14% 14% 14% 14% 14%
Ag110m 33% 33% 245% 224% 200% I127 5% 5% 5% 5% 5% I129 4% 4% 4% 4% 4%
Xe130 12% 12% 12% 12% 12% Xe131 6% 6% 6% 6% 6% Xe132 6% 6% 6% 6% 6% Xe134 7% 7% 7% 7% 7% Xe136 5% 5% 5% 5% 5% Cs133 4% 4% 4% 4% 4% Cs134 12% 12% 12% 220% 224% Cs135 3% 3% 3% 3% 3% Cs137 5% 5% 5% 5% 5% Ba136 23% 23% 23% 23% 23% Ba138 4% 4% 4% 4% 4% La139 3% 3% 3% 3% 3% Ce140 5% 5% 5% 5% 5% Ce144 7% 7% 236% 224% 200% Nd142 10% 10% 10% 10% 10% Nd143 3% 4% 4% 4% 4% Nd144 3% 5% 5% 5% 5% Nd145 4% 4% 4% 4% 4%

NEA/NSC/R(2016)3
110
Table B.14. Trends of relative standard deviation versus cooling time for FP masses (continued)
RSD Nuclide Discharge 5 years 50 years 100 years 300 years Nd146 5% 5% 5% 5% 5% Nd148 4% 4% 4% 4% 4% Nd150 4% 4% 4% 4% 4% Pm147 5% 5% 5% 198% 224% Sm146 98% 113% 125% 126% 126% Sm147 4% 4% 4% 4% 4% Sm148 9% 9% 9% 9% 9% Sm149 15% 16% 16% 16% 16% Sm150 8% 8% 8% 8% 8% Sm151 14% 14% 14% 14% 15% Sm152 13% 13% 13% 13% 13% Sm154 5% 5% 5% 5% 5% Eu153 4% 4% 4% 4% 4% Eu154 13% 13% 13% 14% 28% Eu155 21% 23% 38% 60% 245% Gd154 7% 12% 13% 13% 13% Gd155 18% 20% 21% 21% 21% Gd156 8% 9% 9% 9% 9%
Ho166m 150% 150% 150% 150% 150%
Table B.15. Results for activation products in assembly calculation (g/tHMI)
CEA Masses of Activation Products (g/tHM)
Nuclide Discharge 5 years 50 years 100 years 300 years Cl36 9.5553E-01 9.5552E-01 9.5542E-01 9.5531E-01 9.5487E-01 Ca41 1.6175E-01 1.6174E-01 1.6169E-01 1.6164E-01 1.6142E-01 Mn53 3.5896E-05 3.5896E-05 3.5896E-05 3.5895E-05 3.5894E-05 Mn54 1.0984E-02 1.9033E-04 2.6795E-20 6.5363E-38 0.0000E+00 Fe55 7.4691E-02 2.1035E-02 2.3441E-07 7.3567E-13 7.1367E-35 Fe60 7.0392E-06 7.0392E-06 7.0391E-06 7.0389E-06 7.0382E-06 Co60 1.0628E+00 5.5068E-01 1.4823E-03 2.0673E-06 2.4671E-11 Ni59 1.0897E+00 1.0896E+00 1.0892E+00 1.0887E+00 1.0867E+00 Ni63 2.1605E-01 2.0873E-01 1.5308E-01 1.0847E-01 2.7343E-02 Mo93 6.6484E-02 6.6427E-02 6.5911E-02 6.5342E-02 6.3116E-02

NEA/NSC/R(2016)3
111
Table B.16. Results for activation products in assembly calculation (g/tHMI)
NNL MASSES OF ACTIVATION PRODUCTS (g/tHM)
Nuclide Discharge 5 Years 50 Years 100 Years 300 Years Cl36 8.9076E-01 8.9075E-01 8.9066E-01 8.9055E-01 8.9015E-01 Ca41 1.4355E-01 1.4354E-01 1.4350E-01 1.4345E-01 1.4326E-01 Mn53 1.8336E-05 1.8336E-05 1.8336E-05 1.8336E-05 1.8335E-05 Mn54 1.7805E-02 3.0988E-04 4.5396E-20 1.1574E-37 - Fe55 1.0240E-01 2.8366E-02 2.7243E-07 7.2477E-13 3.6306E-35 Fe60 7.1911E-05 7.1911E-05 7.1911E-05 7.1910E-05 7.1909E-05 Co60 9.5058E-01 4.9230E-01 1.3193E-03 1.8312E-06 5.0436E-11 Ni59 1.0569E+00 1.0569E+00 1.0565E+00 1.0560E+00 1.0540E+00 Ni63 1.9126E-01 1.8474E-01 1.3525E-01 9.5645E-02 2.3920E-02 Mo93 7.2475E-02 7.2404E-02 7.1761E-02 7.1054E-02 6.8294E-02
Table B.17. Results for activation products in assembly calculation (g/tHMI)
GRS KENOREST MASSES OF ACTIVATION PRODUCTS (g/tHM)
Nuclide Discharge 5 Years 50 Years 100 Years 300 Years CL 36 8.7120E-01 8.7120E-01 8.7110E-01 8.7100E-01 8.7060E-01 CA 41 1.4950E-01 1.4940E-01 1.4940E-01 1.4930E-01 1.4910E-01 MN 53 4.5760E-08 4.5760E-08 4.5760E-08 4.5760E-08 4.5750E-08 MN 54 1.4940E-02 2.5980E-04 3.7780E-20
FE 55 8.5680E-02 2.4090E-02 2.6490E-07 8.1930E-13 FE 60 7.4440E-06 7.4440E-06 7.4440E-06 7.4440E-06 7.4430E-06
CO 60 1.0610E+00 5.4990E-01 1.4870E-03 2.0890E-06 2.6160E-11 NI 59 1.0030E+00 1.0030E+00 1.0020E+00 1.0020E+00 9.9990E-01 NI 63 1.9180E-01 1.8530E-01 1.3570E-01 9.5950E-02 2.4010E-02
MO 93 6.5430E-02 6.5360E-02 6.4780E-02 6.4150E-02 6.1660E-02

NEA/NSC/R(2016)3
112
Table B.18. Results for activation products in assembly calculation (g/tHMI)
KURCHATOV INSTITUT MASSES OF ACTIVATION PRODUCTS (g/ tHM)
Nuclide Discharge 5 years 50 years 100 years 300 years Cl36 9.3543E-01 9.3543E-01 9.3543E-01 9.3543E-01 9.3543E-01 Ca41 6.6280E-01 6.6280E-01 6.6280E-01 6.6280E-01 6.6280E-01 Mn53
Mn54 1.2762E-02 1.2620E-02 1.1422E-02 1.0214E-02 6.5527E-03 Fe55 1.0078E-01 1.0043E-01 9.7340E-02 9.4010E-02 8.1808E-02 Fe60
Co60 1.0682E+00 1.0663E+00 1.0491E+00 1.0304E+00 9.5889E-01 Ni59 1.4976E+00 1.4976E+00 1.4976E+00 1.4976E+00 1.4976E+00 Ni63 1.9604E-01 1.9604E-01 1.9580E-01 1.9568E-01 1.9485E-01 Mo93 6.7372E-02 6.7372E-02 6.7372E-02 6.7372E-02 6.7355E-02
Table B.19. Results for activation products in assembly calculation (g/tHMI)
UNIPI MASSES OF ACTIVATION PRODUCTS (grams/THM)
Nuclide Discharge 5 years 50 years 100 years 300 years Cl36 1.0370E+00 1.0370E+00 1.0370E+00 1.0370E+00 1.0370E+00 Ca41 1.7880E-01 1.7880E-01 1.7870E-01 1.7870E-01 1.7870E-01 Mn53* N/A N/A N/A N/A N/A Mn54 1.5150E-02 2.6260E-04 3.7030E-20 0.0000E+00 0.0000E+00 Fe55 9.4020E-02 2.6420E-02 2.8820E-07 8.8340E-13 0.0000E+00 Fe60* N/A N/A N/A N/A N/A Co60 1.2430E+00 6.4370E-01 1.7300E-03 2.4090E-06 9.0560E-18 Ni59 1.1970E+00 1.1970E+00 1.1970E+00 1.1960E+00 1.1940E+00 Ni63 2.2940E-01 2.2160E-01 1.6230E-01 1.1470E-01 2.8740E-02 Mo93 0.0000E+00 0.0000E+00 0.0000E+00 0.0000E+00 0.0000E+00
Table B.20. Trends of relative standard deviation versus cooling time for AP masses
RSD Nuclide Discharge 5 years 50 years 100 years 300 years
Cl36 8% 8% 8% 8% 8% Ca41 89% 89% 89% 89% 89% Mn53 99% 99% 99% 99% 99% Mn54 21% 173% 185% 167% 146% Fe55 15% 87% 185% 185% 167% Fe60 121% 121% 121% 121% 121% Co60 11% 40% 184% 185% 185% Ni59 20% 20% 20% 20% 20% Ni63 10% 9% 18% 39% 121% Mo93 61% 61% 61% 61% 61%

NEA/NSC/R(2016)3
113
Table B.21. Results for AP-FP in assembly calculation (g/tHMI)
CEA Masses of Fission & Activation Products(g/tHM)
nuclide discharge 5 years 50 years 100 years 300 years
H3 FP (fission) 6.3114E-02 4.7650E-02 3.7969E-03 2.2842E-04 2.9919E-09
AP (activation) 5.3051E-02 4.0052E-02 3.1915E-03 1.9200E-04 2.5148E-09
Be10 FP 1.1738E-02 1.1738E-02 1.1737E-02 1.1737E-02 1.1736E-02 AP 8.7808E-03 8.7807E-03 8.7806E-03 8.7804E-03 8.7796E-03
C14 FP 4.7089E-03 4.7060E-03 4.6803E-03 4.6520E-03 4.5402E-03 AP 7.9156E-02 7.9108E-02 7.8676E-02 7.8199E-02 7.6320E-02
Zr93 FP 5.7862E+02 5.7905E+02 5.7904E+02 5.7903E+02 5.7897E+02 AP 4.4442E+02 4.4472E+02 4.4471E+02 4.4470E+02 4.4466E+02
Nb94 FP 2.5041E-03 2.5037E-03 2.4998E-03 2.4955E-03 2.4782E-03 AP 1.2223E+00 1.2221E+00 1.2202E+00 1.2181E+00 1.2096E+00
Sn119m FP 1.2248E+00 1.6285E-02 3.0664E-10 4.4974E-11 1.3956E-13 AP 9.1721E-01 1.2196E-02 1.5843E-19 2.7365E-38 0.0000E+00
Sn121m FP 9.6988E-01 9.1065E-01 5.1649E-01 2.7504E-01 2.2119E-02 AP 6.7348E-01 6.3235E-01 3.5865E-01 1.9099E-01 1.5360E-02
Sn126 FP 5.2870E+01 5.2869E+01 5.2862E+01 5.2854E+01 5.2822E+01 AP 3.7848E+01 3.7848E+01 3.7843E+01 3.7837E+01 3.7814E+01
Sb125 FP 1.9979E+01 5.7451E+00 7.0579E-05 1.2229E-09 2.8862E-12 AP 1.4155E+01 4.0668E+00 4.9957E-05 1.7470E-10 2.6129E-32
H3 AP+FP 1.1617E-01 8.7702E-02 6.9884E-03 4.2042E-04 5.5067E-09 Be10 AP+FP 2.0519E-02 2.0519E-02 2.0518E-02 2.0517E-02 2.0516E-02 C14 AP+FP 8.3865E-02 8.3814E-02 8.3356E-02 8.2851E-02 8.0860E-02 Zr93 AP+FP 1.0230E+03 1.0238E+03 1.0238E+03 1.0237E+03 1.0236E+03 Nb94 AP+FP 1.2248E+00 1.2246E+00 1.2227E+00 1.2206E+00 1.2121E+00
Sn119m AP+FP 2.1420E+00 2.8481E-02 3.0664E-10 4.4974E-11 1.3956E-13 Sn121m AP+FP 1.6434E+00 1.5430E+00 8.7514E-01 4.6603E-01 3.7479E-02 Sn126 AP+FP 9.0718E+01 9.0717E+01 9.0705E+01 9.0691E+01 9.0636E+01 Sb125 AP+FP 3.4134E+01 9.8119E+00 1.2054E-04 1.3976E-09 2.8862E-12

NEA/NSC/R(2016)3
114
Table B.22. Results for AP-FP in assembly calculation (g/tHMI)
NNL MASSES OF FISSION AND ACTIVATION PRODUCTS (g/ tHM)
Nuclide
Discharge 5 Years 50 Years 100 Years 300 Years
H3 FP 7.114E-02 5.371E-02 4.279E-03 2.573E-04 3.367E-09 AP 5.971E-08 4.507E-08 3.591E-09 2.160E-10 2.826E-15
Be10 FP 1.312E-02 1.312E-02 1.312E-02 1.312E-02 1.312E-02 AP 1.747E-08 1.747E-08 1.747E-08 1.747E-08 1.747E-08
C14 FP 5.223E-03 5.219E-03 5.191E-03 5.160E-03 5.036E-03 AP 6.927E-02 6.923E-02 6.885E-02 6.844E-02 6.680E-02
Zr93 FP 6.329E+02 6.335E+02 6.335E+02 6.335E+02 6.334E+02 AP 1.930E-02 1.930E-02 1.930E-02 1.930E-02 1.929E-02
Nb94 FP 1.045E-02 1.045E-02 1.043E-02 1.041E-02 1.034E-02 AP 1.195E+00 1.194E+00 1.193E+00 1.191E+00 1.182E+00
Sn119m FP 1.268E-02 1.685E-04 2.180E-21 3.749E-40 - AP 5.871E-03 7.803E-05 1.010E-21 1.736E-40 -
Sn121m FP 1.071E+00 9.991E-01 5.354E-01 2.677E-01 1.673E-02 AP 4.014E-04 3.746E-04 2.007E-04 1.004E-04 6.271E-06
Sn126 FP 6.784E+01 6.784E+01 6.782E+01 6.780E+01 6.770E+01 AP 4.400E-06 4.400E-06 4.399E-06 4.397E-06 4.391E-06
Sb125
FP 3.413E+01 9.768E+00 1.057E-04 3.209E-10 2.730E-32
AP 2.390E-02 6.808E-03 7.365E-08 2.237E-13 1.902E-35
H3 AP+FP 7.114E-02 5.371E-02 4.279E-03 2.573E-04 3.367E-09 Be10 AP+FP 1.312E-02 1.312E-02 1.312E-02 1.312E-02 1.312E-02 C14 AP+FP 7.449E-02 7.445E-02 7.405E-02 7.360E-02 7.184E-02 Zr93 AP+FP 6.330E+02 6.335E+02 6.335E+02 6.335E+02 6.334E+02 Nb94 AP+FP 1.205E+00 1.205E+00 1.203E+00 1.201E+00 1.193E+00
Sn119m AP+FP 1.855E-02 2.465E-04 3.190E-21 5.485E-40 - Sn121m AP+FP 1.071E+00 9.994E-01 5.356E-01 2.678E-01 1.673E-02 Sn126 AP+FP 6.784E+01 6.784E+01 6.782E+01 6.780E+01 6.770E+01 Sb125 AP+FP 3.415E+01 9.775E+00 1.058E-04 3.212E-10 2.731E-32

NEA/NSC/R(2016)3
115
Table B.23. Results for AP-FP in assembly calculation (g/tHMI)
GRS KENOREST MASSES OF FISSION AND ACTIVATION PRODUCTS (g/ tHM)
Nuclide Discharge 5 Years 50 Years 100 Years 300 Years H3 0.081 0.06115 0.00487 0.0002929 3.829E-09
Be10 0.0001662 0.0001662 0.0001662 0.0001662 0.0001662 C14 0.09011 0.09006 0.08957 0.08903 0.0869 Zr93 643.8 644.3 644.3 644.3 644.2 Nb94 1.18 1.18 1.178 1.176 1.168
Sn119m 0.05491 0.0007322 9.757E-21 0 0 Sn121m 0.01306 0.01226 0.006956 0.003706 0.0002985 Sn126 46.62 46.61 46.61 46.6 46.57 Sb125 14.95 4.341 0.00005629 2.091E-10 0
Table B.24. Results for AP-FP in assembly calculation (g/tHMI)
GRS TRITON MASSES OF FISSION AND ACTIVATION PRODUCTS (g/ tHM)
Nuclide Discharge 5 Years 50 Years 100 Years 300 Years H3 0.08214899 0.06201517 0.0049416 0.00029729 3.8915E-09
Be10 0.01320739 0.01320739 0.01320739 0.01320739 0.01320739 C14 0.0325592 0.03254679 0.0323606 0.0321744 0.0314048 Zr93 618.413837 618.910355 618.910355 618.910355 618.910355 Nb94 1.14944041 1.14931628 1.14757847 1.14559239 1.13777223
Sn119m 0.16136852 0.0021462 1.2202E-09 2.1114E-28 0 Sn121m 0.4976357 0.46722394 0.26501677 0.14113539 0.01134793 Sn126 36.2086142 36.2086142 36.1962013 36.1837883 36.1341365 Sb125 15.1314024 4.30109182 4.6946E-05 1.4399E-10 5.0148E-30

NEA/NSC/R(2016)3
116
Table B.25. Results for AP-FP in assembly calculation (g/tHMI)
KURCHATOV INSTITUT MASSES OF FISSION AND ACTIVATION PRODUCTS (g/ tHM)
Nuclide
Discharge 5 years 50 years 100 years 300 years H3 FP 1.4806E-01 1.4795E-01 1.4694E-01 1.4581E-01 1.4141E-01
AP 1.5951E-10 1.5940E-10 1.5827E-10 1.5709E-10 1.5235E-10
Be10 FP 1.8001E-02 1.8001E-02 1.8001E-02 1.8001E-02 1.8001E-02
AP 3.1418E-06 3.1418E-06 3.1418E-06 3.1418E-06 3.1418E-06
C14 FP 7.2650E-02 7.2650E-02 7.2650E-02 7.2650E-02 7.2650E-02
AP 9.2497E-02 9.2497E-02 9.2497E-02 9.2497E-02 9.2471E-02
Zr93 FP 6.1357E+02 6.1410E+02 6.1410E+02 6.1410E+02 6.1410E+02
AP 1.9094E-02 1.9094E-02 1.9094E-02 1.9094E-02 1.9094E-02
Nb94 FP 1.3326E-03 1.3326E-03 1.3326E-03 1.3326E-03 1.3326E-03
AP 1.3135E+00 1.3135E+00 1.3135E+00 1.3135E+00 1.3135E+00
Sn119m FP 1.7054E-01 1.6852E-01 1.5152E-01 1.3463E-01 8.3881E-02
AP 8.7103E-02 8.6073E-02 7.7392E-02 6.8756E-02 4.2847E-02
Sn121m FP 7.0617E-02 7.0617E-02 7.0503E-02 7.0389E-02 6.9889E-02
AP 4.1474E-04 4.1451E-04 4.1405E-04 4.1314E-04 4.1041E-04
Sn126 FP 4.4301E+01 4.4301E+01 4.4301E+01 4.4301E+01 4.4301E+01
AP 1.2546E-05 1.2546E-05 1.2546E-05 1.2546E-05 1.2546E-05
Sb125 FP 1.5554E+01 1.5570E+01 1.5244E+01 1.4729E+01 1.2818E+01
AP 3.6499E-02 3.6687E-02 3.6217E-02 3.4995E-02 3.0459E-02
H3 AP+FP 1.4806E-01 1.4795E-01 1.4694E-01 1.4581E-01 1.4141E-01 Be10 AP+FP 1.8004E-02 1.8004E-02 1.8004E-02 1.8004E-02 1.8004E-02 C14 AP+FP 1.6515E-01 1.6515E-01 1.6515E-01 1.6515E-01 1.6512E-01 Zr93 AP+FP 6.1359E+02 6.1412E+02 6.1412E+02 6.1412E+02 6.1412E+02 Nb94 AP+FP 1.3148E+00 1.3148E+00 1.3148E+00 1.3148E+00 1.3148E+00
Sn119m AP+FP 2.5764E-01 2.5460E-01 2.2891E-01 2.0338E-01 1.2673E-01 Sn121m AP+FP 7.1031E-02 7.1031E-02 7.0917E-02 7.0802E-02 7.0299E-02 Sn126 AP+FP 4.4301E+01 4.4301E+01 4.4301E+01 4.4301E+01 4.4301E+01 Sb125 AP+FP 1.5590E+01 1.5607E+01 1.5280E+01 1.4764E+01 1.2849E+01
Note: Some of these nuclides, notably 3H, 14C, 121mSn and 125Sb do not show the expected decay behaviour, suggesting that some data in this table have been corrupted. The Kurchatov calculations for rod Q17 show more plausible decay behaviour (see Tables A.19-A.23), suggesting that these anomalies stem from errors in the data processing.

NEA/NSC/R(2016)3
117
Table B.26. Results for AP-FP in assembly calculation (g/tHMI)
UNIPI MASSES OF FISSION AND ACTIVATION PRODUCTS (grams/THM)
nuclide
Discharge 5 years 50 years 100 years 300 years H3 FP (fission) 8.1790E-02 6.1750E-02 4.9190E-03 2.9590E-04 3.8750E-09
AP(activation) 7.6310E-07 5.7610E-07 4.5900E-08 2.7610E-09 3.6150E-14
Be10 FP 1.3160E-02 1.3160E-02 1.3160E-02 1.3160E-02 1.3160E-02
AP 8.6920E-05 8.6920E-05 8.6920E-05 8.6910E-05 8.6910E-05
C14 FP 3.5870E-02 3.5850E-02 3.5650E-02 3.5440E-02 3.4590E-02
AP 7.6750E-02 7.6700E-02 7.6280E-02 7.5820E-02 7.4010E-02
Zr93 FP 6.1850E+02 6.1900E+02 6.1900E+02 6.1900E+02 6.1900E+02
AP 0.0000E+00 0.0000E+00 0.0000E+00 0.0000E+00 0.0000E+00
Nb94 FP 1.3900E+00 1.3900E+00 1.3870E+00 1.3850E+00 1.3760E+00
AP 0.0000E+00 0.0000E+00 0.0000E+00 0.0000E+00 0.0000E+00
Sn119m FP 1.7650E+01 1.7800E+01 1.7800E+01 1.7800E+01 1.7800E+01
AP 0.0000E+00 0.0000E+00 0.0000E+00 0.0000E+00 0.0000E+00
Sn121m FP 1.6120E-02 2.0390E-05 1.1560E-05 6.1560E-06 4.9500E-07
AP 0.0000E+00 0.0000E+00 0.0000E+00 0.0000E+00 0.0000E+00
Sn126* FP 3.6280E+01 3.6280E+01 3.6260E+01 3.6250E+01 3.6200E+01
AP N/A N/A N/A N/A N/A
Sb125 FP 1.5180E+01 4.3150E+00 4.7090E-05 1.4440E-10 0.0000E+00
AP 0.0000E+00 0.0000E+00 0.0000E+00 0.0000E+00 0.0000E+00
H3 AP+FP 8.1791E-02 6.1751E-02 4.9190E-03 2.9590E-04 3.8750E-09 Be10 AP+FP 1.3247E-02 1.3247E-02 1.3247E-02 1.3247E-02 1.3247E-02 C14 AP+FP 1.1262E-01 1.1255E-01 1.1193E-01 1.1126E-01 1.0860E-01 Zr93 AP+FP 6.1850E+02 6.1900E+02 6.1900E+02 6.1900E+02 6.1900E+02 Nb94 AP+FP 1.3900E+00 1.3900E+00 1.3870E+00 1.3850E+00 1.3760E+00
Sn119m AP+FP 1.7650E+01 1.7800E+01 1.7800E+01 1.7800E+01 1.7800E+01 Sn121m AP+FP 1.6120E-02 2.0390E-05 1.1560E-05 6.1560E-06 4.9500E-07 Sn126 AP+FP 3.6280E+01 3.6280E+01 3.6260E+01 3.6250E+01 3.6200E+01 Sb125 AP+FP 1.5180E+01 4.3150E+00 4.7090E-05 1.4440E-10 0.0000E+00

NEA/NSC/R(2016)3
118
Table B.27. Trends of relative standard deviation versus cooling time for AP-FP masses
RSD
Nuclide
Discharge 5 years 50 years 100 years 300 years H3 AP+FP 30% 45% 201% 242% 245%
Be10 AP+FP 54% 54% 54% 54% 54% C14 AP+FP 47% 47% 48% 48% 49% Zr93 AP+FP 24% 24% 24% 24% 24% Nb94 AP+FP 7% 7% 7% 7% 7%
Sn119m AP+FP 208% 240% 241% 242% 222% Sn121m AP+FP 122% 123% 120% 114% 119% Sn126 AP+FP 40% 40% 40% 40% 40% Sb125 AP+FP 45% 57% 245% 245% 245%
Table B.28. Results for Neutronic emission rate in assembly calculation
CEA DARWIN
NEUTRON EMISSION RATE (neutrons/s/tHM)
discharge 5 years 50 years 100 years 300 years
(alpha, n) emission rate 8.3018E+08 5.0353E+07 3.6079E+07 2.8818E+07 1.7822E+07 Spontaneous Fission emission rate 7.8195E+09 3.5396E+09 6.5972E+08 1.3112E+08 3.9039E+07
Total emission rate 8.6497E+09 3.5900E+09 6.9580E+08 1.5994E+08 5.6860E+07
Table B.29. Results for neutronic emission rate in assembly calculation
NNL
NEUTRON EMISSION RATE (neutrons/s/ tHM) Nuclide Discharge 5 Years 50 Years 100 Years 300 Years
(α,n) emission rate 9.075E+08 4.885E+07 3.389E+07 2.678E+07 1.646E+07 Spontaneous Fission emission rate 8.803E+09 3.794E+09 7.174E+08 1.473E+08 4.674E+07
Total emission rate 9.711E+09 3.843E+09 7.513E+08 1.741E+08 6.320E+07
Table B.30. Results for neutronic emission rate in assembly calculation
GRS KENOREST
NEUTRON EMISSION RATE (neutrons/s/ tHM) Nuclide Discharge 5 Years 50 Years 100 Years 300 Years
(alpha,n) 9.9060E+08 5.7930E+07 3.8280E+07 2.9830E+07 1.8290E+07 spont. Fission (N/s) 1.0010E+10 4.3790E+09 8.2300E+08 1.6330E+08 4.7070E+07
total n emission (N/s) 1.1000E+10 4.4370E+09 8.6120E+08 1.9310E+08 6.5350E+07

NEA/NSC/R(2016)3
119
Table B.31. Results for neutronic emission rate in assembly calculation
KURCHATOV INSTITUT
NEUTRON EMISSION RATE (neutrons/ s/ tHM)
Discharge 5 years 50 years 100 years 300 years
(a,n) emission rate 9.1803E+08 9.0082E+08 7.5362E+08 6.2002E+08 2.9710E+08 Spontaneous Fission emission rate 9.3628E+09 9.2849E+09 8.5229E+09 7.8265E+09 6.1046E+09
Total emission rate 1.0281E+10 1.0186E+10 9.2765E+09 8.4466E+09 6.4017E+09
Table B.32. Results for neutronic emission rate in assembly calculation
UNIPI
NEUTRON ENISSION RATE (neutrons/s/THM)
Discharge 5 years 50 years 100 years 300 years
(α,n) emission rate 8.5960E+08 5.4800E+07 3.5240E+07 2.7300E+07 1.6840E+07 Spontaneous Fission emission rate 9.6200E+09 4.6630E+09 8.8290E+08 1.8350E+08 6.0300E+07
Total emission rate 9.7060E+09 4.6680E+09 8.8640E+08 1.8620E+08 6.1980E+07
Table B.33. Trends of relative standard deviation versus cooling time for neutronic emission rate
RSD
Discharge 5 years 50 years 100 years 300 years
(α,n) emission rate 6% 136% 139% 140% 136% Spontaneous Fission emission rate 50% 72% 129% 149% 152%
Total emission rate 50% 75% 129% 148% 152%
Table B.34. Results for decay heat in assembly calculation (CEA)
CEA DARWIN DECAY HEAT(Watts/tHM)
Discharge 5 years 50 years 100 years 300 years
Alpha decay heat 2.45405E+04 1.77916E+03 1.35209E+03 1.09901E+03 6.89135E+02 Beta decay heat 1.45664E+06 9.34590E+02 1.44469E+02 4.77642E+01 4.63714E+00
Gamma decay heat 1.23722E+06 7.88030E+02 1.33582E+02 4.42540E+01 3.20815E+00 Total decay heat 2.71840E+06 3.50178E+03 1.63014E+03 1.19102E+03 6.96981E+02

NEA/NSC/R(2016)3
120
Table B.35. Results for decay heat in assembly calculation (NNL)
NNL DECAY HEAT (Watts/ tHM)
Discharge 5 years 50 years 100 years 300 years Alpha decay heat 5.940E+04 1.866E+03 1.381E+03 1.113E+03 6.943E+02 Beta decay heat 1.844E+06 1.056E+03 1.604E+02 5.300E+01 4.790E+00
Gamma decay heat 1.682E+06 8.969E+02 1.464E+02 4.816E+01 3.394E+00 Total decay heat 3.586E+06 3.819E+03 1.688E+03 1.215E+03 7.025E+02
Table B.36. Results for decay heat in assembly calculation (GRS KENOREST)
GRS KENOREST DECAY HEAT (Watts/ tHM)
Discharge 5 years 50 years 100 years 300 years Alpha decay heat (W) 2.2290E+04 1.7870E+03 1.2080E+03 9.4990E+02 5.9030E+02 Beta decay heat (W) 1.5610E+06 9.5960E+02 1.3240E+02 4.0140E+01 6.7090E-01
Gamma decay heat (W) 1.1440E+06 8.9930E+02 1.3250E+02 4.3050E+01 2.0330E+00 Total decay heat (W) 2.6780E+06 3.3430E+03 1.0890E+03 6.8160E+02 3.6380E+02
Table B.37. Results for decay heat in assembly calculation (KURCHATOV)
KURCHATOV INSTITUT DECAY HEAT (Watts/ tHM)
Discharge 5 years 50 years 100 years 300 years
Alpha decay heat 2.7729E+04 2.7334E+04 2.2916E+04 1.8903E+04 9.2100E+03 Beta decay heat 1.6876E+06 7.2338E+04 2.9722E+04 2.2944E+04 1.3201E+04
Gamma decay heat 1.6735E+06 9.8585E+04 2.5928E+04 1.5195E+04 4.6388E+03 Total decay heat 3.3888E+06 1.9826E+05 7.8567E+04 5.7043E+04 2.7049E+04

NEA/NSC/R(2016)3
121
Table B.38. Results for decay heat in assembly calculation (UNIPI)
UNIPI DECAY HEAT (Watts/THM)
Discharge 5 years 50 years 100 years 300 years Alpha decay heat N/A N/A N/A N/A N/A Beta decay heat N/A N/A N/A N/A N/A
Gamma decay heat 1.7550E+06 9.4900E+02 1.5160E+02 5.0010E+01 3.5560E+00 Total decay heat 3.6240E+06 4.1200E+03 1.7490E+03 1.2400E+03 7.2170E+02
Table B.39. Trends of relative standard deviation versus cooling time for decay heat
RSD
Discharge 5 years 50 years 100 years 300 years
Alpha decay heat 48% 113% 115% 104% 9% Beta decay heat 86% 126% 135% 136% 69%
Gamma decay heat 84% 126% 134% 134% 26% Total decay heat 84% 122% 128% 125% 33%