movingwithbubbles:areviewoftheinteractionsbetweenbubbles ...areviewoftheinteractionsbetweenbubbles...
TRANSCRIPT
SYMPOSIUM
Moving with Bubbles: A Review of the Interactions between Bubblesand the Microorganisms that Surround themPeter L. L. Walls,* James C. Bird1,* and Lydia Bourouiba1,†
*Boston University, 730 Commonwealth Avenue, Boston, MA 02215, USA; †Massachusetts Institute of Technology,
77 Massachusetts Avenue, Cambridge, MA 02139, USA
From the symposium ‘‘Shaking, Dripping, and Drinking: Surface Tension Phenomena in Organismal Biology’’ presented
at the annual meeting of the Society for Integrative and Comparative Biology, January 3–7, 2014 at Austin, Texas.
1E-mail: [email protected]; [email protected]
Synopsis Bubbles are ubiquitous in biological environments, emerging during the complex dynamics of waves breaking
in the open oceans or being intentionally formed in bioreactors. From formation, through motion, until death, bubbles
play a critical role in the oxygenation and mixing of natural and artificial ecosystems. However, their life is also greatly
influenced by the environments in which they emerge. This interaction between bubbles and microorganisms is a subtle
affair in which surface tension plays a critical role. Indeed, it shapes the role of bubbles in mixing or oxygenating
microorganisms, but also determines how microorganisms affect every stage of the bubble’s life. In this review, we guide
the reader through the life of a bubble from birth to death, with particular attention to the microorganism–bubble
interaction as viewed through the lens of fluid dynamics.
Introduction
The Red tide events associated with algal blooms are
among the first examples of phenomena in which
bioaerosols were linked to oceanic bursting bubbles.
To form the link, Woodcock (1948) sprayed aerosol-
ized seawater containing marine microorganisms into
the nose and throat of volunteers, who subsequently
developed symptoms of respiratory irritation analo-
gous to those observed in residents of shorelines.
Such correlation effectively solidified the earlier hy-
pothesis on the role of bubbles in the creation of
marine aerosols (Stuhlman 1932; Jacobs 1937;
Woodcock et al. 1953).
In subsequent years, sea spray aerosols have been
shown to originate mostly from the bubbles within
the foam generated by breaking waves (Boyce 1951;
Blanchard 1963) (Fig. 1a). Diseases associated with
bursting bubbles are now linked to various patho-
gen-bearing pools of water such as recreational
swimming pools (Falkinham III 2003), hot tubs
(Parker et al. 1983; Embil et al. 1997), or wastewater
treatment plants (Laitinen et al. 1994; Bauer et al.
2002). Bubbles are, in fact, ubiquitous in biology
(Bourouiba and Bush 2012), being responsible for
mixing and aeration in the upper layer of the
ocean (Blanchard 1989) and for cell mortality in bio-
reactors from the direct injection of aeration gas (re-
ferred to as sparging) (Barbosa et al. 2003; Hu et al.
2011; Murhammer and Goochee 1990; Chisti 2000)
and rupture at the surface, for example.
Although bubbles play an important role in a va-
riety of biological systems, our review highlights the
physical processes shaping the life of a bubble and its
interaction with its biological environment: from its
birth in the fluid bulk to its rupture at the fluid
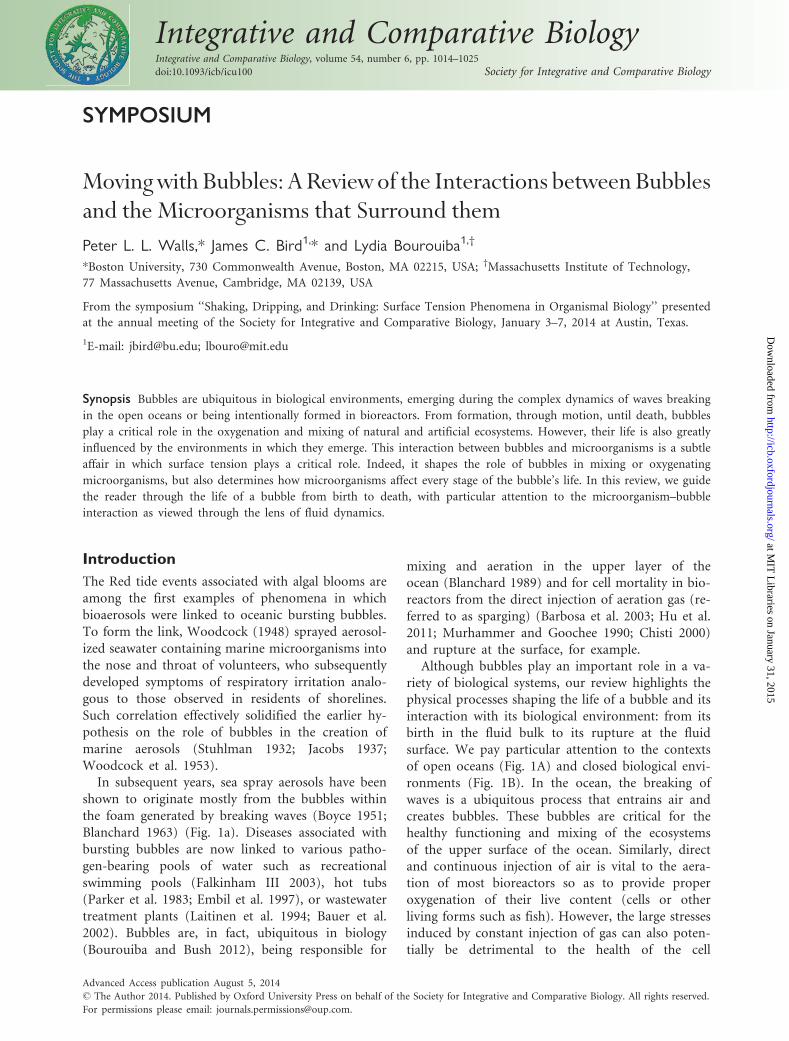
surface. We pay particular attention to the contexts
of open oceans (Fig. 1A) and closed biological envi-
ronments (Fig. 1B). In the ocean, the breaking of
waves is a ubiquitous process that entrains air and
creates bubbles. These bubbles are critical for the
healthy functioning and mixing of the ecosystems
of the upper surface of the ocean. Similarly, direct
and continuous injection of air is vital to the aera-
tion of most bioreactors so as to provide proper
oxygenation of their live content (cells or other
living forms such as fish). However, the large stresses
induced by constant injection of gas can also poten-
tially be detrimental to the health of the cell
Integrative and Comparative BiologyIntegrative and Comparative Biology, volume 54, number 6, pp. 1014–1025
doi:10.1093/icb/icu100 Society for Integrative and Comparative Biology
Advanced Access publication August 5, 2014
� The Author 2014. Published by Oxford University Press on behalf of the Society for Integrative and Comparative Biology. All rights reserved.
For permissions please email: [email protected].
at MIT
Libraries on January 31, 2015
http://icb.oxfordjournals.org/D
ownloaded from
populations (e.g., Garcia-Briones and Chalmers 1994;
Liu et al. 2013)
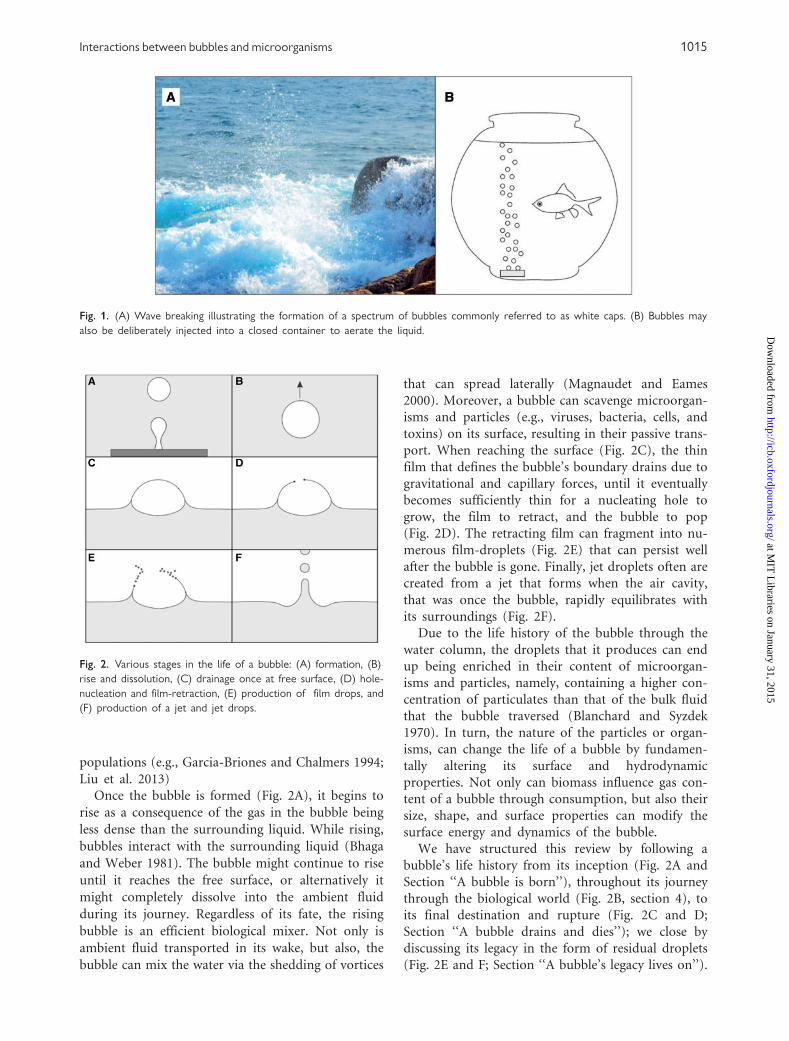
Once the bubble is formed (Fig. 2A), it begins to
rise as a consequence of the gas in the bubble being
less dense than the surrounding liquid. While rising,
bubbles interact with the surrounding liquid (Bhaga
and Weber 1981). The bubble might continue to rise
until it reaches the free surface, or alternatively it
might completely dissolve into the ambient fluid
during its journey. Regardless of its fate, the rising
bubble is an efficient biological mixer. Not only is
ambient fluid transported in its wake, but also, the
bubble can mix the water via the shedding of vortices
that can spread laterally (Magnaudet and Eames
2000). Moreover, a bubble can scavenge microorgan-
isms and particles (e.g., viruses, bacteria, cells, and
toxins) on its surface, resulting in their passive trans-
port. When reaching the surface (Fig. 2C), the thin
film that defines the bubble’s boundary drains due to
gravitational and capillary forces, until it eventually
becomes sufficiently thin for a nucleating hole to
grow, the film to retract, and the bubble to pop
(Fig. 2D). The retracting film can fragment into nu-
merous film-droplets (Fig. 2E) that can persist well
after the bubble is gone. Finally, jet droplets often are
created from a jet that forms when the air cavity,
that was once the bubble, rapidly equilibrates with
its surroundings (Fig. 2F).
Due to the life history of the bubble through the
water column, the droplets that it produces can end
up being enriched in their content of microorgan-
isms and particles, namely, containing a higher con-
centration of particulates than that of the bulk fluid
that the bubble traversed (Blanchard and Syzdek
1970). In turn, the nature of the particles or organ-
isms, can change the life of a bubble by fundamen-
tally altering its surface and hydrodynamic
properties. Not only can biomass influence gas con-
tent of a bubble through consumption, but also their
size, shape, and surface properties can modify the
surface energy and dynamics of the bubble.
We have structured this review by following a
bubble’s life history from its inception (Fig. 2A and
Section ‘‘A bubble is born’’), throughout its journey
through the biological world (Fig. 2B, section 4), to
its final destination and rupture (Fig. 2C and D;
Section ‘‘A bubble drains and dies’’); we close by
discussing its legacy in the form of residual droplets
(Fig. 2E and F; Section ‘‘A bubble’s legacy lives on’’).
Fig. 1. (A) Wave breaking illustrating the formation of a spectrum of bubbles commonly referred to as white caps. (B) Bubbles may
also be deliberately injected into a closed container to aerate the liquid.
Fig. 2. Various stages in the life of a bubble: (A) formation, (B)
rise and dissolution, (C) drainage once at free surface, (D) hole-
nucleation and film-retraction, (E) production of film drops, and
(F) production of a jet and jet drops.
Interactions between bubbles and microorganisms 1015
at MIT
Libraries on January 31, 2015
http://icb.oxfordjournals.org/D
ownloaded from

We aim at presenting these events to an audience
that may be less familiar with the concepts of surface
tension and fluid mechanics in general and so start
by introducing such general concepts in Section
‘‘Origin and relevance of capillarity’’.
Origin and relevance of capillarity
When two fluids are immiscible, such as water and
air, the molecules in each fluid are more attracted to
like molecules than to the other type. The conse-
quence of this difference in attraction is that work
is required to increase the surface area at the inter-
face of the two fluids. The amount of energy �E
needed to increase the surface area by �A is deter-
mined by the surface tension �, such that
�E ¼ ��A. Therefore, surface tension can be inter-
preted as energy per unit area, or force per unit
length. In this review, forces resulting from surface
tension will be referred to as capillary forces, or
capillarity.
A spherical bubble with radius R has been sche-
matically split apart in Fig. 3. Surface tension can be
interpreted as the amount of tension being applied
to the surface; thus, if a force balance were drawn
over half of the bubble, the surface tension would
manifest itself as a tangential force per unit length
acting along the bubble’s perimeter (leftward arrows
in Fig. 3). If the bubbles were in mechanical equilib-
rium, the balance of forces implies that there must
be a pressure P pushing back against the internal
face of the bubble (rightward arrows in Fig. 3).
Specifically, the product of the perimeter 2�R and
the average surface tension � must be equal to the
product of the area �R2 and this pressure P. This
force balance leads to P ¼ 2�=R, highlighting that
the inner pressure of the bubble is higher than that
outside by a capillary pressure value P that increases
with surface tension and decreases with radius. In
other words, for the same surface tension � a small
bubble would have a higher inner pressure than a
larger bubble. For the same radius R a bubble
made of an interface with a higher surface tension
� would have a higher inner pressure than that with
a lower surface-tension interface.
Surface tension can also vary spatially due to ther-
mal or chemical gradients. For example, certain bac-
teria are known to excrete surfactants that locally
reduce surface tension (e.g., Angelini et al. 2009). A
gradient of surface tension can thus be generated,
resulting in a reactive motion on such an interface.
Such motion, referred to as Marangoni flow
(Marangoni 1865; Scriven and Sternling 1960) is di-
rected from low � low to high �high regions of surface
tension; thus redistributing surfactants and effectively
opposing the mechanism of generating a gradient of
surfactant (Berg et al. 1966; Hosoi and Bush 2001).
In Fig. 3 the concentration of surfactants is higher at
the bottom of the bubble than at the top. The force
balance illustrates that a torque or moment is then
generated, resulting in a tangential stress (Clift et al.
1978). At equilibrium, this Marangoni stress is coun-
tered by an equal and opposite applied stress � (as
shown Fig. 3).
In general, elements of a bubble are dynamic
rather than static. This motion is governed by
Newton’s second law, which can be re-expressed in
the form of the classical Navier–Stokes equation
when accounting for the fluid forces involved:
�@u
@tþ u � ru
� �¼ �rp þ �r2uþ��g: ð1Þ
Here u is the velocity, t is time, and g is the
gravitational acceleration. Other parameters include
� and �, which are the density and dynamic viscos-
ity, respectively, and vary with the phase of the fluid.
The difference in the density of gas in the bubble and
the density of the surrounding fluid is denoted by
��:The left-hand side of Equation (1) is the expanded
expression of the mass times acceleration for a unit
volume; whereas the right-hand side is the expression
of the sum of the forces acting on such unit volume.
When physically modeling drops or bubbles, surface
tension enters into the pressure term, which is the
first term on the right-hand side of Equation (1).
Specifically, the surface tension and curvature
Fig. 3 Illustration of the balance of capillary force and internal
pressure force. � represents the interfacial stress acting on the
bubble’s surface resulting from the fluid’s resistance to the bub-
ble’s motion. The imbalance of the surface tensions �high and � low
will cause a motion of the interface known as Marangoni flow in
an attempt to restore balance.
1016 P. L. L. Walls et al.
at MIT
Libraries on January 31, 2015
http://icb.oxfordjournals.org/D
ownloaded from

directly influence the local pressure, as illustrated in
Fig. 3.
For all equations governing physical systems, the
dimensions of each term need to be equivalent. It is
helpful in both physical and mathematical analysis to
non-dimensionalize the equations of motion. This is
particularly true in fluid dynamics where the use of
dimensionless parameters can also give insight into
the physical processes taking place. The relevant di-
mensionless groups naturally emerge when non-
dimensionalizing Equation (1). This process involves
first identifying characteristic length-scale L, time-
scale or velocity-scale uc. Each variable is then non-
dimensionalized. For example, the dimensional
length variable x (or y or z) can be normalized by
a characteristic length-scale L, leading to a non-
dimensional length variable ~x ¼ x=L. A characteristic
length-scale (time, pressure, or velocity, etc.) is that
which is relevant to describe the physical dynamics.
For example, the characteristic length-scale at which
the Earth’s rotation becomes important in influenc-
ing the atmospheric fluid motion is on the order of
1000 km. Below such characteristic length-scale, the
effects of the Earth’s rotation are negligible. In par-
ticular, this is why, contrary to popular beliefs, the
direction of the rotation of water draining from a
sink—occurring on a length-scale of centimeters—
is not different in the northern and southern hemi-
spheres. It is important to start by identifying the
characteristic length and time scales of a problem
in fluids. Once identified, non-dimensional variables
can be constructed. Here, we follow the convention
of denoting non-dimensional variables with a tilde,
We can construct a non-dimensional velocity
~u ¼ u=uc and time ~� ¼ uct=L. As surface tension
influences the pressure, a natural choice for the char-
acteristic pressure is the capillary pressure, such that~p ¼ pL=�. Rewriting Equation (1) in terms of these
non-dimensional variables with the pressure term
pre-factor of unity leads to
We@ ~u
@�þ ~u � ~r ~u
� �¼ � ~r ~p þ Ca ~r
2~u þ Boz; ð2Þ
where three dimensionless parameters emerge. The
Weber number We ¼ �u2c L=� quantifies the relative
importance of inertial and capillary forces. The cap-
illary number Ca ¼ �uc=� quantifies the relative im-
portance of viscous and capillary forces and the
Bond number
Bo ¼ ��gL2=� ð3Þ
quantifies the relative importance of gravitational
and capillary forces. Furthermore, if one or more
of these dimensionless parameters is significantly
smaller than the others, those terms in Equation
(2) do not contribute significantly to the dominant
dynamics; thus can be dropped, thereby simplifying
the first-order analysis.
Perhaps, the best known dimensionless number in
fluid mechanics is the Reynolds number
Re ¼ �ucL=�; ð4Þ
which quantifies the relative balance of inertial and
viscous effects. Quick inspection reveals that the
Weber and capillary numbers can be related to the
Reynolds number by We=Ca ¼ Re.
In some interfacial flows, the characteristic velocity
is not imposed, but instead is established, based on a
balance of underlying forces. For example, when cap-
illary and inertial forces balance We ¼ 1, which
occurs when uc ¼ffiffiffiffiffiffiffiffiffiffiffi�=�Lp
. Substituting this charac-
teristic velocity into Equation (4) yields the
Ohnesorge number Oh ¼ �=ffiffiffiffiffiffiffiffi��Lp
, a number that
quantifies the relative importance of viscous and
inertial effects in capillary flows. In this case,
Equation (2) reduces to
@ ~u
@�þ ~u � ~r ~u ¼ � ~r ~p þOh ~r
2~u þ Boz: ð5Þ
Here, the flow regime is determined by two di-
mensionless parameters: Oh and Bo.
The subsequent sections rely on the physical
framework above to describe the interactions be-
tween a bubble and its surrounding biological envi-
ronment. Throughout a bubble’s life, the capillary
forces can attract, stress, and disperse surrounding
biomaterial. Similarly, this biomaterial can modify
the capillary forces through, for example, producing
or acting as a surfactant. When appropriate, our dis-
cussion will incorporate the concepts outlined in
Fig. 3 and the dimensionless numbers presented in
this section.
A bubble is born
Bubbles are ubiquitous across natural bodies of
water, such as ponds, lakes, and oceans. These bub-
bles may be formed in any process that breaks the
interface and entrains air into the water (Blanchard
1989), including rainfalls, snowfalls, and breaking
waves. Here, we focus on breaking waves, as they
are more common than rainfalls and snowfalls
around the globe. Waves not only break at the
shore (Fig. 1A), but also in the middle of the
ocean when wind speeds are high enough to desta-
bilize the surface waves [typically above 3 m=s
(Blanchard 1963; Monahan 1971)]. The breaking
Interactions between bubbles and microorganisms 1017
at MIT
Libraries on January 31, 2015
http://icb.oxfordjournals.org/D
ownloaded from

and the formation of whitecaps dissipate surface-
wave energy and generate the mixing of gas and bio-
material via turbulence and bubble-entrainment
(Melville 1996). Typically, whitecaps consist of a
myriad of small bubbles rising to the surface. The
size of such bubbles is estimated to range from mi-
crometers to centimeters (Blanchard Woodcock
1957; Baldy and Bourguel 1987; Deane and Stokes
2002). Recent studies examined the spectrum of
bubble-sizes (number of bubbles per meter cube
per micrometer radius increment) generated early
in the breaking of a wave and found two power-
law scaling. The transition between these two scalings
occurs at R � 1 mm in seawater and is related to the
level of the rate of dissipation of turbulence. Small
bubbles are subject to the stabilization of surface
tension and scale as R�3=2, whereas larger bubbles
are subject to turbulence and shear, leading to fre-
quent breakups that scale as R�10=3 (Deane and
Stokes 2002).
In artificial bodies of water, bubbles are created
for aeration. Although other options for maintaining
dissolved gas levels of oxygen and carbon dioxide
(e.g., surface aeration) are available in small-scale
bioreactors, direct injection of gas is essential when
production scales are involved. Yet, there are some
undesirable consequences; sparging has been shown
in recent studies to have detrimental effects on cells
near the region of bubble formation (Barbosa et al.
2003; Zhu et al. 2008; Liu et al. 2013). A widely used
scalar parameter for quantifying cell damage in in-
compressible Newtonian fluids is the energy-dissipa-
tion rate " (Liu et al. 2013). Ma et al. (2002)
examined a variety of cells of industrial relevance
and found that energy-dissipation rates of
10–100 W=cm3 caused as many as 20% of the more
sensitive cells to be damaged, specifically the mam-
malian cells which lack a protective cell wall. Such
values are orders of magnitude higher than those
achieved in a mixed tank (Wernersson and
Tragardh 1999), but are comparable with the
energy dissipation of small bursting bubbles
(Boulton-Stone and Blake 1993). Following the
method of Cherry and Hulle (1992) we can estimate
the energy dissipation as:
" ¼1
�r2rim
2�3
�h
� �1=2
with rrim the radius of the retracting rim and h the
bubble thickness (see Section ‘‘A bubble drains
and dies’’). For example, a water bubble with a
radius of 1 mm and thickness of 10 �m yields
an energy dissipation of 52 W=cm3. While excessive
hydrodynamic stresses are agreed to be one of the
main causes for cell damage (Tramper et al. 1986;
Garcia-Briones and Chalmers 1994), no model is able
to relate the hydrodynamic forces to lethal and non-
lethal cell effects (Hu et al. 2011).
In sparged systems, the formation of a bubble
occurs at an orifice via a complex process depending
on the fluid’s properties, the orifice’s geometry, and
the conditions of the surrounding flow (Kumar and
Kuloor 1970; Miyahara and Hayashino 1995;
Thoroddsen et al. 2007). However, in the simple
case of slow injection of gas into a stagnant fluid
we can approximate the bubble’s radius by balanc-
ing the capillary Fc ¼ 2�r0� and buoyancy forces
Fb ¼43���gR3. By setting Bo ¼ 1 based on the ori-
fice’s radius (r0 in Fig. 4) the resulting radius of
the bubble becomes R ¼ 1:14r0 � lc; in which lc ¼ffiffiffiffiffiffiffiffiffiffiffiffiffiffi�=��g
pis the capillary length. The capillary length
is the length scale at which gravitational and capillary
effects are effectively balanced. For air bubbles sur-
rounded by water, or alternatively water droplets sur-
rounded by air, the capillary length is lc � 2 mm.
As in stirred bioreactors, in most environments,
the fluid surrounding bubbles is not stagnant but
instead flows over the bubble-generating orifice
(Fig. 4). This cross-flow exerts an additional force
on the bubble leading to a shift of its detachment
from being buoyancy-dominated to shear dominated.
This shearing force will encourage early detachment
from the orifice, resulting in smaller bubbles being
produced more frequently than in the case of stag-
nant fluid. Not only does a cross-flow reduce the size
of bubbles exiting from a single orifice, but it also
reduces the frequency of coalescence among adjacent
bubbles in closely spaced orifices like those com-
monly found on spargers. Ultimately, a more uni-
form and predictable distribution of bubble sizes
can be produced (Maier 1927; Sullivan et al. 1964).
Fig. 4. Illustration of gas bubble with radius R being pinched-off
at an orifice submerged in a liquid with cross-flow.
1018 P. L. L. Walls et al.
at MIT
Libraries on January 31, 2015
http://icb.oxfordjournals.org/D
ownloaded from

A bubble’s journey upwards
The purpose of sparging and other types of aeration
techniques is to control the level of a dissolved gas in
a life-supporting fluid medium. As a bubble rises,
mass transfer occurs at its interface. The mass trans-
fer rate jb is driven by the difference in gas concen-
tration between the inner and outer regions of the
bubble, with jb ¼ 4�R2kL cb � c1ð Þ, where cb and c1are the concentrations of gas in the bubble and sur-
rounding fluid, and kL is the mean mass transfer
coefficient (Gong et al. 2007). The concentration of
dissolvable gas in the bubble is related to the partial
pressure of the gas inside pb through Henry’s law:
pb ¼ Hcb
Here, the Henry constant H has units of L�atmmg
and
is experimentally determined for specified combina-
tions of liquid and gas at a fixed temperature. The
mass change inside the bubble jb ¼ddt
43�R3�g
� �can
be simplified to jb � 4�R2�GdRdt
as contribution from
the second term containing d�G
dtwas shown experi-
mentally to be <2% and can be neglected
(Takemura and Yabe 1999). Equating these relations
and utilizing the ideal gas law yields an expression
for the rate at which a bubble shrinks as it dissolves:
dR
dt¼
pb � p1
pb
RTkL
Hð6Þ
Here, p1 is the equivalent pressure of the dis-
solved gas in the liquid, R is the specific gas con-
stant, and T is the absolute temperature.
An interesting result of Equation (6) is that a
bubble will be driven to dissolve even when the sur-
rounding fluid is saturated due to the capillary pres-
sure increase. Although small bubbles with high
internal pressure favor dissolution, observations
have shown that bubbles with R < 60�m may per-
sist indefinitely in the ocean (Mulhearn 1981). This
phenomenon has been attributed to the bubbles
being coated with natural surfactants, thereby in-
hibiting mass transfer (Czerski et al. 2011). The pri-
mary source of these surfactants appears to be
phytoplankton exudates (Zutic et al. 1981; Wurl
et al. 2011).
The rise of a bubble through its surroundings is
driven by the buoyancy force Fb (Section ‘‘Origin
and relevance of capillarity’’) and is resisted by the
fluid leading to an interfacial stress (� in Fig. 3). For
example, a bubble dominated by viscosity and sur-
face tension, specifically small Re and Bo numbers,
rising in an ideally clean fluid will be approximately
spherical and possess a mobile interface. The fluid
inside the bubble will move toroidally while the sur-
rounding fluid will diverge and re-convergent behind
the bubble to allow its passage as shown in Fig. 5. In
this case, the terminal rise velocity is given by the
Hadamard–Rybczynski equation (Hadamard 1911;
Rybczynski 1911):
ut
uc
¼2
9Re 1�
�g
�l
� � 1þ �l
�g
1þ 23�l
�g
!ð7Þ
wherein the characteristic velocity uc ¼ffiffiffiffiffiffigRp
is
now given in terms of gravity, the driving force
behind the bubble’s rise. For an air bubble in water
Equation (7) can be simplified to ut
uc¼ 1
3Re owing to
the large density and viscosity differences. However,
as the bubble rises, the liquid encountered is rarely
pure and instead filled with suspended material, such
as particulates and microorganisms. When such sur-
factants are present in the fluid, they end up being
scavenged by the rising bubble. Such scavenging
leads to local changes of surface tension on the
rising bubble’s surface. The Marangoni stresses in-
duced by these gradients resist the motion of the
interface towards the back of the bubble, thus ren-
dering the bubble’s surface nearly immobile. The sur-
face of the bubble behaves as if it was rigid.
In such cases, �g � �l and Equation (7) limits to
the familiar Stoke’s law ut
uc¼ 2
9Re (Clift et al. 1978).
Thus, smaller bubbles with surface contamination
dwell in the water �50% longer than surfactant
free bubbles.
Fig. 5. The rise of a spherical bubble in a fluid. (A) Illustrates on
the right half the rise of a bubble in a clean environment. The left
half illustrates a rigid interface with a particle contacting and
adhering. (B) Close-up view of boxed particle in A that has
formed a three-phase contact angle.
Interactions between bubbles and microorganisms 1019
at MIT
Libraries on January 31, 2015
http://icb.oxfordjournals.org/D
ownloaded from

As a bubble approaches a suspended particle, the
particle will either pass around, or collide with, the
bubble’s surface (Fig. 5A). In the event of a particle–
bubble collision it is possible for the particle not to
attach permanently to the free surface (Miettinen
et al. 2010). For attachment to occur, the liquid be-
tween the particle and the thin bubble film must
completely drain to allow for a three-phase contact
line to develop (Fig. 5B) (Verrelli et al. 2011). The
time required for this process to occur is known as
the induction time and must be less than the time
required for the particle to simply ‘‘slide’’ around
and off the back of the bubble. The induction time
is predominantly influenced by surface chemistry,
although few experimental studies have thoroughly
examined this phenomenon as it naturally occurs
(Verrelli et al. 2011).
In the event of attachment upon particle–bubble
collision (Fig. 5A) the concentration of particles at
the surface of the rising bubble will become enriched
when compared with that of the fluid bulk
(Blanchard and Syzdek 1970, 1972, 1982; Wallace
et al. 1972; Burger and Bennett 1985). This effect
can be quantified with the collision efficiency as de-
fined by the ratio of particles attached to the bubble
at the surface to the total number of particles in the
volume swept out by the bubble during its rise
Ecol ¼# of particles attached
# of particles in volume sweptð8Þ
Numerous factors can influence the collision effi-
ciency, including particle–bubble size ratio, the mo-
bility of the bubble’s surface, and the hydrophobicity
or hydrophilicity of the particle (Yoon and Luttrell
1989; Dai et al. 2000). Perhaps one of the simplest
models of bubble–particle collision assumes that the
particle’s inertia can be neglected owing to their
small size, thus allowing them to follow the flow
streamlines, as illustrated in Fig. 5A, and enabling
estimation of the number of collisions. This model
assumes that the Reynolds number of the bubble is
sufficiently high, as opposed to Stoke’s law case, to
allow for the neglect of viscous or rotational effects,
and that the bubble’s surface is fully mobile
(Sutherland 1948). This particular model applies
when the Reynolds number is between 80 and 500.
Given such assumptions, a distance from the bub-
ble’s center-line Rc under which all particles will col-
lide and attach can be derived Rc ¼ffiffiffiffiffiffiffiffi3aRp
(Fig. 5A).
The collision efficiency Ecol can then be computed
via Equation (8). By taking the ratio of the collision
tube’s area 3�aR to the projected area of the bubble
�R2, the collision efficiency simplifies to Ecol ¼ 3a=R.
Despite the numerous assumptions built into the
model above, the Sutherland collision efficiency has
provided the foundation for many recent collision
models (e.g., Dai et al. 2000). However, numerous
factors can lead to the breakdown of the most fun-
damental assumptions. In particular, as discussed
above, the mobility of the surface needs revision.
In fact, an immobile surface always results in a
lower collision efficiency owing to the fluid stream-
lines being forced away from the interface (Schulze
1992). More recent models of bubble–particle colli-
sion relaxed some of Sutherland’s (1948) assump-
tions and were used to explain the enrichment of
cells and bacteria attached to rising bubbles (Weber
et al. 1983; Meier et al. 1999).
A bubble drains and dies
When a gas bubble rises to the surface of a liquid, it
deforms the air–liquid interface. Toba (1959) and
Princen (1963) independently reasoned that, at the
fluid’s interface, these bubbles reach an equilibrium
shape that depends on the relative effects of gravity
and surface tension, as quantified by the Bond
number Equation (3). The bubble in Fig. 2C illus-
trates a schematic of one of these equilibrium shapes.
The thin film separating the gas in the bubble from
the gas outside the bubble is assumed to be of uni-
form thickness. Its overall shape is close to spherical,
depending on the size of the bubble. This shape min-
imizes surface energy.
Once the bubble reaches its equilibrium surface
shape, the liquid in its film drains back into the
surrounding pool by a combination of gravitational
draining and capillary suction; the relative strength
of these draining mechanisms again depends on the
Bond number or the size of the bubble. When small
amounts of surfactant are present—as is the case for
fluids containing biomass—the surfactant on the
bubble’s cap drains along with the liquid, leading
to a gradient in surface tension (Stein 1993). The
effect of this gradient is a Marangoni stress that
counteracts the drainage (Fig. 3) and increases the
persistence time of the bubble at the surface (Mysels
et al. 1959). Regardless of the draining mechanism,
the film eventually becomes thin enough for molec-
ular forces to become destabilizing and cause
rupture.
Indeed, the surface area of a bubble’s thin shell is
significantly greater than that of a spherical droplet
of an identical volume of liquid. Thus, thin film caps
are only local rather than global surface energy
minima. In other words, small perturbations to a
bubble’s film surface area are attenuated. Yet,
1020 P. L. L. Walls et al.
at MIT
Libraries on January 31, 2015
http://icb.oxfordjournals.org/D
ownloaded from
sufficiently large geometrical perturbation can lead to
the development of a hole that will grow, resulting
in the death or burst of the bubble. In particular,
an initial hole can grow.
While the film remains thick enough, the initial
hole can be induced by an external force resulting
from direct contact with solid objects or the deposi-
tion of dust particles. As thinning progresses, spon-
taneous popping can eventually occur when the
film’s thickness becomes on the order of tens of
nanometers, a scale at which Van der Waals forces
are no longer negligible (Vrij 1966). However, such
thickness is much smaller than that commonly ob-
served prior to the burst of water bubbles with small
surfactant concentrations, which is on the order of
0.1–10�m. Once formed, the hole will grow if its
size is larger than twice the thickness of the bubble
film (Taylor and Michael 1973). Indeed, although it
is unclear what initiates the rupture in these in-
stances, experiments have demonstrated that the
thickness of bubbles at burst decreases with decreas-
ing surface tension and increases with size of the
bubble, specifically h / R2 (e.g., Modini et al. 2013
and references therein).
When a hole nucleates, its growth—or more pre-
cisely the retraction of the film—is driven by capil-
lary forces due to the decrease in surface energy
(Fig. 6). The dynamics of this retraction have been
investigated for over a century. Dupre is credited for
initially recognizing that when a hole nucleates in a
thin sheet of liquid, the film around the hole collects
into a growing rim while the rest of the film remains
essentially still (Dupre 1867). By assuming that all of
the surface energy released by the decrease in surface
area is converted into the kinetic energy of the re-
tracting rim, Dupre calculated that the film would
retract at a constant velocity. These results were
echoed shortly later by Rayleigh who carried out
some of the earliest high-speed visualization
(Rayleigh 1878), then again by De Vries (1958).
Yet, more precise experiments by Ranz (1958) sug-
gested that Dupre’s calculation overestimated the ve-
locity of retraction, motivating Culick (1960) to
recognize that half of the surface energy is dissipated
in the rim. Meanwhile, Taylor independently arrived
at the same theoretical velocity while investigating
retracting sheets (Taylor 1959).
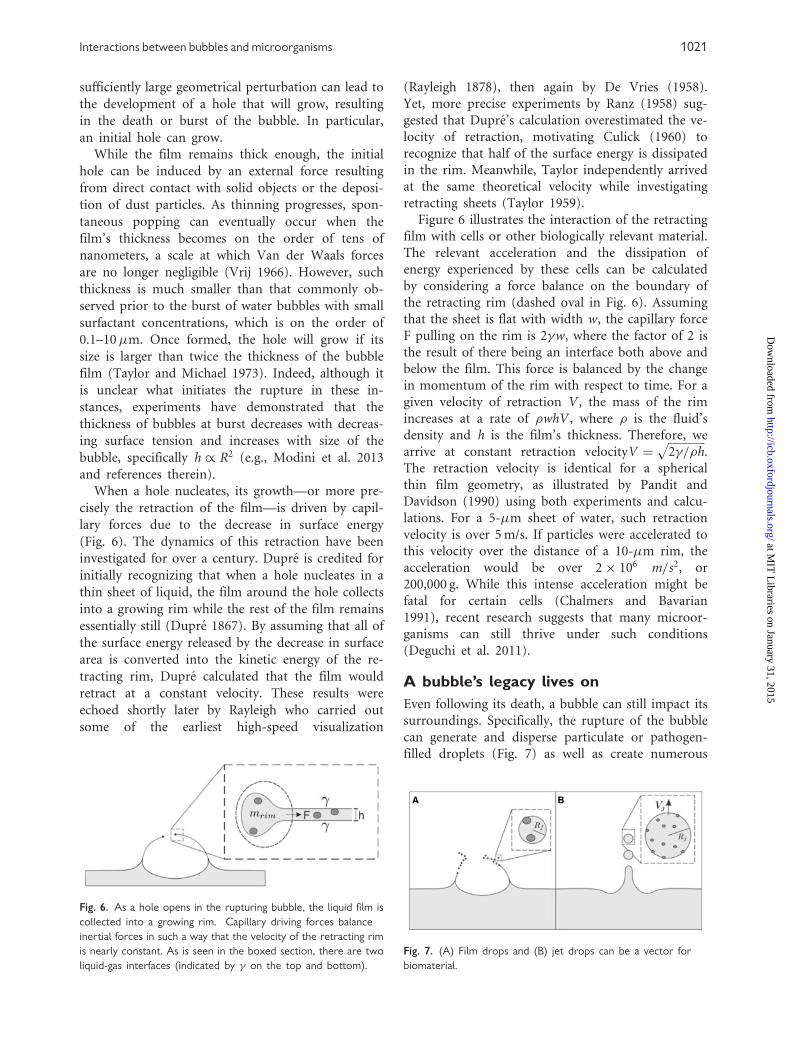
Figure 6 illustrates the interaction of the retracting
film with cells or other biologically relevant material.
The relevant acceleration and the dissipation of
energy experienced by these cells can be calculated
by considering a force balance on the boundary of
the retracting rim (dashed oval in Fig. 6). Assuming
that the sheet is flat with width w, the capillary force
F pulling on the rim is 2�w, where the factor of 2 is
the result of there being an interface both above and
below the film. This force is balanced by the change
in momentum of the rim with respect to time. For a
given velocity of retraction V , the mass of the rim
increases at a rate of �whV , where � is the fluid’s
density and h is the film’s thickness. Therefore, we
arrive at constant retraction velocityV ¼ffiffiffiffiffiffiffiffiffiffiffiffiffi2�=�h
p.
The retraction velocity is identical for a spherical
thin film geometry, as illustrated by Pandit and
Davidson (1990) using both experiments and calcu-
lations. For a 5-�m sheet of water, such retraction
velocity is over 5 m/s. If particles were accelerated to
this velocity over the distance of a 10-�m rim, the
acceleration would be over 2� 106 m=s2, or
200,000 g. While this intense acceleration might be
fatal for certain cells (Chalmers and Bavarian
1991), recent research suggests that many microor-
ganisms can still thrive under such conditions
(Deguchi et al. 2011).
A bubble’s legacy lives on
Even following its death, a bubble can still impact its
surroundings. Specifically, the rupture of the bubble
can generate and disperse particulate or pathogen-
filled droplets (Fig. 7) as well as create numerous
Fig. 6. As a hole opens in the rupturing bubble, the liquid film is
collected into a growing rim. Capillary driving forces balance
inertial forces in such a way that the velocity of the retracting rim
is nearly constant. As is seen in the boxed section, there are two
liquid-gas interfaces (indicated by � on the top and bottom).
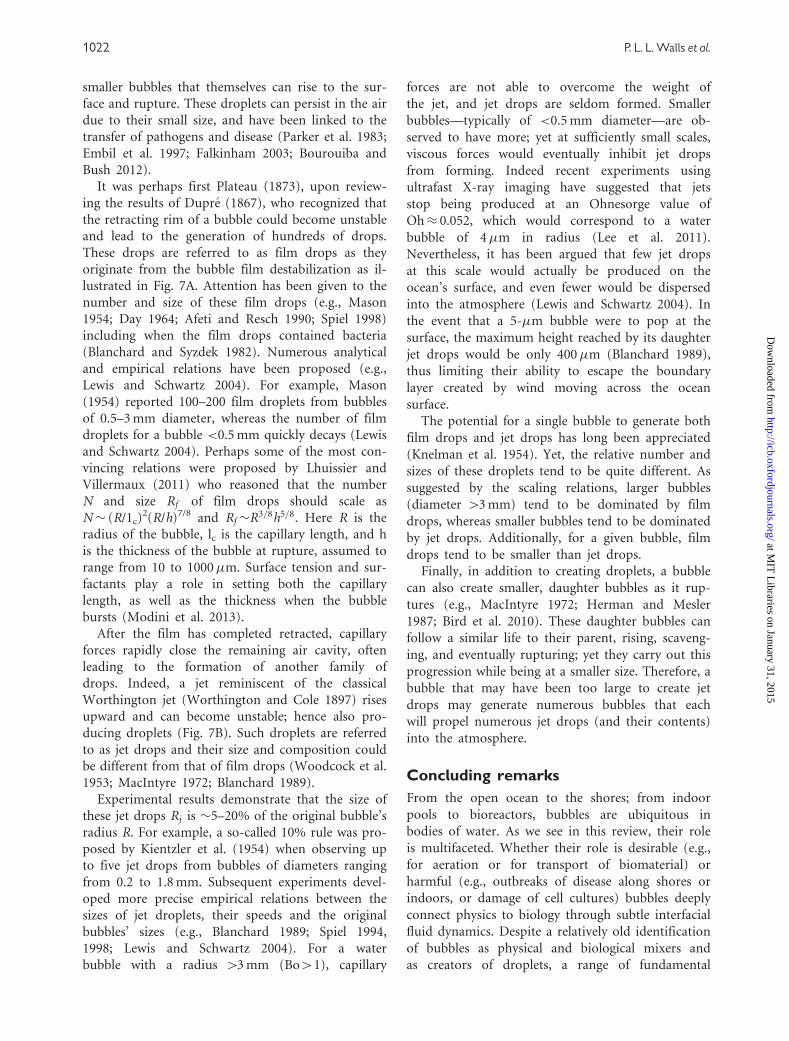
Fig. 7. (A) Film drops and (B) jet drops can be a vector for
biomaterial.
Interactions between bubbles and microorganisms 1021
at MIT
Libraries on January 31, 2015
http://icb.oxfordjournals.org/D
ownloaded from
smaller bubbles that themselves can rise to the sur-
face and rupture. These droplets can persist in the air
due to their small size, and have been linked to the
transfer of pathogens and disease (Parker et al. 1983;
Embil et al. 1997; Falkinham 2003; Bourouiba and
Bush 2012).
It was perhaps first Plateau (1873), upon review-
ing the results of Dupre (1867), who recognized that
the retracting rim of a bubble could become unstable
and lead to the generation of hundreds of drops.
These drops are referred to as film drops as they
originate from the bubble film destabilization as il-
lustrated in Fig. 7A. Attention has been given to the
number and size of these film drops (e.g., Mason
1954; Day 1964; Afeti and Resch 1990; Spiel 1998)
including when the film drops contained bacteria
(Blanchard and Syzdek 1982). Numerous analytical
and empirical relations have been proposed (e.g.,
Lewis and Schwartz 2004). For example, Mason
(1954) reported 100–200 film droplets from bubbles
of 0.5–3 mm diameter, whereas the number of film
droplets for a bubble <0.5 mm quickly decays (Lewis
and Schwartz 2004). Perhaps some of the most con-
vincing relations were proposed by Lhuissier and
Villermaux (2011) who reasoned that the number
N and size Rf of film drops should scale as
N� (R/1c)2(R/h)7/8 and Rf�R3=8h5=8. Here R is the
radius of the bubble, lc is the capillary length, and h
is the thickness of the bubble at rupture, assumed to
range from 10 to 1000�m. Surface tension and sur-
factants play a role in setting both the capillary
length, as well as the thickness when the bubble
bursts (Modini et al. 2013).
After the film has completed retracted, capillary
forces rapidly close the remaining air cavity, often
leading to the formation of another family of
drops. Indeed, a jet reminiscent of the classical
Worthington jet (Worthington and Cole 1897) rises
upward and can become unstable; hence also pro-
ducing droplets (Fig. 7B). Such droplets are referred
to as jet drops and their size and composition could
be different from that of film drops (Woodcock et al.
1953; MacIntyre 1972; Blanchard 1989).
Experimental results demonstrate that the size of
these jet drops Rj is �5–20% of the original bubble’s
radius R. For example, a so-called 10% rule was pro-
posed by Kientzler et al. (1954) when observing up
to five jet drops from bubbles of diameters ranging
from 0.2 to 1.8 mm. Subsequent experiments devel-
oped more precise empirical relations between the
sizes of jet droplets, their speeds and the original
bubbles’ sizes (e.g., Blanchard 1989; Spiel 1994,
1998; Lewis and Schwartz 2004). For a water
bubble with a radius 43 mm (Bo41), capillary
forces are not able to overcome the weight of
the jet, and jet drops are seldom formed. Smaller
bubbles—typically of <0.5 mm diameter—are ob-
served to have more; yet at sufficiently small scales,
viscous forces would eventually inhibit jet drops
from forming. Indeed recent experiments using
ultrafast X-ray imaging have suggested that jets
stop being produced at an Ohnesorge value of
Oh� 0.052, which would correspond to a water
bubble of 4�m in radius (Lee et al. 2011).
Nevertheless, it has been argued that few jet drops
at this scale would actually be produced on the
ocean’s surface, and even fewer would be dispersed
into the atmosphere (Lewis and Schwartz 2004). In
the event that a 5-�m bubble were to pop at the
surface, the maximum height reached by its daughter
jet drops would be only 400�m (Blanchard 1989),
thus limiting their ability to escape the boundary
layer created by wind moving across the ocean
surface.
The potential for a single bubble to generate both
film drops and jet drops has long been appreciated
(Knelman et al. 1954). Yet, the relative number and
sizes of these droplets tend to be quite different. As
suggested by the scaling relations, larger bubbles
(diameter 43 mm) tend to be dominated by film
drops, whereas smaller bubbles tend to be dominated
by jet drops. Additionally, for a given bubble, film
drops tend to be smaller than jet drops.
Finally, in addition to creating droplets, a bubble
can also create smaller, daughter bubbles as it rup-
tures (e.g., MacIntyre 1972; Herman and Mesler
1987; Bird et al. 2010). These daughter bubbles can
follow a similar life to their parent, rising, scaveng-
ing, and eventually rupturing; yet they carry out this
progression while being at a smaller size. Therefore, a
bubble that may have been too large to create jet
drops may generate numerous bubbles that each
will propel numerous jet drops (and their contents)
into the atmosphere.
Concluding remarks
From the open ocean to the shores; from indoor
pools to bioreactors, bubbles are ubiquitous in
bodies of water. As we see in this review, their role
is multifaceted. Whether their role is desirable (e.g.,
for aeration or for transport of biomaterial) or
harmful (e.g., outbreaks of disease along shores or
indoors, or damage of cell cultures) bubbles deeply
connect physics to biology through subtle interfacial
fluid dynamics. Despite a relatively old identification
of bubbles as physical and biological mixers and
as creators of droplets, a range of fundamental
1022 P. L. L. Walls et al.
at MIT
Libraries on January 31, 2015
http://icb.oxfordjournals.org/D
ownloaded from

questions pertaining to their interaction with the
microorganismal world remain widely open. For
example, the response of cells to subcellular level
hydrodynamic forces is not understood; as perfor-
mance is increased, non-lethal, negative effects may
emerge (Hu et al. 2011). At the air–ocean interface,
it is still unclear whether the stress of bubble rupture
damages certain organisms as observed in bioreac-
tors, thereby emitting certain types or sizes selectively
or more readily than others. Indoor, the subtle role
of the life and death of bubbles at the interface of
contaminated water (e.g., in hospitals, therapeutic, or
care facilities) in selecting certain pathogens for new
routes of disease transmission remain unclear. In this
brief review, we hope to have guided the reader
through the rich life of a bubble and highlighted
the many areas in which fluid dynamics can be of
help in understanding bubbles; interactions with the
world of the small.
Acknowledgments
We thank the divisions within the Society of
Integrative and Comparative Biology, including
the Division of Comparative Biomechanics, the
Division of Vertebrate Morphology, the Division of
Invertebrate Zoology, and the American Microscopy
Society for their support.
Funding
NSF (1347346 to L.B.); NSF CAREER award
(1351466 to J.C.B.).
References
Afeti GM, Resch FJ. 1990. Distribution of the liquid aerosol
produced from bursting bubbles in sea and distilled water.
Tellus B 42B:378–84.
Angelini TE, Roper M, Kolter R, Weitz DA, Brenner MP.
2009. Bacillus subtilis spreads by surfing on waves of sur-
factant. Proc Natl Acad Sci 106:18109–13.
Baldy S, Bourguel M. 1987. Bubble between the wave trough
and wave crest levels. J Geophys Res 92:2919–29.
Barbosa MJ, Albrecht M, Wijffels RH. 2003. Hydrodynamic
stress and lethal events in sparged microalgae cultures.
Biotechnol Bioeng 83:112–20.
Bauer H, Fuerhacker M, Zibuschka F, Schmid H,
Puxbaum H. 2002. Bacteria and fungi in aerosols generated
by two different types of wastewater treatment plants.
Water Res 36:3965–70.
Berg JC, Boudart M, Acrivos A. 1966. Natural convection in
pools of evaporating liquids. J Fluid Mech 24:721–35.
Bhaga D, Weber ME. 1981. Bubbles in viscous liquids: shapes,
wakes and velocities. J Fluid Mech 105:61–85.
Bird JC, de Ruiter R, Courbin L, Stone HA. 2010. Daughter
bubble cascades produced by folding of ruptured thin films.
Nature 465:759–62.
Blanchard DC. 1963. The electrification of the atmosphere
by particles from bubbles in the sea. Progr Oceanogr
1:73–202.
Blanchard DC. 1989. The size and height to which jet drops
are ejected from bursting bubbles in seawater. J Geophys
Res 94:999–11002.
Blanchard DC, Syzdek L. 1970. Mechanism for the water-to-
air transfer and concentration of bacteria. Science
170:626–8.
Blanchard DC, Syzdek L. 1972. Concentration of bacteria
in jet drops from bursting bubbles. J Geophys Res
77:5087–99.
Blanchard DC, Syzdek L. 1982. Water-to-air transfer and en-
richment of bacteria in drops from bursting bubbles.
Applied Environ Microbiol 43:1001–5.
Blanchard DC, Woodcock AH. 1957. Bubble formation and
modification in the sea and its meteorological significance.
Tellus B 9:145–58.
Boulton-Stone J, Blake J. 1993. Gas bubbles bursting at a free
surface. J Fluid Mech.
Bourouiba L, Bush JWM. 2012. Drops and bubbles in the
environment. In: Handbook of environmental fluid dynam-
ics, Volume one: overview and fundamentals. Boca Raton
(FL): CRC Press, Taylor & Francis Group. p. 427–40.
Boyce SG. 1951. Source of atmospheric salts. Science
113:620–1.
Burger S, Bennett J. 1985. Droplet enrichment factors of pig-
mented and nonpigmented Serratia marcescens: possible
selective function for prodigiosin. Appl Environ Microbiol
50:487–90.
Chalmers JJ, Bavarian F. 1991. Microscopic visualization of
insect cell-bubble interactions. II: The bubble film and
bubble rupture. Biotechnol Progr 7:151–8.
Cherry R, Hulle C. 1992. Cell death in the thin films of
bursting bubbles. Biotechnol Progr 8:11–8.
Chisti Y. 2000. Animal-cell damage in sparged bioreactors.
Trends Biotechnol 18:420–32.
Clift R, Grace JR, Weber ME. 1978. Bubbles, drops, and par-
ticles. New York (NY): Academic Press, Inc.
Culick F. 1960. Comments on a ruptured soap film. J Appl
Phys 31:1128–9.
Czerski H, Twardowski M, Zhang X, Vagle S. 2011. Resolving
size distributions of bubbles with radii less than 30�m with
optical and acoustical methods. J Geophys Res
116:C00H11.
Dai Z, Fornasiero D, Ralston J. 2000. Particle-bubble collision
models–a review. Adv Colloid Interfac 85:231–56.
Day JA. 1964. Production of droplets and salt nuclei by the
bursting of air-bubble films. Q J Roy Meteor Soc 90:72–8.
Deane GB, Stokes MD. 2002. Scale dependence of bubble cre-
ation mechanisms in breaking waves. Nature 418:839–44.
Deguchi S, Shimoshigea H, Tsudomea M, Mukaia M-a,
Corkery RW, Ito S, Horikoshia K. 2011. Microbial
growth at hyperaccelerations up to 403,627 x g. Proc Natl
Acad Sci USA 108:7997–8002.
Dupre A. 1867. Sixieme memoire sur la theorie mecanique de
la chaleur (in French). Ann Chim Phys 11:194–220.
Embil J, Warren P, Yakrus M, Stark R, Corne S, Forrest D,
Hershfield E. 1997. Pulmonary illness associated with ex-
posure to mycobacterium-avium complex in hot tub water*
hypersensitivity pneumonitis or infection? Chest 111:813–6.
Interactions between bubbles and microorganisms 1023
at MIT
Libraries on January 31, 2015
http://icb.oxfordjournals.org/D
ownloaded from
Falkinham III, JO. 2003. Mycobacterial aerosols and respira-
tory disease. Emerg Infect Dis 9:763–7.
Garcia-Briones MA, Chalmers JJ. 1994. Flow parameters as-
sociated with hydrodynamic cell injury. Biotechnol Bioeng
44:1089–98.
Gong X, Takagi S, Huang H, Matsumoto Y. 2007. A numer-
ical study of mass transfer of ozone dissolution in bubble
plumes with an Euler–Lagrange method. Chem Eng Sci
62:1081–93.
Hadamard J. 1911. Mouvement permanent lent d’une sphere
liquide et visqueuse dans un liquide visqueux (in French).
CR Acad Sci 152:1735–8.
Herman J, Mesler R. 1987. Bubble entrainment from bursting
bubbles. J Colloid Interfac 117:565–9.
Hosoi AE, Bush JWM. 2001. Evaporative instabilities in
climbing films. J Fluid Mech 442:217–39.
Hu W, Berdugo C, Chalmers JJ. 2011. The potential of hy-
drodynamic damage to animal cells of industrial relevance:
current understanding. Cytotechnology 63:445–60.
Jacobs W. 1937. Preliminary report on a study of atmospheric
chlorides. Monthly Weather Rev 65:147–51.
Kientzler C, Arons AB, Blanchard DC, Woodcock AH. 1954.
Photographic investigation of the projection of droplets by
bubbles bursting at a water surface1. Tellus B 6:1–7.
Knelman F, Dombrowski N, Newitt D. 1954. Mechanism of
the bursting of bubbles. Nature 4397:261.
Kumar R, Kuloor NR. 1970. The formation of bubbles and
drops. Adv Chem Eng 8:255–368.
Laitinen S, Kangas J, Kotimaa M, Liesivuori J, Martikainen PJ,
Nevalainen A, Sarantila R, Husman K. 1994. Workers’ ex-
posure to airborne bacteria and endotoxins at industrial
wastewater treatment plants. Am Ind Hyg Assoc J
55:1055–60.
Lee JS, Weon BM, Park SJ, Je JH, Fezzaa K, Lee W-H. 2011.
Size limits the formation of liquid jets during bubble burst-
ing. Nat Commun 2:367.
Lewis R, Schwartz E. 2004. Sea salt aerosol production: mech-
anisms, methods, measurements and models—a critical
review. Washington (DC): American Geophysical Union.
Lhuissier H, Villermaux E. 2011. Bursting bubble aerosols.
J Fluid Mech 696:5–44.
Liu Y, Li F, Hu W, Wiltberger K, Ryll T. 2013. Effects of
bubbleliquid two-phase turbulent hydrodynamics on cell
damage in sparged bioreactor. Biotechnol Progr 30:48–58.
Ma N, Koelling KW, Chalmers JJ. 2002. Fabrication and use
of a transient contractional flow device to quantify the
sensitivity of mammalian and insect cells to hydrodynamic
forces. Biotechnol Bioeng 80:428–37.
MacIntyre F. 1972. Flow patterns in breaking bubbles.
J Geophys Res 77:5211–28.
Magnaudet J, Eames I. 2000. The motion of high-Reynolds-
number bubbles in inhomogeneous flows. Annu Rev Fluid
Mech. 659–708.
Maier CG. 1927. The ferric sulphate-sulphuric acid process:
with a chapter on producing small bubbles of gas in liquids
by submerged orifices. Washington: United States
Government Printing Office.
Marangoni C. 1865. On the expansion of a drop of liquid
floating on the surface of another liquid. Pavia, Italy:
Tipographia dei fratelli Fusi.
Mason BJ. 1954. Bursting of air bubbles at the surface of sea
water. Nature 174:470–1.
Meier SJ, Hatton T, Wang DI. 1999. Cell death from bursting
bubbles: role of cell attachment to rising bubbles in sparged
reactors. Biotechnol Bioeng 62:468–78.
Melville WK. 1996. The role of surface-wave breaking in air-
sea interaction. Annu Rev Fluid Mech 28:279–321.
Miettinen T, Ralston J, Fornasiero D. 2010. The limits of fine
particle flotation. Minerals Engineering, 23:420–37.
Miyahara T, Hayashino T. 1995. Size of bubbles generated
from perforated plates in non-Newtonian liquids. J Chem
Eng Jpn 28:596–600.
Modini RL, Russell LM, Deane GB, Stokes MD. 2013. Effect
of soluble surfactant on bubble persistence and bubble-
produced aerosol particles. J Geophys Res-Atmos 118:
1388–400.
Monahan E. 1971. Oceanic whitecaps. J Phys Oceanogr 1:139–44.
Mulhearn PJ. 1981. Distribution of microbubbles in coastal
waters. J Geophys Res 86:6429.
Murhammer DW, Goochee CF. 1990. Sparged animal cell
bioreactors: mechanism of cell damage and Pluronic F-68
protection. Biotechnol Progr 6:391–7.
Mysels KJ, Shinoda K, Frankel S. 1959. Soap films: studies of
their thinning and a bibliography. Oxford: Pergamon Press
Ltd.
Pandit A, Davidson J. 1990. Hydrodynamics of the rupture of
thin liquid films. J Fluid Mech 212:11–24.
Parker BC, Ford MA, Gruft H, Falkinham JO 3rd. 1983.
Epidemiology of infection by nontuberculous mycobacteria.
IV. Preferential aerosolization of Mycobacterium intracellu-
lare from natural waters. Am Rev Respir Dis 128:652–6.
Plateau J. 1873. Experimental and theoretical statics of liquids
subject to molecular forces only. Paris: Gauthier-Villars.
Princen H, 1963. Shape of a fluid drop at a liquid-liquid
interface. J Colloid Sci 18:178–95.
Ranz WE. 1958. Some experiments on the dynamics of liquid
films. J Appl Phys 30:1950–5.
Rayleigh L. 1878. On the instability of jets. P Lond Math Soc
10:4–13.
Rybczynski W. 1911. On the translatory motion of a fluid
sphere in a viscous medium. Bull Acad Sci Cracow Ser A
40:40–6.
Schulze HJ. 1992. Probability of particle attachment on gas
bubbles by sliding. Adv Colloid Interfac 40:283–305.
Scriven LE, Sternling CV. 1960. The Marangoni effects.
Nature 187:186–8.
Spiel DE. 1994. The sizes of the jet drops produced by air
bubbles bursting on sea- and fresh-water surfaces. Tellus B
46:325–38.
Spiel DE. 1998. On the births of film drops from bubbles
bursting on seawater surfaces. J Geophys Res 103:24907–18.
Stein HN. 1993. The drainage of free liquid films. Colloid
Surface A 79:71–80.
Stuhlman O. 1932. The mechanics of effervescence. Physics
2:457.
Sullivan SL, Hardy BW, Holland CD. 1964. Formation of air
bubbles at orifices submerged beneath liquids. AIChE J
10:848–54.
Sutherland K. 1948. Physical chemistry of flotation. XI.
Kinetics of the flotation process. J Phys Chem 52:394–425.
1024 P. L. L. Walls et al.
at MIT
Libraries on January 31, 2015
http://icb.oxfordjournals.org/D
ownloaded from
Takemura F, Yabe A. 1999. Rising speed and dissolution rate
of a carbon dioxide bubble in slightly contaminated water.
J Fluid Mech 378:319–34.
Taylor G. 1959. The dynamics of thin sheets of fluid. III.
Disintegration of fluid sheets. P Roy Soc Lond 253:313–21.
Taylor GI, Michael DH. 1973. On making holes in a sheet of
fluid. J Fluid Mech 58:625–39.
Thoroddsen ST, Etoh TG, Takehara K. 2007. Experiments on
bubble pinch-off. Phys Fluids 19:042101.
Toba Y. 1959. Drop production by bursting of air bubbles on
the sea surface (II) Theoretical study of the shape of float-
ing bubbles. J Oceanogr Soc Jap 15:121–30.
Tramper J, Williams JB, Joustra D, Vlak JM. 1986. Shear
sensitivity of insect cells in suspension. Enzyme Microb
Tech 8:33–6.
Verrelli DI, Koh PTL, Nguyen AV. 2011. Particle–bubble in-
teraction and attachment in flotation. Chem Eng Sci
66:5910–21.
De Vries AJ. 1958. Foam stability: Part IV. Kinetics and acti-
vation energy of film rupture. Recueil des travaux chimi-
ques des Pays-Bas 77:383–99.
Vrij A. 1966. Possible mechanism for the spontaneous rup-
ture of thin, free liquid films. Discuss Faraday Soc
42:23–33.
Wallace G, Loeb G, Wilson D. 1972. On the flotation of
particulates in sea water by rising bubbles. J Geophys Res
77:5293–301.
Weber M, Blanchard D, Syzdek L. 1983. The mechanism
of scavenging of waterborne bacteria by a rising bubble.
Limnol Oceanogr 28:101–5.
Wernersson ES, Tragardh C. 1999. Scale-up of
Rushton turbine-agitated tanks. Chem Eng Sci
54:4245–56.
Woodcock AH. 1948. Note concerning human respiratory
irritation associated with high concentrations of plankton
and mass mortality of marine organisms. J Mar Res
7:56–62.
Woodcock AH, Kientzler CF, Arons AB, Blanchard DC. 1953.
Giant condensation nuclei from bursting bubbles. Nature
172:1144–5.
Worthington AM, Cole RS. 1897. Impact with a liquid sur-
face, studied by the aid of instantaneous photography.
Philos T Roy Soc A 189:137–48.
Wurl O, Wurl E, Miller L, Johnson K, Vagle S. 2011.
Formation and global distribution of sea-surface micro-
layers. Biogeosciences 8:121–35.
Yoon RH, Luttrell GH. 1989. The effect of bubble size on fine
particle flotation. Miner Process Extr Metall Rev 5:101–22.
Zhu Y, Cuenca JV, Zhou W, Varma A. 2008. NS0 cell damage
by high gas velocity sparging in protein-free and choles-
terol-free cultures. Biotechnol Bioeng 101:751–60.
Zutic V, Cosovic B, Marcenko E, Bihari N, Krsinic F. 1981.
Surfactant production by marine phytoplankton. Mar
Chem 10:505–20.
Interactions between bubbles and microorganisms 1025
at MIT
Libraries on January 31, 2015
http://icb.oxfordjournals.org/D
ownloaded from