moving your data center from basic to strategic - bicsi · moving your data center from basic to...
TRANSCRIPT

4/8/2014
Moving your Data Center from Basic to Strategic
Nikhil BankaTechnical Manager (West)

How much does it cost to keep the lights on?
Keep the lights on: $.70
Keep the lights on: $.47
Source: IBM Estimates
Basic Data Centers
Strategic Data Centers
Innovation: $.30
Innovation: $.53
2

Data Center capital costs60% costs from mechanical /
electrical systems
Shell 7%
Mechanical20%
Fees24%
Fit-Up Costs
9%
Instrumentation & Controls4%
Power36%
Source: IBM Estimates
Operating costs3 - 5X capital costs
Cum
ulat
ive
Cos
t of O
pera
tions
($M
illion
s)
Year1 2 3 4 5 6 7 8 9 10 11 12 13 14 15 16 17 18 19 20
Energy CostStaffingBldg. Maint. & Mgmt.R E Tax
$100
$150
$200
$250
$50
0
Cum
ulat
ive
Cos
t of O
pera
tions
($M
illion
s)
Year1 2 3 4 5 6 7 8 9 10 11 12 13 14 15 16 17 18 19 20
Energy CostStaffingBldg. Maint. & Mgmt.R E Tax
Energy CostStaffingBldg. Maint. & Mgmt.R E Tax
$100
$150
$200
$250
$50
0
Lifecycle costs of a Basic Data Center
3

Advantages of a Strategic Data Center:
Strategic Basic
Source: IBM Estimates
4

Advantages of a Strategic Data Center:
5
Data Center capital costs60% costs from mechanical /
electrical systems
Shell 7%
Mechanical20%
Fees24%
Fit-Up Costs
9%
Instrumentation & Controls4%
Power36%
Source: IBM Estimates
Operating costs3 - 5X capital costs
Strategic Data Centers can defer 40% - 50% of the lifecycle costs

What Challenges Are You Facing?
• Visibility• Capacity planning• Improving sustainability
• Regulatory compliance initiatives
• Reducing the total cost of ownership
6
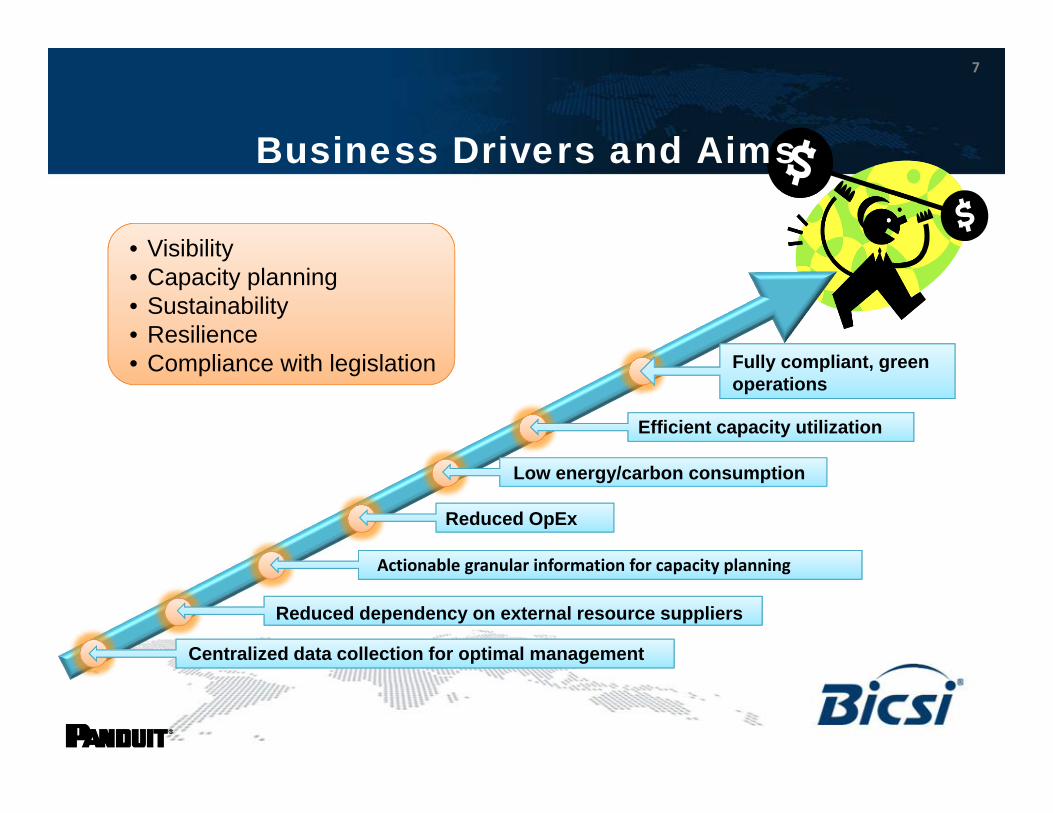
• Visibility• Capacity planning• Sustainability• Resilience • Compliance with legislation
Business Drivers and Aims
Centralized data collection for optimal management
Reduced dependency on external resource suppliers
Actionable granular information for capacity planning
Reduced OpEx
Low energy/carbon consumption
Efficient capacity utilization
Fully compliant, green operations
7

Data Centers are dynamically growing in scale, density and complexity.
Common Obstacles
Escalating energy costs
Increasing power demands
Tracking assets and networks w/ error-prone spreadsheets
Insufficient power metering due to poor instrumentation
Uninformed deployment choices
Lost assets
Hotspots/cooling problems
Air flow management issues
Lack of accurate, correlated operational information makes it tough to overcome obstacles like these and make the best operational decisions for your facility.
8

Manual Workarounds, Higher OpEx, Missed Goals
The Unfortunate Result
• Fragmentation: As a data center becomes increasingly “fragmented”, power, space, cooling, and connectivity become unbalanced
• Moves, Adds, and Changes made without awareness of the impacts leads to:
• Lost Capacity• Misplaced or loss of assets• Lower Resilience• CapEx Expenditures
• Retrofits• New Builds
• However…this is all avoidable!
9

Power and energy
Cooling and environmental
Connectivity
Assets and space
10
Intelligent Infrastructure ManagementData Center and Enterprises
Capacity
Efficiency
Uptime

11
• Target right level of automation• Leverage existing systems• Treat a granular, attribute‐rich asset tracking as foundational
• Minimize risk of strategy and implementation with a phased approach
DCIM Best Practices

Address Power, Environmental, Asset, and Connectivity Needs Holistically
1
Zone 1: Building Point‐of‐Entry– Monitors the building utility metering “Point of Entry”, providing power, oil, water, and gas consumption information and CO2 emissions.
2
Zone 2: Switchboard Distribution Board ‐Monitors sub meters at the main distribution board for DC related equipment.
3
Zone 3: Plant Equipment ‐ Distributed monitoring of supporting facility services, including individual chillers, AHU, CRAC, UPS and lighting circuits.
4Zone 4: Branch Circuit Monitoring of Data Hall –Focuses on monitoring of total rack or cabinet IT loads and environmentals.
5Zone 5: Rack & Cabinet Level Monitoring –Intelligent monitoring and control of power, environmentals, and cabinet level security in addition to DCIM level asset tracking and capacity planning for the data center and enterprise.
6
Zone 6: Device Level Monitoring –Automated connectivity patch field management, as well as monitoring and control of per outlet or device power, within a data center or enterprise.
Let’s Break Down the Problem by Zones
12

PANDUIT Confidential Information
Zone Methodology approachTo demonstrate how Panduit resolves power, energy, connectivity concerns in new or existing data centers, the following slides cover:
• 6 Zone Methodology6 Zone is Panduit’s logical step‐by‐step methodology of assessing simplified, dissected views of distinct enterprise, data center, and facility zones to holistically monitor, manage, and optimize power/energy, asset/connectivity, and thermal management within each zone with greater control.
• S Zone SolutionsBased upon findings from the 6 Zone methodology, S Zone solutions deliver comprehensive energy and physical infrastructure efficiency in data centers, building facilities, and remote enterprise sites through intelligent products, systems, and services.
13

6 Zone Methodology
14
Zone 1 Zone 2 Zone 3 Zone 4 Zone 5 Zone 6
Software (Control, Manage, and Document)
6 Zone is Panduit’s logical step-by-step methodology of assessing simplified, dissected views of distinct enterprise, data center, and facility zones to holistically monitor, manage, and optimize power/energy, asset/connectivity, and thermal management within each zone with greater control.
Supported by S Zone Solutions
Services (Assess and Evaluate Zones)
6 Zone Methodology
Monitoring Devices (Capture Data)
Gateways (Process Data)
S Zone Solutions
Accurate and Actionable Information to Optimize
Advisory Services(Part of S Zone Solutions)

6 Zone Methodology
15
Zone 3
Water Power In Gas
Main MV / LV Distribution Board (A or B)
Lighting Boilers Fire Security CRACChillers Back up Generator
UPS
Sub PDUSub PDUData Hall Environmental
Data Rack or Free Standing
Equipment
Individual Payloads &
Devices
S one Power Monitoring AppliancesS Zone EnvironmentalMonitoring Appliances
Zone 1
Zone 2
Zone 4
Zone 5
Zone 6
Oil
S Zone Asset & Connectivity Monitoring Appliances
Supported by S Zone Solutions

This approach provides an opportunity for both IT and facility managers to assess, discover and articulate all infrastructure issues in a single pane of glass view., helps in addressing them collaboratively.
Bringing together IT and Facilities
Breaking Down the Silos
16
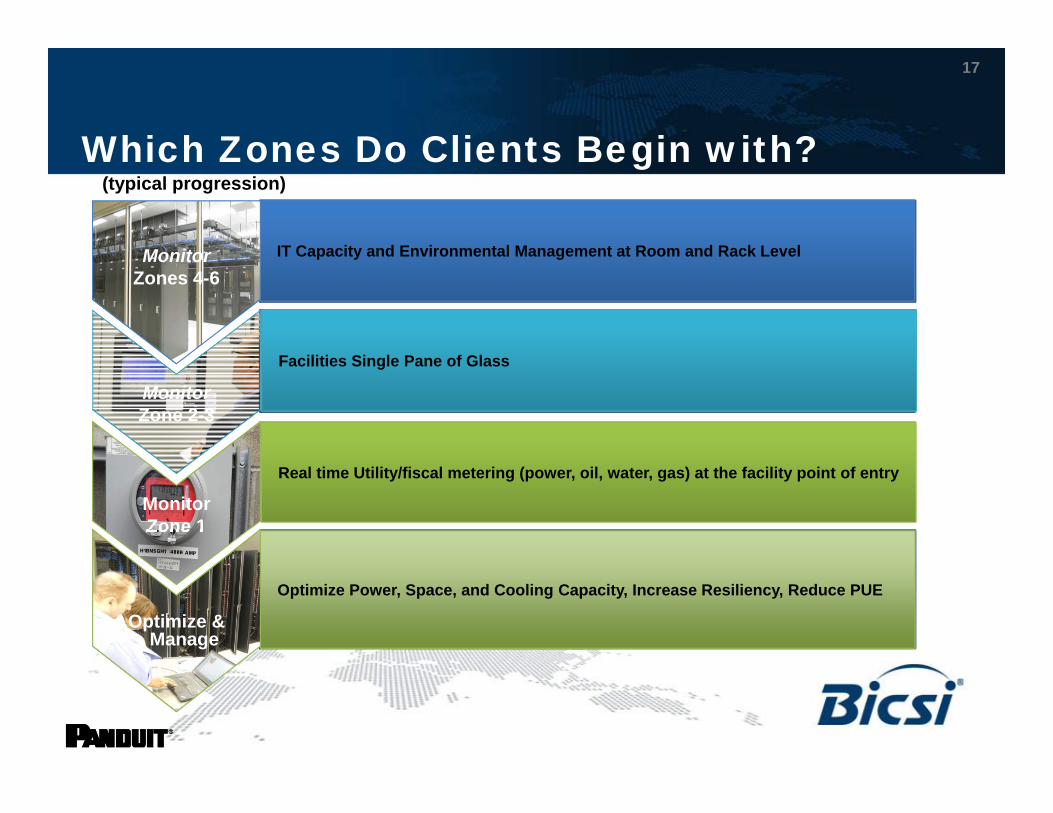
Which Zones Do Clients Begin with?
• Pinpoint energy savings opportunities through trending reporting• Manage asset lifecycle from dock to rack to end of life• Manage capacity planning information around space, power and evironmentals• Reduce cooling costs through cooling system optimization (CFD thermal analysis)• Automated reports to simplify regulatory reporting
• Audit utility bills• Live alerts to fluctuations in utility usage• Comparison between like facilities to identify inefficiencies• Monitor Energy Reductions– collect data for regulatory compliance
• Dynamic PUE: Benchmark and Monitor Trends• Integration: Centralized data collection and reporting for analysis• Power sub-metering at main distribution boards – granular power consumption of
your supporting facility services
• Capacity Planning: Power, Cooling, Connectivity, Assets• Uptime/Resilience: Alarms and Alerts• Dashboard Reporting: Trending, Identification of Inefficiencies
Optimize Power, Space, and Cooling Capacity, Increase Resiliency, Reduce PUE
Real time Utility/fiscal metering (power, oil, water, gas) at the facility point of entry
IT Capacity and Environmental Management at Room and Rack Level
Facilities Single Pane of Glass
Monitor Zones 4-6Monitor
Zones 4-6
MonitorZone 1MonitorZone 1
Monitor Zone 2-3
Optimize &Manage
Optimize &Manage
(typical progression)
17

S Zone Solutions
18
Optimal Data Center / Enterprise Operations
S Zone solutions deliver comprehensive energy and physical infrastructure efficiency through a range of intelligent instrumentation products, systems, and services, in order to help you reach…

Zone 1
Zone 2
Zone 3
Zone 4
Zone 5
Zone 6
Consolidate Fiscals
Granular Reports
PUE
Asset Monitoring
Optimized Data Center
and Enterprise
Management
Fiscal Meters
Switchboard Dist.
Plant
Branch Circuit
Rack & Cabinet
Device
Drive Down PUE
High-level Benefits
19

Internet Business Challenges
20
• Need the ability to monitor power and environmental factors, such as temperature and humidity.
• Visibility to monitor how much space their customers are using to avoid under/over provisioning.
• Measure and improve PUE to reduce power consumption and costs while reducing carbon emissions to comply with the UK government’s Carbon Reduction Commitment Scheme.
Business ChallengesAs a rapidly growing organization, Customer Internet data center infrastructure and business systems need to be agile and scalable. As the company grew, so did the demand on key business systems and their physical infrastructure.

Resolution
21
• Improved capacity management for Co‐location customers in terms of over/under provisioning resulted in cost savings and improved energy efficiency
• Increased energy efficiency across Zen’s data centers achieving a PUE rating of 1.6
• Exceeded annual 5% target and achieved an 8% reduction in energy consumption and carbon emissions
Customer required a partner that could provide custom built, robust power control and environmental monitoring solutions. We also needed the confidence that the partner could suitably scale as we grew our Hosting business. Having such a good close working relationship with Panduit has really helped meet all those requirements, and has provided us with the right tools to expand the range of services we provide to our customers in the future.”
David Horner – Senior Data Center Design Engineer

Next StepsHelp us understand your data center challenges so we can meet your specific needs!
22

Building a smarter, unified business foundation