moving wheat yields upward: key research...
TRANSCRIPT
Joel Ransom, NDSU Extension Agronomist for Cereal Crops
Moving Wheat Yields Upward: Key Research Findings from 2017
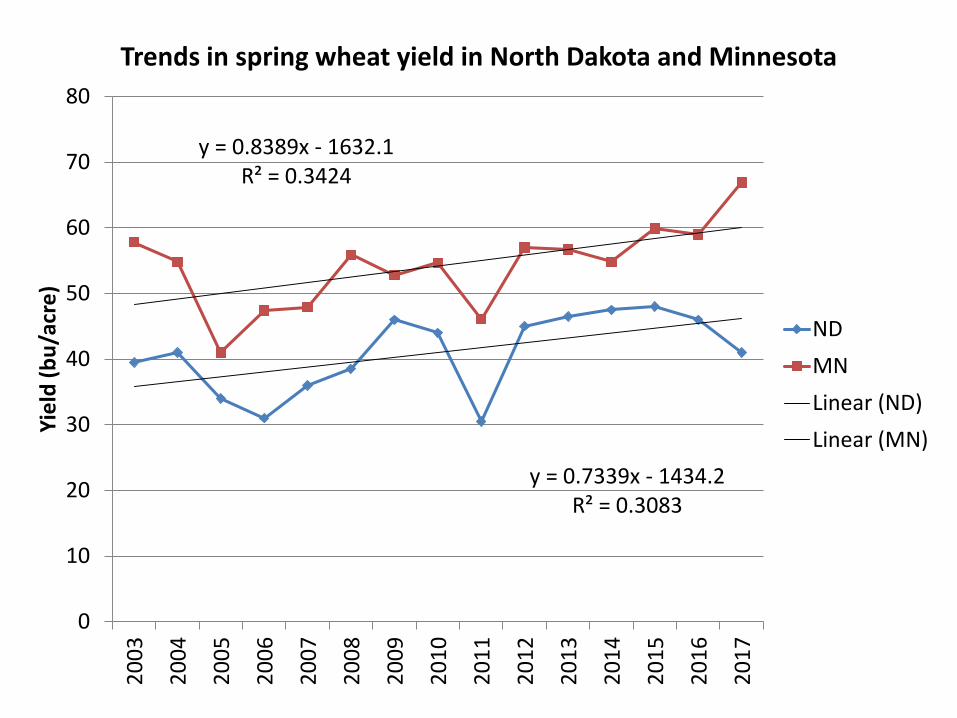
y = 0.7339x - 1434.2R² = 0.3083
y = 0.8389x - 1632.1R² = 0.3424
0
10
20
30
40
50
60
70
80
2003
2004
2005
2006
2007
2008
2009
2010
2011
2012
2013
2014
2015
2016
2017
Yiel
d (b
u/ac
re)
Trends in spring wheat yield in North Dakota and Minnesota
NDMNLinear (ND)Linear (MN)

Steps to sustaining yield gains (and profitability) in wheat – recent research findings
• Careful selection of new varieties that offer improved yield, protein and other traits– Balancing yield and protein– Consider other traits
• Adjust seeding rate to the environment and variety used
• Carefully manage inputs– Fertilizer N– Fungicides– Growth regulators

Variety selection• Foundational for yield improvement• Many new varieties to choose from, meeting
requirements of most environments• Key steps to variety selectin
– Yield and yield stability (> environments > ability to predict stability)
– Balance yield with protein requirements and extrapolate based on results from your farm
– Consider for other traits (i.e. disease and lodging resistances)
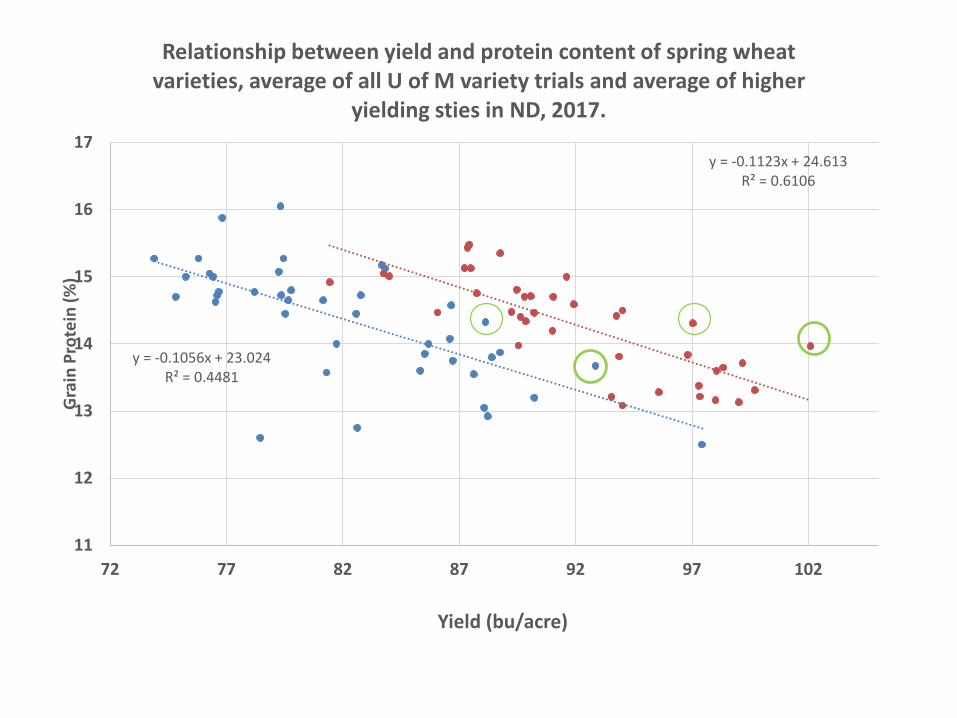
y = -0.1056x + 23.024R² = 0.4481
y = -0.1123x + 24.613R² = 0.6106
11
12
13
14
15
16
17
72 77 82 87 92 97 102
Gra
in P
rote
in (%
)
Yield (bu/acre)
Relationship between yield and protein content of spring wheat varieties, average of all U of M variety trials and average of higher
yielding sties in ND, 2017.

Rank of varieties for yield, average of all MN variety trials, 2017.
Variety Yield ProteinSY Valda 102.1 14.0HRS 3419 99.7 13.3HRS 3504 99.2 13.7Prosper 99.0 13.1Shelly 98.3 13.6WB9653 98.1 13.6LCS Prime 98.0 13.2Faller 97.3 13.2LCS Albany 97.3 13.4HRS 3530 97.0 14.3TCG-Spitfire 96.8 13.8Chevelle 95.6 13.3WB9590 94.0 14.5LCS Iguacu 94.0 13.1SY Rowyn 93.9 13.8

Rank of varieties for returns, average of all MN variety trials, 2017.
Cultivar Yield Protein ReturnsSY Valda 102.1 14.0 580HRS 3530 97.0 14.3 568WB9479 91.6 15.0 568Linkert 88.8 15.4 565Bolles 87.4 15.5 562TCG-Climax 87.4 15.4 560WB9590 94.0 14.5 559Surpass 93.7 14.4 553Dyna-Gro Ambush 91.9 14.6 551HRS 3504 99.2 13.7 551WB-Mayville 91.0 14.7 551HRS 3616 87.5 15.1 548Rollag 87.2 15.1 546Boost 89.5 14.8 546Lang-MN 90.1 14.7 545
$5.7 per bu and $0.10 per fifth protein

Rank of varieties for yield and partial returns, average of high yielding environments in ND variety trials, 2017
Cultivar Yield ProteinLCS Trigger 97.4 12.5SY-Valda 92.9 13.7LCS Prime 90.2 13.2Shelly 88.8 13.9WB9653 88.4 13.8HRS 3419 88.2 12.9HRS 3530 88.1 14.3Faller 88.1 13.1Prosper 87.6 13.6HRS 3504 86.7 13.8LCS Rebel 86.7 14.6Surpass 86.6 14.1HRS 3100 85.7 14.0Prevail 85.5 13.9MS Chevelle 85.3 13.6
Cultivar Yield Protein ReturnBolles 79.3 16.1 533.5WB9479 83.7 15.2 526.1Lang-MN 83.8 15.1 525.0LCS Rebel 86.7 14.6 518.8HRS 3530 88.1 14.3 516.6SY-Valda 92.9 13.7 514.2TCG-Climax 76.8 15.9 509.9HRS 3616 79.5 15.3 503.5WB9590 82.8 14.7 501.8Shelly 88.8 13.9 500.3Surpass 86.6 14.1 496.9WB9653 88.4 13.8 495.0Rollag 79.3 15.1 494.3LCS Breakaway 82.6 14.5 489.3Elgin-ND 81.2 14.7 488.9
$5.7 per bu and $0.10 per fifth protein

Use the variety selection tool for head-to-head comparisons of your short list

0
20
40
60
80
100
120
Decade Emmerson Jerry Oahe SY Monument
Yiel
d (b
u/ac
re)
Impact of stripe rust on yield of winter wheat, 2017.
Hettinger Langdon
Know the strengths and weaknesses of your varieties and have a strategy for dealing with weakness (i.e. susceptibility to diseases, lodging potential, etc.)

y = -0.78x + 100.98R² = 0.8644
0.0
20.0
40.0
60.0
80.0
100.0
120.0
0 20 40 60 80 100 120
Yiel
d (b
u/ac
re)
Stripe rust rating (% of flag leaf damage)
Relationship between stripe rust rating and yield on winter wheat varieties, Langdon, 2017

What did we learn about variety selection?
• We can expect increased productivity from newer varieties (for yield and protein)
• Select a yield an protein profile that matches your farm and expected market value
• Use multi-locational data when possible• Know the disease and lodging traits of potential
varieties. • Routinely add new varieties to your farm to
capture the value from newer genetics

To sustain yield gains with new varieties, do we need higher seeding rates?
• Gains in yield potential in corn hybrids achieved only with higher populations
• Wheat is a smaller plant and regulates crowding or gaps with tillering– Does having fewer tillers increase yields by having more
larger main stems– With fewer tillers can we get better coverage of FHB
fungicides• Several on station and on-farm seeding rate trials
were conducted in 2017

69.7
71.6
72.8
71.1
50
55
60
65
70
75
0.75 1.25 1.75 2.25
Yiel
d (b
u/ac
re)
Millions of seeds planted
Effect of seeding rate on yield of spring wheat, average of higher yielding environments in MN and ND, 2017

25.6
28.5 28.927.5
0
5
10
15
20
25
30
35
0.75 1.25 1.75 2.25
Yiel
d (b
u/ac
re)
Millions of seeds planted
Effect of seeding rate on yield of spring wheat, average of lowering yielding locations in ND, 2017

Effect of seeding rate on yield of spring wheat, on-farm trials, MN, Linkert or SY Valda, 2017.
0
20
40
60
80
100
120
Argyle Danube Drayton Gary Crookston Hallock Roseau Average
Yiel
d (b
u/ac
re)
1 million 1.5 million 2 million
20.0
30.0
40.0
50.0
60.0
70.0
80.0
Anchor Lang Linkert Prevail Shelly Surpass Valda Vit-Pro Wildfire
Yiel
d (b
u/ac
re)
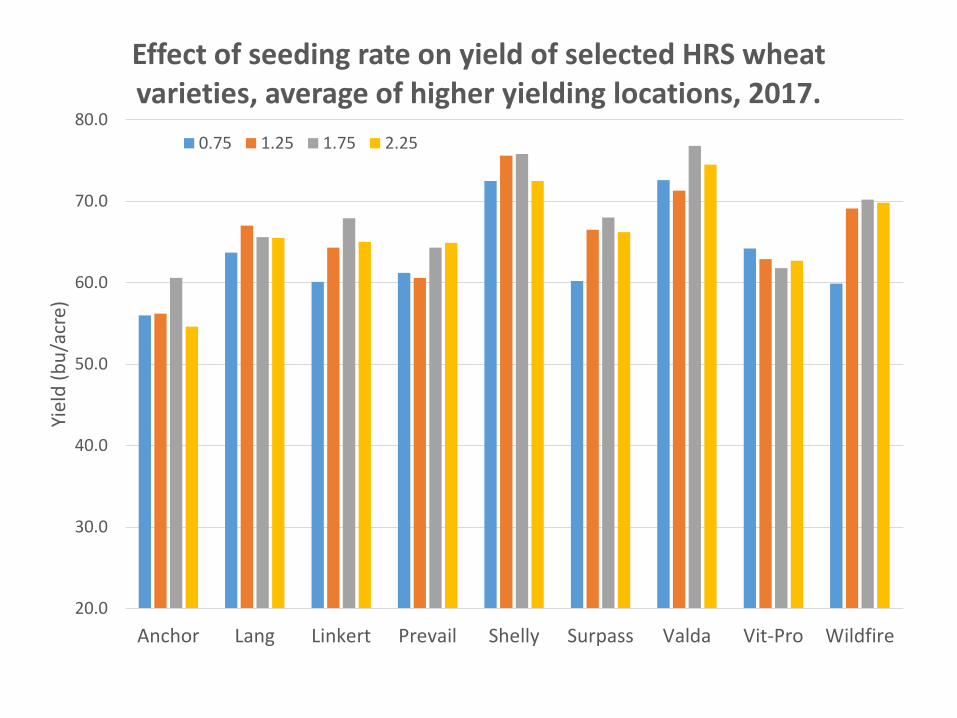
Effect of seeding rate on yield of selected HRS wheat varieties, average of higher yielding locations, 2017.
0.75 1.25 1.75 2.25

Effect of seeding rate on percent emergence, average of locations, SY Valda and Linkert,2017
Seeding Rate Linkert SY Valda
Average Range Average Range---(Percent of viable seeds that emerged)---
1.0 million 100 69-116 82 61-1121.5 million 93 77-104 76 65-1062.0 million 89 77-102 79 58-117

Effect of seeding rate on stems per acre and stems per plant, average of locations, Linkert and SY Valda.Seeding Rate
Linkert SY Valda
Seedsperacre
Stems/acre
(million)
Stems per
plant
Spikeweight(gm)
Stems/acre
(million)
Stemsper
plant
Spike weight
(gm)
1.0 million 2.73 2.8 0.80 3.12 3.9 0.841.5 million 2.81 2.0 0.78 3.44 3.1 0.742.0 million 2.84 1.6 0.77 3.50 2.3 0.73
Summary on seeding rates
• Increasing seeding rate beyond current recommendation (1.2-1.4 million seeds) does not provide for a consistent biological response regardless of variety
• Varietal response to seeding rate not consistent (need more data), but propensity to lodging and optimum seeding rate appear to be negatively related
• Tillering potential of a variety was not a major factor in determining the optimum seeding rate this year, but high tillering varieties had lower optimum seeding rates last year.
• Higher seeding rates increase the proportion of main stems, but also reduces spike size and tends to increase lodging.

Carefully mange inputs• Nitrogen fertilizer,
critical for yield and protein
• Can we gain efficiencies with in-season applications or with a slow release product like ESN?

-4
-3
-2
-1
0
1
2
3
4
5
6
7
4-5 lf BootDiffe
renc
e in
yie
ld (b
u/ac
re)
Difference in yield of spring wheat when urea was applied in-season (30 lbs/acre) at two timings compared adding pre-plant.
C1 17 C2 17 Pros 17 Hett 17 Ada 17 Gent 17 Ada 15 Arg 15 Pros 15 Ada 16 RLF 16 C 16

-0.8
-0.6
-0.4
-0.2
0
0.2
0.4
0.6
0.8
4-5 lf Boot
Diffe
renc
e in
pro
tein
con
tent
(%)
Difference in protein % of spring wheat when urea was applied in-season (30 lbs/acre) at two timings compared adding pre-plant.
C1 17 C2 17 Pros 17 Hett 17 Ada 17 Gent 17 Ada 15 Arg 15 Pros 15 Ada 16 RLF 16 C 16
0
0.1
0.2
0.3
0.4
0.5
0.6
0.7
0.8
0.9
Protein
Diff
eren
ce in
pro
tein
(%)
-8
-6
-4
-2
0
2
4
6
8
Yield
Diff
eren
ce in
yie
ld (b
u/ac
re)
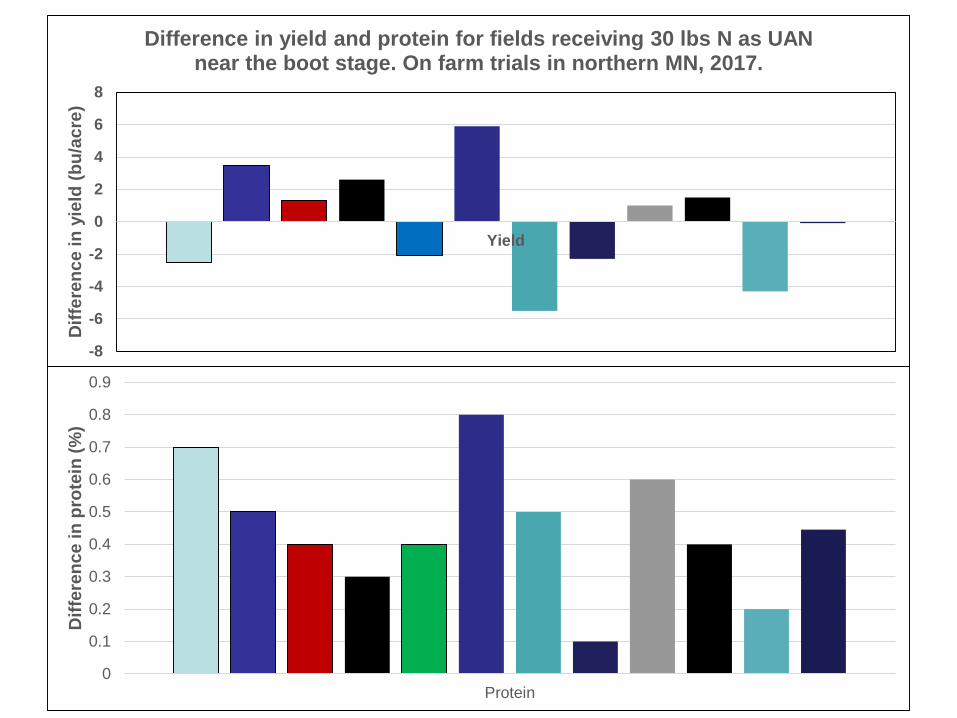
Difference in yield and protein for fields receiving 30 lbs N as UAN near the boot stage. On farm trials in northern MN, 2017.

-1.5
-1
-0.5
0
0.5
1
1.5
Spring 75 Fall 75 Spring 100 Fall 100
Diff
eren
ce in
pro
tein
(%)
Difference in grain protein % between N sources (ESN – urea) at two rates and two timings, five environments 2016-17.
Ada 17 Cass 17 Steele 16 Cass 16 Ada 16
-15-10-505
10152025
Spring 75 Fall 75 Spring 100 Fall 100
Diff
eren
ce in
yie
ld (b
u/ac
re)
Difference in yield between N sources (ESN – urea) at two rates and two timings, five environments 2016-17.
Ada 17 Cass 17 Steele 16 Cass 16 Ada 16
N management• Response in yield to split applications of N
variable– Carefully determine best pre-plant rates
• Increase in protein with boot stage application modest (bump from boot stage < that post anthesis
• ESN response depended on environment– Useful for seasons and soils > N loss
• No data on impact splits and ESN on lodging

Growth regulators to reduce lodging
With higher yields & higher N rates, lodging can significantly reduce yield and increase time needed for harvest

-5
-4
-3
-2
-1
0
1
2
Height
Diff
eren
ce in
hei
ght (
inch
es) 2016
-4
-2
0
2
4
6
8
10
Yield
Diff
eren
ce in
yie
ld (b
u/ac
re)
Difference (treatment – no treatment) in yield and plant height with application of Palisade at Feekes 7 (two nodes visible), on-farm
trials in northern MN, 2016 & 2017.
20162017
2017

Small plot research, 2017, two locations in ND, two varieties and two fertilizer levels.
Prosper
Ht(in)
Yield(bu/a)
Stemdia
Control 28.2 61.5 2.58
Palisade 14 oz, (1st node) 27.5 61.8 2.65
Steele County
Control 30 56.0 2.62
Palisade 14 oz, (1st node) 28 55.0 2.68

Use of growth regulators
• Palisades has the potential for reducing height, thicken stems and reducing lodging
• Environment plays a significant role in the response of spring wheat to this treatment
• Given inconsistency, consider use of a more lodging resistant variety (back to step 1)

Conclusions• Excellent potential for continued increases in wheat
productivity• Research in 2017 demonstrated the value of careful
variety selection• Staying with current seeding rate recommendations• Most N pre-plant – carefully determine rate
– Splits and ESN for locations prone to losses• Palisade can reduce plant ht, but variety selection
may be more profitable way to managing lodging

Questions?