moving to goes-16: a new generation of goes amvs
TRANSCRIPT

EUMETSAT/ECMWF Fellowship ProgrammeResearch Report No. 49
Moving to GOES-16: a new generation ofGOES AMVs
K. Lean and N. Bormann
Jan 2019

Series: EUMETSAT/ECMWF Fellowship Programme Research Reports
A full list of ECMWF Publications can be found on our web site under:http://www.ecmwf.int/publications/
Contact: [email protected]
c©Copyright 2019
European Centre for Medium Range Weather ForecastsShinfield Park, Reading, RG2 9AX, England
Literary and scientific copyrights belong to ECMWF and are reserved in all countries. This publicationis not to be reprinted or translated in whole or in part without the written permission of the Director-General. Appropriate non-commercial use will normally be granted under the condition that referenceis made to ECMWF.
The information within this publication is given in good faith and considered to be true, but ECMWFaccepts no liability for error, omission and for loss or damage arising from its use.

Moving to GOES-16: a new generation of GOES AMVs
Contents
1 Introduction 3
2 GOES data 4
2.1 Changes in AMV derivation . . . . . . . . . . . . . . . . . . . . . . . . . . . . . . . . 4
2.1.1 GOES-13 and GOES-15 . . . . . . . . . . . . . . . . . . . . . . . . . . . . . . 4
2.1.2 GOES-16 . . . . . . . . . . . . . . . . . . . . . . . . . . . . . . . . . . . . . . 5
3 Initial quality assessment 5
3.1 Change in data volume and distribution . . . . . . . . . . . . . . . . . . . . . . . . . . 5
3.2 Quality indicator relationship . . . . . . . . . . . . . . . . . . . . . . . . . . . . . . . . 6
3.3 Changes in speed bias and RMSVD . . . . . . . . . . . . . . . . . . . . . . . . . . . . 8
3.4 Overlap regions with Meteosat-10 and GOES-15 . . . . . . . . . . . . . . . . . . . . . 11
4 Assimilation experiments 13
4.1 Blacklisting choices and observation error . . . . . . . . . . . . . . . . . . . . . . . . . 14
4.2 Experiment results . . . . . . . . . . . . . . . . . . . . . . . . . . . . . . . . . . . . . 15
5 Summary 17
5.1 Future options . . . . . . . . . . . . . . . . . . . . . . . . . . . . . . . . . . . . . . . . 20
Research Report No. 49 1

Moving to GOES-16: a new generation of GOES AMVs
Executive summary
GOES-16 is the first of the third generation of GOES satellites and in December 2017 replaced GOES-13 as the primary satellite in the GOES-East position. GOES-16 carries the Advanced Baseline Imager(ABI) instrument from which Atmospheric Motion Vectors (AMVs) can be derived. ABI is a moreadvanced instrument than its predecessor on GOES-13. A new AMV derivation method has also beendeveloped which employs a nested tracking method to calculate the initial vector and uses an optimalestimation approach for the height assignment. The combination of new instrument and algorithm hasled to a significant increase in the number of AMVs and changes in the characteristics of the data.
A quality assessment using first guess departure statistics showed that after appropriate quality controlmeasures GOES-16 was able to achieve Root Mean Square Vector Difference (RMSVD) values thatwere generally similar to GOES-13/-15 and better than Meteosat-10 in the overlap region. The speedbias was more mixed with larger negative biases at low pressures and larger biases particularly in thetropics. Early test data where the GOES-16 algorithm had been modified and applied to GOES-13/-15data presented different speed bias patterns with generally more positive/less negative speed biases. Ouranalysis therefore suggests that the characteristics of the new ABI instrument contribute at least as muchto the different data quality as the change in the derivation algorithm. This assumes that similar settingsare used as far as possible for the derivation algorithm across both generations of satellite.
With more conservative spatial blacklisting employed, the GOES-16 data were tested in assimilationexperiments. Forecast impacts were generally neutral but encouragingly, small reductions in the vectorwind error (verified against own analysis) were seen at short range forecasts at low levels and in thesouthern hemisphere. Changes to the fit of independent observations to the model background werealso mostly neutral with indications of positive benefit in some humidity sensitive microwave soundingchannels. Operational monitoring of GOES-16 AMVs at ECMWF started on 17th April 2018 whileactive assimilation began on 22nd May 2018.
2 Research Report No. 49

Moving to GOES-16: a new generation of GOES AMVs
1 Introduction
At ECMWF, there are traditionally five geostationary satellites that provide AMV and Clear Sky Ra-diance/All Sky Radiance (CSR/ASR) coverage for the tropics and mid-latitudes. On 17th November2016, GOES-16 was launched and initially stationed in a “GOES-Central” position at 89.5◦W. After along commissioning phase, the satellite performed a drift to 75.2◦W (30th November - 11th December2017), and became recognised as the operational GOES-East satellite, taking over from GOES-13, on18th December 2017. Once in the new orbit position, the time overlap with GOES-13 was very shortwith the end of parallel activities on 8th January 2018. Operational monitoring of GOES-16 AMVs atECMWF started on 17th April 2018 while active assimilation began on 22nd May 2018.
Key attributes of GOES-13 and -16 relevant for the AMVs are summarised in Table 1. GOES-16 carriesthe Advanced Baseline Imager (ABI) which is more advanced than its predecessor on GOES-13, with 16channels compared to 5 channels previously. This results in six channels available for AMV cloud andwater vapour tracking whereas four were used on GOES-13/-15. In practice, although there are threewater vapour channels, cloud tracked winds are currently only produced from the shortest wavelength(6.15µm). ABI also has a higher temporal and spatial resolution. Coupled with a new instrument, theAMV derivation algorithm has also changed considerably. GOES-13 and same generation GOES-15(still in service at the time of testing) use long-established tracking and height assignment methods andemploy an auto-editor, which adjusts the assigned heights and speeds of selected winds, leading to moredependence on Numerical Weather Prediction (NWP) data (Nieman et al., 1997; Velden et al., 1998).For GOES-16, this auto-editor step has been removed and both the tracking and height assignment stepsuse new techniques which will be discussed in more detail in section 2.
While small samples of test data were acquired and used to complete the technical set up required toingest GOES-16 data during the latter half of 2017, AMVs were not routinely received and processeduntil 15th December 2017. For a significant change in instrument and processing such as this case, therecommendation is for an overlap period of 9 months (Bormann and Cotton, 2016) to allow sufficientanalysis time. With the very short parallel phase of GOES-16 and GOES-13, it was evident that therewould regrettably be a gap in coverage while testing was carried out. In order to avoid this gap persistingfor too long, experimentation for the best configuration of the GOES-16 AMVs was not conducted asextensively as preferred. In addition, improvements to the height assignment are planned by NOAA tobe implemented in the future which may change the strategy for optimal use of the data. The focus in thisreport is the replacement of the AMVs (using the current version of the data) however, the CSR productwas also changed from GOES-13 to GOES-16. More details of this assessment can be found in Burrows(2018).
Once GOES-16 AMVs were available, these were the priority for experimentation however, from 10thFebruary 2017 GOES-13 and -15 AMVs were produced with the new derivation method applied. Thisallowed an opportunity to see the algorithm, although adapted for the older instrument, in isolation fromthe instrument change.
After summarising the data sources and availability in section 2 the data quality assessment of the GOES-16 AMVs is presented (section 3). Here, first guess departure statistics (differences between observationsand model background values provided by a short T+12 hour forecast from the previous model cycle) areused to characterise the AMVs and allow comparison to GOES-13 and adjacent satellites overlapping incoverage (GOES-15 and Meteosat-10 at the time of testing). Insights into the algorithm from reprocess-ing GOES-13/-15 will also be discussed here. In section 4 results from the assimilation of the GOES-16will be presented and section 5 will summarise the work and look at future use of GOES-16.
Research Report No. 49 3

Moving to GOES-16: a new generation of GOES AMVs
Table 1: Instrument details for IMAGER on GOES-13 and ABI on GOES-16. (IR = Infrared, Vis = Visible, WV =Water Vapour, SWIR = Short wavelength IR)
GOES-13 GOES-16Position 75.0◦W 75.2◦W
Imaging instrument IMAGER ABI
Channel wavelengths forcloud tracked AMVs (µm)
IR (10.7) IR (10.3)Vis (0.65) Vis (0.64)
WV1 (6.55) WV1 (6.15)SWIR (3.9) SWIR (3.9)
Pixel resolution(at sub-satellite point)
1km (Vis) 0.5km (Vis)4km (IR, SWIR, WV) 2km (IR, SWIR, WV)
Time between full disk images 30 mins 15 mins
2 GOES data
Regular acquisition of GOES-16 data began on 15th December 2017. GOES-13 data were processed atECMWF until 2nd January 2018 in anticipation of an end of data transmission on 3rd January (whichwas subsequently extended at late notice by NOAA until 8th January). Due to various data limitations,assimilation experiments were conducted from 20th December 2017 - 9th March 2018. Operationalmonitoring of the data started on 17th April 2018 with activation following on 22nd May 2018. Prior toreceiving the GOES-16 data, GOES-13 and -15 AMVs reprocessed with the new algorithm were madeavailable. The reprocessed data presented here are for the period 1st March - 15th April 2017.
For the initial data quality assessment statistics are calculated using the difference between observationsand the model background provided by experiments using a reduced resolution version (TCo399 (25km))of cycle 43r3 of the model which was the operational system at the time. In this experiment, no AMVswere assimilated in the GOES-East position. At ECMWF, the primary focus has been on using trackingof cloud rather than clear sky water vapour features while AMVs from short wavelength IR channel arealso not currently used. Therefore, the analysis presented here will only include the longer wavelengthinfrared, visible and single water vapour channel used for cloud tracked winds.
2.1 Changes in AMV derivation
2.1.1 GOES-13 and GOES-15
The algorithm for GOES-13 and -15 uses long-standing techniques of tracking single vectors using corre-lation surfaces and height assignment methods such as CO2 slicing or the water vapour intercept method(Nieman et al., 1997; Velden et al., 1998). Additionally, there is an option to use AMVs that have passedthrough an auto-editor which includes an adjustment of the heights through minimisation of a penaltyfunction combining the observations with NWP data (Velden et al., 1998). The auto-edited AMVs aresubsequently more dependent on the NWP data. The auto-editor also has a component that performs anadjustment that increases the speed by 7% to mitigate against slow biases (Nieman et al., 1997; Forsytheand Saunders, 2008b) for cloudy infrared and water vapour winds above 300hPa, in the extra-tropicsand with speeds faster than 10m/s. Studies comparing statistics of the edited and unedited winds e.g.Forsythe and Saunders (2008b); von Bremen et al. (2008) have shown that the auto-editor results in bet-
4 Research Report No. 49

Moving to GOES-16: a new generation of GOES AMVs
ter agreement of the AMVs with other NWP models. However, while the auto-editor produces windsthat are shown to be in better agreement with model background fields it is at the expense of the NWPindependence and the apparent improvement might just be indicating agreement between NWP modelsand the NCEP model. Note that the GOES-13/-15 data acquired and operationally used at ECMWFinclude the auto-editor as part of the processing.
2.1.2 GOES-16
The new algorithm for GOES-16 changes both the tracking and height assignment steps. The initialvector is now acquired through a nested tracking approach which derives vectors from multiple targetswithin a search box and uses a cluster analysis algorithm to get the dominant motion. The largest clusteris used for the final motion vector (Daniels et al., 2012). One aim of this particular method is to thereduce the slow speed bias (Bresky et al., 2012). Meanwhile, the height assignment is now carried outby an optimal estimation technique. The ABI Cloud Height Algorithm (ACHA) is used to derive cloudparameters including the cloud top height for use in the AMV product (Bresky et al., 2012; Heidinger,2013). This method also allows for multi-layer cloud solutions. Another important change is that theauto-editor is no longer employed therefore reducing this element of dependence on the NWP fields.More detail on the derivation can be found in the “GOES-R Advanced Baseline Imager (ABI) AlgorithmTheoretical Basis Document for Derived Motion Winds” (Daniels et al., 2012).
The height assignment in the new algorithm relies on a particular combination of channels on the imaginginstrument. For GOES-16 these are the 11.2, 12.3 and 13.3µm channels (Heidinger, 2013). However,this selection cannot be copied between GOES-16 and GOES-13/-15 as the less advanced imager on theolder generation only have long wavelength channels available at 10.7 and 13.3µm. The difference ininstruments results in the requirement to adapt the derivation between the satellites. It is assumed thatother settings for the derivation are, as far as possible, common to both generations of GOES satellite.However, full details of the adaption of the method to GOES-13/-15 are currently unavailable.
Once in orbit, problems have been identified with the GOES-16 derivation by NOAA (e.g. Danielset al. (2018)) relating to the gross error checking and the height assignment. The change in gross errorchecking is not thought to have a very large impact as the first guess checking procedure used at ECMWF,which rejects AMVs that deviate too far from the model background value, should perform a similarfunction. The height assignment changes, based on analysis carried out at NOAA, aim to reduce slowspeed biases found at low pressures, peaking around 200hPa and mid-levels (500-600hPa) in addition toa positive speed bias in mid latitudes around 400-500hPa. The new version of the data has not yet beenreleased so the product in its current state has been tested and implemented at ECMWF.
3 Initial quality assessment
3.1 Change in data volume and distribution
Analysis of the GOES-13/-15 data with the old and new algorithm revealed an approximate doubling ofthe number of AMVs through the change in algorithm alone (not shown). However, once combined withhigher spatial and temporal resolution of ABI on GOES-16, the number of AMVs doubles again to giveroughly four times the number and an even higher increase (around six times) for the visible channel(Figure 1). In addition to the increase in AMVs, the distribution has also changed (Figure 2). Thereare proportionally fewer mid-level AMVs (400-700hPa) - the assigned heights are now concentrated
Research Report No. 49 5

Moving to GOES-16: a new generation of GOES AMVs
Figure 1: Time series showing the daily number of AMVs derived for the infrared, visible and water vapourchannels on GOES-16 (left) and GOES-13 (right). Data are from 15th Dec 2017 - 1st Jan 2018. No screening hasbeen applied.
into narrower bands in the upper and lower troposphere. This change in pattern was also present in theGOES-13/-15 reprocessed data suggesting that the difference can be attributed to the algorithm.
3.2 Quality indicator relationship
The AMVs from GOES-13/-15 are provided with both forecast dependent and independent quality in-dicator (QI) values while GOES-16 data are distributed with the forecast independent value only. Tra-ditionally at ECMWF, a threshold has been placed on the forecast independent QI value where sensibleto eliminate data of obvious poorer quality in the first step of screening. The forecast independent ver-sion is preferred in order to avoid aliasing in NWP data from the model of the data provider (Holmlund,1998). Figure 3 shows examples of the dependence of RMSVD on the QI value using the high level,northern hemisphere infrared winds. However, the patterns here are representative of other geographicareas, heights and channels. For GOES-13/-15 there was a weak relationship between RMSVD and thehigher QI values. This led to using a threshold of 50 which in practice results in all the data being usedas data with lower values are not disseminated (for comparison the Meteosat satellites at ECMWF havea threshold of 85).
GOES-16 AMVs are provided with varying ranges of QI values from 60 to 100 for the infrared and watervapour channel and 10 to 100 for the visible channel. For GOES-16, the dependence on very high QIvalues becomes very strong with a clear decrease in RMSVD above values of around 85 while valuesare much higher at lower QI (Figure 3). This is in stark contrast to the relatively weak dependence onthe QI seen previously with operational GOES-13 winds. The behaviour is also different compared tothe statistics for the reprocessed GOES-13/-15 AMVs. While the RMSVD generally improves as the QIvalue increases for the GOES-13 winds processed with the new algorithm, the reduction is much gentler.For GOES-13/-15 with the new algorithm, the QI can be used to identify winds of very poor quality butappears to have difficulty differentiating the average and very good winds, as for the old algorithm. Thereasons for these differences are not fully understood. The use of the auto-editor has been proposed asa factor for the weak dependence in the past (J. Daniels, NOAA, pers. comm), but the reasons for thedifferences between the two datasets processed with the new algorithm are not clear.
6 Research Report No. 49

Moving to GOES-16: a new generation of GOES AMVs
Figure 2: Bar chart showing the distribution of the normalised number of AMVs derived for the infrared channelon GOES-16 (blue) and GOES-13 (orange). Data are from the northern hemisphere for the period 15th Dec 2017- 1st Jan 2018. No screening has been applied.
Figure 3: Relationship between the RMSVD and forecast independent QI for the infrared channel on GOES-16(top left), GOES-13 using the operational algorithm (top right) and GOES-13 using the new algorithm (bottom).The diamond points indicate RMSVD values while the bars correspond to the number of AMVs assigned each QIvalue. Data are for the northern hemisphere (latitude > 25◦N) and low pressure (P < 400hPa). No screening hasbeen applied and data from the reprocessed GOES-13 data are from 1st March - 14th April 2016 while the datafor GOES-13 (operational) and GOES-16 is for 15th Dec 2017 - 1st Jan 2018.
Research Report No. 49 7

Moving to GOES-16: a new generation of GOES AMVs
The stronger relationship and large numbers of GOES-16 AMVs with high QI values suggests that athreshold of 90 might provide a good compromise between eliminating data of poorer quality whilekeeping a good number of observations. This threshold achieves a roughly similar RMSVD as for theprevious operational GOES-13 data.
3.3 Changes in speed bias and RMSVD
In the following, we will have a closer look at departure statistics for GOES-16 in terms of speed biasand RMSVD. To remove outliers skewing the statistics and make the comparison with the GOES-13/-15data where the auto-editor is employed, the first guess check was applied to all the satellites. In addition,appropriate QI screening based on the above analysis was used with thresholds of 90, 85 and 50 forGOES-16, reprocessed GOES-13/-15 and the operational GOES-13/-15 data respectively. These valueswere chosen to aim for comparable RMSVD weighed against retaining a practical number of AMVs.Despite the restricted comparison period between GOES-13/-16, features discussed here for GOES-16appeared relatively stable when generated over a full month period and similar conclusions were foundwhen comparing to GOES-15 (15th Dec 2017 - 14th Jan 2018), despite the differences in geographiccoverage.
The bar charts shown in figure 4 and figure 5 allow a more detailed look at the vertical structure of thestatistics in the tropics and northern hemisphere for the infrared channel for GOES-16 and the repro-cessed and operational GOES-13 data. For the GOES-13/-15 data with the new algorithm, the speed biasis generally less negative/more positive compared to the results with the operational algorithm with theexception of very low pressures where it has become more negative. The nested tracking part of the newalgorithm in particular is intended to reduce slow speed biases in the AMVs (Bresky et al., 2012) and theartificial speed-up of the winds, as part of the auto-editor, is removed.
In contrast, when considering the GOES-16 AMVs the general trend of the speed bias, particularly athigh and low levels, becomes more negative (up to 0.5 m/s) compared to the operational GOES-13 winds.This is the opposite of the behaviour seen previously when comparing GOES-13 data with the new andold algorithm. The change in data characteristics when moving to GOES-16 results from combining thenew algorithm with the more advanced ABI instrument where, for example, there are additional channelsavailable for the height assignment. At very low pressures the more negative speed bias with the newalgorithm is also present for GOES-16. The difference in assigned - best-fit pressure (the model pressurethat minimises the vector difference between the AMV and the model wind e.g. Forsythe and Saunders(2008a)) also shows a negative bias for both GOES-16 and reprocessed GOES-13/-15 in this region. Thisindicates that some of the AMVs may be assigned too high. As two different periods are used for GOES-16 and the reprocessed GOES-13/-15 data there are potentially different biases in the model backgroundto consider. However, the operational GOES-13 statistics look similar in both cases so it is likely to be aminor factor that can be ignored.
For the RMSVD values there is more similarity between the satellites and algorithms (usually within1m/s) although at mid-levels in the tropics the infrared channel is improved with the new algorithm.In the visible channel, the values of RMSVD are quite comparable in the dense regions of AMVs (notshown). The broad agreement is expected, as it was one factor in determining the QI thresholds appliedto each dataset. Also it is useful to note that while it is desirable to use the independently calculated QIas a first step in removing data, the first guess check performs a significant role in screening data. Theapplication of this step alone greatly reduces the gap in the magnitude of the RMSVD for the differentdata sets from the values seen when analysing figure 3.
8 Research Report No. 49

Moving to GOES-16: a new generation of GOES AMVs
Figure 4: Bar charts for the tropics (±25◦N) showing the speed bias (top row) and RMSVD (bottom row) forthe GOES-13 data using the new algorithm and operational (left column) and GOES-16 compared to GOES-13(right column). Data are for the infrared channel using the period 1st March - 14th April 2016 for the reprocessedGOES-13/operational GOES-13 comparison and from 15th Dec 2017 - 1st Jan 2018 for the comparison of GOES-13/GOES-16. Data have been screened using satellite specific QI thresholds and first guess check.
Research Report No. 49 9

Moving to GOES-16: a new generation of GOES AMVs
Figure 5: As for figure 4 except data are from the northern hemisphere (latitude > 25◦N).
10 Research Report No. 49

Moving to GOES-16: a new generation of GOES AMVs
Figure 6: Zonal plots of the speed bias (top row) and the RMSVD (bottom row) for GOES-16 (left column) andGOES-13 (right column). AMVs are from the water vapour for the period 15th Dec 2017 - 1st Jan 2018 and datahave been averaged into 10hPa by 1◦ latitude boxes with boxes containing fewer than 20 AMVs excluded. QIthresholds of 90 and 50 are applied to GOES-16 and GOES-13 respectively in addition to a first guess screeningcheck.
Zonal plots (figure 6) compare the RMSVD and speed bias for the water vapour channel on GOES-16and GOES-13. Firstly, the water vapour winds are no longer produced at pressures higher than 350hPa(at ECMWF, GOES-13/-15 winds were screened from assimilation at pressure > 400hPa). In the extra-tropics at pressures around 300-350hPa, GOES-16 exhibits larger positive speed biases of around 2-2.5m/s (figure 5 also shows a small positive speed bias for the infrared channel in a similar region). Thereare also larger negative speed biases and RMSVD values at the lowest pressures in the water vapourchannel for GOES-16, as for the infrared channel. The RMSVD is also larger in the tropics, particularly0-20◦N and accompanied by more negative speed biases than in GOES-13.
3.4 Overlap regions with Meteosat-10 and GOES-15
The GOES-16 AMVs were also compared in the overlap regions with adjacent satellites - Meteosat-10to the east and GOES-15 to the west. Figure 7 shows the difference in speed bias for high and low levelinfrared AMVs GOES-16 compared to Meteosat-10. The speed bias is larger for GOES-16 at high levelsin the tropics which was a feature also seen in the overlap region with GOES-15 (not shown) and againstGOES-13, discussed in the previous section. In the northern hemisphere, the overlap with both satellitesat high levels in contrast shows better agreement for GOES-16. At low levels, differences are smallerboth in the infrared and visible channel (not shown) between both adjacent satellites.
Research Report No. 49 11

Moving to GOES-16: a new generation of GOES AMVs
Figure 7: Maps showing the difference in absolute value of speed bias for GOES-16-Meteosat-10 at low pressure(left) and high pressure (right). Blue colours indicate a bias closer to zero for GOES-16. Data are from the infraredchannel after QI and first guess screening have been applied and for the dates 15th Dec 2017 - 14th Jan 2018.
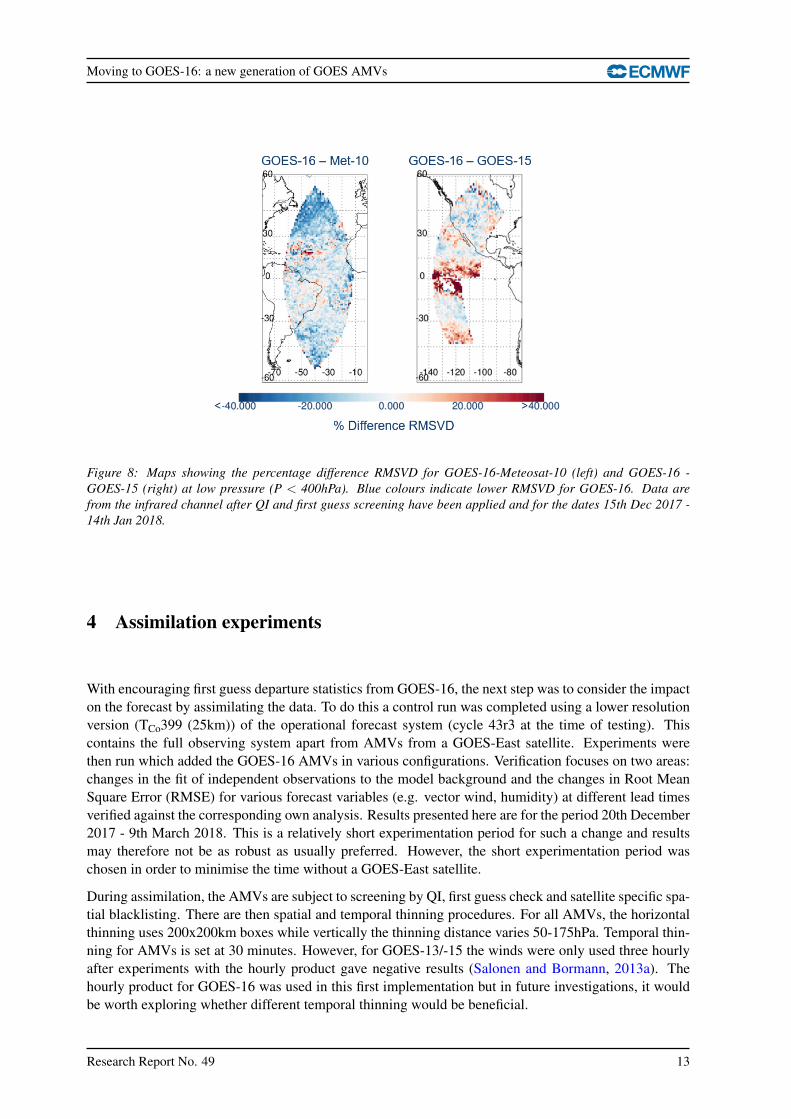
For the RMSVD, values compared to Meteosat-10 are broadly smaller by 10-20% such as in the examplefor the high level infrared winds shown in figure 8. The difference with GOES-15 is more mixed thoughwith higher RMSVD for GOES-16 in the tropics region particularly. A similar pattern is seen for thewater vapour channel as well. Meanwhile, at low levels the RMSVD values are more similar betweenGOES-16 and GOES-15 in both the infrared and visible channels, supporting the earlier discussionwhen comparing to GOES-13 in the previous section 3.3. Again, GOES-16 displays better agreementthan Meteosat-10 for the low levels (not shown).
The poorer performance of the GOES-16 data at high levels, in terms of RMSVD and speed bias, mightbe linked to the sub-optimal height assignment being investigated by NOAA. It is also important to re-member though that when comparing the new algorithm to the operational algorithm the auto-editor givesan unfair advantage. While statistics may look ‘better‘ for the operational product, this is at the expenseof independence from NWP and smaller first guess departures can be partially a result of agreementbetween the ECMWF and NCEP model wind fields.
The key points from this data assessment using first guess departures are as follows:
• After screening has been applied, many more AMVs are available from GOES-16 while achievingsimilar data quality to operational, old algorithm GOES-13/-15 AMVs in general.
• At smaller scales, significant differences are found in the vertical data characteristics betweenGOES-16 and GOES-13 AMVs. In particular, regions at high levels exhibited larger speed biases.
• Comparison with GOES-13 AMVs reprocessed with an adapted version of the GOES-16 algo-rithm suggest that the more advanced ABI instrument and new algorithm both have a substantialinfluence on the differences between GOES-16 and operational GOES-13 data.
12 Research Report No. 49
Moving to GOES-16: a new generation of GOES AMVs
Figure 8: Maps showing the percentage difference RMSVD for GOES-16-Meteosat-10 (left) and GOES-16 -GOES-15 (right) at low pressure (P < 400hPa). Blue colours indicate lower RMSVD for GOES-16. Data arefrom the infrared channel after QI and first guess screening have been applied and for the dates 15th Dec 2017 -14th Jan 2018.
4 Assimilation experiments
With encouraging first guess departure statistics from GOES-16, the next step was to consider the impacton the forecast by assimilating the data. To do this a control run was completed using a lower resolutionversion (TCo399 (25km)) of the operational forecast system (cycle 43r3 at the time of testing). Thiscontains the full observing system apart from AMVs from a GOES-East satellite. Experiments werethen run which added the GOES-16 AMVs in various configurations. Verification focuses on two areas:changes in the fit of independent observations to the model background and the changes in Root MeanSquare Error (RMSE) for various forecast variables (e.g. vector wind, humidity) at different lead timesverified against the corresponding own analysis. Results presented here are for the period 20th December2017 - 9th March 2018. This is a relatively short experimentation period for such a change and resultsmay therefore not be as robust as usually preferred. However, the short experimentation period waschosen in order to minimise the time without a GOES-East satellite.
During assimilation, the AMVs are subject to screening by QI, first guess check and satellite specific spa-tial blacklisting. There are then spatial and temporal thinning procedures. For all AMVs, the horizontalthinning uses 200x200km boxes while vertically the thinning distance varies 50-175hPa. Temporal thin-ning for AMVs is set at 30 minutes. However, for GOES-13/-15 the winds were only used three hourlyafter experiments with the hourly product gave negative results (Salonen and Bormann, 2013a). Thehourly product for GOES-16 was used in this first implementation but in future investigations, it wouldbe worth exploring whether different temporal thinning would be beneficial.
Research Report No. 49 13

Moving to GOES-16: a new generation of GOES AMVs
4.1 Blacklisting choices and observation error
Initially, a less conservative use of the data was trialled - in addition to screening using a QI threshold of90 (as discussed earlier) and the first guess screening, the spatial blacklisting of the data was more relaxedcompared to other geostationary satellites. However, significant negative impacts were seen at highlevels in the tropics both degrading the fit of conventional wind observations to the model backgroundand increasing RMSE in the short range forecast vector wind field. The tropics are an area where ithas been more challenging to add AMVs - both Himawari-8 and the two Meteosat satellites currentlyin operational use have screening applied in the mid and low levels. GOES-16 unusually presented astronger signal at the upper levels which may be linked to sub-optimal height assignment and has thepotential to be improved in the future changes from NOAA. For now, more restrictive use of the data inthe tropics was sufficient to eliminate this negative signal.
Based on first guess departure statistics and using the experience from the initial experiments makingbolder use of the data, the configuration proposed for GOES-16 is to allow data for:
• Visible: pressure > 700hPa for all latitudes
• Infrared: pressure > 150hPa for |latitude| ≥ 25 and 200hPa < pressure < 300hPa for |latitude| <25
• Water vapour: 150hPa < pressure ≤ 300hPa for |latitude| ≥ 25 and 200hPa < pressure for|latitude| < 25
The above spatial blacklisting is in addition to more general screening for geostationary satellites whichresults in GOES-16 AMVs also being removed for zenith angles above 64◦, over land at all pressures forlatitudes northwards of 20◦N and all AMVs over land with pressure > 500hPa at other latitudes. Despitethe stricter spatial blacklisting, two to three times more AMVs pass the combined quality control andblacklisting applied to GOES-16 compared to GOES-13 over the disk as a whole. This is primarily dueto the higher density of GOES-16 AMVs and due to using the winds hourly rather than 3-hourly.
Prior to testing in assimilation, components for the AMV observation errors are also calculated. AMVsuse situation dependent observation errors which combine the tracking error and error in speed due toerror in height (Salonen and Bormann, 2013b). These are calculated for the separate U and V componentsof the wind. The tracking errors are estimated by the standard deviation of the speed departure (observedminus background departures) using 200hPa layers for cases where the height error is small. In practice,the same values are currently used for all geostationary satellites with values ranging between 2-3m/sdepending on the height. GOES-16 statistics showed that these values were still appropriate estimates.
The height error contribution is estimated by using the variation in the wind profile of the model back-ground about the assigned height, assuming the error in the assigned pressure is Gaussian with a standarddeviation estimated by the standard deviation of the assigned - model best-fit pressure. Statistics are gen-erated, also using 200hPa layers and separately for U and V components, for GOES-16 after screeningby QI and the satellite specific spatial blacklisting detailed above. The values for the standard devia-tion and bias of the AMV - best-fit pressure are similar to GOES-13/-15 and Meteosat-10. For all foursatellites, height assignment errors are around 40-60hPa for high level AMVs while in the lowest layer(800-1000hPa) and next lowest (600-800hPa) values are around 70-90hPa and 120-170hPa respectively.The blacklisting has the effect of reducing the standard deviation by around 10-15hPa (around 10%) forthe impacted 200hPa bands (not shown).
14 Research Report No. 49

Moving to GOES-16: a new generation of GOES AMVs
Figure 9: Zonal plots of the change in vector wind RMS error verified against own analysis for 24 and 48 hourlead times comparing the addition of the GOES-16 to the control with no GOES-E AMVs. Data are from 20th Dec2017 - 9th March 2018. Black hatched lines indicate significance at the 95% level.
4.2 Experiment results
In the verification against own analysis, the addition of GOES-16 reduces the RMS vector wind errorparticularly at high pressures and in the southern hemisphere in the short range forecast ranges up to T+48(Figure 9). Considering maps of the impact there is a clear area of vector wind error reduction in muchof the region of the GOES-16 disk at 850hPa and over South America at 200hPa (Figure 10). However,there is a localised area of apparent degradation in the Pacific Ocean to the west of South America. Priorto removal of the high AMVs above 200hPa in the tropics, there was a much larger degradation area andnegative impacts in the fit of conventional wind observations to the model background (not shown).
The remaining area of potential degradation here is very sparsely covered by conventional observationsbut there is one radiosonde in the vicinity which is located on Easter Island (27.1◦S, 109.3◦W). Lookingat the standard deviation of the fit of the observations to the model background from this site withthe addition of GOES-16 is mostly neutral and in fact there is positive impact (a reduction in standarddeviation) for the V component at 200-250hPa (Figure 11). The feature also does not propagate far intothe forecast, almost disappearing by a lead time of 48 hours. The evidence suggests that the apparentdegradation in the verification is not something that should cause concern and it is likely an artefact ofown-analysis verification.
The tropics can be a difficult area to interpret in the verification, particularly against own analysis. Moregenerally, the tropics present a difficult area in data assimilation for example, Zagar et al. (2016) sug-gest issues arising from complex dynamics and a lack of wind profile information. This implies furtherwind observations would be valuable but the verification of the additional AMV data often shows appar-ent tropical degradation of wind fields when verified against own analysis (e.g. Salonen and Bormann(2016); Lean et al. (2016)). This may in fact be partly a limitation of the verification, as adding datain otherwise poorly observed regions will necessarily show larger differences between analyses andshort-range forecasts when own-analysis verification is used. A lack of independent observations furthercontributes to these verification difficulties. The recent launch of Aeolus in August 2018 is expected toprovide useful constraints in the tropics and be an important independent check of the AMVs.
Research Report No. 49 15

Moving to GOES-16: a new generation of GOES AMVs
Figure 10: Maps of the change in vector wind RMS error verified against own analysis for 24 and 48 hour leadtimes comparing the addition of the GOES-16 to the control with no GOES-E AMVs. Data are from 20th Dec 2017- 9th March 2018. Black hatched lines indicate significance at the 95% level.
16 Research Report No. 49

Moving to GOES-16: a new generation of GOES AMVs
Figure 11: Change in the standard deviation of the first guess U component (left) and V component (right) of windfor the radiosonde located at Easter Island (27.1◦S, 109.3◦W) for the addition of the GOES-16 compared to thecontrol with no GOES-E AMVs. Data are from 21st Dec 2017 - 9th March 2018. Error bars indicate significanceat the 95% level.
Looking at changes in the fit of other observations to the model background over a broader area cover-ing the disk of GOES-16 (±60◦N, 0-150◦W), the impact on conventional wind observations was eitherneutral or slightly positive though not consistently seen in both radiosonde and pilot balloon verification(Figure 12). A longer experiment period may help to reduce the uncertainties in the impacts and revealany significant changes.
The introduction of wind observations can also indirectly lead to effects on the humidity fields. Figure13 shows a significant positive impact of just over 0.5% consistent across the different humidity sensitivechannels (18-22) of the Advanced Technology Microwave Sounder (ATMS) instrument. However, thetropospheric temperature sounding channels (6-8) also show a small degradation, although at broadergeographic regions this change is neutral. The same degradation is not seen in equivalent channels on theAdvanced Microwave Sounding Unit - A (AMSU-A) instruments irrespective of the satellite orbit timingcompared to ATMS and no clear change is apparent in the temperature analysis field. As the impact is notconsistently seen, it is not viewed as a particularly concerning feature at this time. However, conductingfurther assimilation experiments to assess GOES-16 with the updated height assignment method shouldprovide the opportunity in the future to gather more evidence to support or dismiss this feature.
The impact from GOES-16 shows promising results, despite more conservative use. With the improve-ments to the height assignment anticipated from NOAA it is hoped that the impact will be further im-proved in the future and the blacklisting can eventually be less restrictive.
5 Summary
GOES-13 AMVs have been replaced by GOES-16 in the operational ECMWF assimilation system, aftera 5-month gap in coverage, on 22nd May 2018. In moving to a newer generation satellite with a more
Research Report No. 49 17

Moving to GOES-16: a new generation of GOES AMVs
Figure 12: Change in the standard deviation of the first guess U component (left) and V component (right) of windfor the radiosonde (top row) and pilot balloons (bottom row) for the addition of the GOES-16 compared to thecontrol with no GOES-E AMVs. Data are from 20th Dec 2017 - 9th March 2018 and restricted to the area ±60◦N,0-150◦W. Error bars indicate significance at the 95% level.
18 Research Report No. 49

Moving to GOES-16: a new generation of GOES AMVs
Figure 13: Change in the standard deviation of the first guess brightness temperatures of ATMS for the addition ofthe GOES-16 compared to the control with no GOES-E AMVs. Channels 18-22 are sensitive to humidity. Data arefrom 20th Dec 2017 - 9th March 2018 and restricted to the area±60◦N, 0-150◦W. Error bars indicate significanceat the 95% level.
advanced imaging instrument combined with a new AMV derivation algorithm, there was around afour-six-fold increase in the number of AMVs available. The distribution also changed with AMVsconcentrated more into narrower bands in the upper and lower troposphere.
The RMSVD of the GOES-16 AMVs showed a strong relationship with forecast independent QI valuesabove around 85, with high values at lower QI, allowing the use of a threshold to screen out poorerquality observations. This is in contrast to the GOES-13/-15 AMVs using the old algorithm where littledependence was found. After screening with an appropriately selected QI threshold and a first guessdeparture check, the data quality achieved by GOES-16 was broadly comparable with the operationalGOES-13/-15 and Meteosat-10. There were some specific areas likely related to a suboptimal heightassignment where GOES-16 exhibited worse agreement with the model background. These includedlarger negative biases at high levels, particularly in the tropics, and positive biases below 300hPa in theextra tropics particularly affecting the water vapour channel.
GOES-13/-15 data reprocessed with the new algorithm were made available prior to receiving the GOES-16 AMVs. Our analysis suggested a change in data quality characteristics arising from the introductionof the new algorithm. In particular, the speed biases appeared less negative or more positive. However,it transpired that these results were not a reliable indicator of the behaviour of GOES-16 leading to theconclusion that the new instrument also delivers a similar magnitude of change in data characteristics. Itis encouraging to confirm that advances in the imaging instrument technology have a significant impacton the AMVs. For the implementation of a new algorithm the behaviour needs to be considered carefullywhen applied across different imaging instruments. This could have implications not just for predictingthe quality of AMVs from newer instruments but also in reprocessing activities where recent algorithmsare applied to older satellites.
Despite broader scale similarity in data quality, more conservative spatial blacklisting to remove some ofthe localised areas of larger speed bias was required in assimilation in order to avoid negative impacts in
Research Report No. 49 19

Moving to GOES-16: a new generation of GOES AMVs
the high level tropical wind fields. Impacts were largely neutral although there were some significant re-ductions in the vector wind error at short forecast lead times in the low levels. Small positive changes forsome pressure levels in the conventional winds observations and the humidity sensitive ATMS channelsare encouraging but might benefit from a more robust confirmation over a longer experiment period. Inthe Pacific Ocean (to the west of South America) there is a small area of apparent degradation at 200hPain verification against own analyses. However, there is very little conventional data in the region, makingit poorly constrained and also difficult to verify. The radiosonde in the vicinity of the feature in factshowed positive impact at the higher levels.
5.1 Future options
Improvements to the height assignment stage of the AMV algorithm are anticipated from NOAA in thenear future. These are expected to address some of the data quality issues particularly at high levels. Earlyindications are that this will be a significant change to the data quality and reassessment is anticipated.While there is the potential for further benefit from the changes to the height assignment, there are otherchanges to the GOES-16 configuration that may also give more positive impact. During the assessmentpresented here, two additional experiments were attempted which created a temporal mask to effectivelyturn the data into a three hourly product and the second to inflate the observation errors. Early resultswere inconclusive but with the changes anticipated from NOAA, the re-evaluation may provide a goodopportunity to look more extensively into refining the GOES-16 configuration.
It is hoped that further benefit can be extracted from GOES-16. Looking ahead to GOES-17, it may beuseful to keep in mind some of the characteristics seen here, however, issues identified with the instru-ment regarding the cooling system for the infrared channels (https://www.nesdis.noaa.gov/content/experts-moving-closer-resolving-troubles-noaas-goes-17-abi, re-trieved 24th Oct 2018) will present new challenges in best using the data.
Acknowledgements
Katie Lean is funded by the EUMETSAT Fellowship Programme. Discussions with J. Daniels and histeam at NOAA and their technical assistance in acquiring the data were greatly appreciated.
References
Bormann, N., Cotton, J., 2016. Report from Working Group 2 (WG2): Data Assimilation. Proceedingsof the 13th International Winds Workshop, Monterey, California, 27th June - 1st July 2016.
Bresky, W. C., Daniels, J. M., Bailey, A. A., Wanzong, S. T., 2012. New methods toward minimizing theslow speed bias associated with Atmospheric Motion Vectors. J. Applied Meteorology and Climatol-ogy 51, pp 2137–2151.
Burrows, C. P., 2018. Assimilation of radiance observations from geostationary satellites: First yearreport. EUMETSAT/ECMWF Fellowship Programme Research Report No.47.
Daniels, J., Bresky, W., Bailey, A., Allergrino, A., Wanzong, S., Velden, C., 2018. Introducing Atmo-spheric Motion Vectors Derived from the GOES-16 Advanced Baseline Imager (ABI). Presentation
20 Research Report No. 49

Moving to GOES-16: a new generation of GOES AMVs
given at 14th International Winds Workshop, Jeju City, South Korea, 23-27 April 2018Available onlineat http://cimss.ssec.wisc.edu/iwwg/iww14/talks/01 Monday/1400 IWW14 ABI AMVs Daniels.pdf.
Daniels, J., Bresky, W., Wanzong, S., Velden, C., Berger, H., July 2012. GOES-R Advanced BaselineImager (ABI) Algorithm Theoretical Basis Document for Derived Motion Winds, Version 2.5.
Forsythe, M., Saunders, R., 2008a. AMV errors: a new approach in NWP. Proceedings of the 9th Inter-national Winds Workshop, Annapolis, Maryland, USA, 14-18 April 2008.
Forsythe, M., Saunders, R., 2008b. Third analysis of the data displayed on the NWP SAF AMV monitor-ing website. Available online at https://nwpsaf.eu/site/monitoring/winds-quality-evaluation/amv/amv-analysis-reports/.
Heidinger, A., June 2013. ABI cloud height. Algorithm Theoretical Basis Document, Version 3.0.
Holmlund, K., 1998. The utilization of statistical properties of satellite-derived atmospheric motion vec-tors to derive quality indicators. Wea. Forecasting 13, 1093–1104.
Lean, K., Bormann, N., Salonen, K., 2016. Assessment of Himawari-8 AMV data in the ECMWF sys-tem. EUMETSAT/ECMWF Fellowship Programme Research Report No.42.
Nieman, S. J., Hayden, C. M., Gray, D., Wanzong, S. T., Velden, C. S., Daniels, J., 1997. Fully automatedcloud-drift winds in NESDIS operations. Bull. Amer. Meteor. Soc. 78, 1121–1133.
Salonen, K., Bormann, N., 2013a. Atmospheric Motion Vector observations in the ECMWF system:Third year report. EUMETSAT/ECMWF Fellowship Programme Research Report No.32.
Salonen, K., Bormann, N., 2013b. Winds of change in the use of Atmospheric Motion Vectors in theECMWF system. ECMWF Newsletter 136, 23–27.
Salonen, K., Bormann, N., 2016. Atmospheric Motion Vector observations in the ECMWF system: Fifthyear report. EUMETSAT/ECMWF Fellowship Programme Research Report No.41.
Velden, C. S., Olander, T. L., Wanzong, S., 1998. The impact of multispectral GOES-8 wind informationon Atlantic tropical cyclone track forecasts in 1995. Part I: Dataset methodology, description and caseanalysis. Monthly Weather Review 126, 1202–1218.
von Bremen, L., Bormann, N., Wanzong, S., Hortal, M., Salmond, D., Thepaut, J.-N., Bauer, P., 2008.Evaluation of AMVs derived from ECMWF model simulations. Proceedings of the 9th InternationalWinds Workshop, Annapolis, Maryland, USA, 14-18 April 2008.
Zagar, N., Blaauw, M., Jasenko, B., Magnusson, L., 2016. Diagnosing model performance in the tropics.ECMWF Newsletter 147, 26–33.
Research Report No. 49 21