moving to electronic social security payments: impact on
TRANSCRIPT

Moving to Electronic Social Security Payments:
Impact on the Unbanked
Drew M. Anderson
University of Wisconsin-Madison
Alexander Strand*
Social Security Administration
J. Michael Collins
University of Wisconsin-Madison
September 2012
*Corresponding author:
Alexander Strand
Social Security Administration,
500 E St., SW
Washington, DC 20254
(202) 358-6310
The research reported herein was performed pursuant to a grant from the U.S. Social Security
Administration (SSA) funded as part of the Financial Literacy Research Consortium. The
opinions and conclusions expressed are solely those of the author(s) and do not represent the
opinions or policy of SSA, any agency of the Federal Government, or the Center for Financial
Security at the University of Wisconsin.

1
Moving to Electronic Social Security Payments:
Impact on the Unbanked
Abstract: Social Security payments must be delivered electronically starting in
March 2013. This mandate lowers administrative costs, but may impose transition
costs on payees, especially “unbanked” people without checking or savings accounts
at banks, as they adapt to new transactional financial products. To evaluate policy
impacts, we link survey reports on bank account use to administrative records of
Social Security payments. In contrast with previous studies, we do not find payment
recipients to be unbanked at a higher rate than the rest of the population. Further, we
find that among payment recipients, the majority of the unbanked (as measured by
self-report) already receive their payments electronically (as measured by
administrative records). Therefore the mandate only requires a transition for a small
subset of payees, albeit one with disproportionately low income and a high number
of work-preventing health impairments. Our study highlights the complications of
measuring financial inclusion.
1. Introduction
An important, but often overlooked aspect of the federal safety net is the set of financial
instruments by which payments are delivered. The federal government would prefer inexpensive
electronic transfers into the accounts of recipients over mailing paper checks. For consumers,
bank accounts obviate the high transaction costs of alternatives like check-cashing and money
orders, while safeguarding funds in insured accounts.1 However there are costs to managing a
bank account, including the risks of overdrafts, low-balance charges, and other fees. We study
how households redeem government payments, including people who report not having a bank
account, known the "unbanked."
The well-being of the unbanked population is of policy concern for a few reasons. First,
economically vulnerable subgroups are overrepresented among the unbanked, including people
who are young, poor, in female-headed households, or belong to ethnic or racial minorities
1 We use the term “bank” to include credit unions, thrifts, and other regulated depository financial institutions.

2
(Bricker et al. 2012, Bucks et al. 2006, Bucks et al. 2009). Second, being unbanked itself could
add to economic distress. Unbanked people may use a high portion of their income for
transaction fees, be unable to save, lack access to credit, and be hindered in their ability to find
employment (Barr 2002, 2004, Rhine et al. 2006). Causation is murky, however, because the
modal reason given in surveys for being unbanked is “not enough money” to make banking cost-
effective (Bucks et al. 2006, Bucks et al. 2009, FDIC 2009). Third, and a key focus of our study,
people with disabilities are more likely to be unbanked. A work-limiting impairment may make a
person eligible for government support, while at the same time may introduce physical or
cognitive impediments to accessing banking services.
Concern for the unbanked has slowed the implementation of a government transition to
electronic payments (Prescott and Tatar 1999, Rhine et al. 2006, Federal Register 2010). After
resolving to do so as part of the Debt Collection Improvement Act of 1996, the US Department
of the Treasury finally began shifting all nontax payments from paper checks to direct electronic
deposits in March 2011 and will complete the shift by March 2013. The mandate is predicted to
save over $100 million per year in administrative costs (Federal Register 2010). While
discontinuing the paper check option, the government is introducing an intermediate option, a
low-cost prepaid debit card called Direct Express®. The new choice could help some consumers
move toward conventional banking, even while constraining other consumers who prefer paper
checks.
We focus on Social Security Administration (SSA) payments for Old-Age and Survivors
Insurance (OASI), Disability Insurance (DI), and Supplemental Security Income (SSI), which
account for around 90 percent of nontax federal cash payments (US General Accounting Office
2002). Social Security payments support 18 percent of Americans in our sample. The vast
majority are OASI retirement beneficiaries who often have other assets and sources of income.
DI beneficiaries qualify for benefits on the basis of a substantial and recent work history
curtailed by a long-term health condition. They may receive income from other sources, such as
family members or drawing down assets. By contrast, SSI recipients, who can be adults or
children with disabilities, aged, or blind, do not need a work history but are subject to a means
test. Thus they have very low levels of income, assets, and help from family members.
We link administrative data on SSA payments to a nationally representative Current
Population Survey (CPS) supplement on the use of bank accounts conducted in January 2009,

3
before the phase-in of mandated electronic payments. Our unique data allow for cross-
comparisons of survey responses about bank account access and administrative records of
payment methods used. Unlike previous studies using different methodologies, we find Social
Security payees to be unbanked at the same rate as the general population. We find nearly 92
percent of self-reported banked recipients redeemed their January 2009 payment electronically.
Surprising, we find 69 percent of self-reported unbanked recipients also redeemed their January
2009 payment electronically. This suggests payment recipients have more access to banking
services than their household heads report. We cannot explain the discrepancy with
representative payees outside the household or with prepaid card membership. Therefore these
households are likely misreporting banking status. Misreporting is more common in households
receiving disability payments, complicating the analysis of their financial well-being.
Survey estimates of the unbanked population in our study and previous studies clearly
suffer from measurement error. Our comparison to administrative records of payment delivery
method is one solution to this problem. Bound et al. (2001) review measurement error in survey
reports of a host of economic variables, including earnings, assets, transfer income, health status,
employment, and even savings account ownership. We add the first administrative validation of
survey evidence on transaction accounts more broadly defined.
Even if bank account use is measured perfectly, the unbanked group is often moving in and
out of mainstream banking for many different reasons. We return to survey measures to describe
unbanked payment recipients' preferences, fitting preferences into the environment payees will
eventually face after the shift to electronic payments. Using self-reported preferences, we can
sort 23 percent of unbanked Social Security payees into a group most likely to be helped by
Direct Express ® versus their old choice set, while just 11 percent fall into a group most likely to
be harmed by the move to electronic payments.
We conclude that the portion of Social Security payees affected by this policy change is
small. The unbanked who are currently receiving paper checks face the largest behavioral
change, as they will have to open a transaction account of some kind. These people are also
vulnerable in other ways: poverty, disability, and lack of financial access. Thus we analyze
subgroups by age, earnings, location, education, disability, and use of representative payees to
handle government payments.

4
2. Measuring banking and Social Security payment receipt
Direct survey measures of banking ask respondents whether they possess a transaction
account. This is the approach taken by Federal Deposit Insurance Corporation (FDIC) National
Survey of Unbanked and Underbanked Households, a nationally representative but underutilized
survey that asks Current Population Survey (CPS) respondents if anyone in their household
currently had a checking or savings account at a bank. Just 7.7 percent of households were
unbanked in 2009, which grew to 8.2 percent in 2011 (FDIC 2009, 2011). Similar figures appear
in research that uses the Survey of Consumer Finances (SCF), which asks at the level of the
family. In the SCF, 8.7 percent of families were unbanked in 2001, which gradually fell to 7.5
percent in 2010 (Bucks et al. 2006, Bucks et al. 2009, Bricker et al. 2012). Adding banking
questions to a well-established, broad survey has the benefit of a national representative sample,
but may suffer from misreporting by a household or family head on behalf of other members.
When studying Social Security payments to unbanked households, we wish to know about
the characteristics of payment recipients. The heterogeneity of payment recipients leads to
difficulties both in identifying them in household surveys and in measuring their financial
characteristics. US General Accounting Office (2002) uses survey reports of positive values in
checking or savings accounts to indicate the existence of a bank account. Using the Survey of
Income and Program Participation (SIPP), they estimate that 23 percent of DI and 67 percent of
SSI payment recipients were unbanked. This strategy involves two sources of measurement
error: underreporting of asset holdings and underreporting of payments from SSA (Czajka,
Jacobsen, and Cody, 2003, Huynh, Rupp, and Sears 2002). The first leads to overestimates of the
proportion unbanked and the second leads to errors in identifying the recipient population.
One strategy to eliminate errors in identifying the recipient population is to draw a sample
from SSA’s payment records. Several studies of the vulnerable subgroup receiving paper checks
have drawn samples of recipients known to be receiving paper checks (Booz, Allen & Hamilton
1997, Dove Associates, Inc. 1999, Federal Reserve Bank of St. Louis 2004, KRC Research
2007). As seen in Figure 1, the ranges of estimates for unbanked status among paper check
recipients of DI (20 to 30 percent) and SSI (55 to 70 percent) encompass the US General
Accounting Office estimates. The scale of these studies, however, is small. After low response
rates, they use realized sample sizes of two thousand or less. These small and self-selected
samples may not be representative of the recipient population.

5
Taken together, previous studies indicate that a meaningful proportion of recipients are
unbanked, particularly recipients of SSI payments. In comparison to population estimates based
on the FDIC or SCF data, the clear conclusion is that the proportion unbanked is notably higher
for the recipient population. Looking ahead, our results contrast sharply with this conclusion.
We improve on previous studies by employing a unique combination of data. We address
underreporting of asset holdings by using the FDIC survey that directly asks about possession of
accounts rather than asset amounts, and we address underreporting of payments by using
administrative data. We can also contrast self-reports of banking with administrative records of
payment delivery mode.
3. Data and sample
Since both Social Security payment recipients and the unbanked are small subgroups of the
population, and we intend to study their intersection, we require a large-sample data set with
information on government payments and financial services use. We link the 2009 FDIC
National Survey of Unbanked and Underbanked Households data to SSA records of payments
and earnings.2 Besides identifying unbanked households, the FDIC survey asks about reasons for
not using bank accounts or having closed bank accounts. The payment data include the incidence
of payment and the type of Social Security payment with very low measurement error. We
directly observe the method of payment (electronic or paper check) and the use of representative
payees (a third party who receives the payment from the government on behalf of the
beneficiary). Linking these two data sets creates a unique opportunity to examine both the form
of payments from SSA as well as the preferences of the population who receive them.
The first FDIC National Survey of Unbanked and Underbanked Households was fielded as
a supplement to the January 2009 Current Population Survey (CPS), and administrative data
from SSA were matched to the March 2009 CPS. The CPS provides monthly labor market
statistics backed with demographic data. To do this, the CPS creates a nationally representative
sample of American households by surveying a rolling panel of physical home locations. The
2 The matched data were accessed on a restricted basis at a secure data site. The authors obtained sworn status from the Census Bureau and approval for the project subject to the terms of an interagency agreement between the Census Bureau and SSA. All estimates were approved by SSA’s Title 13 Disclosure Review Board prior to distribution.

6
rolling design of the CPS means that half of the homes in the CPS sample during January 2009
are also in the CPS sample during March 2009. We take advantage of this overlap to link FDIC,
SSA, and CPS data to obtain a national sample roughly half the size of the monthly CPS sample.
We link the FDIC supplement to the March CPS using a modification of the algorithm
provided by Madrian and Lefgren (1999). Some matches from January to March are lost to
migration, since homes rather than households are tracked month-to-month. Other matches are
lost to mortality, nonresponse, and recording errors. The rate of successful matches from the
January CPS to the March CPS is 80.3 percent. We then link to SSA’s administrative records.
The Bureau of the Census provides this link based on address, earnings, and demographic
information from tax returns and other administrative sources. Within the group eligible to
match, some CPS respondents opted out of administrative data linkage. The administrative data
match to 89.1 percent of the observations from our January-March CPS sample. Our resulting
sample consists of 47,781 people, weighted according to the January 2009 CPS sample design.
FDIC surveys were fielded at the household level, to the most knowledgeable respondent, but we
disaggregate to the individual level for most analyses in this paper. SSA data are retrospective,
allowing us to observe January 2009 payments, delivered at the same time as banking questions
were fielded.3
The proportion of people unbanked is lower in our analysis sample than in the full FDIC
sample, at 6.6 percent versus 8.4 percent. Households that moved between the January and
March CPS, or moved between the March CPS and filing their tax returns, do not appear in our
data set. It could be that unbanked households are more mobile and thus fail to match. Related,
households may be more likely to be temporarily unbanked during moves. As a result, the size of
the unbanked population presented in this paper should be viewed as a lower bound.
Nonetheless, our survey measure comes close to the FDIC and SCF measures which provide the
industry standards.
4. Survey measures of banking
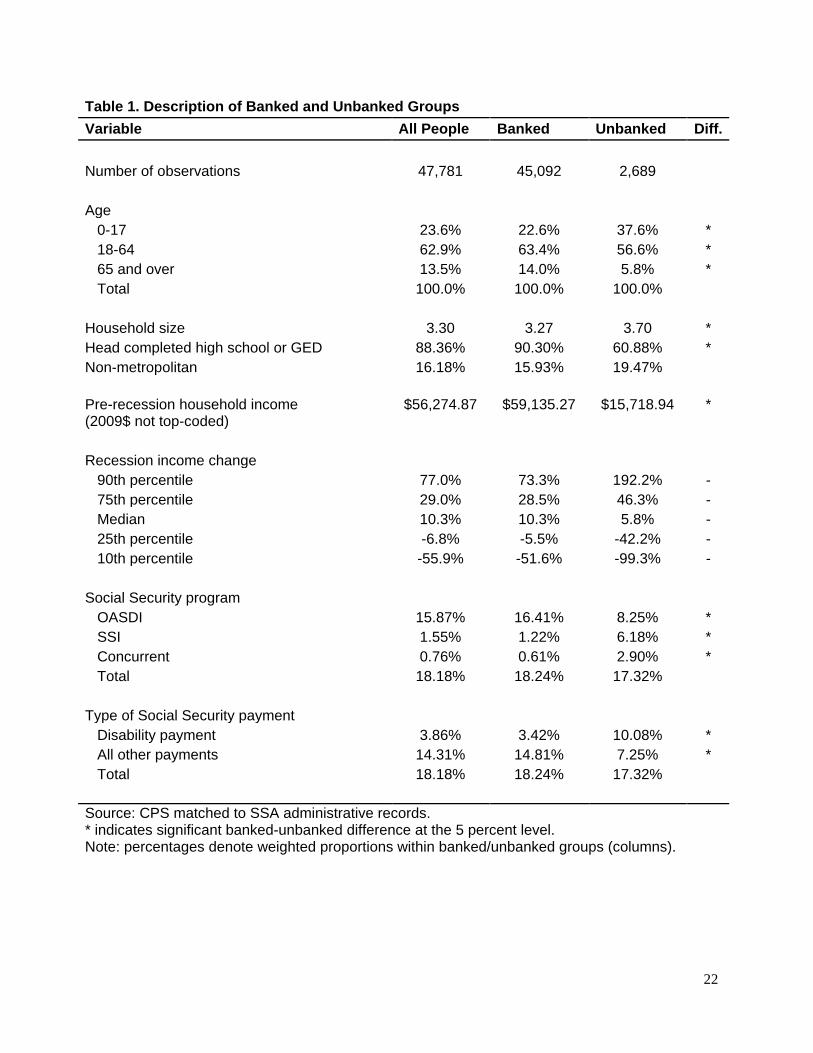
Table 1 characterizes the average banked and unbanked person, as defined by self-reports,
by displaying conditional proportions of banked and unbanked people that meet criteria in the
3 Our data contain only payments that were paid during January 2009, not retroactive payments for that monththat were delivered later.

7
first column. Nearly all banked-unbanked differences are statistically significant at conventional
confidence levels, which we denote with an asterisk. Table 1 shows that the average unbanked
person is younger and much less educated than his average banked counterpart. These
characteristics suggest that a lack of financial knowledge or lack of access to banks could be
driving unbankedness, but survey responses discussed later in this paper reveal that the main
driver of unbankedness is lack of enough money to make banking cost-effective. Indeed, people
unbanked in January 2009 experienced lower and more volatile earnings during the late 2000s.
To see this, we sum administrative earnings from all household members and calculate a less
noisy measure of pre-recession earnings by averaging earnings over the immediate pre-recession
years of 2005-2007. The average household earnings among the unbanked are less than $16,000
a year, compared to $59,000 a year among the banked.4 Because these households are 3.7 people
on average, the average household would be below the official poverty threshold if the
household were evaluated as a family. To identify the households hit hardest by the Great
Recession, we measure each household’s percent change from averaged 2005-2007 earnings to
earnings in 2008. The distribution of earnings changes in Table 1 illustrates that unbanked
households tended to experience both larger percent increases and larger percent decreases.
Table 1 continues with Social Security payment status. In the month of January 2009, 18.2
percent of Americans received a payment from SSA. Eighty-seven percent of Social Security
payments, going to 15.9 percent of the population, are for OASDI. In order to focus on an
administrative measure of disability, we disaggregate DI from the rest of OASDI and define
disability payments as receipt of DI or SSI (possibly concurrently with OASI or one another).
Disability payments make up 21 percent of Social Security payments, going to 3.9 percent of the
population. While unbanked individuals are just as likely to receive a Social Security payment in
January 2009 as their banked counterparts, they are much more likely to receive a disability
payment, 10.1 percent to 3.4 percent. Disability payments account for a majority of the Social
Security payments received by the unbanked.
We add to a series of estimates of bank account use among Social Security payment
recipients. Since we measure banking and payment receipt for a large, national sample, our
approach improves on earlier work. When we base estimates of banking on the FDIC survey
4 Administrative earnings are not top-coded. All dollar amounts are indexed to 2009 using the Consumer Price Index (CPI).
8
matched to SSA administrative records, 6.3 percent of the administratively identified recipient
population are unbanked (shown in Table 3), with no statistical difference between proportions
unbanked among recipients and non-recipients. The large differences between our estimates and
previous studies are consistent with reduced underreporting of transaction accounts.
For paper check recipients (comparable to the small-sample studies), our estimates appear
in Table 2. Like previous studies, we disaggregate by OASDI and SSI to find SSI recipients
much more likely to be unbanked. These estimates of proportion unbanked are still much lower
than comparable estimates in previous literature. For example, our estimate of 34.9 percent
unbanked among SSI paper check recipients is below the 55 to 70 percent range in previous
studies. We attribute the differences to our unprecedented ability to measure payment receipt
with very little error in a nationally representative sample.
5. Administrative measures of Social Security payment methods
Turning to our administrative data, we next examine the ways government payments are
redeemed. Ours is the first study to observe both self-reports of being unbanked and an
administrative measure of financial services use in the same households. Whereas survey
responses tell us how the respondent believes payments could be received in his or her
household, the administrative data tell us how an actual payment was delivered at the time of the
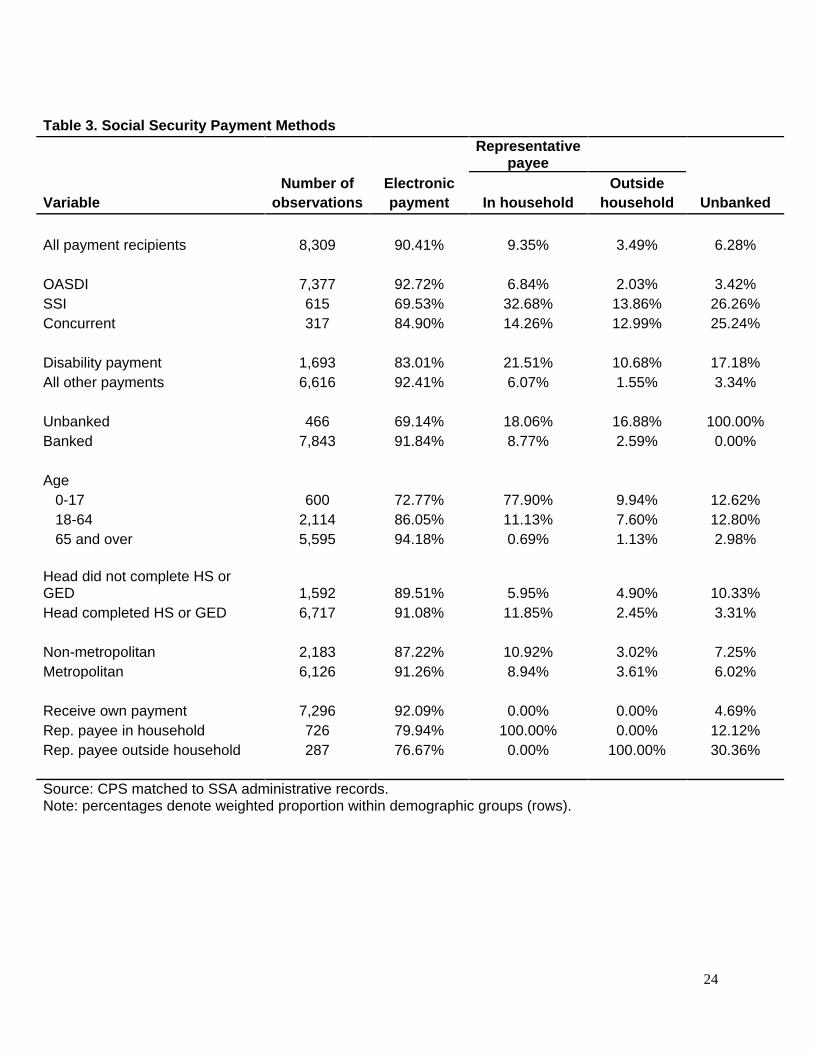
survey. Table 3 provides a snapshot for the payments that were delivered in January 2009. Each
row conditions on a particular characteristic in the leftmost column, and displays how payments
are delivered: by direct deposit versus paper check, and to a representative in or out of the
recipient's household versus to the recipient. The last column displays the self-report of bank
access in the recipients’ household.
Paper checks go to 9.6 percent of payment recipients on average. We hypothesized that
among self-reported unbanked recipients, the incidence of paper checks would be near 100
percent. However our administrative measure of bank account use clashes with our survey
measure. While self-reported unbanked are much more likely to choose paper checks than their
banked counterparts, a majority of them, 69.1 percent, actually use direct deposit. The population
responding to the FDIC survey on behalf of their households had to confirm that they were either
the lone adult, shared finances with the other adults, or, if adults handled finances separately, that
they had at least some knowledge of the other members’ finances. It is puzzling that so many

9
householders living with payment recipients were unaware that the recipient was able to redeem
electronic payments. This discrepancy could arise from representative payees outside the
household with access to bank accounts, the fact that not all electronic payment instruments
would be seen as bank accounts, or from inaccurate reporting by household heads. Regardless,
this discrepancy suggests upward bias in survey measures of the proportion of unbanked
consumers, at least in this segment of the unbanked population, which represents about 17
percent (see Table 1). We return to this issue in more detail in Section 6.
Whether or not their payment is delivered by direct deposit, benefit recipients can legally
appoint a representative payee to handle their transactions with SSA. Of our sample of payment
recipients in January 2009, 12.8 percent uses a representative payee. We sort representative
payees into in-household and out-of-household using CPS identification of household
relationships and administrative classifications of beneficiaries’ relationships to their
representative payees. A large majority of child recipients, about 85 percent, uses a
representative payee. For unbanked adults, representative payees could serve to expand financial
capacity and decrease transaction costs on behalf of their constituent benefit recipients. On the
contrary, our data show that a large majority of representative payees live in the same household
as the beneficiary. This means that by our survey measure of bank account use, in unbanked
households these financial representatives are unbanked as well. Recipients using representative
payees are also much more likely than average to choose paper checks, doing so over in 20
percent of cases. This trend also appears in US General Accounting Office (2002).
6. Inaccurate reporting of bank access
There are several possible explanations for the fact that the majority of payees in self-
reported unbanked households actually receive a payment by direct deposit. We assess some of
the more important ones in this section, before concluding that the main problem is misreporting.
We then model misreporting of banking status among electronic payment recipients.
One explanation we cannot directly measure is the use of prepaid debit cards to receive
direct deposits. These would not be considered checking or savings accounts, so there would be
no contradiction in using these products while being unbanked by the FDIC survey definition.
Though we cannot directly observe which account received the SSA payment, we can use
administrative data from the Treasury to ascertain that only a few of the payments in our January

10
2009 sample could be going to Direct Express ® cards, far less than 69 percent of the self-
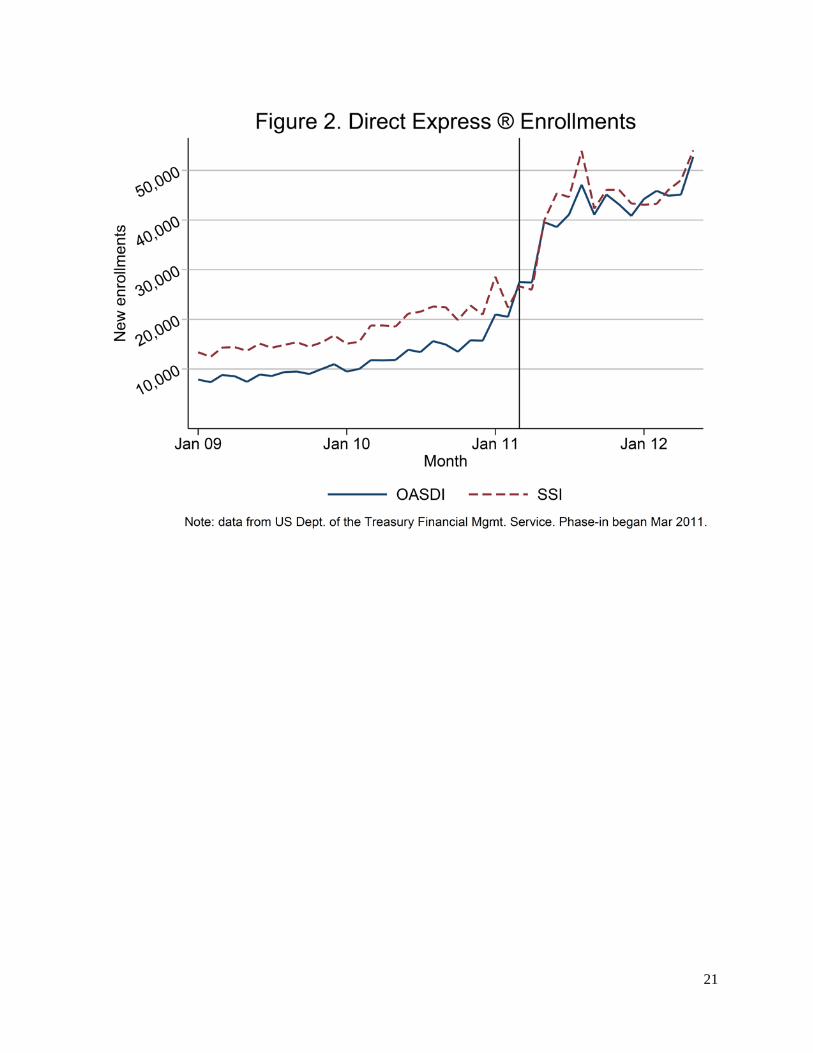
reported unbanked recipient population. Figure 2 shows that new enrollments into Direct Express
® were stable at around 20,000 per month over the course of 2009. Extrapolating this trend back
to June 2008 when the Direct Express ® program was introduced and assuming new enrollees
stayed in the program, a rough estimate of the stock of Direct Express ® users in January 2009
would be around 140,000. Our weighted population receiving direct deposits of Social Security
payments, but self-reporting being unbanked, is around 2.4 million. We cannot rule out use of
other prepaid cards. But Direct Express ®, though new, was likely the most convenient and cost-
effective alternative to bank accounts for direct deposit of January 2009 payments.
We know that the FDIC supplement goes to the respondent in each household who is most
knowledgeable about household finances. The survey screens each respondent with questions
about participation in financial decision making. Affirmative answers to these financial
knowledge questions could be true in general while being less true about the finances of the
Social Security recipient in the household. For example, the most knowledgeable respondent
could still be unaware how a recipient of a different generation redeems their payment.
Alternately, the respondent could have a different operational definition of who is in the
household than is used by the CPS, or a different definition of whether the SSA payment is part
of household finances. Finally, the respondent may not be able to distinguish whether financial
services used in the household are associated with banks or similar financial institutions. We
proxy for this sort of knowledge in a sample of household respondents with an indicator whether
the respondent is also the payee.
Representative payees outside the recipient’s household could receive electronic payments
while the householder correctly reports being unbanked. To place representative payees in or out
of the household, we use administrative indicators of the relation of the representative (parent,
spouse, etc.) and compared them to the relations present in the household using CPS identifiers
of relations to the household reference person. This distinction cannot fully explain the
discrepancy, since most representative payees reside within the household and thus share the
household’s banked status (see Table 3). We exclude representative payees who are outside the
household from analyses in this section because the administrative data for these cases reveal no
information about the household.
11
Conditioning on these possibilities and on demographics, we predict reporting a lack of a
traditional bank account in households that receive at least one payment by direct deposit. The
dependent variable indicates whether the respondent reports that the household is unbanked. We
restrict the analysis sample to household heads who answered banking questions. We consider
the characteristics of the head doing the reporting as well as the characteristics of the payment.
The results of our logit estimation appear in Table 4. Odds ratios greater than one for an
independent variable indicate that higher positive values of that characteristic are associated with
more misreporting of being unbanked. Odds ratios less than one are associated with less
misreporting.
Conditional on our set of included variables, whether the respondent is the recipient does
not significantly predict misreporting of unbanked status. Whether the recipient uses a
representative payee (only within the household) is positively associated with misreporting and
large in magnitude. This could indicate problems with our method of assigning representative
payees to in-household family members. Perhaps many of the representative payees here are
actually outside of the household receiving direct deposits, allowing the unbanked report to be
accurate. However, the majority of representative payees are coded as a parent of a child
recipient. This relationship is easy to identify within households using CPS data, and it is
unlikely that many children use out-of-household parents to redeem their payments when a
parent was present in the household.
We find that the vulnerable subgroups that are overrepresented among the unbanked
population are also more likely to misreport their banked status. Most prominently, households
receiving disability payments are more likely to misreport. The estimated ratio is large in
magnitude and statistically significant. Also, respondents with lower incomes, or who are older,
male, white or hold a high school degree or equivalent are less likely to misreport, as indicated
by odds ratios below one. Therefore their counterparts who are poorer, younger, female, non-
white, or with less than a high school degree are more likely to misreport. Non-metropolitan
status is not statistically significant.
Overall these results show systematic inaccuracy in reporting. The effects of disability and
representative payees (highly correlated with child SSI recipients) are large, suggesting self-
reported banking status among these populations likely underestimates actual bank access. This
has important implications for future research and survey designs, as well as the shift to

12
electronic payments. One way to improve survey questions would be to ask how people in the
household receive most of their payments, and how they pay for most of their purchases. The list
of financial instruments from which to choose the answer could include direct deposits to
accounts at banks, credit unions, prepaid cards, or other accounts, as well as paper checks,
money orders, and cash. In our study, evaluating the welfare of disability recipients will be
difficult, because they are the most likely to misreport being unbanked, as well as the most likely
to be truly unbanked and receiving paper checks, as shown in Table 2.
Given the situation in early 2009 described here, the phase-in and eventual complete
mandate of electronic payments will cause a change in behavior for a small but highly vulnerable
segment of the population. In order to more fully evaluate the possible effects of the policy on
these households, we describe the policy change further and explore survey responses revealing
banking preferences.
7. Impacts of moving to electronic payments
Social Security benefits are typically paid once a month. Prior to 2011, federal payment
recipients had the choice to receive payments via direct electronic deposit into an existing bank
account or into an Electronic Transfer Account (ETA), or to receive checks in the mail. ETAs are
simple prepaid debit accounts into which federal payments can be electronically deposited. They
have limited features and low fees. Roughly 85 percent of the Treasury’s nontax payments were
disbursed electronically in fiscal year 2010 (Federal Register 2010). Take-up rates for ETAs are
very low, so nearly all electronic payments went to other types of accounts (Office of the
Inspector General 2010).
Effective February 22, 2011, the Treasury, which delivers payments on behalf of SSA,
passed an amendment to Rule 31 CFR Part 208 requiring that all federal nontax payments be
made electronically starting March 1, 2013, with a phase-in period of two years. New enrollees
after March 1, 2011 are automatically required to receive electronic payments, while ongoing
paper check recipients are encouraged to switch to an electronic method of payment. After
soliciting and meticulously documenting feedback from the public, the Treasury decided the
Direct Express ® card could improve on ETAs and serve the needs of unbanked payment
recipients (Federal Register 2010). Direct Express ® is a low-cost prepaid debit card. Unlike
most transaction accounts at banks, the card has no minimum balance requirement and is

13
available to people with poor credit histories. Federal payments can be redeemed without charge,
and the card can be used for many other transactions.
The Treasury predicts savings of $117 million avoiding printing and mailing checks each
year, which will increase as more baby boomers enter the system and as costs to mailing rise
(Federal Register 2010). Not included in this figure are costs to banks to cash checks or costs to
federal agencies to resolve problems with checks, though in the case of electronic benefits
transfer taking the place of physical food stamps, reduction in fraud was a key positive outcome
(US General Accountability Office 2008, Federal Register 2010). Paperless federal payments tie
in with a larger proposed initiative predicted to save $500 million over five years. The initiative
includes plans to go paperless for savings bonds, tax filing, and within Treasury administration
(Office of Management and Budget 2011).
While the administrative benefits are clear, the transition costs to payees are unclear. For
the banked population receiving deposits electronically, no change is mandated. For the banked
currently choosing a paper check, the inconvenience of the mandated change is minimal, as
accepting electronic payments does not require using any new financial products beyond the
account they currently use. Unbanked paper check recipients, and some new unbanked enrollees,
will have to make a possibly sizeable behavioral shift to Direct Express ®, an ETA, a private
prepaid card, or a bank account. A few exemptions are available for those born in 1921 or earlier,
for geographically remote recipients unable to tap in to the Direct Express ® card network, and
for those with cognitive impairments that prevent the use of the card. It remains to be seen how
difficult it will be to take up these exemptions.
The Direct Express ® program could increase access to low-cost transaction services
among both marginally banked and unbanked recipients. However the debit cards will be an
unwelcome imposition on the population who prefer not to use electronic payments or any form
of transaction account. Overall, the transaction costs are low, and the level of complexity that
must be navigated to avoid fees is moderate. Federal Register (2010) lays out five scenarios in
which a payee spends from $0 to $18.48 per month on transactions, predicting the lower-cost
scenarios will prevail with “expanded cardholder education.” By contrast, KRC Research (2007)
reports that the average fee for cashing a paper check from SSA is around $6.
Treasury began offering the Direct Express ® card in June 2008, and beginning in July
2009, Treasury encouraged migration to electronic payments through its Go Direct ® campaign

14
(see www.godirect.org and Federal Register 2010). Figure 2 shows take-up of Direct Express ®
by Social Security Administration program, starting in January 2009 (the earliest data available).
New enrollments slowly but steadily rose over two years, then sharply rose in March 2011, when
the Direct Express ® card became mandatory for new payees without pre-existing electronic
deposit accounts.
Therefore our January 2009 paper check sample had access to Direct Express ® and ETAs,
but had not yet faced a mandate or felt the influence of the outreach campaign. Research on
similar financial choices with potential long-term savings, but short-term hassle costs, has shown
inertia to be a powerful force (Madrian and Shea 2000). Given these two facts, we do not accept
the payment method choices in January 2009 as necessarily revealing the outcome of an
individual cost-benefit analysis. Therefore the mandate, with proper information, may actually be
beneficial to some paper check recipients.
The FDIC survey disaggregated the unbanked by their motivations for being unbanked
using a battery of questions. Building on Hogarth et al (2004, 2005), we divide the unbanked into
three groups based on their “main reason” for being unbanked. Our focus is on redeeming
government payments, so our grouping process is informed by each person’s likely reaction to
being offered benefits on a prepaid debit card. See Table 5 for a list of reasons in each group, and
proportions citing each reason.
The group most likely to resist the move to electronic payments expresses distaste for
banking not likely to be addressed by the Direct Express ® card. Reasons for being unbanked
include lack of trust and comfort when dealing with banks. This group is averse to banking and
will likely be displeased by debit card use, even if it may save them money. This group most
averse to banking comprises 11 percent of unbanked payment recipients.
On the contrary, another group expresses problems with banking that can surely be solved
by the Direct Express ® card. They include bad credit or loss of bank accounts, inability to
maintain minimum balances, being poorly served by bank locations and hours, or being in
immediate transition between bank accounts. This group is likely to benefit from the card, as it
expands the set of financial products available to them. This group possibly helped by the push
toward electronic payments comprises 23 percent of unbanked payment recipients.
The reasons expressed by a third and final group do not clearly suggest resistance to
electronic payments, nor are they problems that can necessarily be solved by a low-cost prepaid
15
debit card. Inability to manage an account, the vague but very common “not enough money,” as
well as a host of write-in and “none of the above” responses indicate general problems with
using banks. While the Direct Express ® card is friendlier toward low balances, it obviously does
not change the amount of money recipients have. Direct Express ® requires management much
like a checking account, but could represent an intermediate step between dealing in cash, which
can be costly and risky, and opening a bank account with the possibility of high fees. This
ambiguous group comprises 66 percent of unbanked payment recipients. Therefore the upper
bound of those who could be resistant to electronic payments is 77 percent (the most averse
group plus the ambiguous group). The lower bound of those who could be resistant to electronic
payments is just 11 percent (the most averse group only).
8. Conclusion
We employ a novel matched data set to study the way social security payments are
redeemed in unbanked households. One caveat of our method is that when combining multiple
data sets, we compound the scarcity of the most vulnerable and hard-to-measure households with
sample loss. However our sample roughly represents recent national statistics on financial
services use. Most prior work on the unbanked uses self-reports to identify financial services
access and use. We compare self-reports with administrative records of Social Security
payments. Within our sample of Social Security recipients, we find that 69.1 percent of the
people we usually call “unbanked” can and do receive electronic cash payments from the
government. Future work on these topics should take into account the fact that self-reports of
unbanked status can be misleading.
Like disabilities, unbanked status is not always easy to define. People with disabilities or
without bank accounts constitute diverse populations, shaped by macroeconomic trends, social
expectations of work behavior and financial management, as well as government rules and
programs. The overlap between Social Security benefit recipients and households reporting being
unbanked is one percent of the U.S. population, but deserves attention, as both being unbanked
and receiving disability payments are often signs of serious economic stress. Furthermore, the
policy change we study will impact this particular population.
The Treasury shift to electronic payments was not primarily designed to promote a switch
to transactional banking products, but has effectively created incentives for use of electronic

16
payment services. To the extent accounts help people organize their finances and avoid costly
alternative transaction services, this will be beneficial. There will be further gains to the extent
that insured accounts help people save, or afford credit. The cost of fees or penalties for
mismanaging accounts remains a key issue.
FDIC data reinforce prior evidence that when people forgo bank accounts, they do so far
more often because their financial situation limits the usefulness of a bank account, as opposed to
their abilities or tastes limiting their choices. As a result, a portion of unbanked Social Security
payment recipients in early 2009 stand to gain from use of a low-cost, simple instrument like
Direct Express ®. Our estimates place this portion between a substantial minority and a large
majority.
The mandate to use electronic deposits may also cause shifts over time in the use of
representative payees. Without the task of managing paper checks, recipients may have less
desire for a third party to receive their payments. Of course the added complexity of accounts
and cards relative to cash could also have the opposite effect, pushing more people to need to use
a representative payee. This issue will require monitoring as the new procedures are phased in.
Throughout our study, SSI recipients stand out as most disconnected from mainstream
financial choices. They are particularly likely to choose paper checks and to receive their
payment via a representative payee. Representative payees may offer greater ability to access and
interact with an account, yet we find these agents are typically also part of the unbanked
household. Direct Express ® debit cards also might overcome some barriers to access and
reduce the demands of servicing an account, although some recipients may still prefer cash for
daily transactions. The population of SSI recipients reporting being unbanked (and whose
payment redemption method does not contradict their report) is around 500,000 people.
Working-age SSI recipients with disabilities face the dual impediments of economic barriers to a
bank account and access barriers which limit the utility of an account. A small number may
qualify for and take up exemptions from the Treasury rule change, but the rest are likely to
require help as they transition to new financial behaviors. Policies need to consider
comprehensive approaches combining products with supportive services, especially for special
populations such as people with disabilities.
Our study highlights that to maximize the net social benefit of transfer payments,
policymakers must draw on reliable measures of consumer behavior and preferences, often from
17
multiple sources. To provide a more nuanced measure of financial inclusion, future survey
designs should account for the intricacies of different household members receiving specific
payments through an array of traditional and alternative transaction methods. And whenever
possible, survey measures should be verified against administrative records.
18
References
Barr, Michael S., Prepared Statement, United States Senate Hearing before the Committee on
Banking, Housing, and Urban Affairs: Bringing more Unbanked Americans into the
Financial Mainstream, May 2, 2002.
Barr, Michael S. Banking the Poor, Yale Journal on Regulation, 2004, Vol. 21: 121-237.
Booz, Allen & Hamilton. Mandatory EFT Demographic Study, OMB #1510-00-68. Washington:
U.S. Department of the Treasury, September 15, 1997. Retrieved from:
http://www.fms.treas.gov/eft/reports/demographics.pdf.
Bound, John, Charles Brown, and Nancy Mathiowetz. Chapter 59: Measurement error in survey
data. Handbook of Econometrics, Volume 5, 2001, pp. 3705-3843.
Bricker, Jesse, Arthur B. Kennickell, Kevin B. Moore and John Sabelhaus, Changes in U.S.
Family Finances from 2007 to 2010: Evidence from the Survey of Consumer Finances,
Federal Reserve Bulletin, 2012, vol. 98, pp 1-80.
Bucks, Brian K., Arthur B. Kennickell, Traci L. Mach, and Kevin B. Moore. Changes in U.S.
Family Finances from 2004 to 2007: Evidence from the Survey of Consumer Finances,
Federal Reserve Bulletin, 2009, vol. 95, pp. A1-55.
Bucks, Brian K., Arthur B. Kennickell, and Kevin B. Moore. Recent Changes in U.S. Family
Finances: Evidence from the 2001 and 2004 Survey of Consumer Finances, Federal
Reserve Bulletin, 2006, vol. 92, pp. A1-38.
Czajka, John L., Jonathan E. Jacobson, and Scott Cody. Survey Estimates of Wealth: A
Comparative Analysis and Review of the Survey of Income and Program Participation,
Washington, DC: Mathematica Policy Research, Inc., August 2003.
Dove Associates, Inc. ETA Conjoint Research: Final Report and Market Model, Unbanked
Federal Check Recipients, OMB #1510-00-71, May 26, 1999. Retrieved from:
http://www.fms.treas.gov/eta/reports/conjoint.pdf.
FDIC National Survey of Unbanked and Underbanked Households, 2009. Accessed at:
http://www.fdic.gov/householdsurvey/2009/full_report.pdf.
FDIC National Survey of Unbanked and Underbanked Households, 2011. Accessed at:
http://www.fdic.gov/householdsurvey/2012_unbankedreport.pdf.
Federal Register Volume 75, Number 245. Wednesday, December 22, 2010.

19
Federal Reserve Bank of St. Louis. Understanding the Dependence on Paper Checks: A Study of
Federal Benefit Check Recipients and the Barriers to Boosting Direct Deposit.
Washington, DC: United States Treasury, 2004.
Hogarth, Jeanne M., Christoslav E. Anguelov, and Jinkook Lee (2004). “Why Don't Households
Have a Checking Account?" Journal of Consumer Affairs, v. 38, iss. 1, pp. 1-34.
Hogarth, Jeanne M., Christoslav E. Anguelov, and Jinkook Lee (2005). "Who has a Bank
Account? Exploring Changes Over Time, 1989-2001," Journal of Family and Economic
Issues, vol. 26, no. 2, pp. 295.
Huynh, Minh, Kalman Rupp and James Sears. The Assessment of Survey of Income and
Program Participation Benefit Data Using Longitudinal Administrative Records, of Survey
of Income and Program Participation, Working Paper No. 238, 2002.
KRC Research. Go Direct SSA & SSI Survey. November 2007.
Madrian, Brigitte C. and Lars J. Lefgren. A Note on Longitudinally Matching Current Population
Survey Respondents. NBER Working Paper T0247, 1999.
Madrian, Brigitte C. and Dennis F. Shea. “The Power of Suggestion: Inertia in 401(k)
Participation and Savings Behavior,” NBER Working Paper No. W7682, 2000.
Office of the Inspector General, Social Security Administration. Evaluation Report on the Social
Security Administration’s Informing Beneficiaries of Domestic Electronic Banking
Options, November 2010.
Prescott, Edward S., and Daniel D. Tatar. “Means of Payment, the Unbanked, and EFT ‘99.”
Federal Reserve Bank of Richmond Economic Quarterly, 1999, vol. 85/4, 49-70.
Rhine, Sherrie L. W., William H. Greene, and Maude Toussaint-Comeau. “The Importance of
Check-Cashing Businesses to the Unbanked: Racial/Ethnic Differences.” The Review of
Economics and Statistics, 2006, 88 (1): 73-84.
US General Accountability Office, “Many Programs Electronically Disburse Federal Benefits,
and More Outreach Could Increase Use.” Washington, DC, GAO-08-645, 2008.
US General Accounting Office. “Electronic Transfers: Use by Federal Payment Recipients Has
Increased but Obstacles to Greater Participation Remain.” Washington, DC: GAO-02-913,
2002.

20
21
22
Table 1. Description of Banked and Unbanked Groups Variable All People Banked Unbanked Diff. Number of observations 47,781 45,092 2,689 Age 0-17 23.6% 22.6% 37.6% * 18-64 62.9% 63.4% 56.6% * 65 and over 13.5% 14.0% 5.8% * Total 100.0% 100.0% 100.0% Household size 3.30 3.27 3.70 * Head completed high school or GED 88.36% 90.30% 60.88% * Non-metropolitan 16.18% 15.93% 19.47% Pre-recession household income (2009$ not top-coded)
$56,274.87 $59,135.27 $15,718.94 *
Recession income change 90th percentile 77.0% 73.3% 192.2% - 75th percentile 29.0% 28.5% 46.3% - Median 10.3% 10.3% 5.8% - 25th percentile -6.8% -5.5% -42.2% - 10th percentile -55.9% -51.6% -99.3% - Social Security program OASDI 15.87% 16.41% 8.25% * SSI 1.55% 1.22% 6.18% * Concurrent 0.76% 0.61% 2.90% * Total 18.18% 18.24% 17.32% Type of Social Security payment Disability payment 3.86% 3.42% 10.08% * All other payments 14.31% 14.81% 7.25% * Total 18.18% 18.24% 17.32% Source: CPS matched to SSA administrative records. * indicates significant banked-unbanked difference at the 5 percent level. Note: percentages denote weighted proportions within banked/unbanked groups (columns).

23
Table 2. Proportion of Payment Recipients Banked
Variable Number of
observations Unbanked All paper check recipients 763 20.21% OASDI 516 11.95% SSI 195 34.88% Concurrent 52 43.17% Source: CPS matched to SSA administrative records. CPS person weights used.
24
Table 3. Social Security Payment Methods
Representative
payee
Variable Number of
observations Electronic payment In household
Outside household Unbanked
All payment recipients 8,309 90.41% 9.35% 3.49% 6.28% OASDI 7,377 92.72% 6.84% 2.03% 3.42% SSI 615 69.53% 32.68% 13.86% 26.26% Concurrent 317 84.90% 14.26% 12.99% 25.24% Disability payment 1,693 83.01% 21.51% 10.68% 17.18% All other payments 6,616 92.41% 6.07% 1.55% 3.34% Unbanked 466 69.14% 18.06% 16.88% 100.00% Banked 7,843 91.84% 8.77% 2.59% 0.00% Age 0-17 600 72.77% 77.90% 9.94% 12.62% 18-64 2,114 86.05% 11.13% 7.60% 12.80% 65 and over 5,595 94.18% 0.69% 1.13% 2.98% Head did not complete HS or GED 1,592 89.51% 5.95% 4.90% 10.33% Head completed HS or GED 6,717 91.08% 11.85% 2.45% 3.31% Non-metropolitan 2,183 87.22% 10.92% 3.02% 7.25% Metropolitan 6,126 91.26% 8.94% 3.61% 6.02% Receive own payment 7,296 92.09% 0.00% 0.00% 4.69% Rep. payee in household 726 79.94% 100.00% 0.00% 12.12% Rep. payee outside household 287 76.67% 0.00% 100.00% 30.36% Source: CPS matched to SSA administrative records. Note: percentages denote weighted proportion within demographic groups (rows).

25
Table 4. Logit estimates
Self-reporting unbanked status when payee receives direct deposit Dependent variable: reporting unbanked, mean 0.05
Variable Odds ratio Rep. std. error P-value
Disability payment in household 2.4533 0.5049 0.000 * Representative payee in household 2.5314 0.5634 0.000 * Respondent is the recipient 1.1973 0.3545 0.543 Age of respondent 0.9788 0.0074 0.004 * Respondent is male 0.7415 0.1241 0.074 Respondent is white 0.2451 0.0423 0.000 * Household is non-metropolitan 1.2577 0.2667 0.280 Respondent is high school graduate 0.3139 0.0695 0.000 * Log of pre-recession average hhld. earnings 0.9311 0.0201 0.001 * Constant 0.5600 0.3288 0.323 N = 5,423 Source: CPS matched to SSA administrative records. CPS person weights used. * indicates significance at the 5 percent level.
Note: Sample excludes households with a rep. payee outside the household.

26
Table 5. Payment Recipients' Main Reasons for Being Unbanked Total unbanked observations 466 Policy change likely to work against preferences 10.53% Do not see the value of having a bank account Do not trust banks Banks do not feel comfortable or welcoming Ambiguous 66.68% Do not have enough money to need a bank account Don't know/refused/nonresponse Write-in other response None of the reasons listed Service charges of bank accounts are too high Bounced too many checks or had too many overdrafts There are language barriers at banks Do not write enough checks to need a bank account Could not manage or balance a bank account Couldn't pick just one main reason Do not know how to open a bank account Policy change likely to expand choice set 22.79% In process of opening an account within two weeks The bank closed my account Minimum balance requirement at banks is too high There is no bank near home or work Banks have inconvenient hours Do not have the proper documents to open a bank account Credit problems Banks do not offer needed services like check cashing Banks take too long to clear checks Total 100.00%
Source: CPS matched to SSA administrative records. CPS person weights used. Responses within categories are ranked by descending frequency.