moving out of poverty in tanzania: evidence from kagera - edi
TRANSCRIPT

Moving out of Poverty in Tanzania:
Evidence from Kagera
Forthcoming: Journal of Development Studies
August 2009
Joachim De Weerdt
ABSTRACT This paper uses linked qualitative and quantitative data to explore the growth trajectories of matched households in the Kagera region of Tanzania, finding that agriculture and trade provided the two main routes out of poverty. The interplay between initial conditions, shocks, networks and experiences of life beyond their village determine whether a person moves out of poverty in the following decade.
Acknowledgements: Work done for the Moving out of Poverty study at the World Bank, headed by Deepa Narayan. She, as well as Josien de Klerk, Hanneke Honer, Adalbertus Kamanzi, Leonard Kyaruzi, Respichius Mitti, James Mitchener, George Musikula, Khamaldin Mutabazi and Thaddaeus Rweyemamu gave crucial inputs during the fieldwork. Kathleen Beegle, Stefan Dercon and Brian Dillon did the same during subsequent analysis. Two anonymous referees and the editors helped to improve an earlier draft of the paper. Correspondence: Joachim De Weerdt, Research Director, EDI (Economic Development Initiatives), P.O. Box 393, Bukoba, Kagera, Tanzania, E-mail: [email protected], web: www.edi-africa.com .

Journal of Development Studies, Vol. XX, No. X, pp.–pp., MONTH 2009
1
Moving out of Poverty in Tanzania: Evidence from Kagera
I. Introduction
The Kagera Region of Tanzania is characteristic of many landlocked parts of Africa that
are largely dependent on agriculture. It poses a puzzle to those concerned with
development: how can people living in poor, remote regions of the continent with little
integration in the global economy be provided with opportunities that allow them to move
out of poverty (Collier, 2007; Ndulu et al. 2008)? This paper attempts to tell the stories of
a sample of people from this region who have managed to grow out of poverty and
contrasts them with those who have not. It attempts to tell these stories using both a
quantitative 10-year panel data set of 47 rural villages in the region and an extensive
qualitative data set on a subset of eight villages, thereby using the descriptive richness of
qualitative data without compromising statistical rigor and relevance of the results for
formulating policies.
The paper argues that there are two paths out of poverty in Kagera. For those with
sufficient endowments of land and human capital there is agriculture, which lies at the
heart of village economies. The more successful people were those who have diversified
their farming activities, growing food crops for their own consumption, cash crops for

2
sale, and keeping livestock. Those who became poorer were those who stuck solely to the
more traditional agricultural farming system of bananas and coffee.
The alternatives to agriculture as a route out of poverty are business and trade. It
is found that trade is not necessarily reserved for the wealthy. Rather, the degree of
connectedness of the place of residence, in conjunction with one’s initial conditions (such
as one’s endowment of land and other wealth) are important. People with unfavourable
initial conditions in remote villages have little prospect of moving out of poverty; their
lack of physical capital closes off both pathways out of poverty. People with similarly
bad initial positions, but living in well-connected villages have more opportunities.
Business and trade in their villages provide income-generating opportunities that even the
poor can take up. Good health and extensive trust networks are important forms of capital
here. Illness and agricultural shocks have important negative effects on everyone, except
the very richest. The degree of protection from these shocks is highly correlated to one’s
growth trajectory.
The next section describes the setting and data. The paper then gives an analysis
in three steps of the factors that enable people to move out of poverty. Section III presents
the first two steps: an econometric analysis of poverty dynamics in Kagera, which is then
triangulated with qualitative evidence. Section IV looks at the variation left unexplained
by the regression analysis. Insights from the impact evaluation literature are used to
match respondents with similar econometric predictions (using baseline characteristics to
explain future outcomes), but different actual outcomes 10 years later. Qualitative work
was then conducted with the aim of determining which factors explain deviations from
3
the econometric predictions. Section V looks at the same question from a policy
perspective.
II. Data and Setting
Kagera is located on the western shore of Lake Victoria, bordering Uganda to the north
and Rwanda and Burundi to the west. The region consists of about 30,000 square
kilometres of land surface and about 10,000 square kilometres of water surface. The
population is of diverse ethnic make-up with Haya and Nyambo tribes dominating in the
north, and Subi, Sukuma, Zinza and Hangaza in the south. Between the censuses of 1988
and 2002, the population in Kagera grew from 1.3 million to 2 million, with little change
in the age composition: in both censuses just under half of the population was aged 0–14
years and around 5 per cent were over 65 years old (URT 1998, 2006).
Bukoba municipality is the capital of Kagera, with a population of 80,000, or 4
per cent of Kagera’s population in 2002. This study concerns only rural Kagera. The
2003 Rural Kagera CWIQ (Core Welfare Indicator Questionnaire) survey (EDI, 2004),
shows that three-quarters of household heads classify their main occupation as self-
employment in agriculture. The CWIQ survey further shows that the median rural
household owns two acres of farm land and about 12 per cent of these households report
owning large cattle. Households primarily grow bananas and coffee in the North, and
rain-fed annual crops (maize, sorghum and tobacco) in the South. Reining (1967), Bosch
et al. (1989), Tibaijuka (1984), Rugalema et al. (1994) and Gallez et al. (2004) present
more detailed analysis of farming systems in Kagera, as well as of the recent declining
productivity of the traditional smallholder farm.
4
Starting in the late 1980s markets for agricultural inputs and outputs were
liberalised during Tanzania’s Structural Adjustment Programme (Gibbon et al., 1995;
Meertens, 2000). Cash crop markets have oscillated over the years between being
oligopsonies and monopsonies. Cooksey (2002) and Ponte (2004) give particularly
cogent expositions of the intricate political economy underlying the liberalization, and
subsequent backlash against it in Kagera’s coffee market. Food crops, when grown in
surplus, are traded locally on more competitive markets and can be exported to urban
centres, neighbouring regions or neighbouring countries.
Over the past decades, farmers in Kagera have diversified both within agriculture
(for example by growing cabbages, tomatoes, green peppers and vanilla) and by moving
into new non-agricultural income-generating activities, such as Nile perch fishing,
mining, trading, and so on (Ellis, 1998, 2000). This diversification follows decades of
increasing monetisation of the economy and the gradual disappearance of the subsistence
farmer (Smith, 1989; Baker, 1995). It has been argued that this ‘depeasantisation’ caused
deep-rooted social change (Raikes and Gibbon, 2000; Bryceson, 1999, 2002).
Kagera is known for being one of the early epicentres of HIV/AIDS with the first
cases having been detected at Ndolage Hospital in 1983. Kwesigabo et al. (2005) studied
trends in prevalence rates and note their steady decline over the years. While urban
Bukoba recorded a peak of 24 per cent prevalence in 1987, other districts had figures well
below that. Tanzanian Commission for AIDS (TACAIDS), National Bureau of Statistics
(NBS) and ORC Macro (2005) put regionwide prevalence in 2004 at 3.7 per cent of
individuals aged 15–49, well below the national average of 7 per cent. Many authors have
5
studied HIV/AIDS, its effects, and the reasons for the decline in prevalence (Tibaijuka,
1997; Rugalema, 1999; Lugalla et al., 2004; Beegle et al., 2008b, 2009).
We use the Kagera Health and Development Survey (KHDS), which was
originally conducted by the World Bank and Muhimbili University College of Health
Sciences (MUCHS). It consisted of 912 households, in 51 villages, interviewed up to four
times from autumn 1991 to January 1994 (at 6–7 month intervals). In the quantitative
analysis below we use only the 47 rural villages in the sample. The 2004 KHDS survey
aimed to re-interview all individuals who were household members in any round of the
KHDS 1991/94 and who were alive at the last interview. The field team managed to re-
contact 93 per cent of the baseline households, which is a much lower attrition rate than
that of other well-known panel surveys as summarised in Alderman et al. (2001).
In 2005 the researchers visited a sub-sample of the KHDS villages and
respondents in order to collect qualitative data on movements in and out of poverty. The
villages were purposively sampled to represent the strata described in Table 1.
[Insert Table 1 near here]
The package of qualitative instruments was elaborate (Narayan et. al 2009) and took a
team of five people several days in each village to administer. For the sake of brevity, we
will only describe the two instruments used most in this paper. The first was an FGD
(Focus Group Discussion) called the ‘ladder of life’. This FGD was conducted with 8 to
12 KHDS respondents, chosen to represent all age and gender categories. It consisted of
an extensive discussion of the forces that lead people to grow out of poverty or keep them
locked in it. Respondents were also presented with the results from the econometric
model and asked their opinion. At the end of the FGD, the participants ranked all KHDS
6
respondents, over 15 years of age and still residing in the village using a ‘ladder of life’,
on which the richest occupy the top rung and the poorest the bottom. This constitutes
what we will refer to as the ‘peer-assessment’, that is an assessment of the position on the
‘ladder of life’ in 1993 and 2004 by respondents of the same village.
The second qualitative component was the life history, conducted with 15 KHDS
respondents in each village. They were asked to recount the history of the past 10 years of
their own lives. Interviews were structured around the topics of migration, education,
occupation, economics, socio-cultural and psychological factors, confidence and power.
To guide the life history and to focus on explaining deviations (or lack thereof) from
econometric destiny, a scoring system was used through which the respondent indicated
satisfaction with that aspect of life. The scoring was done using a bao game, which is a
commonly played board game, consisting of a thick wooden board with carved out holes
in which beads can be placed. The respondents were asked to consider each row of the
board as a welfare dimension and each column as a year. Beads were then placed to
indicate changes over time. At the end an overall assessment across the past 10 years was
made by the respondent in the same fashion. In the text we refer to these scores as ‘self-
assessments’.
III. Regression Analysis and Triangulation
This section presents regression results that explain growth between 1991 and 2004 in
terms of 1993 characteristics.1 We restrict the sample to KHDS respondents who were at
least 15 years old at baseline in order to concentrate the analysis on people who have, or
who could have played an important role in shaping their own lives between the baseline

7
and 2004. We exclude four urban enumeration areas to concentrate on patterns of rural
growth. As noted above, these results were presented at FGDs to subject them to
qualitative scrutiny and to elaborate on the pathways through which the identified forces
take effect. We use household-level assets to measure welfare. While assets depend on
occupational choice, we found them to provide less noisy individualised regression
predictions to guide the selection of respondents in the fieldwork, compared to
consumption (Appendix 1 elaborates). Assets include the value of land, livestock,
businesses, durable goods, farm equipment, food stocks and so forth and are deflated
using the price questionnaires in each round.
Table 2 presents the results of an Ordinary Least Squares, village fixed effects
regression explaining 2004 asset positions with 1993 characteristics. These characteristics
include individual characteristics (age, sex, education, health), characteristics of the
household head, household demographic characteristics, network characteristics and
initial asset position. In 2004, TZS 1100 was equivalent to US$ 1.00 and average asset
holdings were TZS 2,911,600 (standard deviation 6,555,205). Means and standard
deviations of all the right hand side variables are given in Appendix 2.
[Insert Table 2 near here]
Table 3 triangulates the regression results with the peer-assessment data from the FGD
ladder of life and the self-assessment data from the life histories. The peer-assessments
are interpersonally comparable within the same village, but not outside the village, while
self-assessment scores are not interpersonally comparable at all. Therefore we opt for
purely ordinal comparisons, whereby a person’s movement is expressed by a simple

8
binary indicator taking on the value of zero if the person’s score has dropped or stagnated
from 1993 to 2004 and a value of one if a person’s score has risen from 1993 to 2004.
[Insert Table 3 near here]
Kagera, and especially its northern districts, was an area of concentration for missionary
schools. The CWIQ 2003 (EDI, 2004) results show literacy at just under 70 per cent
across all rural districts. Table 2 shows that every year of schooling adds, ceteris paribus,
TZS 280,000 to total 2004 assets. Therefore someone who has completed primary school
is predicted to have assets valued at close to TZS 2,000,000 more than someone without
schooling, a figure representing 67 per cent of the sample mean. Table 3 shows that a
larger percentage of respondents who had completed primary education at baseline have
rising self- and rising peer-assessments. People with at least primary education performed
better both in the economic sphere and in terms of social status and self-esteem. Even
those who were successful without much education, told us: ‘with education I would have
been further than where I am today’. Education is seen as important in a multitude of
dimensions: for farming, for obtaining loans, for understanding democracy and so forth.
Interestingly, men did significantly worse than women according to the
regression, but the same finding does not carry through to the qualitative results. In the
FGDs respondents suggested that women look for men who are richer than them and
climb out of poverty via marriage.2 The figure from Table 3 suggest that such ‘marrying
out of poverty’ does not necessarily translate into higher peer- or self-assessments in
different spheres of life. Alternatively these results could be interpreted in the light of the

9
increased take-up of women in the workforce and gender differences in income-
generating activities (Mbilinyi, 1986, 1997; Smith and Stevens, 1988).
Disability is self-defined and can range from minor chronic ailments like poor
eyesight or a limp to more serious disabilities like blindness or missing limbs. It also
includes chronically ill people who report feeling weak and being unable to work.
Individuals living with a disability in 1993 did much worse, having around TZS
1,000,000 less assets 10 years later (34 per cent of mean, 15 per cent of standard
deviation). Table 3 shows that their peer- and self-assessments are more likely to fall than
those of people without disabilities. Both the life histories and FGDs show how
disabilities and chronic illnesses are important deterrents to growth. People speak of high
recurrent hospital bills and lack of power to work on the farm. Many of the disabilities in
the life histories affected elderly people. They noted how their decreased strength made
them their ‘children’s children’.
The effect on assets in 2004 of having one biological child living elsewhere is of
roughly the same size as that of having one year of education. The life histories confirm
that remittances from children are crucial for building up assets in a large number of
households. Many people will see their lives take a sudden, drastic turn for the better
when a child gets employment and starts sending remittances. In the ladder of life not
having children was a common characteristic of those on the very lowest step. Just up
from the poorest step, people were often reported to have grown out of poverty through
their children, while the wealthier people maintained their wealth through transfers from
their (well-educated) children. Children living outside the village send the highest

10
remittances, but also have the highest likelihood of cutting off all contact with home
(Hoff and Sen 2005).3
The positive effect of initial assets on final assets is non-linear: it decreases as
initial assets go up, although it only becomes negative at asset levels outside the common
range of the sample. In the next section we discuss the relationship between one’s start-
off position and later outcomes.
Finally, in contrast to younger people, elderly people who have moved up,
according to their peers and their formal questionnaire, still report moving down in their
life histories. Out of all growers (in terms of assets and peer-assessment scores), about 70
per cent of those over 60 years in 1993 reported a decline in their self-assessment of
overall welfare, compared to only 30 per cent growers under 60. The respondents noted a
combination of declining health, declining respect and a general feeling of loss as the
reasons for their lower welfare. So, while the FGDs and quantitative data emphasise
fairly objective economic changes by design, the life histories allow for more subjective
psychological states.
IV. Defying Econometric Destiny
The previous section found that the regression results are largely confirmed by the
qualitative evidence. However, the regression results are not able to fully explain patterns
of growth. Table 4 assesses the accuracy of the predictions derived from the regression
and shows that 78 per cent of people whose assets were predicted to drop did in fact see
their assets drop, while only about half of the people that were predicted to rise did in fact
do so. In what follows we will compare the life histories of individuals with similar

11
predicted, but different realised long-term outcomes, in order to identify what the
regressions left out and investigate why some people deviate from the econometric
model.4
[Insert Table 4 near here]
The first two columns of Table 5 compare the characteristics of the surprise growers
(those whose assets were mistakenly predicted to fall) with those whose assets were
accurately predicted to fall. The last two columns of the table show how the surprise
fallers (predicted to grow, but fell) compare to those whose assets were predicted to grow
and grew. It can be seen that while 90 per cent of the surprise growers diversified their
farm activities, only 20 per cent of their comparison group did the same. Similarly, 97 per
cent of predestined growers diversified, while only 38 per cent of their comparison group
(surprise fallers) did the same. Other factors that explain the ‘surprise’ predictions are
related to expanding and losing land, good intra-marital relationships, experiencing major
illness or death, widowhood, divorce, separation, exposure to life outside the village and
diversification into off-farm activities.
The next section starts from these summary results and complements them with
more contextual data from the life histories and FGDs. More specifically the ‘failure’ of
the econometric model to predict asset changes can be broken down into the following:
1. occupational choices made between 1993–2004
2. shocks that occurred between 1993–2004
3. characteristics unobserved by the econometrician
4. specification errors of the model.
[Insert Table 5 near here]

12
Occupational Choice after 1993
While income-generating activities also extend into the non-agricultural sector, it is fair
to say that agriculture remains at the heart of the economy in most villages. During FGDs
discussing determinants of growth, agriculture was a dominant topic. The potential to
engage successfully in agriculture is strongly determined by initial position with respect
to land and labour. Examples of poor start-off positions from the life histories are those
who did not inherit land, those who were too old to work and those who own infertile
pieces of land. As will be discussed below, the likelihood of growing out of poverty for
people who do not fulfil these minimal conditions depends on the remoteness of the
village they reside in.
Several other concerns related to agriculture were identified in the FGDs. First,
there were the unequal relations with buyers. Especially in the more remote areas people
felt powerless towards them and they did not understand their grading mechanisms,
weights and measures. Second, the poor transport network hindered progress in remote
villages B, C, D and F; here bananas, beans and maize are frequently left to rot in the
field because they cannot be marketed. Markets in connected villages clear easily and
prices are pinned to those of bigger regional markets.
Most flourishing households had diversified their farming activities, growing a
combination of food crops for their own consumption, cash crops for sale and keeping
livestock. Growers typically grew cabbages, green peppers, tomatoes, pineapples and
vanilla. Farmers who fell below their econometric expectation were those who stuck to
the more traditional agricultural farming system of bananas and coffee. Respondents in
the FGDs insisted on a causal link between diversification and movement out of poverty

13
and pointed out that the more fundamental cause of failure to diversify was the lack of
information and credit (more on causation in Section V).
Successful diversification into off-farm activities explained the biggest success
stories. These consisted of people who are involved in trading Kagera’s food crops across
the country and international borders. They typically maintain a farm, which provides
them with food, while also trading crops. They may also own a small shop in a nearby
centre. As one of our most successful respondents, who has a farm, a plot of timber trees,
real estate and a profitable trading business, exclaimed: ‘There is nothing that can hit
trade, stock, the farm and the trees!’ These people speak several languages (Kihaya,
Kiswahili, Luganda, Kinyankore and English are common), they have contacts with
border officials and tax revenue collectors, but also have a set of local people whom they
can trust. These local people are often young ambitious apprentices who act as couriers,
or go-betweens between the trader and the farmers. These apprentices appear to be the
future movers out of poverty. Moreover they do not depend on physical capital: the
continued trust of their ‘tajiri’ (rich benefactor/boss), as well as a reliable health are more
important. Over the years they did not only build up assets and financial capital, but also
a network of people outside the village, experience in the trade and are exposed to new
ideas from outside. As will be explained below, this path out of poverty, relatively
independent of one’s start-off position, is closed for those with equally unfavourable
initial conditions living in more remote villages.
14
Shocks after 1993
One of the most striking observations from the life histories is that poor people’s shocks
are not more severe than those of others (Dercon, 1998, 2004). We see that the most
entrepreneurial people, who are often those who grew most over the past 10 years, have
suffered the largest shocks, at least in absolute terms. These shocks include large
investment failures, theft of the entire contents of a shop, loss of a truck of goods and so
forth. Poor people seem to suffer disproportionately from the relatively smaller shocks
they receive. There are also positive ‘shocks’ like children who become employed,
bumper harvests and increases in prices of agricultural produce.5
Agricultural shocks. Those who underperformed according to their econometric
prediction typically had lost land and labour and had poor intra-household coordination
of their agricultural activities (because of bad intra-marital relationships). The most
commonly mentioned agricultural shocks were the collapse of coffee prices between
2000 and 2003 and the excessive el-Niño rains in 1997–1998. Some of the villages in this
survey had suffered from widespread hunger in certain years over the past 10 years.
These events made a very sharp contrast between the powerful and the weak in this
village: ‘those with their money made us work for them, for it was better that way than
dying of hunger’, commented a man (see also Narayan, 1997). Illness and hunger are
arguably the most important problems in this village, affecting a person in every aspect of
their life: ‘When you are sick and hungry you want to work and earn food. But you
cannot; you are powerless’. Diversifying farm activities or taking on additional non-farm
15
activities was the single most important way in which the most successful respondents
managed agricultural risk.
Mortality. Mortality changes the production factors of a household’s economy
through reduced labour supply. The poor are especially vulnerable to this as credit
constraints prevent them from hiring labour. Mortality in the household is a factor
determining why people deviated downwards from their expected growth path (see also
Beegle et al., 2008b). Moreover, the life histories demonstrate how premature mortality
causes great grief in the household. A large number of the dips in the social self-
assessments scores were explained by the loss of spouses, siblings, children and parents.
Losing children prematurely is especially devastating. A woman in her seventies from
village C who has lost seven of her 10 children says: ‘Losing adult children is very
painful. It is like a pot breaking when you have already washed your hands to eat.’
Funeral associations in Kagera provide limited assistance during the funeral and
mourning period (Dercon et al., 2006).
Illness. There are huge costs associated with illness. De Weerdt and Dercon
(2006) found that idiosyncratic health risks are not insured in Kagera. Current risk-
mitigating and -avoiding strategies are not sufficient to insure people against illness
shocks. An illness shock will often resonate for some time and have a persistent spiral
effect on poverty. Ill-health is a very important theme throughout all life histories. It was
usually mentioned in the context of a loss of strength and productivity on the farm.
Continued good health means everything to a farmer. Table 5 shows how a large

16
proportion of people who had deviated downwards from their econometrically
determined growth paths had experienced episodes of serious illness they did not manage
to cope with. It is not, however, illness as such that caused their downfall. Indeed, even
better off people have stories about long periods of illness. Rather the poor lack the
ability to pay for treatment costs and the informal insurance network fails the poor (De
Weerdt, 2004). It was frequently mentioned how the poor aspire to befriend the rich but
not each other. The FGDs included an example comparing idiosyncratic shocks hitting a
rich person versus a poor person. For a rich person falling sick the participants would say:
‘Every morning and every evening you go to check on him. If you can think of a way to
help him you will be happy to do so. You never know: when he gets better he may
remember you’. A poor person who fell sick was said to be lucky if anyone at all came to
visit. The life histories repeatedly tell stories of how poor people trade off the two most
important endowments they have – physical and human capital. In case of a serious
disease they either have to sell land, livestock or other assets or else compromise their
health by lack of appropriate treatment.
Widowhood and divorce. Land in Kagera typically belongs to the clan and traditional
law essentially aims to ensure it is kept in clan hands. These traditional laws run parallel
to national law; but at the end of the day, when a man dies, his wife faces quite some
insecurity about where she will end up. If the widow has a male child then the clan often
decides to give the land to him (the male child will always be a clan member). It will then
be at the discretion of the son to let his mother use the land or not. Many women get
involved in disputes with their in-laws and lose their inheritance rights. Often this

17
happens during divorce or when a polygamist dies with several wives fighting over the
land. The life histories show that these are stories of extreme economic, social and
psychological downfall. Women often feel cheated out of their inheritance but lack the
links to the clan and the village government to stand up for their rights. A widow in her
seventies from village C laments, ‘after my husband’s death, his will stated that the house
and farm go to my co-wife. I lost a good house. At my age I’m forced to feed my hands
to the snakes while cutting grass for thatching. As if I’ve never lived under an iron roof
before!’
The daughters of the deceased may also suffer. Because a girl will end up
marrying into another clan, traditional law excludes girls from inheriting land, houses and
livestock after their fathers’ death. A 42-year-old woman from village D left her husband
and went back to live in her parental home. When a few years later her father died she
inherited nothing. ‘All land was given to the male children. I moved onto the plot that my
little brother [who was only a child then] inherited. I took care of him until he reached
adulthood. I worked on the farm, but knew that I could be kicked out any time.’ When
her brother became an adult and got married, she did not get along well with her sister-in-
law and was forced to move out.
Many development organisations are concerned by anecdotal evidence of widows
leaving their home village and moving to the fishing islands to remarry or engage in
transactional sex. Appendix 3 shows how KHDS does not support the hypothesis of a
mass exodus.

18
Unobserved Characteristics
Characteristics that are unobserved by the econometrician include intra-marital relations,
alcoholism, ambition and so forth. Repeatedly unobserved characteristics were stressed
most in FGDs as reasons why people did not move out of poverty.
Exposure. Growth was for a large part explained by diversification of livelihood
sources. Diversification in itself was for a large part explained by exposure. Respondents
who reported to have travelled little and have never lived or worked outside their own
village were less likely to diversify their incomes, including diversifying farming
activities. Respondents suggested a causal relationship, claiming that exposure taught one
different ways of doing things and how to get along with different kinds of people. In
short it broadened their perspective and helped them think about their income earning
activities in more innovative, less traditional ways. Exposure, having the right friends,
travelling and getting ideas assist people to move up. Lack of these factors make people
stay down: ‘we need friends who can give us good ideas. If you are a farmer and you
invest your friendship in other farmers like yourself, there is no way you will climb.’
Ambition, laziness, alcoholism and intra-marital relations. Many of the
respondents who experience economic gains attributed this to their hard work, moderate
drinking habits and co-operation with their spouses. It is striking how people who grew
substantially over the past 10 years mentioned the importance of their personal traits, but
none of the people who fell mentioned them: even with qualitative work, it remains hard
to get a good understanding of these factors. Some life histories are accounts of people

19
who claim they are converts, having suffered from alcoholism and laziness in the past,
but currently leading better lives. Sometimes religion is stated as the impetus for such a
change. By contrast, and perhaps because of the spotlight switching from the first to the
third person, the FGDs did see laziness and alcoholism appear as prominent explanations
for why people remain in poverty.6
Specification Errors: The Role of Remoteness
A peculiar pattern emerges once we split the statistics of the surprise growers and
surprise fallers up into remote and well-connected villages. Table 6 shows that in the
well-connected villages the initial conditions (that is initial wealth in terms of land and
other assets) do not determine deviations from the regression predictions. This is what we
expect, because the regression model controls for both location (through village fixed
effects) and for initial conditions (through baseline asset position and its square). In
remote villages, however, adverse initial conditions could explain downward deviations
from the econometric predictions. For example, in remote villages only 29 per cent of the
surprise growers had bad initial conditions, compared to 57 per cent of their comparison
group of predestined fallers in those same villages. That gap is much smaller in connected
villages: remoteness exacerbates the effects of initial conditions.7 This indicates that the
regression model had a specification error and should have included an interaction term
of remoteness and initial conditions. With wisdom in hindsight, we show a corrected
regression in Appendix 1.
Villages B, C, D and F are more remote with little trade and business activities.
They are far removed from larger markets and very few middlemen visit to buy
agricultural produce. Here, worse initial wealth status has been a bigger constraint than

20
the regressions predicted. In the words of one respondent the poor remain poor ‘because
they had nowhere to begin moving upwards from’. In the more remote villages people
relate any upward mobility of the poor to assistance. In the FGDs it is typically only from
around step 3 on the ladder of life (out of 6) onwards that people are seen as capable of
rising through their own efforts.
[Insert Table 6 near here]
Villages A, E, G and H, by contrast, are situated in or near trading centres. Village A lies
on the border with Uganda along the main Uganda–Tanzania trading gateway in Western
Tanzania. Trucks are held up at this border to clear through customs and buses and cars
stop for immigration formalities. Many traders pass by this village and transport to town
is easy. Villages G and H, similarly, lie at the border with the Kigoma region. They
constitute important trading centres, with traders from other regions coming to buy
Kagera’s goods. Additionally, there has been an influx of money from the informal gold
mining activities close to these two villages. Village E serves as a hub for banana trade
from the plateau on which it lies. Traders from all over the country visit frequently. They
come to buy bananas, while bringing in goods from Uganda and Mwanza.
The life histories and FGDs reveal four important reasons why this increase in
trade and business reduces dependence on initial endowments. First, traders from other
parts of the country hire casual labourers to assist them with loading trucks and carrying
goods. Second, any trader will forge links with people who have superior knowledge of
local markets. This may range from people who go deeper into the villages to buy crops
to local managers of the trader’s business. Over the years their involvement with the
trader will teach them the ins and outs of the business, will build up their networks and
21
many will end up entering into the trade themselves. Trust is the most important asset in
this relation; land and other initial endowments are less important. ‘You do not need
capital to grow, being trustworthy is more important’ commented one respondent in
village A. While trust is the most important asset, human capital is also essential: a
certain degree of sharpness and continued good health. Third, the influx of money in the
village expands local demand. Some activities, like brewing and distilling, which create
added value to local products, may require little capital, but they remain dependent on the
total income or production of the village. Fourth, contact with people from elsewhere
provides innovative ideas and builds up networks outside the village which can be tapped
for employment opportunities.
FGDs and life histories further revealed that also land availability in a village is
important in determining dependence on initial conditions. Land is more abundant in
villages G and H and independence from initial conditions in these villages could also
result from this fact. Someone who does not inherit land can easily obtain a plot and farm
it with fewer resources than in other villages. Because the crops are seasonal, the returns
will arise more quickly, reducing (but not eliminating) problems related to credit.
The increase in trade and business affects everyone in society, not only those with
bad initial conditions. It increases the power, confidence and bargaining position of the
farmer when marketing food crops. In villages A, E, G and H traders from all over the
country come into the area and there is a definite farm gate price determined by the local
market. A farmer will never agree to sell at a lower price. Farmers in villages B, C, D and
F are relatively powerless to bargain on price or impose fair measures.
22
On the other hand, the increase in the flow of money in villages A, E, G and H has
increased crime rates and the ability of the communities to cope with this depends to a
large extent on their social cohesion. In villages G and H the influx of trade and activity
came about through an increase in informal gold mining activities. The gold mines
around this area are not managed by the government, nor by private companies. They are
a collection of informal settlers who camp near the mines. There is no trace of any
traditional village structure. They have a ‘chief-commander’ who is in charge of security
and are known to lynch strangers who wander into the camp unaccompanied by someone
they know (our own interviewing teams had a narrow escape from this). One person told
us: ‘Here we get gold and we earn millions. Then we are all happy: we eat, drink and
marry. Once it is over, we go back to look for more gold.’ Another man said: ‘When a
child goes to the mines, forget about him being your son or daughter. They never come
back healthy; they sometimes don’t even come back alive. This is a very bad place where
everything is possible. They can get money, yes, but the money is useless to them. It will
never be seen anywhere else, nor do anything for them except take them straight to the
grave.’ Respondents in a focus group conducted in a nearby village expressed a sense of
powerlessness in containing criminal activity: ‘We know the thieves. But what can we do
to them? If we accuse them, they take note of who we are and then where can you run?
They will hunt you down. Sometimes you feel it’s better to meet a lion than your fellow
human being’. This contrasts sharply with, for example, the more resourceful village E,
where an informal militia had been set up to patrol the village at night. Perhaps the fact
that villages A and E are older communities makes their social cohesion stronger. This

23
gives them more power and freedom to decide over the course of the development of
their village.
Not surprisingly, people who migrate to such places are those with limited options
in their home village. They are often people from remote areas with insufficient initial
endowments on which to build their lives and people who have experienced major shocks
that have depleted the basis of their livelihoods. Lacking good networks outside the
village to find income-earning opportunities, they often end up in informal mining sites
or at Nile perch landing sites (exported internationally from Lake Victoria). Usually the
migrants have, at least initially, the intention to earn the necessary cash to return to the
village, buy a good plot of land, build a house and start off in life.
V. Policy Conclusions
Landlocked and agriculture-dependent regions like Kagera should not be expected to
have a sudden development growth. Still, this study has shown that under the right
conditions, its people can make their own way out of poverty. Farming will have to
remain the foundation of most people’s livelihoods for a long time to come and therefore
increasing agricultural income should be a priority (see also Dercon 2009). Consistently
throughout all the life histories people with diversified farming activities (for example
farming modern crops like tomatoes, green peppers, cabbages, pineapples, vanilla and so
forth, alongside more traditional crops) performed better than expected, while those who
stuck to traditional farming performed worse. Those who combined farm and non-farm
activities did even better.

24
This does not necessarily mean that the government should actively promote
diversification as a goal in itself. At a more fundamental level, we found that people who
diversified were those who had exposure to life outside their village, providing them with
crucial ideas and networks. It is not that those who diversified were simply ‘lucky’ that
their strategy paid off; rather, they had the basics in place to make the right activity
choices. Capital was also important, with dependence on initial capital omnipresent, but
nevertheless inversely related to the connectedness of the village. Therefore, providing
credit, improving roads and communication, as well as investment in education are all
expected to foster growth through the pathways identified above. While it is clear from
our analysis that exposure, networks and ideas naturally follow suit when business and
trade picks up as villages become less remote, interventions directly enhancing these
dimensions could also be stimuli to innovation and growth. Increased competition among
crop buyers, enforcement of measurement and standards and providing information on
prices would also help raise farm income.
People’s economic development is constantly being undermined by the
backlashes of shocks, with only the richest being adequately able to defend themselves
against such events. Protecting people from the financial strains associated with
idiosyncratic illness shocks seems an area in which interventions are possible and
lagging.
Traditional inheritance rights were found to make women very vulnerable when
their husband or father dies. Ensuring local compliance to national inheritance laws could
make an important contribution to bettering the lives of wives and daughters of deceased
men. Protection against agricultural shocks is more problematic, because their occurrence

25
to all members of society at once makes insurance more difficult. Empowering farmers,
with exposure and ideas, to choose a livelihood based on a diverse set of activities could
reduce dependence on food aid when rains fail.
People in remote areas with limited land and other assets should be the focus of
specific interventions. These were clearly identified as having the least freedom from
poverty in the sense that their fate in 10 years time can already be (econometrically)
predicted today. They are the ones that will either remain in poverty or else move out of
their village in search of employment. Migration to new settlement areas is an important
fall-back strategy. In these areas programmes are needed to increase social cohesion and
introduce sound government leadership. In the villages that supply the migrant labourers
the focus should be on providing exposure, ideas and actively promoting links to
economic actors outside the village that would otherwise be beyond reach.
Notes
1. Beegle et al. (2008a) compare the welfare of migrants to non-migrants in the same data set. Much of the research on poverty dynamics in developing countries is linked to the Chronic Poverty Research Centre. Chronic Poverty Research Centre (2008) gives an overview. An important impetus behind mixed methods research is the q-squared programme (http://www.q-squared.ca).
2. So who marries the poor men in the village? The FGDs were clear on this: no one. In all villages one of the most prominent characteristics of those on the lowest step on the ladder of life was that these were all were men without wives.
3. The positive effect of having children outside the household at baseline does not show up in Table 3. This is because this variable is strongly correlated with age. Those with at least one child living elsewhere were, on average, 20 years older than those with no child living elsewhere. The latter group had an average age of 25 years at baseline and likely had most growth potential. We control for this effect in the regressions, but not in bivariate Table 3.
4. In effect what we are doing is constructing treatment and comparison groups in a manner close in spirit to Propensity Score Matching (Heckman et al., 1997; Jalan and Ravallion, 2003).
5. Shocks in Kagera and Tanzania have been studied by Kessy (2004), Hoogeveen (2005), Beegle et al. (2006), Christiaensen et al. (2007), and De Weerdt and Fafchamps (2008).
6. Kamanzi (2007) makes a similar point in the context of how Kagera’s residents interact with development practitioners.
7. The role of location has been highlighted by, among others, Dercon and Krishnan (1996), Ellis (2000) and Christiaensen et al. (2005).

26
References
Alderman, H., Berman, J. Kohler, H. Maluccio, J. and Cotts-Watkins, S. (2001) Attrition
in longitudinal household survey data: some tests for three developing-country samples.
Demographic Research, 5(4), pp. 78–124.
Baker, J. (1995) Survival and accumulation strategies at the rural–urban interface in
north-west Tanzania. Environment and Urbanization, 7(1), pp. 117–132.
Beegle, K. Dehejia, R. and Gatti, R. (2006) Child labor and agricultural shocks. Journal
of Development Economics, 81(1), pp. 80–96.
Beegle, K., De Weerdt, J. and Dercon, S. (2008a) Migration and economic mobility in
Tanzania: evidence from a tracking survey. Policy Research Working Paper, WPS 4798,
World Bank, Washington DC.
Beegle, K., De Weerdt, J. and Dercon, S. (2008b) Adult mortality and consumption
growth in the age of HIV/AIDS. Economic Development and Cultural Change, 56(2), pp.
299–326.
Beegle, K., De Weerdt, J. and Dercon, S. (2009) The intergenerational impact of the
African orphans crisis: a cohort study from an HIV/AIDS affected area. International
Journal of Epidemiology, 38(2), pp. 561-568.
27
Bosch, C., Bantje, H. and Maganga, F. (1989) Annotated bibliography of Kagera region.
Tanzania/Netherlands Farming Systems Research Project. Working Paper No. 2.
Tanzania, Maruku Research Institute, Bukoba, Ukiriguru Research Institute, Mwanza,
Tanzania, and Royal Tropical Institute, Amsterdam.
Bryceson, F.D. (1999) African rural labour, income diversification and livelihood
approaches: a long-term development perspective. Review of African Political Economy,
26(80), pp. 171–189.
Bryceson, F.D. (2002) The scramble in Africa: reorienting rural livelihoods. World
Development, 30(5), pp. 725–729.
Christiaensen L., Hofmann V. and Sarris A. (2007) Gauging the welfare effects of shocks
in rural Tanzania. World Bank Policy Research Working Paper No. 4406, Washington
DC.
Christiaensen, L., Demery, L. and Paternostro, S. (2005) Reforms, Remoteness and Risk
in Africa: Understanding Inequality and Poverty During the 1990s, in: R. Kanbur and A.
Venables (eds.) Spatial Inequality and Development (Oxford: Oxford University Press),
pp. 209-233.

28
Chronic Poverty Research Centre (2008) The Chronic Poverty Report 2008–09: escaping
poverty traps. Accessed at http://www.chronicpoverty.org
Collier, P. (2007) The Bottom Billion: Why the Poorest Countries are Failing and What
Can be Done about It (New York: Oxford University Press).
Cooksey, B. (2002) Marketing reform: the rise and fall of agricultural liberalisation in
Tanzania. Development Policy Review, 21(1), pp. 67–91.
De Weerdt, J. (2004) Risk-sharing and endogenous network formation, in: S. Dercon
(ed.) Insurance Against Poverty (Oxford: Oxford University Press), pp. 197–216.
De Weerdt, J. and Dercon, S. (2006) Risk-sharing networks and insurance against illness.
Journal of Development Economics, 81(2), pp. 337–356.
De Weerdt, J. and Fafchamps, M. (2008) Social identity and the formation of health
insurance networks. Mimeo, EDI and University of Oxford.
Dercon, S. (1998) Wealth, risk and activity choice: cattle in western Tanzania. Journal of
Development Economics, 55(1), pp. 1–42.
Dercon, S. (2004) Insurance Against Poverty (Oxford: Oxford University Press).

29
Dercon, S., De Weerdt, J., Bold, T. and Pankhurst, A. (2006) Group-based funeral
insurance in Ethiopia and Tanzania. World Development, 34(4), pp. 685–703.
Dercon, S. (2009) Rural Poverty: Old Challenges in New Contexts. World Bank
Economic Review, 24(1), pp. 1-28
Dercon, S. and Krishnan, P. (1996) Income portfolio’s in Ethiopia and Tanzania: choices
and constraints. Journal of Development Studies, 32(6), pp. 850–875.
EDI (2004) Kagera rural CWIQ: baseline survey on poverty welfare and services in
Kagera rural districts. Accessed at www.edi-africa.com/research/cwiq
Ellis, F. (1998) Household strategies and rural livelihood diversification. Journal of
Development Studies, 35(1), pp. 1–38.
Ellis, F. (2000) Rural Livelihoods and Diversity in Developing Countries (Oxford:
Oxford University Press).
Gallez, A., Runyoro, G.T., Mbehoma, C.B., van den Houwe, I. and Swennen, R. (2004)
Rapid mass propagation and diffusion of new banana varieties among small-scale
farmers in North-Western Tanzania. African Crop Science Journal, 12(1), pp. 7–17.

30
Gibbon, P., Chachage, C. and Kiondo, A. (1995) Liberalised Development in Tanzania
(Upsala: Nordiska Afrikainstitutet).
Heckman, J., Ichimura, H. and Todd, P. (1997) Matching as an econometric evaluation
estimator: evidence from evaluating a job training programme. Review of Economic
Studies, 64(4), pp. 605–654.
Hoff, K. and Sen, A. (2005) The kin system as a poverty trap? World Bank Policy
Research Working Paper 3575.
Hoogeveen, H. (2005) Risk, growth and transfers. Prioritizing policies in a low income
environment with risk: the case of Tanzania. Background paper for the Tanzania CEM.
Jalan, J. and Ravallion, M. (2003) Estimating the benefit incidence of an antipoverty
program by propensity score matching. Journal of Business and Economic Statistics,
21(1), pp. 19-30.
Kamanzi, A. (2007) ‘Our Way’ responding to the Dutch aid in the district rural
development programme of Bukoba, Tanzania. Doctoral Dissertation, Radboud
Universiteit Nijmegen, The Netherlands.
Kessy F. (2004) Rural income dynamics in Kagera Region, Tanzania. EDI and ESRF,
Dar es Salaam. Accessed at http://www.edi-africa.com/publications.htm .

31
Kwesigabo, G., Killewo, J., Urassa, W., Lugallo, J., Emmelin, M., Mutembei, A., Mhalu,
F., Biberfeld, G., Wall, S. and Sandstrom, A. (2005) HIV-1 infection prevalence and
incidence trends in areas of contrasting levels of infection in the Kagera Region,
Tanzania, 1987–2000. Journal of Acquired Immune Deficiency Syndromes, 40(5), pp.
585–591.
Lugalla, J., Emmelin, M., Mutembei, A., Sima, M., Kwesigabo, G., Killewo, J. and
Dahlgren, L. (2004) Social, cultural and sexual behavioral determinants of observed
decline in HIV infection trends: lessons from the Kagera Region, Tanzania. Social
Science and Medicine, 59(1), pp. 185–198.
Mbilinyi, M. (1986) Agribusiness and casual labor in Tanzania. African Economic
History, 15, pp. 107–141.
Mbilinyi, M. (1997) Women workers and self-employed in the rural sector, in ILO
workshop on women’s employment promotion in the context of structural adjustment
programme, in Tanzania, Dar es Salaam.
Meertens, B. (2000) Agricultural performance in Tanzania under structural adjustment
programs: is it really so positive? Agriculture and Human Values, 17(4), pp. 333–346.

32
Narayan, D. (1997) Voices of the poor: poverty and social capital in Tanzania. World
Bank Environmentally and Socially Sustainable Development Studies and Monographs
Series 20, Washington DC.
Narayan, D., Pritchett, L. and Kapoor, S. (2009) Moving Out of Poverty, Volume 2:
Success from the Bottom Up (Basingstoke: Palgrave Macmillan).
Ndulu, B., O’Connell, S., Bates R., Collier, P. and Soludo C. (2008) The Political
Economy of Economic Growth in Africa, 1960-2000 (Cambridge: Cambridge University
Press).
Ponte, S. (2004) The politics of ownership: Tanzanian coffee policy in the age of liberal
reformism. African Affairs, 103(413), pp. 615–633.
Raikes, P. and Gibbon, P. (2000) ‘Globalisation’ and African export crop agriculture.
Journal of Peasant Studies, 27(2), pp. 50–93.
Reining, P. (1967) The Haya: the agrarian system of a sedentary people. Doctoral
dissertation, University of Chicago, Chicago.
Rugalema, G. (1999) Adult mortality as entitlement failure: AIDS and the crisis of rural
livelihoods in a Tanzanian village. Doctoral Dissertation, Institute of Social Studies, The
Hague, The Netherlands.

33
Rugalema, G.H, Okting’ati, A. and Johnsen, F.H. (1994) The homegarden agroforestry
system of Bukoba District, north-western Tanzania. Agroforestry Systems, 26(1), pp. 53–
64.
Smith, C.D. (1989) Did colonialism capture peasantry? Scandinavian Institute of African
Studies Research Report, No. 83, Upsala, Sweden.
Smith, C.D. and Stevens, L. (1988) Farming and income-generation in the female-headed
smallholder household: the case of a Haya village in Tanzania. Canadian Journal of
African Studies, 22(3), pp. 552–566.
TACAIDS, NBS and ORC Macro (2005) Tanzania HIV/AIDS Indicator Survey 2003–04
(Calverton, Maryland: TACAIDS, NBS, and ORC Macro).
Tibaijuka, A.K. (1984) An economic analysis of smallholder banana–coffee farms in the
Kagera region, Tanzania: causes of the decline in productivity and strategies for
revitalization. Doctoral Dissertation, Swedish University of Agricultural Sciences,
Uppsala.
Tibaijuka, A. (1997) AIDS and economic welfare in peasant agriculture: case studies
from Kagabiro village, Kagera region, Tanzania. World Development, 25(6), pp. 963–
975.

34
URT (1998) Kagera Region Socio–economic Profile (Planning Commission Dar es
Salaam and Regional Commissioner’s Office Kagera).
URT (2006) Tanzania Census 2002: Analytical Report, Volume X (National Bureau of
Statistics, Ministry of Planning, Economy and Empowerment, Dar es Salaam).

1
ON-LINE APPENDICES FOR MANUSCRIPT:
Moving out of Poverty in Tanzania:
Evidence from Kagera
APPENDIX 1: Robustness Tests: alternative assets definition and interacting initial
wealth with remoteness of the village. APPENDIX 2: Further Details on the Samples Used, Including Pooling Test of
Qualitative and Quantitative Sample APPENDIX 3: Quantitative Evidence on Widows Migrating to the Fishing Islands

2
APPENDIX 1: Robustness Tests: alternative assets definition and interacting initial
wealth with remoteness of the village.
This appendix discusses two alternative specifications for the regressions of Table 2. It
first repeats the analysis with an alternative assets definition and then shows the results of
interacting initial wealth with assets.
Alternative Assets Definitions
Assets are used rather than consumption because they are less prone to measurement
error. Reducing noise was a major concern for this study as individualised regression
predictions were taken to the field to compare with the qualitative observations. While it
has often been argued (especially within the livelihoods literature) that assets are better
than consumption to describe the experiences of the poor, it needs to be stressed that they
could, in principle, be prone to changes related to occupational mobility and investment
choice rather than reflecting changes in welfare per se. For example, someone may move
from farming to wage-employment, choosing to sell off farm assets, but experiencing a
long-run welfare improvement. Because we concentrate on those respondents who
remain living in rural areas, we expect most to supplement farming with other activities,
rather than replace it. It are mainly the respondents who have permanently located outside
their original villages that will see large substitutional shifts in their occupation (Beegle
et al., 2008a). We address this problem by repeating the regressions for an alternative
definition of assets, which includes only those assets that are indicative of welfare: the
value of household’s non-productive durable goods. This alternative definition then

3
excludes any form of productive assets, such as land, livestock, businesses, farm
equipment, food stocks and dwellings, which could be reflections of occupational, rather
than welfare shifts.
Table A1 below repeats the regressions of Table 2 from the main table and finds similar
results, except that disability and number of biological children living outside the
household are no longer significant. This suggests that both these effects may work
mainly through productive assets. To interpret the results, note that the sample mean for
2004 non-productive durable goods value is 96,369, with a standard deviation of 388,626.
This is much lower than the mean of all assets (which had mean 2,911,600 and standard
deviation 6,555,205).
Interacting initial conditions with remoteness
The regressions from Table 2 do control for initial conditions, but their effect remains
important in explaining deviations from the model in remote clusters (Table 6). As
explained in Section 4, this implies that the model had a specification error and should
have included an interaction term of remoteness and initial conditions. While the
fieldwork strategy was moulded on the predictions that arose from the model presented in
Table 2, we can, equipped with this new information, estimate an alternative model
which does include these interaction effects. Interacting initial schooling and initial
capital endowment with remoteness (dummy indicating the cluster is far from markets
and roads) confirms the qualitative analysis: initial conditions are more important in
remote clusters than they are in connected clusters. Adapting the model taken to the field
4
to include these interaction terms we see from Table A1 that the interaction of initial
assets and remoteness is significant at 8 per cent. The interaction of remoteness with
squared initial assets is significantly negative at 5 per cent suggesting the pull-down
effect of initial endowments wears off more quickly as assets go up in these clusters. The
interaction of remoteness with initial schooling was not found to be significantly different
from zero.

5
Table A1: Table 2 from main text, using alternative asset definition and interaction with remoteness.
Original Results from Table 2
Table 2, Excluding Productive
Assets
Table 2, Initial Conditions
Interacted with Remoteness
yrs of schooling 280,053*** 16,509*** 327,938*** (61,078) (3,928) (71,341)Male -631,795** -36,020* -629,167** (294,554) (18,953) (295,133)has disability -1,000,944** 1,648 -956,021** (468,421) (30,144) (469,360)Disability data missing 20,115 -3,494 -21,101 (366,581) (23,599) (367,179)yrs education head 87,525 -5,062 84,852 (61,489) (3,968) (61,631)head is male 248,632 -6,379 218,691 (444,567) (28,463) (446,643)head age -33,768 -5,773* -36,916 (48,211) (3,076) (48,375)(head age)^2 362 50*** 377 (479) (31) (480)no. of children living outside HH 238,332*** 2,723 245,685*** (67,120) (4,300) (67,380)household has good floor 2,053,287*** 137,801*** 2,027,608*** (473,319) (30,572) (480,371)value of all assets 0.603*** 0.554*** (0.074) (0.086)(value of all assets)^2 -13*10-9*** -11*10-9*** (21*10-10) (23*10-10)value of non-productive assets 0.411*** (0.087) (value of non-productive assets)^2 -11*10-8*** (30*10-9) (remoteness) * (value of all assets) 0.259* (0.150)(remoteness) * (value of all assets)^2 -93*10-10** (47*10-10)(remoteness) * (yrs of schooling) -138,054 (95,511)
OLS, village fixed effects estimates. Regression include controls for baseline demographic structure of the household captured in 8 variables indicating the number of males and females aged 0-5, 6-15, 16-65 and 65+. Life cycle effects are controlled for by individual level age dummies indicating baseline age in years to be 15-25 (omitted category), 26-35, 36-45, 46-55, 56-65 or above 66. The right and left hand side asset variable definitions match within each regression. Standard deviations in brackets below coefficients, with stars indicating significance at 1% (*), 5% (**) or 10% (***). No. of obs = 1931.

6
APPENDIX 2: Further Details on the Samples Used, Including Pooling Test of Qualitative and Quantitative Sample
Table A2 below provides some summary statistics on the variables used in the regression
analysis. It also highlights the differences between the sample used for the regressions
and that used for the qualitative work. The sample for the regression analysis consisted of
1931 KHDS respondents with complete data, above 15 years of age in 1993 and
originating from 47 rural baseline villages. The qualitative work used a sub-sample of
this as it was restricted to 8 villages. An important difference between the two samples is
that quantitative sample includes people who, by 2004, had moved out of the original
cluster, while the qualitative sample does not (due to budget considerations). This reduces
the qualitative sample on which we have full peer- and self-assessment data to 115
observations. Still the regression results and thus econometric predictions that the
research team took to the field were based on the full sample of those who stayed and
those who moved. This was done to keep true to the idea of the exercise: to predict on the
basis of 1993 characteristics where someone would end up in 2004. Migration between
1993 and 2004 was not observed at baseline. Even people living in the village at the time
of the survey had, from the viewpoint of the analyst, the potential to move. Beegle et al.
(2008a) discuss the welfare dynamics of people who have relocated away from their 1993
residence and find that their growth paths are much steeper than those who remained.
Table A2 shows how baseline characteristics of these villages compare to the full sample.
The main difference to point out is that the initial wealth in these villages seems to be
somewhat lower than in the overall sample. If anything, we are looking at a subset of 8
somewhat poorer villages, which is reflected in lower baseline assets and education.

7
Differences in other characteristics are small in size. Perhaps with the exception of the
number of prime-aged female household members, which is significantly lower among
the qualitative sample, likely because of patrilocal marital exogamy and the exclusion of
migrant respondents from the qualitative sample.
Furthermore the processes that underlie growth paths in these 8 villages are similar to that
of the whole sample. A pooling test was performed, whereby the regression model of
Table 2 was repeated with addition of all right hand side variables interacted with a
dummy indicating whether or not the individual’s baseline location was in one of the 8
villages from the qualitative sample. A joint significance F-test of all interaction terms
had a value of 0.99, with a p-value of 0.47.

8
Table A2: Summary Statistics of Samples Used.
characteristics of all 47
rural KHDS villages
characteristics of 8 villages sub-sampled for
qualitative work Mean sd mean Sd Difference t welfare positions all assets 1993 3,828,120 6,440,451 2,549,065 4,271,813 -1,279,055 -3.47all assets 2004 2,911,600 6,555,205 2,236,401 6,235,097 -675,199 -1.74growth all assets 1993-2004 -916,521 7,851,312 -312,664 6,337,834 603,857 1.32non-productive durable goods 1993 59,696 230,446 28,691 49,114 -31,005 -2.43non-productive durable goods 2004 96,369 388,626 78,275 383,058 -18,094 -0.78growth non-prod. durables 1993-2004 36,673 425,858 49,584 382,344 12,911 0.52household has good floor 1993 0.14 0.35 0.07 0.26 -0.07 -3.47 individual characteristics in 1993 aged 26-35 0.16 0.36 0.14 0.34 -0.02 -0.94aged 36-45 0.13 0.34 0.13 0.33 0.00 0.00aged 46-55 0.10 0.30 0.09 0.28 -0.01 -0.56aged 56-65 0.08 0.27 0.09 0.28 0.01 0.62aged 66+ 0.03 0.18 0.06 0.24 0.03 2.65yrs of schooling 4.81 3.06 4.37 2.97 -0.44 -2.42male 0.44 0.50 0.44 0.50 0.00 0.00has disability 0.11 0.31 0.14 0.34 0.03 1.60disability data missing 0.18 0.38 0.13 0.34 -0.05 -2.24 characteristics household head in 1993 yrs education. head 4.31 3.19 3.81 2.66 -0.50 -2.69head is male 0.79 0.41 0.78 0.41 -0.01 -0.41head age 50 17 50 17 0.00 0.00 household demographic characteristics in 1993 no. of males 0-5 0.60 0.87 0.50 0.71 -0.10 -1.98no. of males 6-15 1.07 1.11 1.12 1.17 0.05 0.75no. of males 16-65 1.42 1.12 1.29 1.08 -0.13 -1.96no. of males 65+ 0.22 0.42 0.28 0.47 0.06 2.35no. of females 0-5 0.56 0.82 0.45 0.80 -0.11 -2.26no. of females 6-15 1.07 1.21 0.93 1.02 -0.14 -1.98no. of females 16-65 1.66 1.19 1.38 0.87 -0.28 -4.09no. of females 65+ 0.25 0.47 0.29 0.47 0.04 1.43 networks in 1993 no. of children living outside the household 1.43 2.82 1.33 2.48 -0.10 -0.60No. of observations 1931 329

9
APPENDIX 3: Quantitative Evidence on Widows Migrating to the Fishing Islands
Many development organisations are concerned by anecdotal evidence of widows leaving
their home village and moving to the fishing islands. In these anonymous environments
they are able to conceal their marriage history and husband’s death, which allows them to
remarry and/or engage in transactional sex. For example Westaway et al. (2007) argue
that on the islands it is more common for women to get involved in transactional sex with
a lower number of longer-term partners than in stereotype prostitution or commercial sex
work. KHDS finds no evidence of a mass exodus of widows out of the village as it is
sometimes portrayed.
The KHDS 1993 sample included 748 married women. During the resurvey in 2004 we
re-interviewed 534 women, 122 were confirmed deceased and 92 were not found. Out of
the 534 traced women 122 lost their husbands in between 1993 and the resurvey in 2004.
Out of these 122 widows, 100 were found residing in their baseline community and 9
were found in nearby villages. Out of the remaining 13 women, only very few were
found living on the islands. In total 10 per cent of these women had remarried by 2004,
while 90 per cent were recorded as widows (hence not lying about their husband’s death).
So what about the 92 women who were married in 1993, but who were not found by the
interviewing teams? Information gathered about them in their baseline villages shows
that only 16 were confirmed to have become widowed and hardly anyone to have moved
to the island. These figures concern women who were already married in 1993 not the
younger generation who got married after that. In our sample there were 1,072 girls aged
5-15 in 1993. Out of them 795 were reinterviewed, 53 had died and 224 were not found

10
in 2004. Out of the traced women the data clearly show that only a handful moved to the
islands.
Three caveats on these results are in order. First, the information on untraced women may
not be reliable as it constitutes unconfirmed guesses from village informants (village
leaders, friends, neighbours, etc.). Second, the sample is representative of Kagera, while
this phenomenon may be limited to specific areas that are insufficiently covered by the
sample (e.g. Muleba). And third, small numbers do not reduce the gravity of these
women’s plight.
References
Westaway, E., Seeley, J. and Allison, E. (2007) Feckless and Reckless or Forbearing and
Resourceful? Looking Behind the Stereotypes of HIV and AIDS in “Fishing
Communities. African Affairs, 106(425), pp. 663-679.

Table 1. Stratification of study villages Land availability
Trade, business activities and connectedness
Social cohesion Villages
Low Low High (traditional village) B, C, D, F Low High High (traditional village) A, E High High Low (ujamaa village) G, H

Table 2. Regression results explaining 2004 assets values (in 2004 TZS) with 1993
characteristics coefficient Std. Dev. Individual characteristics in 1993 years of schooling 280,053 [61,078]*** Male -631,795 [294,554]** has disability -1,000,944 [468,421]** Characteristics household head in 1993 yrs education head 87,525 [61,489] head is male 248,632 [444,567] head age -33,768 [48,211] (head age)2 362 [479] Networks in 1993 no. of children living outside the household 238,332 [67,120]*** Welfare position in 1993 household has good floor 2,053,287 [473,319]*** value of assets 0.60 [0.07]*** (value of assets)2 -1.26*10-8 [2.05*10-9]*** No. of observations 1931
OLS, village fixed effects estimates. Regressions include a constant and a variable indicating missing disability data. The baseline demographic structure of the household is captured in eight variables indicating the number of males and females aged 0–5, 6–15, 16–65 and 65+. Life cycle effects are controlled for by individual level age dummies indicating baseline age in years to be 15–25 (omitted category), 26–35, 36–45, 46–55, 56–65 or above 66. Standard deviations in square brackets, with asterisks indicating significance at 1% (*), 5% (**) or 10% (***).

Table 3. Qualitative assessments of welfare growth over 10 years
% whose peer-
assessment rose
% whose economic
self- assessment
Rose
% whose social self- assessment
rose
% whose overall self-assessment
rose No. of obs.
Not completed primary at baseline 44 36 18 39 70 Completed primary at baseline 50 59 41 59 45 Female 44 41 25 43 61 Male 50 54 33 56 54 No disability at baseline 47 49 29 52 89
disability at baseline 39 28 22 33 18 No children residing outside the
household at baseline 48 58 37 58 62
At least one child living outside the household at baseline 45 34 19 38 53
Note: Peer-assessments were obtained through an FGD as steps on a six-step ‘ladder of life’ and self-assessments during a life history as satisfaction with specific aspects of life (in the economic sphere, social sphere and overall) with values between 0 and 10. This analysis is purely ordinal and looks at percentages of people whose 2004 score/step is higher than their 1993 score/step. Social self-assessment includes self-confidence and respect in the family and in society.

Table 4. Accuracy of the predictions (no. of individuals and row percentages) Assets went Assets went Total
down up Assets predicted to
go down 693
(78%) 192
(22%) 885
(100%)
Assets predicted to go up
517 (49%)
530 (51%)
1047 (100%)
Total 1215
(63%) 722
(37%) 1931
(100%)

Table 5. Variables explaining deviations from the predicted growth path surprise
growers predestined
fallers surprise
fallers predestined
growers
predicted movement fall fall chi-square Grow grow chi-square actual movement grew fell value Fell grew value
Number of individuals 20 35 32 33 Diversified farm activities 90% 20% 25.15*** 38% 97% 26.27***
Expanded land 75% 46% 4.44** 22% 85% 25.92***
Lost land 0% 17% 3.85*** 28% 9% 3.91***
Mention good intra-marital co-operation 65% 46% 1.90 44% 70% 4.46**
Experienced major illness or death 35% 83% 12.89*** 91% 52% 12.01***
Widowhood, divorce & separation 10% 46% 7.37*** 28% 18% 0.90
Have higher level of exposure 70% 54% 1.31 63% 67% 0.12
Have diversified into off-farm activities 70% 43% 3.76* 34% 67% 6.78***
Note: asterisks indicate significance of chi-square values at 10% (*), 5% (**) and 1% (***).
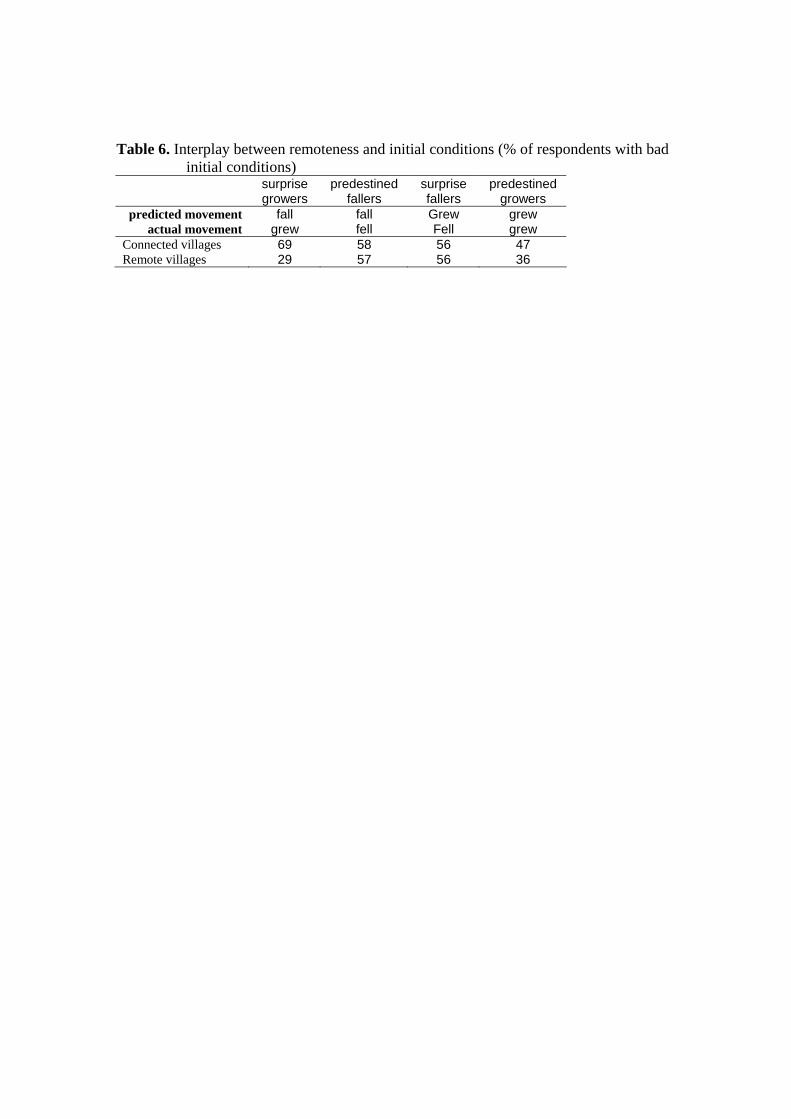
Table 6. Interplay between remoteness and initial conditions (% of respondents with bad initial conditions)
surprise growers
predestined fallers
surprise fallers
predestined growers
predicted movement fall fall Grew grew actual movement grew fell Fell grew
Connected villages 69 58 56 47 Remote villages 29 57 56 36