moving michigan forward - michigan municipal league
TRANSCRIPT

Moving Michigan Forward: Continuing Our Comeback
Presented by:
John E. Nixon, CPA State Budget Director, Michigan
Michigan Municipal League
April 10, 2013

Where We Started • Perpetual $1.5B deficit • Uncapped liabilities • Job killing tax system • $2M in savings account –
depleted rainy day fund • Several accounting gimmicks
2
What We’ve Done • Overcame perpetual $1.5B deficit • Started accounting for one-time versus ongoing money • Implemented multi-year budgeting • Addressed long-term liabilities • Eliminated job killing tax system • Invested in rainy day fund • Linked policy decisions to funding (capital outlay reform) • School bond loan fund reforms • Retirement reforms
―Michigan Public School Employees Retirement System ―Michigan State Employee Retirement System
3
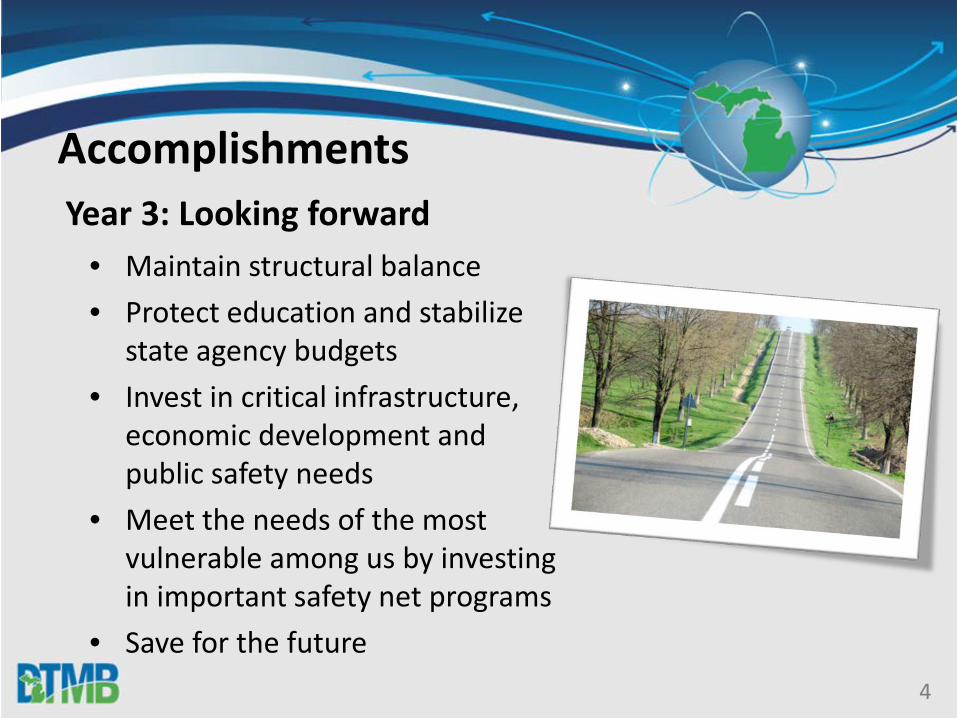
Accomplishments Year 3: Looking forward
• Maintain structural balance • Protect education and stabilize
state agency budgets • Invest in critical infrastructure,
economic development and public safety needs
• Meet the needs of the most vulnerable among us by investing in important safety net programs
• Save for the future 4

• Growing more jobs • Personal income is increasing • Home sales and prices are
increasing • Our population is growing again
Turning the Corner
5

6
Michigan’s Economic Turnaround • GDP growth 6th best in nation in 2011; ranked 50th in 2008 and 2009 • 2012 was second consecutive year of job expansion after 10 straight
years of declines • Payroll employment growth rate was 5th strongest among the states in
2011; 46th in 2009 • Per capita income growth 7th best in nation in 2011; ranked 42nd in 2008 • Housing starts increased 22 percent in 2012 and were up 66 percent
from the 2009 level • State motor vehicle production increased 17 percent in 2012; production
was almost double 2009 production • The State is much stronger than it was in last decade
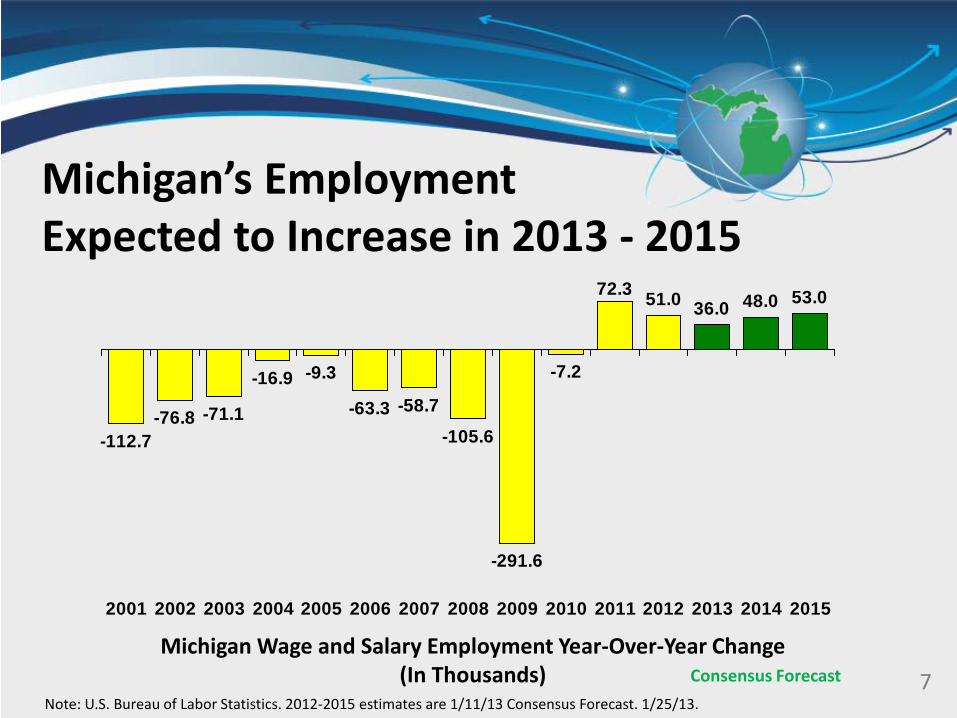
Michigan’s Employment Expected to Increase in 2013 - 2015
Michigan Wage and Salary Employment Year-Over-Year Change (In Thousands) 7
Note: U.S. Bureau of Labor Statistics. 2012-2015 estimates are 1/11/13 Consensus Forecast. 1/25/13.
-112.7-76.8 -71.1
-16.9 -9.3
-63.3 -58.7
-105.6
-291.6
-7.2
72.3 51.0 36.0 48.0 53.0
2001 2002 2003 2004 2005 2006 2007 2008 2009 2010 2011 2012 2013 2014 2015
Consensus Forecast
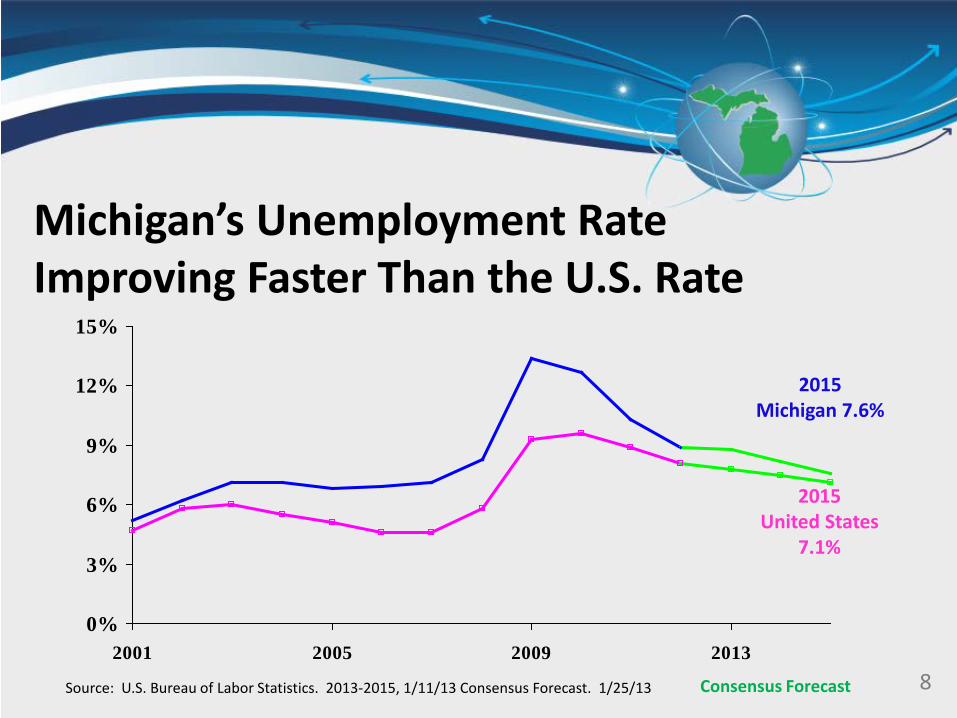
Michigan’s Unemployment Rate Improving Faster Than the U.S. Rate
8 Source: U.S. Bureau of Labor Statistics. 2013-2015, 1/11/13 Consensus Forecast. 1/25/13
0%
3%
6%
9%
12%
15%
2001 2005 2009 2013
2015 United States
7.1%
2015 Michigan 7.6%
Consensus Forecast
9
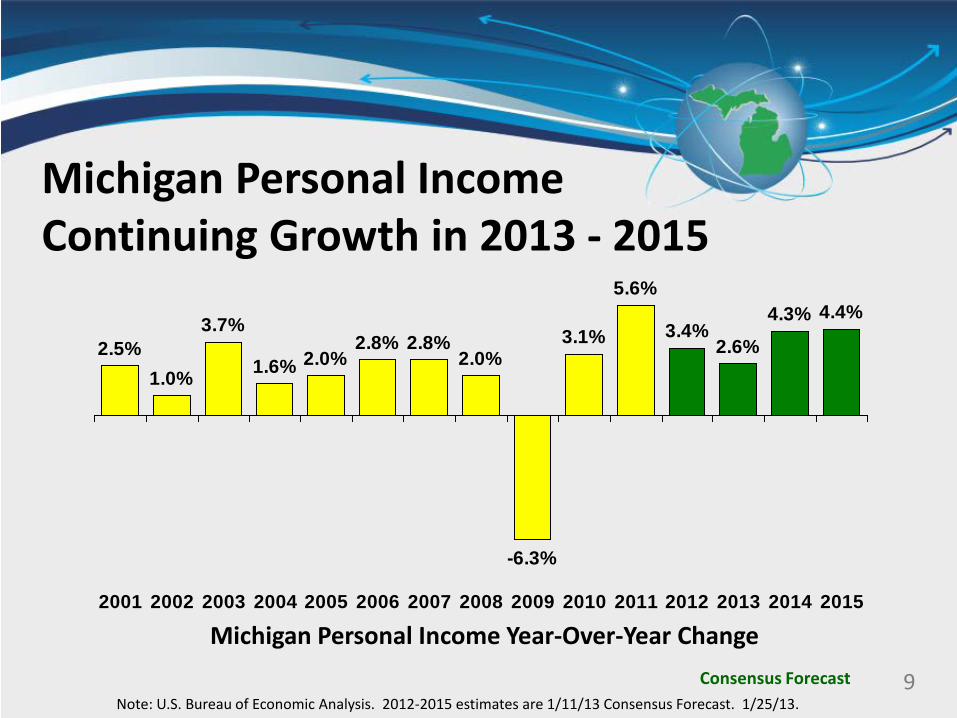
Michigan Personal Income Continuing Growth in 2013 - 2015
Michigan Personal Income Year-Over-Year Change
Note: U.S. Bureau of Economic Analysis. 2012-2015 estimates are 1/11/13 Consensus Forecast. 1/25/13.
2.5%1.0%
3.7%
1.6% 2.0%2.8% 2.8%
2.0%
-6.3%
3.1%
5.6%
3.4%2.6%
4.3% 4.4%
2001 2002 2003 2004 2005 2006 2007 2008 2009 2010 2011 2012 2013 2014 2015
Consensus Forecast

10 Sources: U.S. Bureau of the Census & Treasury Forecast 1/11/13
Michigan Housing Starts are Rebounding
0
10,000
20,000
30,000
40,000
50,000
60,000
2001 2002 2003 2004 2005 2006 2007 2008 2009 2010 2011 2012 2013 2014 2015
Treasury Forecast

11
Fitch said the upgrade reflects “the state’s solid economic and fiscal recovery over the last two years.”
• Fitch Ratings upgraded Michigan’s general obligation credit rating to AA
• Standard and Poor’s upgraded Michigan’s credit outlook to “positive”
• Moody’s upgrades Michigan’s bond rating from stable to positive
April 2, 2013: People are Taking Note

Health and Human Services $22.6 Billion
Education $15.3 Billion
Jobs $6.1 Billion
Public Safety $3.1 Billion
Government Services $2.7 Billion
Environment $922 Million
Budget Stabilization / Health Savings Fund $178 Million
FY 2014 Total $50.9 Billion
12
Total FY 2014 Budget Recommendation
Budget Stabilization/
Health Savings Fund
Jobs
Education
Government Services
Environment
Public Safety
Health and Human Services
Total Gross: $50.9 Billion

13
Total New GF/SAF Investments in FY 2014 Budget
Budget Stabilization/ Health Savings Fund
$178M 30%
Jobs $84.5M
14%
Education $187.7M
31%
Government Services $51.4M
9%
Environment $14.9M
2%
Public Safety $52.6M
9%
Health and Human Services
$27M 5%
Total: $596.1 Million

Key Policy Investments • Infrastructure • Jobs • Public safety • Long-term savings
14

Driving the Economy Forward • Invest $1.2B more per year in our road infrastructure • Four layers to a common sense outcome
‒ Make regular payments to avoid huge bill ‒ Save on vehicle repair costs ‒ Grow the economy by creating jobs ‒ Save nearly 100 lives per year
• Roads, bridges, public transit, rail, harbors
15

Source: OEI, RMF – 07/27/12
Investing in Our Roads
16
$25B Gap

17
Supporting Job Creation • $10M for a new skilled trades program • $20M to assist banks in extending capital to
underserved communities • $3M for a new food and agriculture growth initiative • $4M increase for Pure Michigan
Making Michigan Safer • Increase strength of Michigan State Police ranks
‒ Trained 78 troopers in FY 2012 ‒ Anticipate training 152 troopers during FY 2013 ‒ $15.2M to train 107 troopers in FY 2014
• $2M for mental health courts • $3M for treatment courts • $9.5M for blight elimination and $4M for “Good Neighbor”
property maintenance
18
Long-term Savings
19
• One-time, surplus funds • Important for Michigan’s ratings • Rainy Day Fund • Michigan Health Savings Fund • Disaster and Emergency Contingency Fund
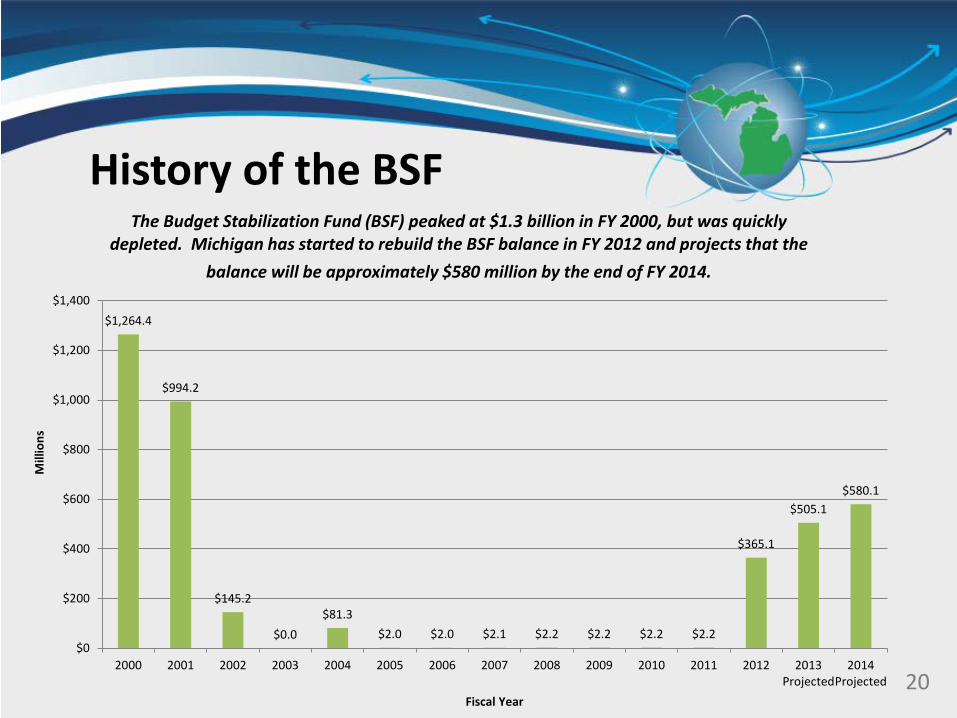
$1,264.4
$994.2
$145.2
$0.0 $81.3
$2.0 $2.0 $2.1 $2.2 $2.2 $2.2 $2.2
$365.1
$505.1 $580.1
$0
$200
$400
$600
$800
$1,000
$1,200
$1,400
2000 2001 2002 2003 2004 2005 2006 2007 2008 2009 2010 2011 2012 2013Projected
2014Projected
Mill
ions
Fiscal Year
The Budget Stabilization Fund (BSF) peaked at $1.3 billion in FY 2000, but was quickly depleted. Michigan has started to rebuild the BSF balance in FY 2012 and projects that the
balance will be approximately $580 million by the end of FY 2014.
20
History of the BSF

21
Other Items of Interest • Constitutional Revenue Sharing • EVIP • Regional Prosperity Initiative • Competitive Grant Assistance Program • IT Innovation Fund • MiDeal • eProcurement
22
Constitutional Revenue Sharing • FY 2014 payment up 4.1 percent over prior year • 11 percent growth in payments for cities and villages since FY 2010 • Cities and villages receive $382.5M, or 52 percent, of FY 2014
payments
23
Economic Vitality Incentive Program • Provides incentive payments to eligible participants • 93 percent of eligible participants are cities and villages (452);
7 percent for townships • 98 percent of funding, or $220M, earmarked for cities and
villages; 2 percent for townships

Regional Prosperity Initiative • New FY14 investment of $5M • Voluntary competitive grant program • Program goals
‒ Regional reinvention ‒ Empower locals to drive economic prosperity ‒ Encourage regional collaboration
• Existing State-Designated Planning Regions and Metropolitan Planning Organizations are eligible to apply in the following three categories: ‒ Regional Prosperity Collaborative, $250,000 maximum grant ‒ Regional Prosperity Council, $375,000 maximum grant ‒ Regional Prosperity Board, $500,000 maximum grant
24

• Financial help to offset costs of combining local government operations; long-term financial benefits to local governments
• $45M state investment over three-year period • 60 awards, totaling $14.9M, in FY 2012; examples:
‒ Grand Rapids, Flint and Lansing combined income tax processing and tax payment systems - $2.1M savings
‒ Macomb County, Clinton Township and Sterling Heights consolidated dispatch and communications operations - $15M savings
‒ Waterford Township and Pontiac consolidated fire services - $12M savings
Competitive Grant Assistance Program
25

26
ICT Innovation Fund • Program that allows jurisdictions to partner on IT projects to
make state and local government more productive • Venture capital loans available to state agencies, local units
of government, and nonprofits • For instance:
‒ Eastern Upper Peninsula Intermediate School District Integrated Information Systems Five integrated management systems, a platform
transferable to other school districts
• Allows local units of government to use state contracts to buy goods and services
• Membership is open to cities, townships, villages, counties, school districts, universities, community colleges and nonprofit hospitals ‒ Flexible, voluntary use program ‒ Currently, more than 1,000 members ‒ More than 300 contracts available ‒ Thousands of products and services ‒ Average savings of up to 25 percent or more ‒ Mitigates cost of procurement ‒ Eliminates administrative duplication
MiDeal
27

• DTMB Procurement will be moving from our current bid solicitation system, Bid4Michigan, to Buy4Michigan which is a robust eProcurement software system that provides ‒ Greater procurement efficiency ‒ Integration of best practices ‒ Cooperative purchasing ‒ Spend analytics ‒ Cost savings throughout the procurement process
eProcurement
28

• The State has purchased a perpetual, irrevocable, unlimited, enterprise-wide license for the system
• Our license includes all State of Michigan users, all prior Bid4Michigan system users and all MiDEAL member users interested in participating – There is no limit on the number of users
• Additional Information is available at: http://www.michigan.gov/micontractconnect 517-335-0230
eProcurement
29

Thank you.
30