moving from data to action: bridging the information gap
TRANSCRIPT

Moving from Data to Action: Bridging the Information Gap
Ellyn Artis, Education Delivery Institute
Judith Walker de Felix, University of Missouri – St. Louis
Moving from Data to Action: Bridging the Information Gap

Workshop Objectives
Understand the delivery framework and it’s connection to using data for action
Hear about an applied experience at University of Missouri-St. Louis
Learn about our data capacity tool that helps leaders reflect on how the campus uses data for decision-making

Ellyn Artis
Director of Higher Education Education Delivery Institute
Judith Walker de Felix
Associate Provost, Academic Affairs and Dean of the Graduate School
University of Missouri-St Louis
Please meet your session speakers!
4
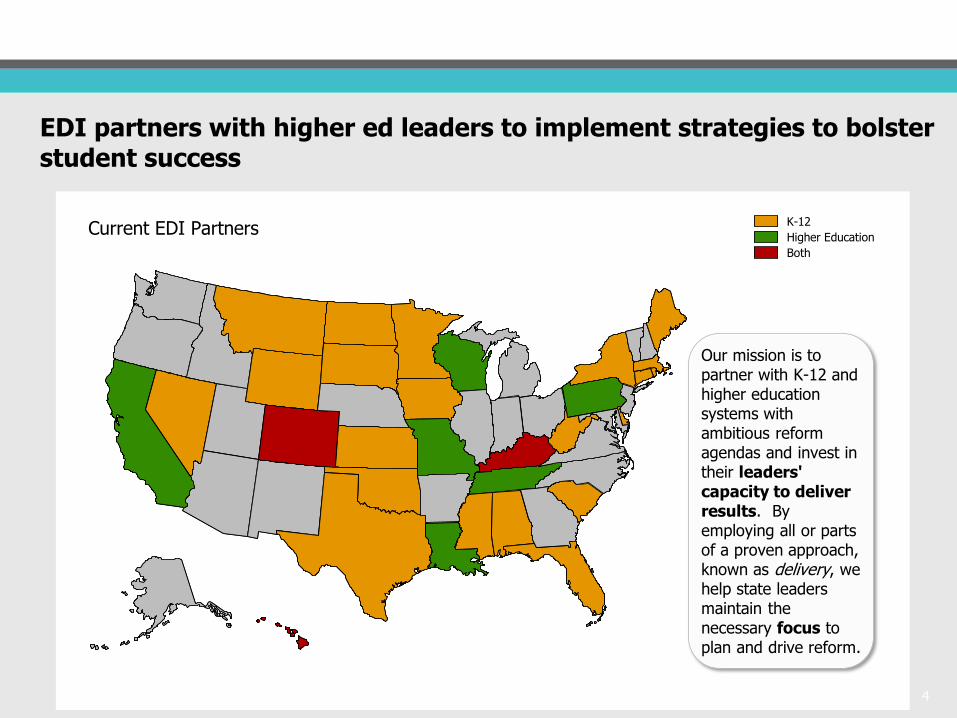
EDI partners with higher ed leaders to implement strategies to bolster student success
3©2015 U.S. Education Delivery Institute
EDI partners with public education systems to help leaders implement major reform efforts
Current EDI Partners K-12
Higher Education
Both
Our mission is to partner with K-12 and higher education systems with ambitious reform agendas and invest in their leaders' capacity to deliver results. By employing all or parts of a proven approach, known as delivery, we help state leaders maintain the necessary focus to plan and drive reform.
5
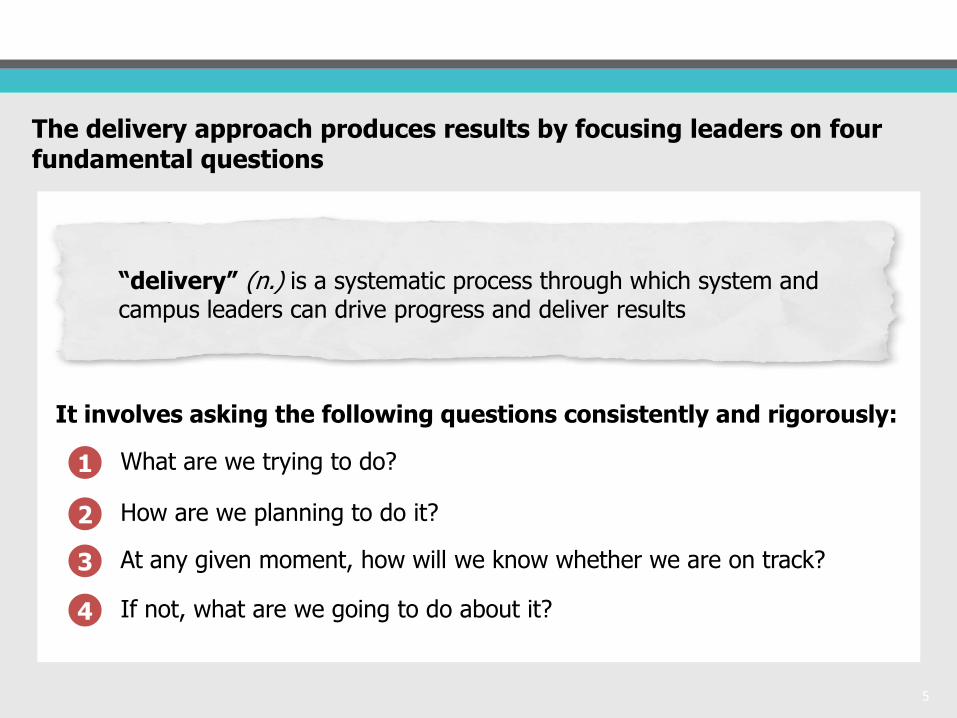
The delivery approach produces results by focusing leaders on four fundamental questions
“delivery” (n.) is a systematic process through which system and campus leaders can drive progress and deliver results
It involves asking the following questions consistently and rigorously:
1 What are we trying to do?
2 How are we planning to do it?
3 At any given moment, how will we know whether we are on track?
4 If not, what are we going to do about it?

6
“Good data, while essential, is only a start—you then have to use it!”

7
We work with leaders at various levels to align, focus, and prioritize student success efforts underway
Enrollment Targets
Learning Communities
“15 to Finish” Intrusive Advising
Undergraduate Research/HIPs
Early Alert
Student Supports for specific student groups
Transfer Student Supports
Cohort Registration
Peer Mentors

8
We believe that these behaviors are necessary for campuses to use data effectively in decision making
Campuses must: Have clear targets against which to measure performance
Use timely data (both headline metrics and leading indicators) that are monitor
progress on a regular basis
Disaggregate the data in order to isolate outcomes for specific groups of students
Establish routines that help teams come to a shared view of progress
Involve IR in relevant conversations and analyses to take advantage of existing expertise
Empower decision makers to seek and use relevant data to support students

Workshop Objectives
Understand the delivery framework and it’s connection to using data for action
Hear about an applied experience at University of Missouri-St. Louis
Learn about our data capacity tool that helps leaders reflect on how the campus uses data for decision-making

Non-traditional students
Most diverse university in Missouri
Urban land-grant and research mission
Political institution with coalitions driving change
Lots of data but rarely used strategically
UMSL’s context is like many other schools

Delivery Unit Principles
▪ Be small ▪ Reside outside the line of responsibility ▪ Have time to devote to student success efforts ▪ Have skills in: – Problem solving – Relationship management – Data analysis – Feedback and coaching – Delivery mindset
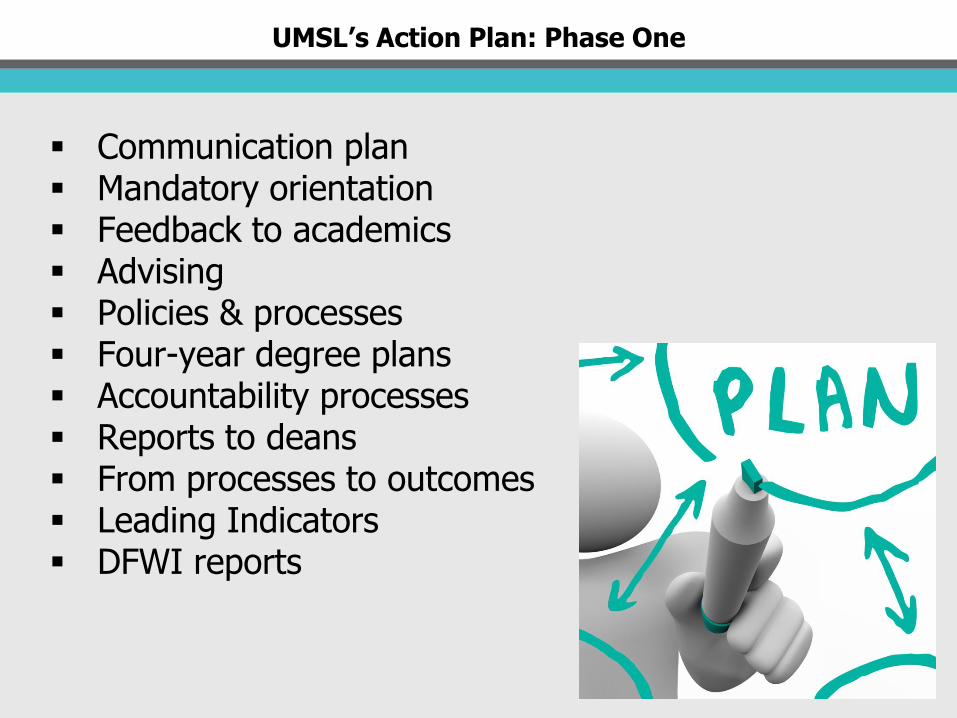
Communication plan Mandatory orientation Feedback to academics Advising Policies & processes Four-year degree plans Accountability processes Reports to deans From processes to outcomes Leading Indicators DFWI reports
UMSL’s Action Plan: Phase One

13
Council of Dean’s Traffic Light Judgments on Goals
Goals 2010–2011 College
1 College
2 College
3 College
4 College
5 College
6 College
7 College
8 College
9
Campus Visits
Orientation
Advising Process Assessment
FYE
Graduation Plans
4-year Degree Plans N/A
DWI Reduction
Tutoring
Exit Interview Process
Degree Completion N/A N/A N/A

Review individual students’ progress. Propose more policy changes. Hold deans accountable for students’ success. Connect A2S with campus strategic plan
UMSL’s Action Plan: Phase Two

15
Council of Dean’s Judgments on Goals
Goals 2010–2011 College
1 College
2 College
3 College
4 College
5 College
6 College
7 College
8
FS-FS All FR Retention
FS-FS FR URM Retention
FS-FS FR Pell Retention
FS-FS All TR Retention
FS-FS TR URM Retention
0
FS-FS TR Pell Retention
< 50%
50-70%
71-85%
86-100%
Student Success (graduation plus persistence)

Time to Celebrate UMSL’s Success
Deliverology works!
Look for leadership in
new places.
Use the data that you
have
Require periodic
stocktaking
Hold everyone
accountable—publicly
if possible
Celebrate!

Workshop Objectives
Understand the delivery framework and it’s connection to using data for action
Hear about an applied experience at University of Missouri-St. Louis
Learn about our data capacity tool that helps leaders reflect on how the campus uses data for decision-making
18
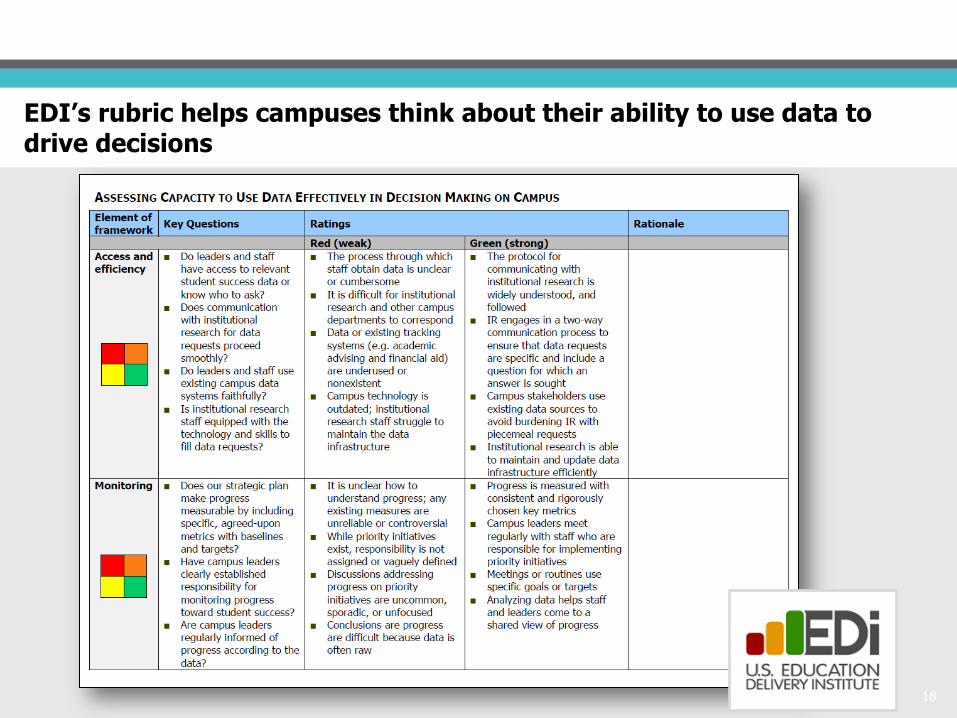
EDI’s rubric helps campuses think about their ability to use data to drive decisions

19
The data self-assessment tool helps campuses understand current capacity to answer these questions
Rubric category This category asks us to think about…
Access and efficiency
Monitoring
Problem solving
The ease and speed with which data can be accessed or retrieved from campus systems
Culture
Actions taken to understand progress on campus goals and metrics
The processes we use to turn what we learn from campus data into action around campus strategies
The attitudes and reactions of campus faculty and staff toward making decisions using campus data

20
The rubric allows you to assess your campus in each category
Category
Access and efficiency
Monitoring
Problem solving
Culture
Rating Rationale Summary
Capacity to use data to
make decision on
campus
Red: Our campus must focus on improving in this area to use data effectively in decision making
Orange: Our campus must improve in this area, though in some aspects more than others
Yellow: Our campus should continue in the aspects we find strong, but focus on weak points
Green: Our campus is successfully using our capacity in this area to use data to make decisions

21
To download more of our tools, please visit: www.deliveryinstitute.org
Questions?