moving ahead - calstrs · basic financial statements 43 statement of fiduciary ... 10-year...
TRANSCRIPT

MOVING AHEAD
CALIFORNIA STATE TEACHERS’ RETIREMENT SYSTEMA COMPONENT UNIT OF THE STATE OF CALIFORNIA
COMPREHENSIVE ANNUAL FINANCIAL REPORTFOR THE FISCAL YEAR ENDED JUNE 30, 2014

A Component Unit of the State of California Comprehensive Annual Financial Report for the F iscal Year Ended June 30, 2014
Prepared by CalSTRS staff
CALIFORNIA STATE TEACHERS’ RETIREMENT SYSTEM

Securing the financial future and sustaining the trust of California’s educators
STRATEGIC GOALS
Financial Ensure a financially sound retirement system.
Risk Management Responsibly manage risk to the organization.
Member/Customer Enhance services to members and customers.
Workforce and Process Improvements Improve the work environment and internal efficiency.
MISSION


CONTENTS
Introduction
7 CEO Letter of Transmittal
14 Award: GFOA Certificate
15 Award: PPCC
16 Teachers’ Retirement Board
17 Executive Staff
18 Year in Review
21 Professional Services
Financial
25 Independent Auditor’s Report
28 Management’s Discussion and Analysis
42 Requests for Information
Basic Financial Statements43 Statement of Fiduciary Net Position
44 Statement of Changes in Fiduciary Net Position
45 Notes to the Basic Financial Statements
Required Supplementary Information— Unaudited77 Schedule of Changes in Net Pension Liability of Employers and Nonemployer Contributing Entity
78 Schedule of Net Pension Liability of Employers and Nonemployer Contributing Entity
79 Schedule of Contributions from Employers and Nonemployer Contributing Entity
81 Schedule of Money-Weighted Investment Returns
82 Schedule of Funding Progress (Medicare Premium Payment Program only)
Other Supplemental Information84 Schedule of Administrative Expenses
85 Schedule of Investment Expenses
89 Schedule of Consultant and Professional Services Expenses
Other Pension Information— State Teachers’ Retirement Plan93 Independent Auditor’s Report
95 Schedule of Proportionate Share of Contributions for Employers and Nonemployer Contributing Entity
124 Schedule of Aggregate Pension Amounts for Employers and Nonemployer Contributing Entity (as restated)
125 Notes to Other Pension Information (as restated)
Investments
133 Investment Consultant’s Report
134 Investments
Tables 134 Asset Allocation
134 Market Value of Investments
135 Annual Performance Returns
135 Time-Weighted Performance Returns for Major Asset Categories
137 Largest Fixed Income Holdings
139 Largest Equity Holdings
141 Investment Summary
142 Schedule of Investment Expenses
142 Global Equity Broker Commissions

CONTENTS173 Changes in Cash Balance Benefit Program Provisions
176 Schedule of Active Participant Valuation Data
177 Schedule of Retired Participants and Beneficiaries Added to and Removed from Annuity Rolls
177 Solvency Test
178 Analysis of Financial Experience
178 Schedule of Funding Progress
Medicare Premium Payment Program179 Actuary’s Certification Letter
181 Summary of Actuarial Assumptions and Methods
181 Actuarial Methods
181 Independent Actuarial Review
181 Summary of Medicare Premium Payment Program Provisions
182 Changes in the Medicare Premium Payment Program Provisions
186 Schedule of Medicare Part A Enrollment Rates
186 Schedule of Retired Members Added to and Removed from Medicare Part A Premium Rolls
187 Solvency Test
187 Analysis of Financial Experience
Statistical
191 Statistical
193 State Teachers' Retirement Plan
195 Defined Benefit Program Schedules
203 Defined Benefit and Defined Benefit Supplement Program Participating Employers
207 Defined Benefit Supplement Program Schedules
210 Cash Balance Benefit Program Schedules
212 Cash Balance Benefit Program Participating Employers
213 Programs Administered or Overseen by the Retirement System
215 Medicare Premium Payment Program
Actuarial
Defined Benefit Program145 Actuary’s Certification Letter
147 Summary of Actuarial Assumptions and Methods
148 Actuarial Assumptions
148 Actuarial Methods
149 Independent Actuarial Review
150 Summary of Defined Benefit Program Provisions
153 Changes in Defined Benefit Program Provisions
156 Schedule of Active Member Valuation Data
157 Schedule of Retired Members and Beneficiaries Added to and Removed from Rolls
157 Solvency Test
158 Analysis of Financial Experience
158 Schedule of Funding Progress
Defined Benefit Supplement Program159 Actuary’s Certification Letter
161 Summary of Actuarial Assumptions and Methods
161 Actuarial Assumptions
162 Independent Actuarial Review
162 Summary of Defined Benefit Supplement Program Provisions
163 Changes in Defined Benefit Supplement Program Provisions
166 Schedule of Active Member Valuation Data
167 Schedule of Retired Members and Beneficiaries Added to and Removed from Annuity Rolls
167 Solvency Test
168 Analysis of Financial Experience
168 Schedule of Funding Progress
Cash Balance Benefit Program169 Actuary’s Certification Letter
171 Summary of Actuarial Assumptions and Methods
172 Actuarial Assumptions
172 Independent Actuarial Review
172 Summary of Cash Balance Benefit Program Provisions

7INTRODUCTION
The Comprehensive Annual Financial Report issued by the California State Teachers’ Retirement System details the system’s performance for the fiscal year ending June 30, 2014. One year following its centennial anniversary in 2013, CalSTRS has experienced yet another historic milestone.
In June 2014, the Legislature passed and Governor Edmund G. Brown Jr. signed into law Chapter 47, Statutes of 2014 (Assembly Bill 1469–Bonta), which estab-lishes a statutory solution to fully fund the CalSTRS Defined Benefit Program. This tremendous accomplishment concludes a nearly decade-long effort to bridge the $73.7 billion unfunded actuarial liability as of June 30, 2013, and sets the program on a sustainable course.
Funding History As a financial services organization, CalSTRS history dates back to 1913. In its 101 years, CalSTRS has weathered the ups and downs of a variety of financial markets. Deficiencies in funding often overshadowed the Defined Benefit Program. Until 1972, CalSTRS operated on a pay-as-you-go basis.
However, increased contributions from the state beginning in 1990, together with a balanced portfolio administered with the patience of a long-term investor, sustained a period of growth for the fund. Ultimately, this put CalSTRS in a strong financial position. In 2000, and for the first time in CalSTRS’ history, the program was more than 100 percent funded. Unfortunately, this financial standing did not last.
While CalSTRS’ assets were at an all-time high at the beginning of the past decade, and more than adequate to meet future obligations, the downturns that occurred with the dot-com bust in 2001 and the Great Recession in 2008 led to lower than expected investment returns. In fiscal year 2009, the fund experienced a 25 percent loss. While this event alone was a devastating experience, it is the loss of an entire 10-year period—from 2000–2010—that severely harmed the Defined Benefit Program funded status.
For the first time, CalSTRS could project that, even if the investment portfolio could consistently earn its investment return assumption, the fund would still deplete its assets in about 30 years. Thus, assumed market gains in future years would not be sufficient to address such significant losses. A change in the program funding and contribution rates from all parties would be required to reach adequate funding.
California State Teachers’Retirement System
100 Waterfront PlaceWest Sacramento, CA 95605
December 19, 2014
INTRODUCTION

8 CALSTRS COMPREHENSIVE ANNUAL FINANCIAL REPORT 2014
For many pension plans, responses to losses of this magnitude would typically be accompanied by an adjustment in pension funding. Although the Teachers’ Retirement Board is responsible for administering CalSTRS and assessing the financial state of the system, contribution rates for the program are set in statute. Unlike other pension funds in California, the board lacked the authority to adjust contribution rates and had to rely on a legislative remedy instead.
Lacking the authority to adjust contribution rates, CalSTRS began what would become a comprehensive effort to educate the Legislature, the Administration and influential stakeholders on the need to address the unfunded liability. For close to a decade, CalSTRS conducted extensive legislative, media and stakeholder briefings, and engaged in very public board discussions with a consistent message: absent any changes in contribution rates or liabilities, current calculations projected that the program would deplete its assets in about 30 years.
It took many years to cultivate the alignment of interests necessary to achieve a legislative plan that would address the CalSTRS funding shortfall. The succession of complex issues that surrounded this effort also placed tremendous importance on CalSTRS’ transparency throughout this process. The needs of the CalSTRS Defined Benefit Program often competed with constrained government budgets.
Funding Plan EnactedThis year, consensus recognition of the need to stabilize CalSTRS’ funding emerged with the enactment of the funding solution detailed in Assembly Bill 1469. The shared-responsibility plan gradually increases contribution rates from all plan contributors by an amount that is projected to fully fund the Defined Benefit Program in about 32 years.
The initial increases in employee, employer and state contributions took effect July 1, 2014, and will continue to rise incrementally over the next several fiscal years. Member contribution increases will be phased in over the next three years and increase by an additional 2.25 percent of payroll for CalSTRS 2% at 60 members, and an additional 1.205 percent for CalSTRS 2% at 62 members. Member contribution rates last changed 42 years ago in 1972.
In exchange for member contributions rate increases, the Legislature cannot reduce the 2 percent annual benefit adjustment or improvement factor, for members working or retiring in 2014 and after. Prior to this exchange, the Legislature explicitly reserved the right to reduce or eliminate the improvement factor and still maintains this right with regard to members who retired before 2014.
School employers will see their contribution rates rise a total of 10.85 percent phased in over the next seven fiscal years. The state’s contribution rate to the Defined Benefit Program will increase by 4.311 percent phased in over the next three years. The legislation also grants the Teachers’ Retirement Board limited rate setting authority to adjust up or down employer and state rates if necessary to fully fund the Defined Benefit Program. Member rates are not subject to this adjustment.
The funding approach in AB 1469 is predicated on the actuarial assumption that CalSTRS will earn a 7.5 percent annual rate of return throughout the life of the plan. To facilitate the monitoring of its progress toward full funding, CalSTRS is also required to submit a report on the fiscal health of the Defined Benefit Program to the Legislature every five years beginning July 1, 2019.
INTRODUCTION

9INTRODUCTION
The most significant accomplishment contained within the legislative funding solution is that CalSTRS is no longer projected to deplete its assets. CalSTRS is on target to meet the promise of a secure financial future due to California’s educators. The dynamic leadership of our Governor, the Legislature and stakeholders has been remarkable in reaching this historic accomplishment and milestone.
Impacts of a Funding PlanThe June 30, 2013 valuation of the Defined Benefit Program showed a $2.7 billion increase in the funding shortfall from the previous valuation. The growth of the funding gap projected prior to enactment of AB 1469 put CalSTRS at a 66.9 percent funded ratio. Beginning this year, however, enactment of the new funding plan in AB 1469 will affect valuations and financial statements with regard to new accounting standards changes imposed by the Governmental Accounting Standards Board.
Specifically, GASB issued Statements 67 and 68, which revise the required disclosure of pension liabilities by public pension plans and public employers. Among the changes in those statements is a requirement that a new Net Pension Liability (NPL) be determined and disclosed by CalSTRS and presented in the financial statements for plan employers (school districts) and non-employer contributing entity (the state for CalSTRS). For pension plans that project asset depletion, the GASB standards require the use of a blended discount rate, reflecting a lower municipal bond rate as well as the assumed investment return rate, to calculate pension liabilities.
Based on the June 30, 2013 valuation of the Defined Benefit Program, the NPL, which would have been reflected in CalSTRS financial statements and subsequently on state and school employer statements after this year, was projected to be about $167 billion. With the enactment of AB 1469, actuarial projections indicate that assets are not projected to be depleted, and will be sufficient to pay benefits in future years. Thus, CalSTRS no longer is required to use the blended discount rate under the GASB standards. As a result, actuarial projections of the NPL for the State Teachers' Retirement Plan—the Defined Benefit, Defined Benefit Supplement, Cash Balance Benefit, Supplemental Benefit Maintenance Account and Replacement Benefit programs—is $58.4 billion as of June 30, 2014. This represents an almost two-thirds reduction.
Moving Ahead—Addressing Climate Change Through Risk Management and Investment Opportunities CalSTRS seeks to accomplish its mission of providing a secure retirement to California’s educators by prudently managing the investment portfolio with the least amount of risk. Toward this end, CalSTRS actively engages its portfolio companies on the importance of assessing and disclosing their levels of exposure to environmental risk.
Although climate change poses significant risk issues, it also opens up new investment opportunities. CalSTRS believes that the underlying risks of climate change should be addressed now. The Teachers’ Retirement Board has also clearly expressed its priority in the consideration that climate change plays in the investment process.
Based on our experience, an effective strategy to mitigate risk such as climate change is through engagement. Recently, CalSTRS expanded its effort to manage risk with regard to climate change to include engagement on fossil fuel valuation. CalSTRS believes the issues presented in Carbon Tracker’s
Unburnable Carbon 2013: Wasted Capital and Stranded Assets report call for appropriate action.
INTRODUCTION

10 CALSTRS COMPREHENSIVE ANNUAL FINANCIAL REPORT 2014
Of the top 200 global fossil fuel companies listed on the Carbon Tracker website, CalSTRS has engaged 44 U.S. companies held in its portfolio requesting dialogues on fossil fuel reserve valuations. CalSTRS believes engagement through educated dialogue will create a platform for companies to assess and disclose the real material risks impacted by climate change.
According to the International Energy Agency, the world must invest at least an additional $1 trillion per year–a Clean Trillion–into clean energy by 2050 if we have any hope of limiting global warming to 2 degrees Celsius and avoiding the worst impacts of climate change on our environment, health and the global economy.
In support of scaling up clean energy investments, CalSTRS announced plans to increase clean energy and technology investments of $1.4 billion to $3.7 billion by 2019. CalSTRS did so after evaluating how clean energy investment opportunities were likely to grow and which opportunities would be appropriate for CalSTRS. This announcement came in response to United Nations Secretary-General Ban Ki-moon’s call for bold action to reduce carbon emissions and build resilience to the impacts of climate change that coincided with the United Nations 2014 Climate Summit, which CalSTRS participated in. At the summit, CalSTRS sought to bring attention to the role large institutional investors could play in financing clean energy and climate change initiatives.
CalSTRS sees a growing number of investment opportunities in low-carbon solutions, especially as renewable energy technology costs come down and regional clean energy policies take hold. CalSTRS also believes that increasing exposure to the clean energy and technology sector provides a good investment opportunity because it positions CalSTRS for a low-carbon future. With this commitment, CalSTRS hopes to catalyze incentives for stronger, more comprehensive policies that support clean energy and reduce the risks associated with climate change.
More than 100 years ago, the Legislature established the Teachers’ Retirement Fund as a means to provide a secure retirement to the devoted educators of this state and keeping that promise has been no simple task. CalSTRS commends the Legislature, the Governor and our stakeholders for their leadership in this tremendous achievement.
CalSTRS is responsible for the financial future of hundreds of thousands of educators and their families. With a solid financial plan in place and prudent investment strategy, CalSTRS can confidently carry out its mission, which is to secure the financial future and sustain the trust of our membership.
Member ProfileEstablished 101 years ago, CalSTRS, with a $190.5 billion in net position as of June 30, 2014, is the largest educator-only pension fund in the world. It administers retirement, disability and survivor benefits for California’s 879,329 public school educators and their beneficiaries, from prekindergarten through community college. The Teachers’ Retirement Law, part of the California Education Code, established the programs with CalSTRS as the administrator. The law sets required member, employer and state contribution rates. CalSTRS members include employees of approximately 1,700 school districts, community college districts, county offices of education and regional occupational programs as of June 30, 2014. Our membership spans from the new teacher just starting out to the retired educator enjoying the fruits of decades of teaching in the classroom.
INTRODUCTION

11INTRODUCTION
The median CalSTRS pension replaced less than 60 percent of final salary for the members who retired last year. CalSTRS recommends income replacement of 80 percent to 90 percent to maintain a similar lifestyle in retirement. Public educators do not receive Social Security benefits for their CalSTRS service. Moreover, due to the federal Government Pension Offset and Windfall Elimination Provision, retirees often have their Social Security benefits reduced when receiving a CalSTRS benefit. Most retired educators also do not have employer-funded health insurance after age 65.
We continue to reach members in their communities—from Crescent City to San Diego—with online services, counseling services and workshops that explain retirement options and stress the need for early savings. With Web-based information and more than 40 publications, we strive to be members’ trusted guide to retirement.
Financial StatementsThe financial statements and notes along with the Management Discussion and Analysis in this report present and analyze the changes in CalSTRS fiduciary net position for the fiscal year ended June 30, 2014. The markets are dynamic and fluid; any judgment of the financial statements should also consider current market conditions.
Schedule of Proportionate Share and Schedule of Aggregate Pension AmountsCalSTRS has provided two new audited schedules in its financial statements. The first schedule, the Schedule of Proportionate Share of Contributions for Employers and Nonemployer Contributing Entity, provides the amount of contributions due to CalSTRS during fiscal year 2013–14 by employer and for the State of California as well as the percentage of total contributions due associated with each employer and the State of California. The second schedule, the Schedule of Aggregate Pension Amounts for Employers and Nonemployer Contributing Entity, presents the aggregate net pension liability, pension expense, and deferred inflows and outflows of resources associated with the State Teachers’ Retirement Plan (STRP) as a whole. Notes accompanying each schedule present the policies and other information critical to understanding the information in each schedule.
School districts and other employers that participate in the STRP may be required to implement GASB 68 in their financial statements beginning in fiscal year 2014–15. GASB 68 requires employers that participate in cost-sharing defined benefit plans such as the STRP to record their proportionate share of the net pension liability, pension expense and deferred items. GASB 68 also mandates additional note disclosures and schedules related to pensions.
Management Responsibility For Financial Reporting And Internal ControlsThe financial statements were prepared in accordance with accounting principles generally accepted in the United States. Management is responsible for the integrity and fairness of the information presented in the financial statements, including data that, out of necessity, is based on estimates and judgments. Management is also responsible for establishing and maintaining an effective internal control structure. A system of internal controls provides reasonable, but not absolute, assurance that assets are properly safeguarded and that financial statements are reliable. The concept of reasonable assurance recognizes that first, the cost of a control should not exceed the benefits likely to be derived, and second, the valuation of the cost and benefits requires estimates and judgments by management. We believe that the internal controls currently in place support this purpose, and that the financial statements, accompanying schedules and statistical tables are fairly presented in all material respects.
INTRODUCTION

12 CALSTRS COMPREHENSIVE ANNUAL FINANCIAL REPORT 2014
Investments OverviewThe CalSTRS Investment Portfolio increased by $23.3 billion over the past 12 months. The CalSTRS portfolio is broadly diversified, holding investments ranging from publicly traded short-term bonds to privately held partnerships. The scale and breadth of investments make the management and oversight of these assets highly complex. In light of these factors, CalSTRS has been effective in using its resources in a cost-efficient manner to ensure that benefits continue to flow to CalSTRS participants. Over the last year, the CalSTRS Investment Portfolio generated a 18.7 percent one-year return calculated on a time-weighted performance basis.
See the Investments section for more detailed information on the performance of the CalSTRS Investment Portfolio.
Actuarial ReportsA summary of demographic and economic assumptions adopted from experience studies that CalSTRS conducts every four years is highlighted in this section. These assumptions are applied to an actuarial valuation that is generally performed on an annual basis. The actuarial valuation provides a picture of the overall funding health of our programs, including the Defined Benefit, Defined Benefit Supplement, Cash Balance Benefit and Medicare Premium Payment programs.
Statistical ReportsThis section includes tables that reflect financial trends of the State Teachers' Retirement Plan and demographic characteristics of the Defined Benefit, Defined Benefit Supplement, Cash Balance Benefit, CalSTRS Pension2, and Medicare Premium Payment programs. Also captured in the tables, when applicable, is information comparing the last nine years to the previous fiscal year. This look back reveals overall trends in our programs and membership demographics that help us accurately forecast our future ability to meet our members’ retirement needs.
GFOA AwardThe Government Finance Officers Association of the U.S. and Canada awarded a Certificate of Achievement for Excellence in Financial Reporting to CalSTRS for its comprehensive annual financial report for the year ended June 30, 2013. This is the 19th consecutive year CalSTRS has received this prestigious award. To be awarded the certificate, a government unit must publish an easily readable and efficiently organized comprehensive annual financial report. Our report must satisfy both generally accepted accounting principles and applicable legal requirements.
PPCC Standards Award ProgramThe Public Pension Coordinating Council presented CalSTRS with its Recognition Award for Administration for meeting professional standards for plan administration as set forth in the Public Pension Standards. The Public Pension Coordinating Council is a coalition of three national associations that represent public retirement systems and administrators. The associations that form the PPCC are the National Association of State Retirement Administrators, National Council on Teacher Retirement and National Conference on Public Employee Retirement Systems. Together, these associations represent more than 500 of the largest pension plans in the U.S.
INTRODUCTION

13INTRODUCTION
AcknowledgementsThe 2014 Comprehensive Annual Financial Report demonstrates our commitment to ensure the financial security of California’s educators. The accuracy of the financial data reflects CalSTRS' executive leadership and is a duty performed with prudence in perpetuity. The notion that ideas of the future are influenced by the day-to-day interactions teachers have with students today drives the high quality of service we provide. I would like to thank the many staff, advisors and stakeholder organizations dedicated to serving and securing the financial future of our members. CalSTRS is a unique pension system and it is of utmost importance we continue to sustain the trust and financial integrity of our members in their retirement.
Respectfully submitted,
Jack Ehnes Chief Executive Officer
INTRODUCTION

14 CALSTRS COMPREHENSIVE ANNUAL FINANCIAL REPORT 2014
AWARD: GFOA CERTIFICATEAWARD: GFOA CERTIFICATE

15INTRODUCTION
P CP C Public Pension Coordinating Council
Recognition Award for Administration
2014
Presented to
California State Teachers' Retirement System
In recognition of meeting professional standards for plan administration as
set forth in the Public Pension Standards.
Presented by the Public Pension Coordinating Council, a confederation of
National Association of State Retirement Administrators (NASRA) National Conference on Public Employee Retirement Systems (NCPERS)
National Council on Teacher Retirement (NCTR)
Alan H. Winkle
Program Administrator
AWARD: PPCC AWARDAWARD: PPCC AWARD

16 CALSTRS COMPREHENSIVE ANNUAL FINANCIAL REPORT 2014
TOM TORLAKSON State Superintendent of Public Instruction Ex-Officio Member
THOMAS UNTERMAN Public Representative Term: 07/03/13–12/31/15
BILL LOCKYER State Treasurer Ex-Officio Member
JOY HIGA Public Representative Term: 01/27/14–12/31/17
PAUL ROSENSTIEL Public Representative Term: 11/30/11–12/31/14
SHARON HENDRICKS Board Vice Chair Community College Instructor Term: 01/01/12–12/31/15
JOHN CHIANG State Controller Ex-Officio Member
HARRY KEILEY Board Chair K–12 Classroom Teacher Term: 01/01/12–12/31/15
MICHAEL COHEN Director of Finance Ex-Officio Member
DANA DILLON K-12 Classroom Teacher Term: 01/01/12–12/31/15
TEACHERS’ RETIREMENT BOARD (AS OF JUNE 30, 2014)

17INTRODUCTION
JACK EHNES Chief Executive Officer
CHRISTOPHER AILMAN Chief Investment Officer
ASHISH JAIN Chief Technology Officer
PEGGY PLETT Deputy Chief Executive Officer
CASSANDRA LICHNOCK Chief Operating Officer
ROBIN MADSEN Chief Financial Officer
Executive
Investments
Enterprise Initiatives and Technology
Financial Services
Benefits and ServicesBusinessRenew
BRIAN J. BARTOW General Counsel
General Counsel
ED DERMAN Deputy Chief Executive Officer
CHRIS CAIETTI BusinessRenew Executive Officer
Plan Design and Communication
EXECUTIVE STAFFEXECUTIVE STAFF

18 CALSTRS COMPREHENSIVE ANNUAL FINANCIAL REPORT 2014
MembershipMembership in the CalSTRS Defined Benefit Program includes California public school employees, prekindergarten through community college, who teach, are involved in selecting and preparing instructional materials, provide vocational or guidance counseling or are supervising people engaged in those activities. Membership is in effect as long as contributions remain on deposit with CalSTRS. Members are employed in approximately 1,700 public school districts, community college districts, county offices of education, Regional Occupational Centers and Programs, and select state agencies. The CalSTRS Defined Benefit
Program includes retirement, disability and survivor benefits. Beneficiaries of a retired member who elected an option receive a continuing lifetime benefit upon the member’s death. The financial statements, presented in the financial section, contain Defined Benefit Program membership data as of June 30, 2013, due to the timing of the issuance of the basic financial statements, whereas the membership data presented on this page is as of June 30, 2014. Consequently, the membership data presented here and in the financial statements do not agree.
Disability Benefit Recipients
Survivor Benefit Recipients
Retired Members
182,815
420,887
879,329
9,604 24,103
241,920
Total MembershipActive MembersInactive Members
MEMBERS BY THE NUMBERS
YEAR IN REVIEW

19INTRODUCTION
Benefits to Members and Benefit Recipients Service RetirementCalSTRS is committed to providing exceptional service to its retired members. Our staff establishes and maintains timely and accurate service retirement benefits.
10,736 Members who retired in fiscal year 2013–14*
8 percent Decrease from fiscal year 2012–13
* Retirement applications processed as of June 30, 2014. This number does not include service retirements processed after June 30, 2014, including members who requested retirement with effective dates backdated between January 1, 2014 and June 30, 2014.
Disability Benefits95 percent Applications processed within 150 days
812 Applications received
620 Applications approved
9 percent Decrease in number of disability applications received from fiscal year 2012–13
Survivor Benefits59 percent Payments processed within 30 days of
receiving all necessary information
7,787 Notifications of death received
4 percent Increase in number of notifications from fiscal year 2012–13
Communicating With Our Members and BeneficiariesCustomer ServiceMembers may contact a CalSTRS Contact Center agent by phone, secured online message, or written correspondence.
266,058 Member inquiries answered
34 percent Member calls answered within 30 seconds
368 seconds Average wait time to talk with Contact Center agent
22 percent Members who received a response to their secure online message within one business day
CalSTRS places great emphasis on customer satisfaction and regularly surveys members to ensure they receive accurate, timely and thorough answers to their questions.
72 percent of members were “highly satisfied” with their Contact Center experience.
Member CommunicationsCalSTRS communicates with its active and retired members through a variety of channels.
NewslettersCalSTRS reaches out to members and beneficiaries through the CalSTRS Connections: Reaching Your Retirement, CalSTRS
Connections: Your Money Matters and Retired Educator newsletters.
CalSTRS Connections: Reaching Your Retirement is mailed to active and inactive members age 50 and older in the spring and fall. It provides information about retirement planning and decisions, workshops and benefits counseling, legislative news and more.
CalSTRS Connections: Your Money Matters is mailed to active and inactive members age 49 and younger in the spring and fall. It provides updates on CalSTRS programs and services, articles on retirement and financial planning, legislative news and more.
Retired Educator is mailed to retired members and beneficiaries in the summer and winter. It provides information on benefits and services, legislation, investments and board updates.
Retirement Progress ReportEvery year Defined Benefit members and Cash Balance Benefit participants receive a personalized Retirement
Progress Report that contains retirement planning information and detailed account information as of June 30 of that school year. For Defined Benefit members age 45 and older, the report also includes retirement benefit estimates. The reports are available online in September in the member’s myCalSTRS account and are mailed in October if requested. Retired members and other benefit recipients do not receive this report.
YEAR IN REVIEW

20 CALSTRS COMPREHENSIVE ANNUAL FINANCIAL REPORT 2014
Member Informational PublicationsCalSTRS offers a number of publications to members at various stages in their careers.
The CalSTRS Member Handbook is a comprehensive resource of CalSTRS programs and benefits, including descriptions, eligibility requirements and worksheets. The handbook is updated annually.
The Your Retirement Guide booklet provides the information members need to plan, research and make retirement decisions regarding their Defined Benefit pension and Defined Benefit Supplement funds. It includes step-by-step instructions for applying for the service retirement and what to expect after submitting the retirement application.
CalSTRS Member Kits contain targeted retirement information and are mailed annually to three groups of CalSTRS members when they reach a career milestone. The three career milestones—newly vested, mid-career and near retirement—are based on the member’s age and length of service.
In addition, CalSTRS produces publications that cover specific topics, including:
• Cash Balance Benefit Program: A Retirement Plan for
Part-Time and Adjunct Educators
• Community Property Guide
• Introduction to Disability Benefits
• Your Disability Benefits Guide
• Join CalSTRS? Join CalPERS?
• Purchase Additional Service Credit
• Refund: Consider the Consequences
• Social Security, CalSTRS and You
• Survivor Benefits: Remember Your Loved Ones
• Tax Considerations for Rollovers
• Welcome to CalSTRS
CalSTRS OnlineCalSTRS has four websites: CalSTRS.com, myCalSTRS, Pension2.com and 403bCompare.com.
CalSTRS.com is the main site for members, board members, employers and other business partners. Features include online calculators to estimate retirement benefits and the cost to purchase service credit or redeposit funds; CalSTRS publications and forms; and self-scheduling for workshops and benefit counseling sessions.
myCalSTRS, CalSTRS’ self-service site for members, provides secure and convenient access to members’ personal accounts. After registering for myCalSTRS, members can view their account balances, complete and submit forms online, keep their address current, view their Retirement Progress Reports, and ask questions and receive prompt answers.
Pension2.com is the website for Pension2’s 403(b), 457(b) and Roth 403(b) plans. It also features online enrollment forms, financial planning tools, webinars and more.
At 403bCompare.com, members can compare fees charged by different mutual funds and insurance products.
Members can also stay connected to CalSTRS through its social media presence on Facebook, Twitter, Google+, LinkedIn, YouTube and Pinterest.
403bCompare Web ToolThe 403bCompare website is a bank of free objective information about 403(b) vendors and the products they offer.
With 403bCompare.com, members can easily compare tax-deferred 403(b) retirement investment products such as annuities and mutual funds. The tool features an option that allows members to compare up to three like products with a side by side comparison of fund descriptions, fees and returns.
Benefits CounselingCalSTRS has four member service centers: West Sacramento (headquarters); Glendale, opened in January 2012; Santa Clara, opened in June 2013; and Irvine, which opened in May 2014. Member service center staff offer direct counseling and assistance to active and retired members, and provide benefits counseling and workshops in the greater Sacramento, Los Angeles County, Bay Area and Irvine/Orange County regions. Offices are open Monday through Friday, 8 a.m. to 5 p.m., and Saturdays by appointment.
One of the unique aspects of the centers is the ability for members to come in by appointment or on a walk-in basis to seek assistance with general information questions, have a CalSTRS representative review forms, or to drop off forms that need to be transmitted to headquarters. Since
YEAR IN REVIEW

21INTRODUCTION
opening, the four centers have exceeded our expectations by assisting more than 5,000 members on a walk-in basis.
In addition to the member service centers, CalSTRS has two leased office spaces staffed by CalSTRS staff and nine benefits counseling offices located in county offices of education located across the state. These offices provide workshops, group and individual benefit counseling sessions and walk-in assistance, and many offices also accept forms.
This year, 32,504 members attended a group or individual benefit counseling session or workshop. Additionally, 11,800 members took advantage of the opportunity to walk-in and receive immediate assistance. An additional 2,285 members received services at outreach activities, including job fairs and on-campus presentations.
Another convenient service for members is the estimate service, which last year provided 936 members with an updated retirement benefit estimate without requiring a second appointment.
We continue to focus our efforts on providing services that increase accessibility for members, reflect individual member needs and increase member self-education.
Services to Employers, Member and Client OrganizationsCalSTRS staff supports the employer reporting process through education, collaboration and continuous improvement. CalSTRS has enhanced the delivery of information by making it available electronically and on demand for the employer. The Secure Employer Website, SEW, a secure solution for employers to submit their monthly reporting data, includes checks and balances to ensure the data is accurate and verified.
CalSTRS is committed to preventing pension abuse by automating the review of compensation credited to retirement benefits. The CalSTRS Compensation Review Unit has increased reviews of potential abuse cases through the Pension Abuse Reporting Hotline and online reporting form.
Professional ServicesCalSTRS contracts for the services of various independent consultants essential to the effective and professional operation of the system. Milliman, Inc. provides actuarial services and the independent auditor is Crowe Horwath LLP. Lists of investment professionals for investment services and other consultants are provided on Schedules VII and VIII in the Financial section of the report. Table 8 in the Investments section also lists entities to whom CalSTRS paid global equity broker commissions during the fiscal year.
YEAR IN REVIEW

22 CALSTRS COMPREHENSIVE ANNUAL FINANCIAL REPORT 2014

25 Independent Auditor’s Report
28 Management’s Discussion and Analysis—Unaudited
42 Requests for Information
Basic Financial Statements43 Statement of Fiduciary Net Position
44 Statement of Changes in Fiduciary Net Position
45 Notes to the Basic Financial Statements
Required Supplementary Information—Unaudited77 Schedule of Changes in Net Pension Liability of Employers and Nonemployer Contributing Entity
78 Schedule of Net Pension Liability of Employers and Nonemployer Contributing Entity
79 Schedule of Contributions from Employers and Nonemployer Contributing Entity
81 Schedule of Money-Weighted Investment Returns
82 Schedule of Funding Progress (Medicare Premium Payment Program only)
Other Supplemental Information84 Schedule of Administrative Expenses
85 Schedule of Investment Expenses
89 Schedule of Consultant and Professional Services Expenses
Other Pension Information—State Teachers’ Retirement Plan93 Independent Auditor’s Report
95 Schedule of Proportionate Share of Contributions for Employers and Nonemployer Contributing Entity
124 Schedule of Aggregate Pension Amounts for Employers and Nonemployer Contributing Entity (as restated)
125 Notes to Other Pension Information (as restated)
FINANCIAL
CalSTRS is the largest educator-only pension fund in the world, with a $190.5 billion in net position as of June 30, 2014.

24 CALSTRS COMPREHENSIVE ANNUAL FINANCIAL REPORT 2014
Crowe Horwath LLPIndependent Member Crowe Horwath International
FINANCIAL 25
INDEPENDENT AUDITOR'S REPORT
Teachers’ Retirement Board of the California State Teachers’ Retirement System Sacramento, California
Report on the Financial Statements
We have audited the accompanying financial statements of California State Teachers’ Retirement System (the System), a component unit of the State of California, as of and for the year ended June 30, 2014, and the related notes to the financial statements, which collectively comprise the System’s basic financial statements as listed in the table of contents.
Management’s Responsibility for the Financial Statements
Management is responsible for the preparation and fair presentation of these financial statements in accordance with accounting principles generally accepted in the United States of America; this includes the design, implementation, and maintenance of internal control relevant to the preparation and fair presentation of financial statements that are free from material misstatement, whether due to fraud or error.
Auditor’s Responsibility
Our responsibility is to express an opinion on these financial statements based on our audit. We conducted our audit in accordance with auditing standards generally accepted in the United States of America and the standards applicable to financial audits contained in Government Auditing Standards,issued by the Comptroller General of the United States. Those standards require that we plan and perform the audit to obtain reasonable assurance about whether the financial statements are free from material misstatement.
An audit involves performing procedures to obtain audit evidence about the amounts and disclosures in the financial statements. The procedures selected depend on the auditor’s judgment, including the assessment of the risks of material misstatement of the financial statements, whether due to fraud or error. In making those risk assessments, the auditor considers internal control relevant to the System’s preparation and fair presentation of the financial statements in order to design audit procedures that are appropriate in the circumstances, but not for the purpose of expressing an opinion on the effectiveness of the System’s internal control. Accordingly, we express no such opinion. An audit also includes evaluating the appropriateness of accounting policies used and the reasonableness of significant accounting estimates made by management, as well as evaluating the overall presentation of the financial statements.
We believe that the audit evidence we have obtained is sufficient and appropriate to provide a basis for our audit opinion.

25FINANCIAL
INDEPENDENT AUDITOR’S REPORT
Crowe Horwath LLPIndependent Member Crowe Horwath International
FINANCIAL 25
INDEPENDENT AUDITOR'S REPORT
Teachers’ Retirement Board of the California State Teachers’ Retirement System Sacramento, California
Report on the Financial Statements
We have audited the accompanying financial statements of California State Teachers’ Retirement System (the System), a component unit of the State of California, as of and for the year ended June 30, 2014, and the related notes to the financial statements, which collectively comprise the System’s basic financial statements as listed in the table of contents.
Management’s Responsibility for the Financial Statements
Management is responsible for the preparation and fair presentation of these financial statements in accordance with accounting principles generally accepted in the United States of America; this includes the design, implementation, and maintenance of internal control relevant to the preparation and fair presentation of financial statements that are free from material misstatement, whether due to fraud or error.
Auditor’s Responsibility
Our responsibility is to express an opinion on these financial statements based on our audit. We conducted our audit in accordance with auditing standards generally accepted in the United States of America and the standards applicable to financial audits contained in Government Auditing Standards,issued by the Comptroller General of the United States. Those standards require that we plan and perform the audit to obtain reasonable assurance about whether the financial statements are free from material misstatement.
An audit involves performing procedures to obtain audit evidence about the amounts and disclosures in the financial statements. The procedures selected depend on the auditor’s judgment, including the assessment of the risks of material misstatement of the financial statements, whether due to fraud or error. In making those risk assessments, the auditor considers internal control relevant to the System’s preparation and fair presentation of the financial statements in order to design audit procedures that are appropriate in the circumstances, but not for the purpose of expressing an opinion on the effectiveness of the System’s internal control. Accordingly, we express no such opinion. An audit also includes evaluating the appropriateness of accounting policies used and the reasonableness of significant accounting estimates made by management, as well as evaluating the overall presentation of the financial statements.
We believe that the audit evidence we have obtained is sufficient and appropriate to provide a basis for our audit opinion.

26 CALSTRS COMPREHENSIVE ANNUAL FINANCIAL REPORT 2014
INDEPENDENT AUDITOR’S REPORT
26 CALSTRS COMPREHENSIVE ANNUAL FINANCIAL REPORT 2014
Opinion
In our opinion, the financial statements referred to above present fairly, in all material respects, the fiduciary net position of California State Teachers’ Retirement System as of June 30, 2014, and the changes in fiduciary net position for the year then ended in accordance with accounting principles generally accepted in the United States of America.
Emphasis of Matters
Net Pension Liability of Employers and Nonemployer Contributing Entity
As described in Note 3, based on the most recent actuarial valuation as of June 30, 2013, the System’s independent actuaries determined that, at June 30, 2014, the value of the State Teachers Retirement Plan (STRP) total pension liability exceeded the STRP fiduciary net position by $58.4 billion. Our opinion is not modified with respect to this matter.
Fair Value of Investments
As described in Note 5, the financial statements include investment securities valued at approximately $53.3 billion as of June 30, 2014, for which fair value has been estimated by general partners and investment advisors, and reviewed and approved by the System’s management, in the absence of readily ascertainable market values. Because of the inherent uncertainty of valuation, the estimate of values may differ from the values that would have been used had a ready market existed for the investment securities, and the differences could be material. Our opinion is not modified with respect to this matter.
Other Matters
Report on Summarized Comparative Information
We have previously audited the System’s 2013 financial statements, and we expressed an unmodified audit opinion on those audited financial statements in our report dated October 15, 2013. In our opinion, the summarized comparative information presented herein as of and for the year ended June 30, 2013 is consistent, in all material respects, with the audited financial statements from which it has been derived.
Required Supplementary Information
Accounting principles generally accepted in the United States of America require that Management’s Discussion and Analysis on pages 28-42 and the Schedule of Changes in Net Pension Liability of Employers and Nonemployer Contributing Entity, Schedule of Net Pension Liability of Employers and Nonemployer Contributing Entity, Schedule of Contributions from Employers and Nonemployer Contributing Entity, Schedule of Money-Weighted Investment Returns and Schedule of Funding Progress (Medicare Premium Payment Program only) on pages 77-82 be presented to supplement the basic financial statements. Such information, although not a part of the basic financial statements, is required by the Governmental Accounting Standards Board who considers it to be an essential part of financial reporting for placing the basic financial statements in an appropriate operational, economic, or historical context. We have applied certain limited procedures to the required supplementary information in accordance with auditing standards generally accepted in the United States of America, which consisted of inquiries of management about the methods of preparing the information and comparing the information for consistency with management’s responses to our inquiries, the basic financial statements, and other knowledge we obtained during our audit of the basic financial statements. We do not express an opinion or provide any assurance on the information because the limited procedures do not provide us with sufficient evidence to express an opinion or provide any assurance.

27FINANCIAL
INDEPENDENT AUDITOR’S REPORT
FINANCIAL 27
Supplementary Information
Our audit was conducted for the purpose of forming an opinion on the financial statements that collectively comprise the System’s basic financial statements. The Introduction section, Schedule of Administrative Expenses, Schedule of Investment Expenses, Schedule of Consultant and Professional Services Expenses, Investments section, Actuarial section, and Statistical section are presented for purposes of additional analysis and are not a required part of the basic financial statements.
The Schedule of Administrative Expenses, Schedule of Investment Expenses and Schedule of Consultant and Professional Services Expenses are the responsibility of management and were derived from and relate directly to the underlying accounting and other records used to prepare the basic financial statements. Such information has been subjected to the auditing procedures applied in the audit of the basic financial statements and certain additional procedures, including comparing and reconciling such information directly to the underlying accounting and other records used to prepare the basic financial statements or to the basic financial statements themselves, and other additional procedures in accordance with auditing standards generally accepted in the United States of America. In our opinion, the Schedule of Administrative Expenses, Schedule of Investment Expenses and Schedule of Consultant and Professional Services Expenses are fairly stated, in all material respects, in relation to the basic financial statements as a whole.
The Introduction section, Investments section, Actuarial section and Statistical section have not been subjected to the auditing procedures applied in the audit of the basic financial statements and, accordingly, we do not express an opinion or provide any assurance on them.
Other Reporting Required by Government Auditing Standards
In accordance with Government Auditing Standards, we have also issued our report dated October 1, 2014 on our consideration of California State Teachers’ Retirement System’s internal control over financial reporting and on our tests of its compliance with certain provisions of laws, regulations, contracts, and other matters. The purpose of that report is to describe the scope of our testing of internal control over financial reporting and compliance and the results of that testing, and not to provide an opinion on internal control over financial reporting or on compliance. That report is an integral part of an audit performed in accordance with Government Auditing Standards in considering California State Teachers’ Retirement System’s internal control over financial reporting and compliance.
Crowe Horwath LLP
October 1, 2014 Sacramento, California

28 CALSTRS COMPREHENSIVE ANNUAL FINANCIAL REPORT 2014
California State Teachers' Retirement SystemManagement’s Discussion and Analysis (Unaudited) June 30, 2014
4
MANAGEMENT’S DISCUSSION AND ANALYSIS
Management’s Discussion and Analysis of the California State Teachers’ Retirement System’s (CalSTRS) financial performance provides an overview of financial activities for the fiscal year ended June 30, 2014. This discussion and analysis focuses on the year’s activities, resulting changes, and currently known facts. This discussion is more meaningful when read in conjunction with CalSTRS financial statements and accompanying notes to the financial statements.
In addition to historical information, this discussion and analysis includes some forward-looking statements that involve uncertainties and risks. CalSTRS actual results, performance and achievements expressed or implied in these statements are subject to changes in interest rates, securities markets, general economic conditions, legislation, regulations, and other factors.
In October 2013, the Teachers’ Retirement Board (board) reviewed and reevaluated its five-year strategic plan. In this first biennial review, the board reassessed its plans towards ensuring the long-term viability of CalSTRS benefit programs, managing risks to the organization, enhancing services to members, and continuing workforce and process improvements as primary focus areas. Besides recognizing additional impacts of a volatile economy and an environment of increased regulations, the viability of the Defined Benefit Program of the State Teachers’ Retirement Plan (DB Program) remained a top priority for the board.
Under California law, the DB Program receives contributions from members and employers set as a percentage of members’ earnings, in addition to contributions from the state’s General Fund and other sources. CalSTRS investment earnings finance the cost of administering the plan and offset the amount of contributions required to fund benefits. Unlike most other pension plans in California, the board does not have broad authority to raise contribution rates1. Because contribution rates are set in statute, the authority to adjust them rests with the Legislature and the Governor.
Since 1984-85, investment returns have financed approximately 62 percent of the retirement benefit. CalSTRS uses a time-weighted return methodology to calculate returns for portfolio performance purposes. CalSTRS earned an approximate 18.7 percent one-year return on a time-weighted return basis in fiscal year 2013-14. New Governmental Accounting Standards Board (GASB) pension accounting standards require disclosing the one-year money-weighted return, which was approximately 18.6 percent. Differences between the time-weighted and money-weighted returns are discussed further in the Investments section below.
Throughout fiscal year 2013-14, CalSTRS maintained its Standard and Poor’s issuer credit rating of AA- and short-term rating of A-1+ with a stable outlook. In July 2014, Moody’s Investors Service upgraded the issuer rating of CalSTRS from Aa3 to Aa2 and affirmed the short-term issuer rating at P-1, reflecting the State of California’s improved credit profile and the enactment of Assembly Bill (AB) 1469 which contains a funding plan to address CalSTRS unfunded liability, described below.
At June 30, 2014, the net pension liability for the State Teachers’ Retirement Plan is $58.4 billion. The June 30, 2013 funding valuation shows a $73.7 billion unfunded actuarial obligation for the DB program. The difference between these two amounts is explained in detail in the Actuarial Valuation section below.
On June 24, 2014, Governor Brown signed AB 1469 into law, which was enacted as part of the 2014-15 budget. AB 1469 addresses the CalSTRS DB Program unfunded liability and incorporates a detailed funding plan, recognizing the need to ensure the viability of the program. The legislation emphasizes the necessity for shared responsibility among the state, school districts and members to eliminate the
1 The board has limited authority to adjust contribution rates for employers and the state from 2021-22 through 2045-2046 and 2017-2018 through 2045-2046, respectively. See Note 1 for more information.
MANAGEMENT’S DISCUSSION AND ANALYSIS

29FINANCIAL
California State Teachers' Retirement SystemManagement’s Discussion and Analysis (Unaudited) June 30, 2014
5
unfunded liability by 2046. Specifically, the following contribution increases will apply to compensation that is creditable to the DB Program effective July 1, 2014:
Member contributions for those under the 2% at 60 benefit structure will increase from 8 percent to a total of 10.25 percent of pay, phased in over the next three years. For members under the 2% at 62 benefit structure, the rate will increase from 8 percent to a projected 9.205 percent, phased in over the next three years.
Employer contributions will increase from 8.25 percent to a total of 19.1 percent of payroll, phased in over the next seven years.
The state’s total contribution to the DB Program as a nonemployer contributing entity will increase incrementally from 3.041 percent in fiscal year 2013–14 to a total of 6.328 percent of payroll in fiscal year 2016–17. Additionally, the state will continue to pay 2.5 percent of payroll annually to fund the Purchasing Power Protection Program.
In June 2012, the Governmental Accounting Standards Board (GASB) released two new statements amending existing pension accounting standards for plans and employers— GASB 67 and GASB 68. Both of these statements represent significant changes for the affected entities and the changes related to GASB 67 are reflected in this year’s notes, schedules, and required supplemental information. In addition, CalSTRS has provided other pension information to assist employers in implementing GASB 68.
The new standards change the emphasis of financial reporting for pensions by moving from an approach that focuses on the process by which employers finance their future projected cash outflows for pension benefits, to one that stresses the obligation an employer incurs through the employment-exchange process. In short, a pension liability, which was previously only disclosed in the notes to CalSTRS financial statements, will also be reported as a liability in the employers’ financial statements.
GASB 67 focuses on plan financial reporting and changes CalSTRS financial statements by requiring additional note disclosures, actuarial calculations, and schedules. It also requires a different methodology to measure the liability for plan benefits. CalSTRS is now required to report a new pension obligation called the net pension liability (NPL) instead of the previously required unfunded actuarial accrued liability (UAAL). The difference between the NPL and the UAAL is discussed further in the Actuarial Valuation section below.
GASB 68 focuses on financial reporting of pensions by employers and is effective for periods beginning after June 15, 2014. GASB 68 requires employers and nonemployer contributing entities to report any NPL as a liability in their Statement of Net Position. GASB 68 will have an impact on CalSTRS financial statements as CalSTRS must reflect its proportionate share of any NPL under the state’s defined benefit plan. See the paragraphs on GASB Statements No. 67 and 68 in Note 8 (New Accounting Pronouncements) for additional information on the new GASB standards.
CalSTRS is actively engaged with GASB on implementation issues surrounding the new standards and has continued informational outreach efforts with employers through various venues that include on-site meetings and webinars. New schedules were developed to: 1) identify the portion of annual contributions attributable to each CalSTRS employer and the nonemployer contributing entity (see Schedule IX), 2) provide the total NPL and changes in the NPL year over year (see Schedule I), and 3) provide aggregated pension expense information for employers and CalSTRS’ nonemployer contributing entity, the State of California (see Schedule X). In addition to the audit opinion on the basic financial statements, the external auditor has provided a separate opinion on other pension information provided to assist employers in implementing GASB 68 (see Independent Auditor’s report). The other pension information includes the Schedule of Proportionate Share of Contributions for Employers and
MANAGEMENT’S DISCUSSION AND ANALYSIS

30 CALSTRS COMPREHENSIVE ANNUAL FINANCIAL REPORT 2014
California State Teachers' Retirement SystemManagement’s Discussion and Analysis (Unaudited) June 30, 2014
6
Nonemployer Contributing Entity (Schedule IX), the Schedule of Aggregate Pension Amounts for Employers and Nonemployer Contributing Entity (Schedule X), and the notes to those schedules.
GASB releases exposure drafts for public comment on proposed new accounting standards before it issues a formal pronouncement to implement new standards. CalSTRS assesses the impact of these exposure drafts to its plans and provides input when appropriate. In May 2014, GASB released an exposure draft, Fair Value Measurement and Application, to address how fair value should be measured and applied. Under the proposal, investments would generally be required to be measured at fair value and reporting entities would have to expand the related scope of disclosures currently being made. The requirements of the proposal are expected to be effective for financial statements for periods beginning after June 2015. CalSTRS provided its comments on the exposure draft in August 2014.
In June 2014, GASB released two additional exposure drafts. Financial Reporting for Postemployment Benefit Plans Other Than Pension Plans addresses financial reporting by OPEB plans and Accounting and Financial Reporting for Postemployment Benefits Other Than Pensions focuses on employer OPEB reporting requirements.
CalSTRS continues to make progress in its long-term, multi-year BusinessRenew Program which is undertaking the transformation of business processes and systems to enable CalSTRS to meet the objectives outlined in its strategic plans. BusinessRenew is a collection of work efforts to provide integrated business processes and systems across CalSTRS. BusinessRenew work efforts will be implemented over several years in a phased approach. One of the objectives of the project is to enhance CalSTRS internal controls through ongoing technology initiatives.
CalSTRS is currently focusing its efforts on the Pension Solution Project, a major BusinessRenew Program work effort which includes the replacement of CalSTRS legacy pension administration system. The Governor and Legislature enacted a budget bill that appropriates $61.6 million in fiscal year 2014-15 for the Pension Solution Project and an additional $151.4 million over the next six years. The new system will be designed to strengthen pension system internal controls, expand system functionality, enhance member and employer self-service, and maximize CalSTRS investment in the maintenance and support of its core business system. In November 2013, CalSTRS began efforts to secure a vendor to provide hardware, software, and implementation services for the new system. The project is now in the proposal evaluation phase. A pension system vendor is expected to be selected by the end of fiscal year 2014-15.
In order to manage the risks associated with a large, multi-year, complex, and costly pension system replacement, thorough planning is critical. In another BusinessRenew Program effort, the Data Preparation Project team is focused on the analysis of existing CalSTRS member and other entity data. The results of this effort will enable CalSTRS to make decisions on the resolution of data issues prior to data conversion to the new pension administration system.
FINANCIAL HIGHLIGHTS
Total net position for the State Teachers’ Retirement Plan (STRP) increased by $24.1 billion or 14.5 percent to $190.5 billion as a result of investment performance above the expected rate of return.
Total member contributions for the STRP decreased by $73.1 million or 3.1 percent to $2.3 billion, mainly due to the decrease in the purchase of nonqualified service credit which was eliminated after December 31, 2012, under the California Public Employees’ Pension Reform Act of 2013 (PEPRA).
MANAGEMENT’S DISCUSSION AND ANALYSIS

31FINANCIAL
California State Teachers' Retirement SystemManagement’s Discussion and Analysis (Unaudited) June 30, 2014
7
Total state contributions for the STRP increased by $55.2 million or 4.2 percent to $1.4 billion as a result of additional contribution requirements due to the unfunded obligation of the defined benefit program based on benefits in effect as of July 1, 1990.
Net investment income for the STRP increased by $9.7 billion or 47.0 percent to $30.4 billion due to strong investment returns.
Benefit payments for the STRP increased by $572.8 million or 5.0 percent to $11.9 billion, reflecting an increase in the number of retirees and beneficiaries and the postretirement annual benefit adjustment.
At June 30, 2014, the STRP fiduciary net position as a percentage of the total pension liability was approximately 77 percent compared to 70 percent as of June 30, 2013. See Note 3 and Schedule II for additional information. The primary reason for the increase in plan net position is positive investment performance.
OVERVIEW OF FINANCIAL STATEMENTS
Management’s Discussion and Analysis is also an introduction to CalSTRS basic financial statements. CalSTRS financial statements include the following components:
1. The Statement of Fiduciary Net Position 2. The Statement of Changes in Fiduciary Net Position 3. Notes to the Basic Financial Statements 4. Required Supplementary Information - Unaudited 5. Other Supplemental Information
6. Other Pension Information- State Teachers’ Retirement Plan
The Statement of Fiduciary Net Position. The Statement of Fiduciary Net Position presents information on all of CalSTRS assets and liabilities, with the difference between the two reported as net position. Over time, the increase or decrease in net position serves as an indicator of CalSTRS financial condition and its ability to fund future benefit payments.
The Statement of Changes in Fiduciary Net Position. The Statement of Changes in Fiduciary Net Position shows how CalSTRS net position changed during the fiscal year, reflecting contributions earned, benefit payments made, investment returns, and the costs of plan administration.
Notes to the Basic Financial Statements. The Notes to the Basic Financial Statements provide information essential to a full understanding of fiduciary fund financial statements. The type of information provided in each of the notes to the financial statements is as follows:
Note 1 provides a general description of CalSTRS, as well as a concise description of each of the plans and funds administered by CalSTRS.
Note 2 provides a summary of significant accounting policies, including the basis of accounting for CalSTRS, management’s use of estimates, cash and investment accounting policies, and other significant accounting policies.
Note 3 provides a summary of the net pension liability of employers and the nonemployer contributing entity in accordance with GASB 67, Financial Reporting for Pension Plans.
Note 4 provides a summary of CalSTRS funded status for the Medicare Premium Payment Program in accordance with GASB Statement No. 43, Financial Reporting for Postemployment Benefit Plans Other Than Pension Plans.
MANAGEMENT’S DISCUSSION AND ANALYSIS

32 CALSTRS COMPREHENSIVE ANNUAL FINANCIAL REPORT 2014
California State Teachers' Retirement SystemManagement’s Discussion and Analysis (Unaudited) June 30, 2014
8
Note 5 provides information related to deposits and investments including disclosures required by GASB Statement No. 28, Accounting and Financial Reporting for Securities Lending Transactions, GASB Statement No. 38, Certain Financial Statement Note Disclosures, GASB Statement No. 40, Deposit and Investment Risk Disclosures, GASB Statement No. 53, Accounting and Financial Reporting for Derivative Instruments and GASB Statement No. 67, Financial Reporting for Pension Plans. This note discloses information about CalSTRS investment performance and risks related to credit (including custodial credit and concentrations of credit risk), interest rate, and foreign currency. In an effort to provide increased visibility to investment holdings, Note 5 also includes a Schedule of Investments that discloses the types of investments within each broad investment category.
Note 6 generally describes potential contingencies of CalSTRS.
Note 7 provides a summary of CalSTRS significant commitments.
Note 8 provides a summary of new accounting and financial reporting pronouncements.
Required Supplementary Information. The Required Supplementary Information consists of five schedules and related notes on the State Teachers’ Retirement Plan’s net pension liability and the other postemployment benefit plan’s funding progress. It also provides a history of contributions from employers and the nonemployer contributing entity. These schedules provide historical information and actuarial assumptions and methods that assist in understanding the net pension liability of the STRP and the funded status of the Medicare Premium Payment Program. The information available in the Required Supplementary Information section includes:
Schedule I– Schedule of Changes in Net Pension Liability of Employers and Nonemployer Contributing Entity
Schedule II– Schedule of Net Pension Liability of Employers and Nonemployer Contributing Entity
Schedule III– Schedule of Contributions from Employers and Nonemployer Contributing Entity
Schedule IV– Schedule of Money-Weighted Investment Returns
Schedule V – Schedule of Funding Progress (Medicare Premium Payment Program only)
Other Supplemental Information. Other Supplemental Information includes details on administrative expenses, investment expenses, and consultant and professional services expenses. The schedules available in the Other Supplemental Information section include:
Schedule VI – Schedule of Administrative Expenses
Schedule VII – Schedule of Investment Expenses
Schedule VIII – Schedule of Consultant and Professional Services Expenses
Other Pension Information- State Teachers’ Retirement Plan. Other Pension Information includes information on the proportionate share of contributions and aggregate pension amounts for employers and the nonemployer contributing entity. The information available in the Other Pension Information section includes:
Schedule IX – Schedule of Proportionate Share of Contributions for Employers and Nonemployer Contributing Entity
Schedule X – Schedule of Aggregate Pension Amounts for Employers and Nonemployer Contributing Entity
MANAGEMENT’S DISCUSSION AND ANALYSIS

33FINANCIAL
California State Teachers' Retirement SystemManagement’s Discussion and Analysis (Unaudited) June 30, 2014
9
Notes to Other Pension Information
FINANCIAL ANALYSIS
State Teachers’ Retirement Plan (STRP) The table that follows presents comparative information and changes to plan net position for fiscal years 2013-14 and 2012-13.
STRP net position increased by $24.1 billion or 14.5 percent to $190.5 billion and investments, excluding securities lending collateral, increased by $24.7 billion or 14.8 percent to $191.9 billion. This increase is primarily attributable to strong investment returns across all major investment types, especially equity securities.
Cash decreased by $57.6 million or 16.7 percent in fiscal year 2013-14 compared to the prior fiscal year. The balance fluctuation is based on the timing of when transactions were settled and cash was received and invested at year end.
Investment Receivables decreased by 26.5 percent from $3.6 billion to $2.6 billion as of June 30, 2014. Investment Payables also decreased by 17.6 percent from $3.5 billion to $2.9 billion as of June 30, 2014. These balances can fluctuate based on the open trades and dates of settlement.
Benefits in the process of payment increased $76.3 million or 7.3 percent. This balance can change significantly depending on when benefit payments are processed at the end of the fiscal year.
Securities lending cash collateral and obligations decreased during the fiscal year by $912.7 million and $935.2 million to $22,303 million and $22,311 million, respectively. The Securities Lending Program is designed to use its existing asset base and investment expertise to generate a steady source of risk-controlled incremental income. Net income generated by the Securities Lending Program for fiscal year 2013-14 was $90.5 million, compared to $100.3 million, in fiscal year 2012-13.
NET POSITION(Dollars in Thousands)
ASSETS 2014 2013 Percent ChangeInvestments 1 214,193,243$ 190,407,340$ 12.5%Cash 287,965 345,517 (16.7%) Investment Receivables 2,637,163 3,587,362 (26.5%) Member, Employer and Other Receivables 573,549 670,460 (14.5%) Capital Assets 228,362 237,901 (4.0%)
TOTAL ASSETS 217,920,282$ 195,248,580$ 11.6%
LIABILITIESBenefits in Process of Payment 1,121,034 1,044,692 7.3%Investment Payables 2,908,250 3,527,392 (17.6%) Loan Payables 944,269 937,494 0.7%Other 161,415 143,640 12.4%Securities Lending Obligation 22,311,298 23,246,453 (4.0%)
TOTAL LIABILITIES 27,446,266$ 28,899,671$ (5.0%)
NET POSITION 190,474,016$ 166,348,909$ 14.5%1 Includes securities lending collateral of $22.3 billion.
MANAGEMENT’S DISCUSSION AND ANALYSIS

34 CALSTRS COMPREHENSIVE ANNUAL FINANCIAL REPORT 2014
California State Teachers' Retirement SystemManagement’s Discussion and Analysis (Unaudited) June 30, 2014
10
Additions to Plan Net Position STRP benefits are funded from employer, member and state contributions, and investment earnings. State, employer and member contribution rates are established by state law. As per statute, CalSTRS received 1.024 percent more in state contributions as a percentage of creditable earnings for most of fiscal year 2013-14 due to the unfunded liability status of the DB Program based on benefits in place as of July 1, 1990.
STRP net investment income increased 47.0 percent to $30.4 billion in fiscal year 2013-14 as compared to net income of $20.7 billion in fiscal year 2012-13. This increase is primarily attributable to strong investment performance, which is discussed further in the ‘Performance vs. Benchmarks’ section.
Deductions from Plan Net Position Benefit payments totaled $11.9 billion in fiscal year 2013-14. The $572.8 million or 5.0 percent increase over the prior year is primarily the result of an increase in retirees receiving benefit payments and an annual cost of living adjustment. The average monthly benefit paid is $3,609 for fiscal year 2012-13 (the most recent available), which is a 2.6 percent increase from the $3,517 average monthly benefit calculated for fiscal year 2011-12. This benefit payment is typically the single retirement benefit CalSTRS members receive as they do not participate in Social Security.
Refunds of contributions increased by 2.5 percent from $105.0 million to $107.6 million for fiscal year 2013-14. Refund requests and amounts fluctuate year to year due to changing demographic trends (i.e., mortality rates) and economic conditions (i.e., employment rates).
Administrative expenses increased by 12.4 percent from $137.2 million to $154.2 million. This increase is primarily attributable to an increase in the number of staff supporting IT infrastructure and for increased oversight and verification of reporting employers’ compliance with the Teachers Retirement Law.
CHANGES IN NET POSITION(Dollars in Thousands)
ADDITIONS 2014 2013 Percent ChangeMember 2,263,613$ 2,336,731$ (3.1%) Employer 2,272,166 2,283,263 (0.5%) State 1,383,468 1,328,298 4.2%Net Investment Income 30,401,903 20,682,156 47.0%Other 2,055 1,744 17.8%
TOTAL ADDITIONS 36,323,205$ 26,632,192$ 36.4%
DEDUCTIONSBenefit Payments 11,927,556 11,354,733 5.0%Refunds of Contributions 107,600 104,994 2.5%Administrative Expenses 154,155 137,165 12.4%Other 8,787 4,448 97.5%
TOTAL DEDUCTIONS 12,198,098$ 11,601,340$ 5.1%
NET POSITION INCREASE 24,125,107 15,030,852 60.5%BEGINNING NET POSITION 166,348,909 151,318,057 9.9%
ENDING NET POSITION 190,474,016$ 166,348,909$ 14.5%
MANAGEMENT’S DISCUSSION AND ANALYSIS

35FINANCIAL
California State Teachers' Retirement SystemManagement’s Discussion and Analysis (Unaudited) June 30, 2014
11
Other expenses increased by 97.5 percent from $4.4 million to $8.8 million mainly due to a change in the methodology used in calculating our reserves for doubtful accounts.
CalSTRS Pension2 Program CalSTRS Pension2 (Pension2) offers Internal Revenue Code (IRC) section 403(b) and 457 tax-deferred defined contribution plans. Administration and trustee services over Pension2 are provided through a third party company. TIAA-CREF is currently contracted to provide these services. In April 2014, the board approved the selection of Voya Financial to take over the administration of Pension2. Under the new eight-year contract, Voya Financial will be providing administrative services for the Pension2 Program starting in November 2014. Certain assets and liabilities will remain with TIAA-CREF until the expiration of the contract in September 2015. Hence, for a period of time, Pension2 will have two administrators. Net position for Pension2 increased by $111.7 million or 25.6 percent as combined contributions and net investment income of $137.9 million exceeded distributions and administrative expenses of $26.3 million. Contributions increased by 16.3 percent from fiscal year 2012-13 due to an increase in plan participants and net investment income increased $23.7 million or 53.6 percent as a result of strong investment returns.
Teachers’ Health Benefits Fund The Teachers’ Health Benefits Fund (THBF) is a trust fund created to administer health benefit programs established by statute. The Medicare Premium Payment Program (MPP Program), the only program within the fund, pays Medicare Part A premiums and surcharges and Part B surcharges for retired members of the DB Program who meet certain eligibility criteria.
Current contributions decreased by $1.6 million to $33.4 million during fiscal year 2013-14. The THBF paid benefits of $32.6 million in the current fiscal year, a 6.0 percent decrease from the $34.7 million in benefits paid in the prior year. Since the evaluated amount needed to fund the MPP Program in its entirety has not been transferred to the THBF, the funded ratio from a financial reporting perspective is 0.1 percent as of June 30, 2012. See Note 4 (Funded Status).
Teachers’ Deferred Compensation Fund The Teachers’ Deferred Compensation Fund (TDCF) is a trust fund established to account for ancillary activities associated with various deferred compensation plans and programs offered by CalSTRS. The TDCF received fee revenues and interest of $1.2 million, an increase of $0.7 million or 120.0 percent from the prior year. The increase is primarily due to additional member participation in the deferred compensation plans.
PENSION VALUATION
As a result of GASB 67 and 68, CalSTRS has separate valuations performed for financial reporting and funding purposes.
Pension System Funding Valuations The purpose of the actuarial valuations for funding the programs within the STRP is to guide decisions necessary to sustain the long-term viability of the programs. Specifically, the primary purpose is to analyze the sufficiency of future contributions from members, employers and the state to meet current and future obligations. Separate funding valuations are performed for the Defined Benefit (DB), Defined Benefit Supplementary (DBS), and Cash Balance Benefit (CBB) Programs.
Historically, CalSTRS investment income has contributed over 60 percent of the total inflows to the STRP. Currently the investment rate of return and discount rate assumption for funding actuarial valuations is 7.5 percent. The investment return assumption, according to actuarial principles, should be based on an estimated long-term investment yield for the STRP, with consideration given to the nature and mix of current and expected plan investments, and is the basis for determining the actuarial value of assets. The investment return assumptions are developed by CalSTRS investment and
MANAGEMENT’S DISCUSSION AND ANALYSIS

36 CALSTRS COMPREHENSIVE ANNUAL FINANCIAL REPORT 2014
California State Teachers' Retirement SystemManagement’s Discussion and Analysis (Unaudited) June 30, 2014
12
actuarial consultants and are adopted by the board. The following chart is a 10-year historical comparison of investment income (including unrealized gains and losses), employer contributions and benefit payments.
The graph shows there is a growing gap between contributions and benefit payments. As mentioned previously, AB 1469 addresses the DB Program unfunded liability and incorporates a detailed funding plan.
The actuarial assumptions and methods used in the June 30, 2013, valuation were based on the 2010 Actuarial Experience Analysis adopted by the board in February 2012. The most recent actuarial valuation indicates that the DB Program is underfunded, with 66.9 percent of the funds needed to pay the actuarial cost of the benefits accrued as of June 30, 2013. This is a decrease of 0.1 percent from the 67 percent estimated funded ratio as of June 30, 2012. The valuation also indicates that as of June 30, 2013, the CBB Program had a funded ratio of 110.54 percent. This is an increase of 10.52 percent from the June 30, 2012 valuation. Additionally, the valuation indicates that as of June 30, 2013, the DBS Program had a funded ratio of 109.61 percent, an increase of 8.98 percent from the June 30, 2012 valuation.
Interest is credited to the nominal DBS and CBB Program accounts at the minimum guaranteed annual rate established by the board prior to each plan year, which was 3.00% for the fiscal year ended June 30, 2014. The board may credit additional earnings to members’ nominal accounts if actual investment earnings exceed the minimum guaranteed annual rate and meet criteria set out by the board. In April 2014, the board granted additional earnings and annuity credits for the DBS and CBB programs. The dollar value of the credits totaled $295.8 million and $5.6 million for DBS and CBB, respectively, which would reduce the funded ratios cited above. Refer to Note 1 for additional information.
Financial Reporting Valuation The actuarial valuation for financial reporting emphasizes the obligation an employer incurs to employees through the employment-exchange process. The primary purpose of the valuation for financial reporting is to provide a consistent, standardized methodology that allows comparability of data and increased transparency of the pension liability across plans. To do so, GASB requires a
MANAGEMENT’S DISCUSSION AND ANALYSIS
$(50,000,000)
$(40,000,000)
$(30,000,000)
$(20,000,000)
$(10,000,000)
$-
$10,000,000
$20,000,000
$30,000,000
$40,000,000
2004 2005 2006 2007 2008 2009 2010 2011 2012 2013 2014
Dol
lars
in T
hous
ands
STRP Investment Income, Contributions and Benefit Payments (Years ended June 30)
Investment Income Benefit Payments Contributions

37FINANCIAL
California State Teachers' Retirement SystemManagement’s Discussion and Analysis (Unaudited) June 30, 2014
13
different approach for determining the reported NPL, as compared to the previously disclosed unfunded actuarial accrued liability (UAAL). Under the new standards, the funded status is no longer presented in the notes or required supplementary information, reflecting GASB’s conceptual shift in the measurement of the liability.
The UAAL mirrored the unfunded actuarial obligation calculated by CalSTRS external actuary for funding purposes and represented the excess of the actuarial accrued liability (AAL) over the actuarial value of assets (AVA). Under GASB 67, the UAAL has been replaced by the NPL, which represents the excess of the total pension liability (TPL) over fiduciary net position. A side-by-side comparison of the two calculations is as follows:
Current Year Prior Year Total Pension Liability (TPL) Actuarial Accrued Liability (AAL) Less: Fiduciary Net Position Less: Actuarial Value of Assets (AVA) Net Pension Liability (NPL) Unfunded Actuarial Accrued Liability (UAAL)
There are considerable differences between the two numbers. Conceptually, the UAAL is the actuary’s measure of the additional amount of assets needed to pay all benefits earned to date by current plan members, while the new NPL is an accrual calculation that reflects future benefits earned by plan members through the employment-exchange process in excess of the plan’s fiduciary net position. The difference between the UAAL and NPL is reflected in the different methodologies used to calculate the TPL and AAL.
GASB’s new measures implement a ‘blended’ discount rate that considers a long-term rate of return on plan assets and a high-quality, non-taxable municipal bond index rate, which reflects a pension fund’s long-term investment strategy, as well as the potential need to borrow funds to pay pension benefits after net position has been fully depleted. In April 2014, the board approved the use of the Bond Buyer’s 20-year index rate to calculate the blended discount rate. At this same meeting, the board also approved the use of the same actuarial methods and assumptions for the STRP financial reporting valuation as those used in the DB actuarial funding valuation.
With the provision of additional member, employer, and general fund contributions effective July 1, 2014, CalSTRS does not project a depletion of assets and therefore did not have to calculate a blended rate using the Bond Buyer’s 20-year index rate at June 30, 2014. Instead, CalSTRS discounted all future obligations for the STRP using the long-term rate of return on plan assets gross of administrative costs (currently 7.6 percent). Based on that assumption, the STRP has an NPL of $58.4 billion as of June 30, 2014.
INVESTMENTS
CalSTRS primary goal is to maintain a financially sound retirement system. CalSTRS investment philosophy is long-term patient capital— investing for long-term net cash flows and capital gain potential at a reasonable price. The fiscal year 2013-14 goals and targets for the investments were to:
1. Achieve an absolute return of 7.5 percent and/or outperform the benchmark 2. Outperform the Total Fund Policy benchmark and add additional 60 basis points of extra return
without excess risk 3. Aspire to be cost effective with tight operational internal controls 4. Maximize risk-adjusted returns to meet CalSTRS obligation to pay benefits 5. Expand internal management of public assets 6. Provide stable cash flows 7. Reinforce CalSTRS reputation as a global leader in corporate governance
MANAGEMENT’S DISCUSSION AND ANALYSIS

38 CALSTRS COMPREHENSIVE ANNUAL FINANCIAL REPORT 2014
CaliforManageJune 30
The CalSTgross of fegross of fereturn ove
The moneapproximafiscal yeainherent dtime-weiglag in the
ASSET A
The followmanagem
RepresenNon-U.S. allocationApproximpercent is
The FixedU.S. dollaapproximapercent is
rnia Stateement’s Dis0, 2014
TRS Investmees time-weigees is 11.2 peer the last 20
ey-weighted rate 18.6 percr 2013-14. Didifferences in hted return foannual perfo
ALLOCATION
wing chart proment structure
nting over 57 pDeveloped Ctargets of 67ately 63 perc
s managed by
d Income Portar based and ately 81 perces externally m
Glo
AbsolRetu0.8%
e Teacherscussion a
ent Portfolio pghted return bercent. Furtheand 25 years
return net of aent one-year fferences in tthe methodo
or CalSTRS prmance data
N
ovides the diss as of June
percent of theCountries and7 percent and ent of the Glo
y CalSTRS inv
tfolio is compnon-U.S. dollent of the poranaged using
obal Equity57.3%
InflationSensitive
0.7%
lute urn%
As
rs' Retireand Analys
posted an apbasis for fiscaermore, CalSTs, respectively
all investmentreturn. CalSThe money-welogy and inpu
portfolios diffefor private as
tribution of to30, 2014.
e total investmEmerging Ma33 percent to
obal Equity asvestment staf
rised of invesar based. Fixrtfolio using eg broader cor
CashLiquid
2.5%
sset Allocatio
ement Syssis (Unaud
14
proximate 18al year 2013-1TRS has geny.
expenses baTRS does noteighted and tiuts of the two ers from the mssets in the tim
otal fund inves
ments, the Gloarkets equity o U.S. securitssets are manff.
stment grade xed Income asnhanced coree plus and hig
Privh/dity %
on as of June
stemdited)
.7 percent on14. The three-nerated an 8.4
ased on finant have moneyme-weightedcalculations.
money-weightme-weighted
stments base
obal Equity Psecurities. Th
ties and Non-naged externa
and non-invessets are prime and high yiegh yield strate
vate Equity11.5%
e 30, 2014
ne-year return-year time-we4 percent and
cial statemeny-weighted re returns are c In addition, t
ted return dueperformance
d on portfolio
Portfolio is comhe Global Eq-U.S. securitieally, while the
estment grademarily manageeld strategiesegies.
Fixed Incom15.5%
Real Estate11.7%
n calculated oeighted returnd 8.6 percent
nts reflects anturn data prio
caused by thethe one-year e to the quarte
calculation.
o allocation an
mprised of U.Suity Policy sees, respectivee remaining 3
e securities, bed internally w, while 19
me
on a n
nor to e
er
nd
S.,ets ely.7
bothwith
MANAGEMENT’S DISCUSSION AND ANALYSIS

39FINANCIAL
California State Teachers' Retirement SystemManagement’s Discussion and Analysis (Unaudited) June 30, 2014
15
The Private Equity Portfolio is comprised of limited partnerships and co-investments focusing on commitments to domestic and non-U.S. partnerships as identified in the Private Equity Policy. Types of investment strategies include leveraged buyouts, venture capital, expansion capital, distressed debt and mezzanine investments. Private Equity has substantial fees and costs associated with each investment; consequently, emphasis is placed on negotiating and monitoring the direct and indirect costs of each limited partnership investment.
The Real Estate Portfolio is comprised of investments in wholly-owned properties, joint venture investments, coinvestments and commingled funds. Approximately 15 percent of the investment portfolio represents non-U.S. assets. Leverage has been reduced to the new levels set by the board. The core portfolio has increased from a low of 25 percent in prior years to 45 percent as of June 30, 2014. To more closely align the interests of CalSTRS and the real estate managers, emphasis is placed on negotiating, monitoring, and managing the direct costs associated with each real estate investment.
Asset / Liability Study CalSTRS conducts a full asset / liability (A/L) study once every three years or more frequently if there is a significant change in the assets or liabilities. The most recent study was conducted in 2012 and 2013. The key goal was to develop an asset allocation policy that maximizes the likelihood that an investment portfolio’s assets will, over the planning horizon, fund plan benefits. The recent study occurred over several Investment Committee meetings and concluded at the September 2013 meeting, with the adoption of strategic asset class targets into the Investment Policy and Management Plan (IPMP).
The revised IPMP reflected the new long-term asset targets and set the overall risk limit or acceptable risk parameters for the multi-billion dollar investment portfolio. Detailed information regarding the A/L study can be found in the board meeting agendas. The Investment Committee will consider changes to the portfolio over the next couple of years and the potential need to conduct another study in September 2015.
MANAGEMENT’S DISCUSSION AND ANALYSIS

40 CALSTRS COMPREHENSIVE ANNUAL FINANCIAL REPORT 2014
CaliforManageJune 30
PERFOR
The followgross of fe
During thethroughougrowth, anperiod, prinvestors buying proInvestor calso witnerecessionEuropeandevelopedgrowth in consumptof the fisceconomicemerging
During theits asset pincreased
rnia Stateement’s Dis0, 2014
MANCE VS.
wing is a comees by asset
e fiscal year, ut the year incnd strong corrimarily due toremained focogram by $10
concerns easeessed improve. In addition,
n equity marked markets as the country vtion tax hike t
cal year due toc growth, risin
market coun
e first half of tpurchases prod volatility in U
e Teacherscussion a
BENCHMAR
parison of Caclass versus
global equitiecluding accomrporate earnino the strong pcused on the F0 billion per med as she reitements in Euthe Europeanets rallying 30investors we
versus disapphat took effeco investors’ cog inflation, slutries.
the fiscal yeaogram along wU.S. Treasury
rs' Retireand Analys
RKS
alSTRS returnboard approv
es generated mmodative mongs. Global eqperformance inFederal Rese
month and Janterated the cerope as partsn Central Ban0 percent for tighed Prime M
pointing econoct in April 201ontinued lackumping curre
r, the uncertawith turmoil syields. Desp
ement Syssis (Unaud
16
ns calculated ved benchma
high returns donetary policiquity market rn the develop
erve as it initianet Yellen assentral bank’s is of the regionnk lowered its the fiscal yeaMinister Shinzomic data, a s4. Emerging
k of confidencncies, and ge
ainty of whenurrounding thite the fiscal h
stemdited)
on a time-wearks as of Jun
due to variousies across thereturns were iped countriesated its plan tsumed leaderintent to keepn began to em key interest r. Japan was zo Abe’s planstrengtheningmarket equiti
ce in those maeopolitical eve
the Federal Rhe U.S. goverheadwinds, e
eighted perfore 30, 2014:
s circumstance globe, improin the double . During the fto reduce its mrship of the cep interest ratemerge from thrate, which co the laggard a
n to stimulate g yen, and conies were slugarkets given tents that affec
Reserve woulrnment shutdoeconomic data
rmance basis
ces and evenoving economdigits for the
fiscal year, U.monthly bondentral bank.
es low. Investoheir protractedontributed to amongst the economic
ncerns over thgish during mtheir slowing cted a numbe
d begin taperown, caused a showed
nts mic
S.
ors dthe
hemost
er of
ring
MANAGEMENT’S DISCUSSION AND ANALYSIS
-202468
10121416182022242628
Global Equity
Weighted blend ofRussell 3000 Index
ex-Tobacco &Firearms + MSCI
ACWI (All CountryWorld Index ex-
U.S.) ex-Tobacco &Firearms
Fixed Income
Blend of Barclay’s U.S. Aggregate ex-
Tobacco & Firearms + U.S. High Yield
Cash Pay 2% Issuer ex-Tobacco &
Firearms
Private Equity
Russell 3000 Indexex-Tobacco &
Firearms + 3% witha Quarter lag
Real Estate
NCREIF ODCE ValueWeighted Index, net
of fees
Inflation Sensitive
Weighted blend ofGlobal Inflation
Protected Linkedsecurities and
Infrastructure Index
Absolute Return
Barclay's U.S.Treasury: 3 month
index + 1%
Cash
Barclay's U.S.Treasury: 3 month
index
24.73
5.79
19.61
14.52
10.54
0.13 0.57
24.22
4.72
26.43
12.75
8.38
1.07 0.07
Fiscal Year 2013-14 CalSTRS Benchmark

41FINANCIAL
California State Teachers' Retirement SystemManagement’s Discussion and Analysis (Unaudited) June 30, 2014
17
improvement, which led to a rise in Treasury yields and resulted in the Federal Reserve beginning to reduce its quantitative easing program starting in January 2014.
During the second half of the year, economic data was mixed and global geopolitical concerns remain heightened, causing Treasury yields to decline. Fixed income markets broadly performed well due to strong demand and a favorable interest rate backdrop. As several key geopolitical concerns subsided slightly in the last quarter, global bond markets ended the fiscal year with positive gains.
Strong recent performance continued to attract investors to private equity investments during the fiscal year. Like the public equity markets, developed markets private equity funds outperformed funds focused on emerging markets. Private equity markets have shown increasing correlation to public equity markets over recent years (especially since the adoption of fair market value accounting in 2007 [ASC 820]). However, the correlation is not straightforward; the performance of private equity markets has generally been lagged and muted relative to public equity markets due to the inherent delays associated with getting privately held assets appraised and other factors. Price changes in the public equity markets have generally rippled through the privately held assets over subsequent quarters and price changes experienced in the public markets, both positive and negative, have generally translated to the private equity markets at lesser magnitudes. As investors are receiving more distributions from private equity investments than ever before, confidence in, and appetite for, commitments to private equity investments are on the rise.
Over the fiscal year, despite the political tensions in the U.S., real estate performance continued to benefit from a slowly improving economy and job growth. Real estate investors were also focused on the future of the Fed’s quantitative easing program and expectations that a tapering would take place drove up interest rates. However, the market concerns eventually waned, and U.S. commercial real estate investment continued to gain momentum throughout the year. This growth coupled with slowly improving employment numbers and limited speculative construction, helped keep downward pressure on vacancy rates. The industrial and retail sectors benefited from a lack of construction and modest rent growth. Despite the positive economic indicators, office returns continued to lag slightly and rent growth in this sector remained weak.
Throughout the fiscal year, capital flows into private real estate remained strong, fueled by continued under-allocation of institutions to real estate, which was due in large part to the extraordinary gains of stocks during the fiscal year. The year also saw a growing appetite from institutional investors in the European market, as several of the European sovereigns rebounded. Private real estate funds have now seen positive changes in the net asset value (NAV) for several consecutive quarters. With respect to CalSTRS performance, the directly-held real estate investments are measured through realized income returns and unrealized appreciation or depreciation based on most recent appraisals and valuations.
LEGISLATIVE UPDATE
Consistent with CalSTRS mission, the board authorizes staff to engage in the legislative process to prevent and remove obstacles that impair the ability of CalSTRS members to achieve financial security.
As previously mentioned, Assembly Bill 1469 was signed into law as part of the 2014-15 budget in June 2014. AB 1469 dictates shared, gradual contribution rate increases for members, employers and the state in order to eliminate the unfunded actuarial obligation of the DB Program by June 30, 2046. Legislative topics related to CalSTRS during the period ending June 30, 2014, also included a board-sponsored bill, SB 1220 (Torres), which makes some changes to the Teachers’ Retirement Law that are necessary for continued effective and efficient plan administration.
MANAGEMENT’S DISCUSSION AND ANALYSIS

42 CALSTRS COMPREHENSIVE ANNUAL FINANCIAL REPORT 2014
California State Teachers' Retirement SystemManagement’s Discussion and Analysis (Unaudited) June 30, 2014
18
CalSTRS is also working on creditable compensation regulations to clarify provisions of the Education Code as they relate to classes of employees, creditable compensation and the appropriate crediting of contributions to either the Defined Benefit Program or the Defined Benefit Supplement Program. These regulations apply exclusively to members under the 2% at 60 benefit structure. The regulations were published in the California Regulatory Notice Register in December 2013 and are anticipated to be effective January 1, 2015.
REQUESTS FOR INFORMATION
This financial report is designed to provide a general overview of CalSTRS finances. For questions concerning the information in this report or for additional information, contact CalSTRS, P.O. Box 15275, Sacramento, CA 95851-0275.
Respectfully submitted,
Robin Madsen Chief Financial Officer
MANAGEMENT’S DISCUSSION AND ANALYSIS

43FINANCIAL
California State Teachers' Retirement SystemStatement of Fiduciary Net Position As of June 30, 2014 (with Comparative Totals as of June 30, 2013) (Dollars in Thousands)
The accompanying notes are an integral part of these financial statements. 19
403 (b)Plan
457Plan 2014 2013
AssetsInvestments, at fair value:
Debt securities 36,512,804$ 197,700$ 6,359$ 1,007$ 1,138$ 36,719,008$ 33,528,335$
Equity securities 102,089,006 329,834 10,686 - - 102,429,526 84,382,163
Alternative investments 53,273,293 - - - - 53,273,293 49,670,169
Derivative instruments 14,949 - - - - 14,949 45,055
Securities lending collateral 22,303,191 - - - - 22,303,191 23,215,906
Total investments 214,193,243 527,534 17,045 1,007 1,138 214,739,967 190,841,628
Cash 287,965 - - 1 1 287,967 345,518
Receivables:
Investments sold 2,237,745 - - - - 2,237,745 3,185,497 Foreign currency forward contracts (net)
- - - - - - 13,151
Interest and dividends 399,418 - - 6 2 399,426 388,716
Member, employer and State 518,521 4,437 167 - - 523,125 612,643
Loan receivable 21,620 384 1 - - 22,005 23,042
Other 32,690 - - - 128 32,818 39,106
Total receivables 3,209,994 4,821 168 6 130 3,215,119 4,262,155
Other assets: Capital assets, net of accumulated depreciation
228,362 - - - - 228,362 237,901
Other 718 - - - - 718 928
Total other assets 229,080 - - - - 229,080 238,829
Total assets 217,920,282 532,355 17,213 1,014 1,269 218,472,133 195,688,130
LiabilitiesInvestments purchased payable 2,901,762 - - - - 2,901,762 3,527,392 Foreign currency forward contracts (net)
6,488 - - - - 6,488 -
Loan payable 944,269 - - - - 944,269 937,494
Benefits in process of payment 1,121,034 - - - - 1,121,034 1,044,692
Other 161,415 927 - 144 835 163,321 145,707
Securities lending obligation 22,311,298 - - - - 22,311,298 23,246,453
Total liabilities 27,446,266 927 - 144 835 27,448,172 28,901,738
Net position restricted for pension/other postemployment benefits 190,474,016$ 531,428$ 17,213$ 870$ 434$ 191,023,961$ 166,786,392$
Comparative TotalsPension2 Teachers' Health
Benefits
Teachers' Deferred
Compensation
State Teachers' Retirement Plan
STATEMENT OF FIDUCIARY NET POSITION

44 CALSTRS COMPREHENSIVE ANNUAL FINANCIAL REPORT 2014
California State Teachers' Retirement SystemStatement of Changes in Fiduciary Net PositionFor the Fiscal Year Ended June 30, 2014 (with Comparative Totals for the Fiscal Year Ended June 30, 2013) (Dollars in Thousands)
The accompanying notes are an integral part of these financial statements. 20
403 (b)Plan
457Plan 2014 2013
AdditionsContributions:
Member contributions $ 2,263,613 $ 66,545 $ 3,230 $ - $ - $ 2,333,388 $ 2,396,595
Employer contributions 2,272,166 151 51 33,395 - 2,305,763 2,318,591
State of California 1,383,468 - - - - 1,383,468 1,328,298
Total contributions 5,919,247 66,696 3,281 33,395 - 6,022,619 6,043,484
Investment Income (Loss): Net appreciation in fair value of investments
26,092,999 59,617 1,740 - - 26,154,356 16,136,032
Interest, dividends and other 4,508,464 6,385 194 10 4 4,515,057 4,694,810
Securities lending income 104,709 - - - - 104,709 129,957
Less investment expenses:
Cost of lending securities (14,221) - - - - (14,221) (29,647)
Borrowing costs (20,161) - - - - (20,161) (18,420)
Reverse repurchase agreement - - - - - - (3,728)
Other investment expenses (269,887) - - - - (269,887) (182,607)
Net investment income 30,401,903 66,002 1,934 10 4 30,469,853 20,726,397
Other income 2,055 28 - - 1,241 3,324 2,307
Total additions 36,323,205 132,726 5,215 33,405 1,245 36,495,796 26,772,188
DeductionsRetirement, disability, death and survivor benefits
11,725,324 - - - - 11,725,324 11,133,282
Premiums paid - - - 32,632 - 32,632 34,702
Distributions and withdrawals - 22,173 358 - - 22,531 26,257
Purchasing power benefits 202,232 - - - - 202,232 221,451
Refunds of member contributions 107,600 2,523 45 - - 110,168 104,994
Administrative expenses 154,155 1,146 36 327 874 156,538 138,881
Other expenses 8,787 - - - 15 8,802 4,478
Total deductions 12,198,098 25,842 439 32,959 889 12,258,227 11,664,045
Net increase in net position 24,125,107 106,884 4,776 446 356 24,237,569 15,108,143
Net position restricted for pension/other postemployment benefits
Beginning of the year 166,348,909 424,544 12,437 424 78 166,786,392 151,678,249
End of the year $ 190,474,016 $ 531,428 $ 17,213 $ 870 $ 434 $ 191,023,961 $ 166,786,392
Comparative TotalsPension2State Teachers' Retirement Plan
Teachers' Health
Benefits
Teachers' Deferred
Compensation
STATEMENT OF CHANGES IN FIDUCIARY NET POSITION

45FINANCIAL
California State Teachers’ Retirement System Notes to the Basic Financial Statements
21
1. Description of CalSTRS and Contribution Information
The California State Teachers’ Retirement System (CalSTRS) administers a hybrid retirement system consisting of a defined benefit plan including disability and survivor benefits, two defined contribution plans, and an other postemployment benefit plan:
State Teachers’ Retirement Plan (STRP)
CalSTRS Pension2® Program (Internal Revenue Code 403(b) and 457 plans)
Teachers’ Health Benefits Fund (THBF)
Teachers’ Deferred Compensation Fund (TDCF)
CalSTRS provides pension benefits to California full-time and part-time public school teachers from pre-kindergarten through community college and certain other employees of the public school system. The Teachers' Retirement Law (California Education Code Section 22000 et seq.), as enacted and amended by the California Legislature, established these plans and CalSTRS as the administrator. The benefit terms of the plans may be amended through legislation.
CalSTRS is a component unit of the state. These financial statements include only the accounts of CalSTRS. The state includes CalSTRS various plans and funds as fiduciary funds in its financial statements.
The Teachers’ Retirement Board (board) has exclusive control over the administration of the retirement system plans and the investment of funds. The board makes rules, sets policies, and has the power and authority to hear and determine all facts pertaining to application for benefits under the retirement system. It is comprised of 12 members:
Five members appointed by the Governor: one member currently serving on a school board, one retired CalSTRS member, and three public members;
Four ex-officio members: the Superintendent of Public Instruction, the State Treasurer, the State Controller, and the Director of Finance; and
Three members elected by CalSTRS membership.
A new governor-appointed public representative joined the board in January 2014 and two governor-appointed positions remain open as of June 30, 2014.
State Teachers’ Retirement Plan The State Teachers’ Retirement Plan (STRP) is a multiple-employer, cost-sharing defined benefit plan comprised of four programs: Defined Benefit Program, Defined Benefit Supplement Program, Cash Balance Benefit Program and Replacement Benefits Program. The STRP holds assets for the exclusive purpose of providing benefits to members and beneficiaries of these programs. CalSTRS also uses plan assets to defray reasonable expenses of administering the STRP. Although CalSTRS is the administrator of the STRP, the state is the sponsor of the STRP and obligor of the trust. In addition, the state is both an employer and nonemployer contributing entity to the STRP.
STRP Defined Benefit Program The STRP Defined Benefit Program has two benefit formulas:
CalSTRS 2% at 60: Members first hired on or before December 31, 2012, to perform service that could be creditable to CalSTRS
CalSTRS 2% at 62: Members first hired on or after January 1, 2013, to perform service that could be creditable to CalSTRS
NOTES TO THE BASIC FINANCIAL STATEMENTS

46 CALSTRS COMPREHENSIVE ANNUAL FINANCIAL REPORT 2014
California State Teachers’ Retirement System Notes to the Basic Financial Statements
22
At June 30, 2014, there were 1,687 contributing employers (charter schools, school districts, community college districts, county offices of education and regional occupational programs). Membership is mandatory for all employees meeting certain statutory requirements and optional for all other employees performing creditable service. At June 30, 2013, membership consisted of:
The Defined Benefit Program provides retirement benefits based on members' final compensation, age and years of service credit. In addition, the retirement program provides benefits to members upon disability and to survivors/beneficiaries upon the death of eligible members. There are several differences between the two benefit formulas which are noted below.
CalSTRS 2% at 60
CalSTRS 2% at 60 members are eligible for normal retirement at age 60, with a minimum of five years of credited service. The normal retirement benefit is equal to 2.0 percent of final compensation for each year of credited service. Early retirement options are available at age 55 with five years of credited service or as early as age 50 with 30 years of credited service. The age factor for retirements after age 60 increases with each quarter year of age to 2.4 percent at age 63 or older. Members who have 30 years or more of credited service receive an additional increase of up to 0.2 percent to the age factor, known as the career factor. The maximum benefit with the career factor is 2.4 percent of final compensation.
CalSTRS calculates retirement benefits based on a one-year final compensation for members who retired on or after January 1, 2001, with 25 or more years of credited service, or for classroom teachers with less than 25 years of credited service if the employer elected to pay the additional benefit cost prior to January 1, 2014. One-year final compensation means a member’s highest average annual compensation earnable for 12 consecutive months calculated by taking the creditable compensation that a member could earn in a school year while employed on a full-time basis, for a position in which the person worked. For members with less than 25 years of credited service, final compensation is the highest average annual compensation earnable for any three consecutive years of credited service.
The limit on compensation that can be counted towards a member’s benefit is $260,000 for 2014, if hired on or after July 1, 1996. The limit is increased based on cost-of-living increases calculated per Internal Revenue Code Section 401(a)(17). No contributions are paid by the member, employer or the state on compensation in excess of the limit, and any compensation beyond the limit is excluded from determining final compensation.
Final compensation is based on different forms of compensation, including salary and certain other types of remuneration. Other types of compensation, such as compensation for unused accumulated leave, are not creditable compensation and do not count toward any CalSTRS benefit program.
Members who retire on or after January 1, 2001, and accumulated at least 30 years of credited service by December 31, 2010, receive a longevity bonus of $200, $300 or $400 per month for 30, 31 or 32 or more years of credited service, respectively.
June 30, 2013
Active MembersVested 323,405Nonvested 93,238
Inactive MembersVested 35,883Nonvested 146,693
Retirees and Benefit Recipients 269,274Total Members, Retirees and Beneficiaries 868,493
Information above is the most recent available as of June 30, 2014.
NOTES TO THE BASIC FINANCIAL STATEMENTS

47FINANCIAL
California State Teachers’ Retirement System Notes to the Basic Financial Statements
23
CalSTRS 2% at 62
CalSTRS 2% at 62 members are eligible for normal retirement at age 62, with a minimum of five years of credited service. The normal retirement benefit is equal to 2.0 percent of final compensation for each year of credited service. An early retirement option is available at age 55. The age factor for retirement after age 62 increases with each quarter year of age to 2.4 percent at age 65 or older.
All CalSTRS 2% at 62 members have their final compensation based on their highest average annual compensation earnable for three consecutive years of credited service.
The limit on creditable compensation that can be counted towards a member’s benefit is 120 percent of the Social Security wage base in effect on January 1, 2013. The limit is adjusted each fiscal year based on the changes in the Consumer Price Index. In fiscal year 2013-14, the limit was $136,440.
Only compensation paid in cash by an employer for each pay period in which creditable service is performed, pursuant to a publicly available written contractual agreement, is creditable to CalSTRS benefit programs for CalSTRS 2% at 62 members.
The following provisions apply to both CalSTRS 2% at 60 and 2% at 62 members:
After earning five years of credited service, members become 100 percent vested in retirement benefits.
After five years of credited service, a member (prior to age 60 if under Coverage A, no age limit if under Coverage B, as defined in Education Code Sections 24001 and 24101, respectively) is eligible for disability benefits of up to 50.0 percent of final compensation plus 10.0 percent of final compensation for each eligible child, up to a maximum addition of 40.0 percent. The member must have a disability that will exceed a period of 12 or more months to qualify for a benefit.
Any compensation for service in excess of one year in a school year due to overtime or working additional assignments is credited to the Defined Benefit Supplement Program so long as it is under the creditable compensation limit. Other compensation, such as allowances, bonuses, cash in-lieu of fringe benefits, limited-period compensation or compensation determined to have been paid to enhance a benefit, are not creditable to any CalSTRS benefit program.
A family benefit is available if an active member dies and has at least one year of credited service.
Members' accumulated contributions are refundable with interest upon separation from CalSTRS. The board determines the credited interest rate each fiscal year. For the year ended June 30, 2014, the rate of interest credited to members' accounts was 0.50 percent.
There is a postretirement annual benefit adjustment increase of 2.0 percent per year on a simple (rather than compound) basis. This benefit is vested for members who pay the higher contribution rates enacted in AB 1469, or retired in 2014.
The member’s benefit is reduced dollar for dollar, regardless of age, for the first 180 days after retirement if the member performs activities in the public schools that could be creditable to CalSTRS, unless the governing body of the school district takes specified actions with respect to a member who is above normal retirement age.
Any enhancements to the CalSTRS Defined Benefit Program made on or after January 1, 2013, apply only to service performed on or after the effective date of the enhancement.
Defined Benefit Program benefits must be forfeited by any CalSTRS member who is convicted of committing a felony in the course of his or her official duties, including specifically if the felony involved a child with whom the member had contact as part of the member’s official duties.
Purchasing power protection is provided to members of the Defined Benefit Program through the
NOTES TO THE BASIC FINANCIAL STATEMENTS

48 CALSTRS COMPREHENSIVE ANNUAL FINANCIAL REPORT 2014
California State Teachers’ Retirement System Notes to the Basic Financial Statements
24
Purchasing Power Protection Program. Annual distributions (in quarterly payments) to retired and disabled members and beneficiaries restore purchasing power up to 85.0 percent of the initial monthly allowance. Funding for the Purchasing Power Protection Program is from School Lands Revenue and the Supplemental Benefit Maintenance Account (SBMA). Public Resources Code Section 6217.5 allocates School Lands Revenue for the program. At June 30, 2014, CalSTRS has a receivable balance from the sale of the Elk Hills Naval Petroleum Reserve in the amount of $15.6 million.
The state is required to contribute an amount equal to approximately 2.5 percent of the total of the creditable compensation of the fiscal year ending in the immediately preceding calendar year, which is reduced in accordance with Education Code Section 22954(c), to fund the SBMA. In fiscal year 2013-14, the amount contributed to the SBMA was $581.3 million, excluding School Lands Revenue.
Contributions Required member, employer and state contribution rates are set by the California Legislature and Governor and detailed in Teachers' Retirement Law. Contribution rates are expressed as a level percentage of payroll using the entry age normal actuarial cost method.
A summary of statutory contribution rates and other sources of contributions to the Defined Benefit Program are as follows:
Members - Under CalSTRS 2% at 60, the member contribution rate was 8.0 percent of applicable member earnings for fiscal year 2013-14. Under CalSTRS 2% at 62, members contribute 50 percent of the normal cost of their retirement plan, which resulted in a contribution rate of 8.0 percent of applicable member earnings for fiscal year 2013-14.
In general, member contributions cannot increase unless members are provided with some type of “comparable advantage” in exchange for such increases. Under previous law, the Legislature could reduce or eliminate the 2 percent annual increase to retirement benefits. As a result of AB 1469, effective July 1, 2014, the Legislature cannot reduce the 2 percent annual benefit adjustment for members who retire on or after January 1, 2014, and in exchange for this “comparable advantage,” the member contribution rates have been increased by an amount that covers a portion of the cost of the 2 percent annual benefit adjustment.
Effective July 1, 2014, with the passage of AB 1469, member contributions for those under the 2% at 60 benefit structure increase from 8.0 percent to a total of 10.25 percent of applicable member earnings, phased in over the next three years. For members under the 2% at 62 benefit structure, contributions will increase from 8.0 percent to 9.205 percent of applicable member earnings, again phased in over three years, if there is no change to normal cost.
The CalSTRS member contribution rate increases effective for fiscal year 2014-15 and beyond are summarized in the table below:
Effective Date Prior Rate 2% at 60 Member 2% at 62 Member July 01, 2014 8% 8.15% 8.15% July 01, 2015 8% 9.20% 8.56%* July 01, 2016 8% 10.25% 9.205%* *The rate imposed on CalSTRS 2% at 62 members is based on the normal cost of benefits. The contribution rate shown in future years assumes no change in normal cost.
NOTES TO THE BASIC FINANCIAL STATEMENTS

49FINANCIAL
California State Teachers’ Retirement System Notes to the Basic Financial Statements
25
Employers - 8.25 percent of applicable member earnings.
In accordance with AB 1469, employer contributions will increase from 8.25 percent to a total of 19.1 percent of applicable member earnings phased in over the next seven years. The new legislation also gives the board limited authority to adjust employer contribution rates from July 1, 2021 through June 2046 in order to eliminate the remaining unfunded actuarial obligation related to service credited to members prior to July 1, 2014. The board cannot adjust the rate by more than 1 percent in a fiscal year, and the total contribution rate in addition to the 8.25 percent cannot exceed 12 percent.
The CalSTRS employer contribution rate increases effective for fiscal year 2014-15 through fiscal year 2045-46 are summarized in the table below:
Effective Date Prior Rate Increase Total July 01, 2014 8.25% 0.63% 8.88% July 01, 2015 8.25% 2.48% 10.73% July 01, 2016 8.25% 4.33% 12.58% July 01, 2017 8.25% 6.18% 14.43% July 01, 2018 8.25% 8.03% 16.28% July 01, 2019 8.25% 9.88% 18.13% July 01, 2020 8.25% 10.85% 19.10% July 01, 2046 8.25% Increase from prior rate ceases in 2046-47
State - 2.017 percent of the members’ creditable earnings from the fiscal year ending in the prior calendar year. This portion of the state appropriation totaled $527 million in fiscal year 2013-14.
Additionally, beginning October 1, 1998, a statutory contribution rate of 0.524 percent, adjustable annually in 0.25 percent increments up to a maximum of 1.505 percent, of the creditable earnings from the fiscal year ending in the prior calendar year per Education Code Section 22955(b). This contribution is reduced to zero if there is no unfunded actuarial obligation and no normal cost deficit for benefits in place as of July 1, 1990. Based on the actuarial valuation, as of June 30, 2012 there was no normal cost deficit, but there was an unfunded obligation for benefits in place as of July 1, 1990. As a result, the state was required to make quarterly payments starting October 1, 2013, at an additional contribution rate of 1.024 percent. As of June 30, 2014, the state contributed $200.7 million of the $267.6 million total amount for fiscal year 2013-14. As a result of AB 1469, the fourth quarterly payment of $66.9 million was included in an increased first quarter payment of $94 million for the 2014-15 fiscal year, which was transferred on July 1, 2014.
In accordance with AB 1469, the portion of the state appropriation under Education Code Section 22955(b) that is in addition to the 2.017 percent has been replaced by section 22955.1(b) in order to fully fund the benefits in effect as of 1990 by 2046. The additional state contribution will increase from 1.437 percent in 2014-15 to 4.311 percent in 2016-17. The increased contributions end as of fiscal year 2046-47.
NOTES TO THE BASIC FINANCIAL STATEMENTS

50 CALSTRS COMPREHENSIVE ANNUAL FINANCIAL REPORT 2014
California State Teachers’ Retirement System Notes to the Basic Financial Statements
26
The CalSTRS state contribution rates effective for fiscal year 2014-15 and beyond are summarized in the table below:
* The new legislation also gives the board limited authority to adjust state contribution rates from July 1, 2017, through June 2046 in order to eliminate the remaining unfunded actuarial obligation associated with the 1990 benefit structure. The board cannot increase the rate by more than 0.50 percent in a fiscal year, and if there is no unfunded actuarial obligation, the contribution rate imposed to pay for the 1990 benefit structure shall be reduced to 0 percent. Rates in effect prior to July 1, 2014, are reinstated if necessary to address any remaining 1990 unfunded actuarial obligation from July 1, 2046, and thereafter.
Receivables for Benefit Enhancements A school employer may provide, at the employer’s cost, an additional two years of service credit to increase the amount of the member’s monthly retirement benefit. The cost to the employer may be paid for by the employer in installments not to exceed eight years. If the employer chooses to pay in installments, the employer is charged interest on the unpaid balance at the actuarially assumed rate of return on investments for the Defined Benefit Program (currently 7.5 percent). As of June 30, 2014, the outstanding balance of these receivables was $26.9 million.
STRP Defined Benefit Supplement Program The Defined Benefit Supplement Program, established pursuant to Chapter 74, Statutes of 2000 (AB 1509), is a defined benefit pension program that operates within the STRP. All members of the Defined Benefit Program who make contributions to CalSTRS on creditable compensation earned on and after January 1, 2001, have an account under the Defined Benefit Supplement Program and are eligible to receive a Defined Benefit Supplement benefit based on the amount of funds contributed to the Defined Benefit Supplement account. Membership in the Defined Benefit Supplement Program is mandatory.
Interest is credited to the nominal DBS Program accounts at the minimum guaranteed annual rate established by the board prior to each plan year, which was 3 percent for the fiscal year ended June 30, 2014. The board may credit additional earnings to members’ nominal accounts if actual investment earnings exceed the minimum guaranteed annual rate and meet criteria set out in board policy. In April 2014, the board granted an additional earnings credit (AEC) of 3.61 percent of active and inactive members’ June 30, 2013 nominal account and an additional annuity credit (AAC) of the 3.61 percent of the actuarial value of retired member’s annuities as of June 30, 2013. The dollar value of these credits was $266.2 million for the AEC, and $29.6 million for the AAC based on the June 30, 2013, Defined Benefit Supplement Program actuarial valuation.
Contributions Beginning July 1, 2002, for creditable service in excess of one year of service credit within one fiscal
Effective DateBase Rate
AB 1469Increase For1990 Benefit
StructureSBMA
Funding
Total StateAppropriationto DB Program
July 01, 2014 2.017% 1.437% 2.50% 5.954%
July 01, 2015 2.017% 2.874% 2.50% 7.391%
July 01, 2016 2.017% 4.311% 2.50% 8.828%July 01, 2017 to June 30, 2046 2.017% 4.311%* 2.50% 8.828%*July 01, 2046 and thereafter 2.017% * 2.50% 4.571%*
NOTES TO THE BASIC FINANCIAL STATEMENTS

51FINANCIAL
California State Teachers’ Retirement System Notes to the Basic Financial Statements
27
year, member contributions of 8 percent and employer contributions of 8 percent are credited to the members’ nominal Defined Benefit Supplement Program account (up to the compensation cap). Also, contributions for compensation as a result of retirement incentives or limited-term enhancements are credited to the members’ Defined Benefit Supplement Program accounts for CalSTRS 2% at 60 members.
STRP Cash Balance Benefit Program The Cash Balance Benefit Program, established under Chapter 592, Statutes of 1995 (AB 1298), and subsequently merged into the STRP by Chapter 1048, Statutes of 1998 (SB 2085), is a defined benefit pension program. The Cash Balance Benefit Program is designed for employees of California’s public schools who are hired to perform creditable service for less than 50 percent of the full-time equivalent for the position. Participation in the Cash Balance Benefit Program is optional; a school district, community college district, county office of education or regional occupational program may elect to offer the Cash Balance Benefit Program. Under such election, the program will automatically cover each eligible employee, unless the employee elects to participate in the Defined Benefit Program or an alternative plan provided by the employer within 60 days of hire or the election period determined by the employer.
Interest is credited to nominal Cash Balance Benefit Program accounts at the minimum guaranteed annual rate established by the board prior to each plan year, which was 3 percent for the year ended June 30, 2014. The board may credit additional earnings to members’ nominal accounts if actual investment earnings exceed the minimum guaranteed annual rate and meet criteria set out in board policy. In April 2014, the board granted an AEC of 3.25 percent of active and inactive participants’ June 30, 2013, nominal accounts and an AAC of 3.25 percent of the actuarial value of retired members’ annuities as of June 30, 2013. The dollar value of these credits was $5.5 million for the AEC and $61 thousand for the AAC based on the June 30, 2013, Cash Balance Benefit Program actuarial valuation.
Contributions A summary of statutory contribution rates for the Cash Balance Benefit Program is as follows:
Participants - 4.0 percent of applicable participant’s earnings
Employers - 4.0 percent of applicable participant’s earnings
Employers may enter into a collective bargaining agreement to pay different rates if certain minimum conditions are met. At June 30, 2014, there were 32 contributing school districts and 35,066 contributing participants.
STRP Replacement Benefits Program The STRP Replacement Benefits Program is an excess benefits arrangement for Defined Benefit Program members that is administered as a qualified excess benefit arrangement through a separate pension program apart from the other three STRP programs and is established in accordance with Internal Revenue Code (IRC) Section 415(m). IRC Section 415(b) imposes a dollar limit on the annual retirement benefits an individual may receive from a qualified defined benefit pension plan. The limit for individual CalSTRS members varies based on the age at which they retire. In 2014, the federal dollar limit for retirees is $210,000, without considering the member's retirement age. Under CalSTRS 2% at 62, members will not receive any benefits in excess of the IRC Section 415(b) limit.
The program is funded as needed. Contributions that would otherwise be credited to the Defined Benefit Program each month are instead credited to the Replacement Benefits Program to fund monthly program costs. Monthly employer contributions are received and paid to members in amounts equivalent to the benefits not paid as a result of IRC Section 415(b), subject to withholding for any applicable income or employment taxes. At June 30, 2014, there were 260 retirees, beneficiaries, and non-member spouses receiving benefits from the Replacement Benefits Program.
NOTES TO THE BASIC FINANCIAL STATEMENTS

52 CALSTRS COMPREHENSIVE ANNUAL FINANCIAL REPORT 2014
NOTES TO THE BASIC FINANCIAL STATEMENTS
California State Teachers’ Retirement System Notes to the Basic Financial Statements
28
CalSTRS Pension2 Program Pursuant to Chapter 291, Statutes of 1994 (AB 3064), CalSTRS Pension2 (Pension2) was established to include two tax-deferred defined contribution plans under the IRC sections 403(b) and 457. TIAA-CREF is responsible for administrative services, including custody and record-keeping services, while CalSTRS performs the investment management functions of determining, monitoring and maintaining the plan’s investments.
As of June 30, 2014, the IRC 403(b) and 457 plans had approximately 8,198 and 412 plan participants with account balances and approximately 766 and 31 participating employers (school districts), respectively. Pension2 is available to all full-time California pre-kindergarten through community college district and county office of education employees. Part-time employees’ eligibility is determined by their employers. Enrollment in the 457 plan is by employer adoption only. Employee contributions to the plans are voluntary and require no minimum limitations; however, the IRC imposes an annual maximum amount that can be contributed to the plans. Pension2 is not directly affected by the California Public Employee’s Pension Reform Act of 2013 (PEPRA). However, according to PEPRA, employers may provide a contribution to a defined contribution plan, such as Pension2, for 2% at 62 member compensation in excess of the compensation cap.
The Pension2 investments are comprised of a selection of mutual funds with underlying investments that include stocks, bonds and real estate investments and guaranteed annuity contracts, which are participant-directed. The Pension2 benefits are the accumulation of contributions and investment earnings credited to the member’s account.
Teachers’ Health Benefits Fund The Teachers’ Health Benefits Fund (THBF) was established pursuant to Chapter 1032, Statutes of 2000 (SB 1435), which also established the Medicare Premium Payment Program (MPP Program), a cost-sharing multiple-employer other postemployment benefit plan, paid from the THBF to eligible retired members of the Defined Benefit Program. At June 30, 2014, there were 7,558 retirees participating in the MPP Program. The number of active members and terminated vested members who will participate in the program after they retire is unknown because eligibility cannot be pre-determined.
The MPP Program was established to pay Medicare Part A premiums and Medicare Parts A and B late enrollment surcharges for Defined Benefit Program members who had retired or would retire prior to July 1, 2001, and who meet certain other eligibility criteria. Subsequently, the MPP Program has been extended several times. On April 5, 2007, the board extended the MPP Program to members who retired on or before June 30, 2012. As of June 30, 2012, active and deferred members are no longer eligible for future coverage under the MPP Program.
Contributions The MPP Program is funded on a pay-as-you go basis from a portion of the monthly Defined Benefit Program employer contributions. Contributions that would otherwise be credited to the STRP each month are instead credited to the MPP Program to fund monthly program and administrative costs. Total redirections to the MPP Program are monitored to ensure that total incurred costs do not exceed the amount initially identified as the cost of the program.
Teachers’ Deferred Compensation Fund The Teachers’ Deferred Compensation Fund (TDCF) was established pursuant to Chapter 655, Statutes of 2006 (SB 1466), and is used to account for ancillary activities associated with various deferred compensation plans and programs offered by CalSTRS to enhance the tax-deferred financial options for the members and their beneficiaries.
The TDCF is funded by the fee revenues received by CalSTRS from deferred compensation plans, a vendor registration program and an employer compliance assistance program.
NOTES TO THE BASIC FINANCIAL STATEMENTS

53FINANCIAL
California State Teachers’ Retirement System Notes to the Basic Financial Statements
29
On September 1, 2011, CalSTRS entered into a five-year Open Architecture Bundled Administration Agreement with Los Angeles Unified School District (LAUSD) to provide record-keeping and administrative services for the Los Angeles Unified School District 457(b) Plan (LAUSD 457(b) Plan). CalSTRS’ responsibilities under this agreement are to provide record-keeping services that include maintaining participant account balances, processing participant transactions, providing participant statements and education, and performing tax compliance and reporting functions.
CalSTRS has determined that LAUSD retains investment fiduciary responsibilities for the LAUSD 457(b) Plan, as LAUSD has maintained the plan investment management functions, which include determining, monitoring and maintaining the plan’s investment offerings. Therefore, CalSTRS has not included the LAUSD 457(b) Plan assets, liabilities and associated changes within its Statement of Fiduciary Net Position nor the Statement of Changes in Fiduciary Net Position. At June 30, 2014, the fair market value of LAUSD 457(b) Plan assets was $70 million. The fees CalSTRS receives in association with the services provided under this agreement are accounted for within the TDCF. At the discretion of LAUSD, CalSTRS will cease to provide recordkeeping and administrative services for the LAUSD 457(b) Plan around October 2014.
2. Summary of Significant Accounting Policies
Basis of Accounting CalSTRS maintains its accounting records using the accrual basis of accounting. It recognizes member contributions in the period in which the contributions are earned. Furthermore, CalSTRS recognizes employer and state contributions when earned and the employer or state has made a formal commitment to provide the contributions. Also, CalSTRS recognizes benefits when due and payable in accordance with its retirement and benefits programs. Purchases and sales of investments are recorded on the trade date. Interest income is recorded on an accrual basis. Dividends are recorded on the ex-dividend date.
Use of Estimates in the Preparation of Financial Statements The preparation of CalSTRS financial statements in conformity with accounting principles generally accepted in the U.S. requires management to make estimates and assumptions that affect certain financial statement amounts and disclosures. Actual results could differ from those estimates.
Cash Cash held by CalSTRS includes foreign currency, deposits with the State Treasury and master custodian, and cash held at a commercial bank for operational purposes.
Investments CalSTRS investments held at June 30, 2014, are either in the custody of State Street Bank, CalSTRS’ master custodian, TIAA-CREF, administrator for Pension2, and/or in CalSTRS name.
Under California Constitution, Article 16, Section 17, and the California Education Code, Part 13 Teachers’ Retirement Law, Chapter 4, Section 22250, the board has the sole and exclusive fiduciary responsibility over the assets of the retirement system and to administer the system in a manner that will assure prompt delivery of benefits and related services to the members and their beneficiaries.
As a public pension fund, CalSTRS is not subject to ERISA, which governs corporate pension plans. However, the CalSTRS investment decision-making criteria are based on the “prudent expert” standard, for which the ERISA standards serve as a basis. Additionally, the California Constitution, Article 16, Section 17, and the California Education Code, Part 13 Teachers Retirement Law, Chapter 4, Section 22250 require the diversification of investments so as to minimize the risk of loss and maximize the rate of returns, unless under the circumstances it is clearly not prudent to do so. CalSTRS Investment Policy and Management Plan is established and may be amended by a majority vote of the board. It allows for investments consisting of debt and equity securities, alternative investments and derivative instruments. See Note 5 regarding the Schedule of Investments.
NOTES TO THE BASIC FINANCIAL STATEMENTS

54 CALSTRS COMPREHENSIVE ANNUAL FINANCIAL REPORT 2014
California State Teachers’ Retirement System Notes to the Basic Financial Statements
30
In the Statement of Changes in Fiduciary Net Position, CalSTRS presents the net appreciation (depreciation) in the fair value of its investments, which consists of the realized gains and losses on securities sold and the unrealized appreciation (depreciation) on those investments still held in the portfolio.
The value and performance of CalSTRS investments are subject to various risks, including credit risk, interest rate risk, concentration of credit risk, custodial credit risk and foreign currency risk, which are in turn affected by economic and market factors impacting certain industries, sectors or geographies. See Note 5 for disclosures related to these risks.
Investments are reported at fair value. The diversity of the investment types held by CalSTRS requires a wide range of valuation techniques to determine fair value. The overall valuation processes and information sources by major asset classifications are as follows:
Debt Securities Debt securities consist primarily of long term investments issued by the U.S. government and U.S. government-sponsored agencies, municipal securities, foreign governments, corporations, securitized offerings backed by residential and commercial mortgages and inflation-indexed bonds (also known as inflation-linked bonds). Debt securities also consist of short term securities that have maturities less than one year. Investments in Pension2 comprise of debt securities such as bond mutual funds and guaranteed annuity contracts.
Certain debt securities have an active market for identical securities and are valued using the close or last traded price on a specific date. Debt securities that are not as actively traded are valued by pricing vendors using modeling techniques that include market observable inputs as well as unobservable inputs required to develop a fair value. Typical inputs include recent trades, yields, price quotes, cash flows, maturity, credit ratings and other assumptions based upon the specifics of the investments’ type.
Global inflation-indexed bonds are bonds where the principal is indexed to inflation. The CalSTRS portfolio consists of inflation-linked bonds issued by governments, including but not limited to the U.S., which are representative of the countries reflected in the performance benchmark. The values of the U.S. Inflation-Protected Debt Securities are adjusted periodically based on the Consumer Price Index for Urban Consumers (CPI-U), which is calculated monthly by the U.S. Bureau of Labor Statistics. The U.S. inflation-protected securities are actively traded and the prices are readily available from pricing vendors. Similarly, the inflation-linked debt securities issued by a foreign government are also adjusted to reflect a comparable consumer inflation index by that government and the prices are also readily available from pricing vendors.
Short-term investments consist of money market funds, certificates of deposit and similar instruments with maturities of less than one year. Short-term investments are reported at fair value or at cost or amortized cost, which approximates fair value. For those investments which are reported at fair value, the investments are valued using similar methodologies as debt securities traded in active markets.
Pension2 offers bond mutual funds and TIAA Traditional Annuity to the individual participants in Pension2. The mutual funds offered by TIAA-CREF are open-ended funds that are priced daily at the net asset value (NAV) by the fund sponsor based generally upon the exchange traded last or official closing price of the securities held by the fund. In addition, the TIAA Traditional Annuity is a guaranteed annuity contract, which guarantees the participant’s contributions plus a specified minimum interest rate. Rates and certain account features vary depending on the type of annuity contract held by the participant. The actual rate of return will also vary from year to year at the TIAA Board of Trustee’s discretion. CalSTRS allocation in the TIAA Traditional Annuity is carried at contract value, which approximates fair value.
NOTES TO THE BASIC FINANCIAL STATEMENTS

55FINANCIAL
California State Teachers’ Retirement System Notes to the Basic Financial Statements
31
Equity Securities Equity securities consist primarily of domestic and international common stocks, preferred stocks, depository receipts, real estate investment trusts (REITs), Exchange Traded Funds (ETFs) and stock mutual funds. The majority of equity securities held by CalSTRS are actively traded on major stock exchanges. These exchanges make information on trades of securities available daily on a last trade or official close basis. If such information is not available, other pre-established means are used to determine a price. Stock mutual funds, held in the STRP and the Pension2 program, are open-ended funds that are priced daily at NAV by the fund sponsor based generally upon the exchange traded last or official closing price of the securities held by the fund.
Alternative Investments Alternative investments consist primarily of limited partnership structures invested in privately held debt, such as distressed and mezzanine debt, or privately held equity, such as venture capital, buyouts, co-investments and equity expansion, as well as investments in real estate and infrastructure. They include investments held within the private equity, real estate, corporate governance, innovation, and infrastructure asset classes and investment strategies. Investments in real estate directly-held assets are in separate accounts and joint ventures which are comprised of retail, office, industrial, and multi-family properties.
Partnership interests are valued using their respective NAV calculated in accordance with the general partner’s fair valuation policy as of the measurement date, and are audited annually. CalSTRS receives audited financial statements including valuation results from the general partners and reviews valuation policies for a sample of general partners on a periodic basis. The most significant input into the NAVs of such an entity is the fair value of its investment holdings which are typically valued on a quarterly or semi-annual basis by the general partners. The valuation assumptions are based upon the nature of the investment and the underlying business. The valuation techniques vary by investment type and involve a certain degree of expert judgment.
Corporate governance funds employ specific investment strategies and co-investments including, but not limited to, publicly traded equity securities of companies on U.S., Canadian, and European exchanges. These limited partnerships have been valued using the NAV of the entity, with the most significant input into the NAV being the value of its investment holdings. The general partners obtain prices for their holdings in a manner similar to that described above for CalSTRS global equity holdings.
Investments in real estate directly-held assets are subject to independent third party appraisals performed annually in accordance with the Uniform Standards of Professional Appraisal Practice. Leverage may be used to enhance investment returns as set forth in the CalSTRS Real Estate Investment Policy. See Note 5 regarding the Real Estate Investment Policy. On a quarterly basis, fair values are estimated by the third party advisor or operating partner using general market and property specific assumptions, which are reviewed by CalSTRS management.
Real estate investments in non-directly held assets are long term and illiquid in nature. As a result, investors are subject to redemption restrictions which generally limit distributions and restrict the ability of limited partners to exit a partnership investment prior to its dissolution. Limited partner interests in commingled funds are valued by CalSTRS using the NAV of the partnership provided by the general partner. The most significant input into the NAV of such an entity is the fair value of its investment holdings. These holdings are valued using the general partners’ fair valuation policy on a continuous basis, audited annually and periodically appraised by an independent third party as directed by the governing document for each commingled fund investment. The valuation assumptions use both market and property specific inputs.
Derivative Instruments CalSTRS holds investments in futures, foreign currency forward contracts, options, swaps, rights and warrants. The fair value of exchange-traded derivative instruments such as futures, options, rights
NOTES TO THE BASIC FINANCIAL STATEMENTS

56 CALSTRS COMPREHENSIVE ANNUAL FINANCIAL REPORT 2014
California State Teachers’ Retirement System Notes to the Basic Financial Statements
32
and warrants are determined based on the quoted market prices. The fair value of derivative instruments that are not exchange-traded such as swaps is determined by external pricing services.
Futures contracts are exchange-traded financial instruments that derive their value from underlying securities, indices or reference rates and are marked-to-market at the end of each day. Daily settlements of gains and losses occur on the following business day. As a result, the instruments have no fair value at the end of any trading day. Futures variation margins are accounted for as unrealized appreciation or depreciation until the contract is closed.
Foreign currency forward contracts are traded over-the-counter (OTC) and are an obligation to buy or sell currency at a specified exchange rate and quantity on a specific future date. The fair value of the foreign currency forward contracts is the unrealized gain or loss calculated based on the difference between the specified exchange rate and the closing forward rate at June 30, 2014.
CalSTRS invests in exchange-traded options and OTC options. An option is a contract that entitles the holder to purchase or sell a specific amount of contracts or notional amount at a specified price (strike price). The underlying asset, contracts or notional amount, expiration date and strike price are known in advance for exchange-traded options.
Swaps are derivative instruments in which two parties agree to exchange one stream of cash flows against another stream or a guarantee. These streams are called the legs of the swap and usually at least one leg has a rate that is variable. The variable leg can depend on a reference rate, the total return of an asset, or an economic statistic. Cash flows are calculated based on the notional amount, which are usually not exchanged between counterparties.
Investment Risk Management CalSTRS enters into currency forwards and option contracts to protect the value of non-U.S. investments against foreign currency fluctuation. CalSTRS could be exposed to risk if the counterparties to the forward and option contracts are unable to meet the terms of their contracts. CalSTRS also enters into futures contracts to hedge risks in the equity and fixed income markets. CalSTRS seeks to minimize risk from counterparties by establishing minimum credit quality standards and maximum credit limits. See Note 5 for disclosures related to these risks.
Capital Assets Capital assets held by CalSTRS, which consist of land, building, equipment, and intangible assets are recorded at cost and reflected on the Statement of Fiduciary Net Position, net of accumulated depreciation/amortization. The capitalization threshold for capital assets is $1 million. Depreciation/amortization is charged to operations using the straight-line method on the estimated useful life of the related asset. Estimated useful lives range from one to five years for equipment, forty years for buildings, and a minimum of five years for amortizable intangible assets. Accumulated depreciation/amortization and depreciation/amortization expense through June 30, 2014 of fiscal year 2013-14 were $43.4 million and $10.9 million, respectively. CalSTRS reviews its capital assets for impairment whenever events or changes in circumstances indicate that the carrying value of an asset may not be recoverable. As of June 30, 2014 there has been no impairment of capital assets.
Administrative Expenses The cost of administering the CalSTRS system is financed through contributions and investment earnings. Schedule VI (Schedule of Administrative Expenses) provides a listing of administrative expense by type.
Income TaxesThe STRP and THBF are organized as a tax-exempt retirement plan under the IRC. Pension2, which includes IRC 403(b) and 457 plans, is organized as a tax-deferred supplemental program under the IRC. CalSTRS management believes that it has operated these funds and programs within the constraints imposed by federal tax law.
NOTES TO THE BASIC FINANCIAL STATEMENTS

57FINANCIAL
California State Teachers’ Retirement System Notes to the Basic Financial Statements
33
Investment Expenses Expenses directly associated with investment management, operations and servicing, as well as foreign taxes have been included as ‘Other investment expenses’ in the Statement of Changes in Fiduciary Net Position. Schedule VII (Schedule of Investment Expenses) provides a listing of investment expenses by type. Broker commissions for securities trades and private asset fees are capitalized, with the exception of certain derivatives for which they are expensed.
Securities Lending Transactions CalSTRS reports securities lent, reinvested cash collateral, and the related liabilities resulting from securities lending transactions on the Statement of Fiduciary Net Position. CalSTRS also reports the income earned and costs of lending securities as investment income and expenses on the Statement of Changes in Fiduciary Net Position.
Reverse Repurchase Agreement Transactions CalSTRS reports the liabilities resulting from the reverse repurchase agreements as obligations under reverse repurchase agreements and the underlying securities used as collateral are reported as investments on the Statement of Fiduciary Net Position. Any interest cost associated with the reverse repurchase agreements is reported as investment expense on the Statement of Changes in Fiduciary Net Position. As of June 30, 2014, CalSTRS held no reverse repurchase agreements.
Reserves CalSTRS maintains accounts within the net position restricted for pension/other postemployment benefits as reserve accounts for various operating purposes. The Teachers’ Retirement Law requires CalSTRS to maintain two types of reserve accounts within two programs of the STRP, the Defined Benefit Supplement Program and the Cash Balance Benefit Program. Teachers’ Retirement Law also requires CalSTRS to maintain an account for the SBMA.
Defined Benefit Supplement Annuitant Reserve Part 13, Chapter 2 Section 22104.9 of the Education Code, formed the Defined Benefit Supplement Annuitant Reserve to establish and maintain a segregated account for expenditures on annuities payable under the Defined Benefit Supplement Program. Defined Benefit members may have a Defined Benefit Supplement account that accumulates contributions and interest. The Defined Benefit Supplement Program offers supplemental income in addition to their regular Defined Benefit program benefit. During a member’s career, funds are accumulated in the Defined Benefit Supplement Member Reserve, and when a member retires the funds are converted to the Defined Benefit Supplement Annuitant Reserve.
Defined Benefit Supplement Gain and Loss Reserve Part 13, Chapter 2 Section 22139.5 of the Education Code, established the Defined Benefit Supplement Gain and Loss Reserve which represents a segregated account to maintain either: 1) credited interest to member Defined Benefit Supplement accounts at the minimum interest rate for plan years in which the obligation cannot be met from the plan’s investment earnings, or 2) provide additions to the Annuitant Reserve to meet the plan’s obligation for annuities payable under the Defined Benefit Supplement program.
Cash Balance Annuitant Reserve Part 14, Chapter 2 Section 26105 of the Education Code, established the Cash Balance Annuitant Reserve for the payment of monthly annuities with respect to the Cash Balance Program. The Cash Balance Program is a retirement program that can be an alternative to the CalSTRS Defined Benefit Program, Social Security and other retirement plans. During a participant’s career, funds are accumulated in the Cash Balance Participant Reserve. When a participant retires, the funds are transferred to the Cash Balance Annuitant Reserve.
NOTES TO THE BASIC FINANCIAL STATEMENTS

58 CALSTRS COMPREHENSIVE ANNUAL FINANCIAL REPORT 2014
California State Teachers’ Retirement System Notes to the Basic Financial Statements
34
Cash Balance Gain and Loss Reserve Part 14, Chapter 2 Section 26202 of the Education Code, established the Cash Balance Gain and Loss Reserve which represents funds to be drawn upon to the extent necessary to credit interest to participants’ accounts at the minimum interest rate during years in which CalSTRS investment earnings with respect to the Cash Balance Program are not sufficient for that purpose, and where necessary, to provide additions to the Annuitant Reserve for monthly annuity payments.
Supplemental Benefit Maintenance Account Part 13, Chapter 8 Section 22400 of the Education Code, established the Supplemental Benefit Maintenance Account to separately maintain and manage the annual supplemental payments disbursed in quarterly installments to all benefit recipients whose purchasing power has fallen below 85 percent of the purchasing power of the initial allowance as long as funds are available. The Supplemental Benefit Maintenance Account is primarily funded by contributions from the state, School Lands monies, and the earned interest on the SBMA reserve balance based on the actuarially assumed interest rate.
The reserve balances as of June 30, 2014, are summarized in the table below:
Comparative TotalsThe basic financial statements include certain prior year summarized comparative information in total but not at the level of detail required for a presentation in conformity with generally accepted accounting principles in the United States of America. Accordingly, such information should be read in conjunction with CalSTRS financial statements for the year ended June 30, 2013, from which the summarized information was derived. Certain reclassifications have been made to the comparative totals as of and for the year ended June 30, 2013, to conform to the presentation as of and for the year ended June 30, 2014. Reclassifications did not have an impact on net position restricted for pension and other postemployment benefits or net increase in net position restricted for pension and other postemployment benefits.
3. Net Pension Liability of Employers and Nonemployer Contributing Entity
The components of the net pension liability of the STRP for participating employers and the State of California (nonemployer contributing entity) as of June 30, 2014, are as follows (dollars in millions):
Total pension liability $ 248,911 Less: STRP fiduciary net position (190,474) Net pension liability of employers and the state $ 58,437
STRP fiduciary net position as a percentage of the total pension liability 77%
Reserve BalanceReserve Type (Dollars in Thousands)Defined Benefit Supplement Annuitant Reserve 524,323$ Defined Benefit Supplement Gain and (Loss) Reserve 2,460,072Cash Balance Annuitant Reserve 2,559Cash Balance Gain and (Loss) Reserve 44,148Supplemental Benefit Maintenance Account Reserve 10,342,893Other Reserves Not Legally Required for Disclosure 177,649,966 Total 191,023,961$
NOTES TO THE BASIC FINANCIAL STATEMENTS

59FINANCIAL
California State Teachers’ Retirement System Notes to the Basic Financial Statements
35
Actuarial methods and assumptions The total pension liability for the STRP was determined by applying update procedures to a financial reporting actuarial valuation as of June 30, 2013, and rolling forward the total pension liability to June 30, 2014. The financial reporting actuarial valuation as of June 30, 2013, used the following actuarial methods and assumptions, applied to all prior periods included in the measurement:
Valuation Date June 30, 2013 Experience Study July 1, 2006, through June 30, 2010 Actuarial Cost Method Entry age normal Investment Rate of Return2 7.60% Consumer Price Inflation 3.00% Wage Growth 3.75% Post-retirement Benefit Increases 2.00% simple for DB
Not applicable for DBS/CBB
CalSTRS uses custom mortality tables to best fit the patterns of mortality among its members. These custom tables are based on RP2000 series tables adjusted to fit CalSTRS experience. RP2000 series tables are an industry standard set of mortality rates published by the Society of Actuaries. See CalSTRS July 1, 2006 – June 30, 2010 Experience Analysis for more information.
The long-term expected rate of return on pension plan investments was determined using a building-block method in which best-estimate ranges of expected future real rates of return (expected returns, net of pension plan investment expense and inflation) are developed for each major asset class. The best-estimate ranges were developed using capital market assumptions from CalSTRS general investment consultant (Pension Consulting Alliance - PCA) as an input to the process. Based on the model from CalSTRS consulting actuary’s (Milliman) investment practice, a best estimate range was determined by assuming the portfolio is re-balanced annually and that annual returns are lognormally distributed and independent from year to year to develop expected percentiles for the long-term distribution of annualized returns. The assumed asset allocation by PCA is based on board policy for target asset allocation in effect on February 2, 2012, the date the current experience study was approved by the board. Best estimates of 10-year geometric real rates of return and the assumed asset allocation for each major asset class used as input to develop the actuarial investment rate of return are summarized in the following table:
Discount rate The discount rate used to measure the total pension liability was 7.60 percent. The projection of cash flows used to determine the discount rate assumed that contributions from plan members and
2 Net of investment expenses, but gross of administrative expenses. CalSTRS uses a 7.5 percent assumed investment rate of returnfor funding purposes, which is net of administrative expenses.
Asset ClassAssumed Asset
Allocation
Long-Term* Expected Real Rate of Return
Global Equity 47% 4.50%Private Equity 12 6.20Real Estate 15 4.35Inflation Sensitive 5 3.20Fixed Income 20 0.20Cash / Liquidity 1 0.00
* 10-year geometric average
NOTES TO THE BASIC FINANCIAL STATEMENTS

60 CALSTRS COMPREHENSIVE ANNUAL FINANCIAL REPORT 2014
California State Teachers’ Retirement System Notes to the Basic Financial Statements
36
employers will be made at statutory contribution rates in accordance with the rate increases per AB 1469 as disclosed in Note 1. Projected inflows from investment earnings were calculated using the long-term assumed investment rate of return (7.60 percent) and assuming that contributions, benefit payments, and administrative expense occur midyear. Based on those assumptions, the STRP’s fiduciary net position was projected to be available to make all projected future benefit payments to current plan members. Therefore, the long-term assumed investment rate of return was applied to all periods of projected benefit payments to determine the total pension liability.
Presented below is the net pension liability of employers and the state using the current discount rate of 7.60 percent, as well as what the net pension liability would be if it were calculated using a discount rate that is one to three percent lower or one to three percent higher than the current rate:
Discount Rate
Net Pension Liability of Employers and
Nonemployer Contributing Entity (Dollars in Millions)
3% Decrease (4.60%) $ 178,525 2% Decrease (5.60%) 130,573 1% Decrease (6.60%) 91,088 Current Discount Rate (7.60%) 58,437 1% Increase (8.60%) 31,212 2% Increase (9.60%) 8,336 3% Increase (10.60%) (10,959)
4. Funded Status
Teachers’ Health Benefits Fund The funded status of the MPP Program, as of June 30, 2012, the most recent actuarial valuation date, is as follows (dollars in millions):
* As of June 30, 2012, current active members are no longer eligible for future enrollment in the MPP Program. Therefore, the covered payroll is $0 for years 2012 and thereafter.
The above table shows the funded ratio of 0.1 percent from a financial reporting perspective. This ratio is determined using methodology based upon financial reporting requirements, which is different from the methodology used to develop the estimated cost to fund the program.
The estimated amount needed to fully fund the program, $424 million based on the June 30, 2012 actuarial valuation of the MPP Program, has not been transferred to the THBF. The estimated amount of future employer contributions required to fully fund the MPPP is noted as a commitment and is explained further in Note 7.
Methods and Assumptions Actuarial valuations involve estimates of the value of reported amounts and assumptions about the probability of events far into the future, and actuarially determined amounts are subject to continual revision as actual results are compared to past expectations and new estimates are made about the
Actuarial UAAL as Actuarial Accrued a % of Value of Liability Unfunded Funded Covered Covered Assets (AAL) AAL (UAAL) Ratio Payroll * Payroll
(a) (b) (b-a) (a/b) ( c ) ((b-a)/c)
MPP Program 0.4$ 582.1$ 581.7$ 0.1% -$ N/A
NOTES TO THE BASIC FINANCIAL STATEMENTS

61FINANCIAL
California State Teachers’ Retirement System Notes to the Basic Financial Statements
37
future. The required schedule of funding progress immediately following the notes to the financial statements presents multi-year trend information about whether the actuarial value of plan assets is increasing or decreasing over time relative to the actuarial accrued liability for benefits. Calculations are based on the benefits provided under the terms of the plan in effect at the time of each valuation.
Actuarial calculations reflect a long-term perspective and the actuarial methods and assumptions used for valuing the MPPP include techniques that are consistent with the long-term perspective of the calculations.
Additional information as of the latest actuarial valuation follows:
MPP Program Actuarial Cost Method Entry Age Normal Amortization Method Level dollar basis Amortization Period Closed Remaining Amortization Period 24 years Asset Valuation Method Fair value of net assets
Actuarial Assumptions: Investment Rate of Return 4.00% Interest on Accounts Not applicable Wage Growth Not applicable Consumer Price Inflation 3.00% Healthcare Cost Trend Rate Part A Premiums 3.5% Healthcare Cost Trend Rate Part B Premiums 4.5%
5. Deposits and Investments
Money-Weighted Rate of Return For the year ended June 30, 2014, the annual money-weighted rate of return on pension plan investments, net of pension plan investment expenses, was 18.6 percent. The money-weighted rate of return expresses investment performance, net of investment expenses, taking into account the impact of changing amounts actually invested based on financial statement results.
Schedule of Investments CalSTRS is authorized to invest and reinvest the monies to meet the objectives of the Investment Policy and Management Plan as established by the board in accordance with state laws. The table below represents the detailed investments by type within equities, debt securities, alternative investments, and derivatives presented in the Statement of Fiduciary Net Position.
NOTES TO THE BASIC FINANCIAL STATEMENTS

62 CALSTRS COMPREHENSIVE ANNUAL FINANCIAL REPORT 2014
California State Teachers’ Retirement System Notes to the Basic Financial Statements
38
Deposits in the Pooled Money Investment Account (classified under short-term securities), administered by the State Treasurer, represent various investments with approximately 232 average days to maturity and are reported at amortized cost, which approximates fair value. The State Treasury pools these monies with those of other state agencies for investing. Deposits in the Short-term Investment Fund, administered by State Street Bank, represents various investments with approximately 40 average days to maturity and are reported at amortized cost, which approximates fair value.
Repurchase agreement transactions reflected as short term securities as of June 30, 2014, have underlying collateral with fair values of approximately 102 percent of the cost of the repurchase agreement.
State of California statutes and board policies permit CalSTRS to make short-term, collateralized loans of its securities to broker-dealers and other entities in order to earn incremental income. CalSTRS has contracted with third party securities lending agents and its custodian to lend global equity and debt securities. The majority of security loans can be terminated on demand by either CalSTRS or the borrower. The underlying securities on loan are reported as assets on the Statement of Fiduciary Net Position. Collateral in the form of cash or other securities is required for 102 percent and 105 percent of the fair value of domestic securities and international equity securities loaned, respectively. For non-U.S. debt securities loaned, CalSTRS follows market practice which requires collateral of 102 percent of the fair value of the loaned securities. Since the majority of loans are terminable at will, their duration does not generally match the duration of the investments made with the cash collateral. At June 30, 2014, the weighted duration difference between the investments and these loans was 20 days.
At June 30, 2014, the fair value of the securities on loan was $23.2 billion. The securities lending cash collateral obligations were $22.31 billion. The fair value of the re-invested cash collateral was
Schedule of InvestmentsAt June 30, 2014, CalSTRS investments, at fair value, are as follows:(Dollars in Thousands)
InvestmentsState Teachers' Retirement Plan
403(b) Plan
457Plan
Teachers' Health
Benefits
Teachers' Deferred
Compensation Total
Debt Securities 36,512,804$ 197,700$ 6,359$ 1,007$ 1,138$ 36,719,008$ Asset Backed Securities 1,112,916 - - - - 1,112,916 Corporate Bonds 11,671,215 - - - - 11,671,215 Foreign Government Issues 1,021,854 - - - - 1,021,854 Mortgage Backed Securities 8,385,664 - - - - 8,385,664 Municipal Securities 210,452 - - - - 210,452 U.S. Government and Agency Obligations 9,570,378 - - - - 9,570,378 Short Term Securities 4,540,325 16,704 1,001 1,007 1,138 4,560,175 Mutual Funds-Bond Funds - 36,517 996 - - 37,513 Guaranteed Annuity Contracts - 144,479 4,362 - - 148,841
Equity Securities 102,089,006 329,834 10,686 - - 102,429,526Common Stocks 97,040,360 - - - - 97,040,360 Depository Receipts 1,780,231 - - - - 1,780,231 Mutual Funds-Stock Funds 90,542 329,834 10,686 - - 431,062 Preferred Stocks 702,470 - - - - 702,470 Real Estate Investment Trusts 2,475,403 - - - - 2,475,403
Alternative Investments 53,273,293 - - - - 53,273,293 Equity-Privately Held 26,825,092 - - - - 26,825,092 Debt-Privately Held 2,774,955 - - - - 2,774,955 Real Estate-Directly Held 4,487,686 - - - - 4,487,686 Real Estate-Non-Directly Held 19,185,560 - - - - 19,185,560
Derivative Instruments 14,949 - - - - 14,949 Options 13,890 - - - - 13,890 Rights and Warrants 2,661 - - - - 2,661 Swaps (1,602) - - - - (1,602)
Securities Lending Collateral 22,303,191 - - - - 22,303,191 Total Investments 214,193,243$ 527,534$ 17,045$ 1,007$ 1,138$ 214,739,967$
Pension2
NOTES TO THE BASIC FINANCIAL STATEMENTS

63FINANCIAL
California State Teachers’ Retirement System Notes to the Basic Financial Statements
39
$22.30 billion, the non-cash collateral was $1.5 billion and the calculated mark (additional collateral requested for the next business day) was $30.9 million which was due from CalSTRS for securities on loan. The invested collateral and corresponding obligation are reflected in the Statement of Fiduciary Net Position as assets and liabilities, respectively. Due to the decline in the fair value in the re-invested cash collateral, the liability represented by the securities lending cash collateral obligation was greater than the re-invested cash collateral. The re-invested cash collateral securities in this program are typically held to maturity and expected to mature at par.
In accordance with GASB Statement No. 28, Accounting and Financial Reporting on Securities Lending Transactions, the non-cash collateral of $1.5 billion is not reported in the Statement of Fiduciary Net Position because CalSTRS is not permitted to pledge or sell these collateral securities received unless the borrower defaults. The contracts with the securities lending agents require them to indemnify CalSTRS if the borrowers fail to return the securities (or if the collateral is not sufficient to replace the securities lent) or if the borrowers fail to pay CalSTRS for income distributions by the securities’ issuers while the securities are on loan.
CalSTRS has no investment (other than those issued or explicitly guaranteed by the U.S. government) in any one organization that represents 5 percent or more of the STRP’s fiduciary net position at June 30, 2014.
Real Estate Real estate investments are classified as investments in accordance with GASB Statement No. 67, Financial Reporting for Pension Plans. Certain real estate investments are leveraged through partnerships established to purchase properties through a combination of equity contributions from CalSTRS and other investors and through the utilization of debt. CalSTRS engages real estate advisors and operating partners who are responsible for managing a portfolio’s day-to-day activities, performance and reporting. At June 30, 2014 the estimated fair value of real estate investments (net of all outstanding debt) totaled approximately $23.7 billion. The CalSTRS share of outstanding debt is $8.7 billion, excluding obligations of limited partnership interests in commingled funds.
The CalSTRS portion of real estate debt service requirements includes both recourse and non-recourse loans. The chart below details the repayment of real estate debt, excluding obligations of limited partnership interests in commingled funds, as of June 30, 2014:
Real Estate Debt Service Requirements(Dollars in Thousands)
Principal Interest Total
Year Ended June 30, 2015 1,280,028$ 343,054$ 1,623,082$ 2016 1,364,886 288,973 1,653,8592017 1,876,555 241,063 2,117,6182018 1,167,389 140,508 1,307,8972019 417,088 108,423 525,511
2020 - 2024 2,343,317 236,710 2,580,0272025 - 2029 73,105 31,083 104,1882030 - 2034 6,856 28,576 35,4322035 - 2039 85,146 19,104 104,2502040 - Thereafter 58,277 8,219 66,496
Total 8,672,647$ 1,445,713$ 10,118,360$
NOTES TO THE BASIC FINANCIAL STATEMENTS

64 CALSTRS COMPREHENSIVE ANNUAL FINANCIAL REPORT 2014
California State Teachers’ Retirement System Notes to the Basic Financial Statements
40
Real estate debt currently bears interest at fixed and variable rates ranging from 1.5 to 10.6 percentand 1.3 to 10.4 percent, respectively.
In fiscal year 2011-2012, CalSTRS entered into three (3) separate unsecured credit facilities (Master Credit Facility Portfolio). The proceeds from the Master Credit Facility Portfolio provide the source of funds for managing capital flows of investment strategies. As of June 30, 2014, the total available lines of credit in the Master Credit Facility Portfolio were $2.05 billion, an increase of $650 million from prior year. The total principal amount borrowed was $943.8 million and the remaining amount available was $1.11 billion. These lines of credit will mature between October 2014 and May 2017.
The CalSTRS Real Estate Investment Policy, effective June 2014, states that leverage shall be used to enhance investment returns. Careful consideration will be given to the impact of leverage on investment and portfolio risks. Leverage within each segment of the portfolio will be regularly monitored and reported to the board for compliance. At June 30, 2014, the total leverage on the real estate portfolio, excluding obligations of limited partnership interests in commingled funds was 43.9percent. CalSTRS does not have any debt obligations under the real estate limited partnership interests held in comingled funds.
Investment Risk Schedules In accordance with GASB Statement No. 40, CalSTRS discloses several investment risks. The following investment risk schedules disclose CalSTRS investments that are subject to certain types of risks. Among these risks are credit risk, interest rate risk, concentration of credit risk, custodial risk and foreign currency risk. Each schedule discloses the investments managed by CalSTRS subject to each type of risk, with the exception of interest rate risk which excludes Pension2. The policies addressing each risk, discussed in more detail below, are contained within the Investment Policy and Management Plan reviewed and approved annually by the board.
Credit Risk Credit risk is the risk that an issuer or other counterparty to a debt instrument will not fulfill its obligations. This is measured by the assignment of ratings by nationally recognized statistical rating organizations.
CalSTRS Investment Guidelines require that, at the time of purchase, at least 95 percent of the market value of the corporate securities comprising the credit portion of the core fixed income portfolio be rated investment grade as defined by the Barclays U.S. Aggregate Bond Index. The ratings used to determine the quality of the individual securities in the table below are the ratings provided by S&P McGraw Hill Financial. Obligations issued or guaranteed by the U.S. federal government or government-sponsored agencies are eligible without limit. Furthermore, the total position of the outstanding debt of any non-agency mortgage-backed, asset-backed, and commercial mortgage-backed securities issuer shall be limited to 10 percent of the market value of the portfolio, on the basis of each separate trust (pool of assets), at the time of purchase. Obligations of other issuers are not to exceed 5 percent per issuer, at the time of purchase, of the market value of any individual portfolio. The Investment Guidelines also include an allocation to opportunistic strategies, a portion of which are managed externally and which allow for the purchase of bonds rated below investment grade. Limitations on the amount of debt of any one issuer each investment manager may hold are negotiated on a manager by manager basis.
CalSTRS may invest in an unrated security if the security is comparable in quality to other rated securities that are eligible for purchase. The notation NR represents those securities that are not rated and NA represents those securities for which the rating disclosure requirements are not applicable such as obligations of the U.S. government and obligations explicitly guaranteed by the U.S. government.
NOTES TO THE BASIC FINANCIAL STATEMENTS

65FINANCIAL
California State Teachers’ Retirement System Notes to the Basic Financial Statements
41
At June 30, 2014, the fixed income and short term investments are shown by credit rating below:
At June 30, 2014, the securities lending collateral are shown by credit rating below:
Interest Rate Risk Interest rate risk is the risk that changes in interest rates will adversely affect the fair value of an investment.
Investments may contain terms that increase the sensitivity of their fair values to increasing and decreasing interest rates. Although CalSTRS has investments that have an inherent prepayment risk as well as caps, floors, and step-up features, these are mitigated through the diversification of asset classes, security selection, maturity and credit quality.
Debt Securities(Dollars in Thousands)
RatingsAsset Backed
SecuritiesCorporate
Bonds
Foreign Government
Issues
Mortgage Backed
SecuritiesMunicipal Securities
U.S. Government and Agency Obligations
Short Term Securities
Mutual Funds
Annuity Contracts Total
Long Term RatingsAAA 592,578$ 263,476$ 93,943$ 284,832$ 34,560$ -$ -$ 19,662$ -$ 1,289,051$ AA 2,187 1,056,547 138,719 1,825,980 98,630 30,555 - 17,851 - 3,170,469 A 303 3,202,381 164,541 113,803 44,488 - - - - 3,525,516 BBB 8,514 3,463,608 174,577 77,025 9,422 - - - - 3,733,146 BB 5,073 1,205,075 6,153 24,973 - - - - - 1,241,274 B 6,624 1,190,198 3,936 21,845 - - - - - 1,222,603 CCC 4,452 383,903 - 53,695 - - - - - 442,050 CC 9,457 3,093 - 976 - - - - - 13,526 C - 4,820 - - - - - - - 4,820 D - - - 20,833 - - - - - 20,833 NR 483,728 898,114 439,985 5,961,702 23,352 6,635 - - 148,841 7,962,357 NA - - - - - 9,533,188 - - - 9,533,188
Short Term RatingsA-1 -$ -$ -$ -$ -$ -$ 75,140$ -$ -$ 75,140$ NR - - - - - - 4,107,834 - - 4,107,834 NA - - - - - - 377,201 - - 377,201 Total 1,112,916$ 11,671,215$ 1,021,854$ 8,385,664$ 210,452$ 9,570,378$ 4,560,175$ 37,513$ 148,841$ 36,719,008$
Securities Lending Collateral(Dollars in Thousands)
RatingsAsset Backed
SecuritiesCorporate
Bonds
Foreign Government
Issues
Mortgage Backed
Securities
U.S. Government and Agency Obligations
Short Term Securities Total
Long Term RatingsAAA 3,382,280$ -$ 100,027$ 56,345$ -$ -$ 3,538,652$ AA 111,657 2,872,566 10,008 104,963 - - 3,099,194A 322 1,072,522 - 18,316 - - 1,091,160BBB 696 32,500 - 10,679 - - 43,875 BB 242 - - - - - 242 CCC 2,298 - - - - - 2,298 CC 444 - - - - - 444 D - - - 9,393 - - 9,393 NR 1,721,549 790,336 - 270,028 - - 2,781,913
Short Term RatingsA-1 -$ -$ -$ -$ -$ 304,119$ 304,119$ NR - - - - - 11,507,314 11,507,314Total 5,219,488$ 4,767,924$ 110,035$ 469,724$ -$ 11,811,433$ 22,378,604$Cash and accruals totaling -$75,413 (in thousands) are not included in the total above but are included in the Securities Lending Collateral line item in the Statement of Fiduciary Net Position.
NOTES TO THE BASIC FINANCIAL STATEMENTS
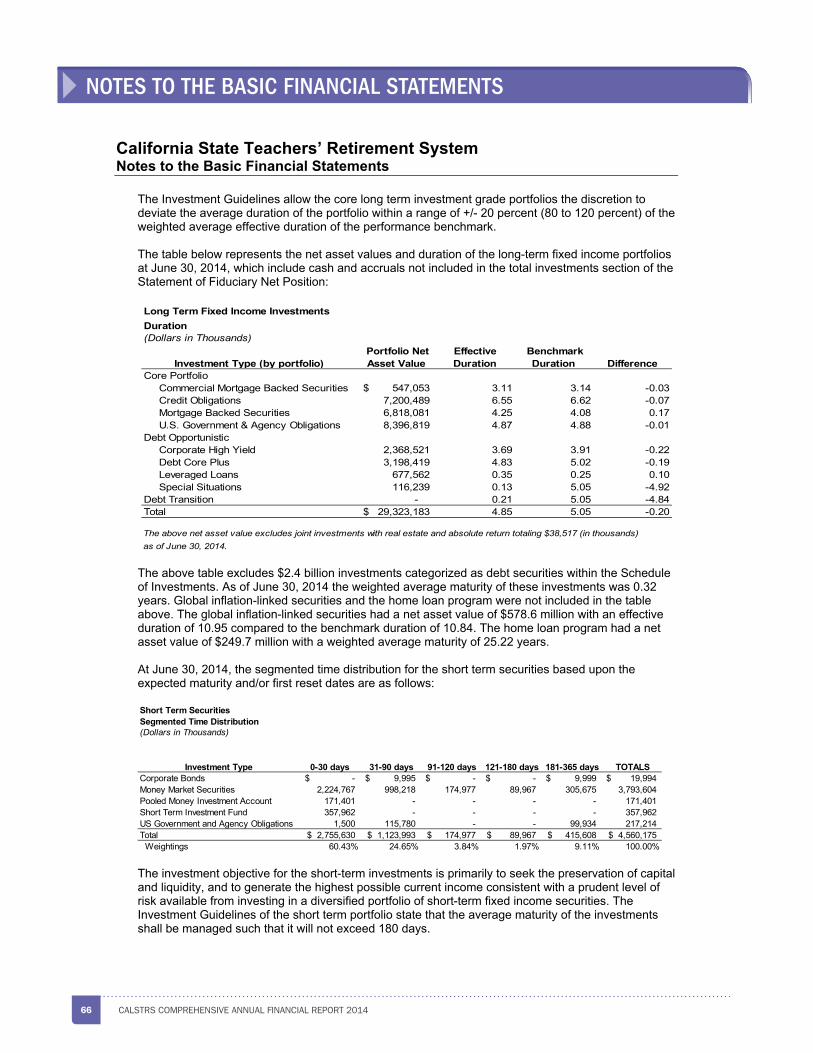
66 CALSTRS COMPREHENSIVE ANNUAL FINANCIAL REPORT 2014
California State Teachers’ Retirement System Notes to the Basic Financial Statements
42
The Investment Guidelines allow the core long term investment grade portfolios the discretion to deviate the average duration of the portfolio within a range of +/- 20 percent (80 to 120 percent) of the weighted average effective duration of the performance benchmark.
The table below represents the net asset values and duration of the long-term fixed income portfolios at June 30, 2014, which include cash and accruals not included in the total investments section of the Statement of Fiduciary Net Position:
The above table excludes $2.4 billion investments categorized as debt securities within the Schedule of Investments. As of June 30, 2014 the weighted average maturity of these investments was 0.32 years. Global inflation-linked securities and the home loan program were not included in the table above. The global inflation-linked securities had a net asset value of $578.6 million with an effective duration of 10.95 compared to the benchmark duration of 10.84. The home loan program had a net asset value of $249.7 million with a weighted average maturity of 25.22 years.
At June 30, 2014, the segmented time distribution for the short term securities based upon the expected maturity and/or first reset dates are as follows:
The investment objective for the short-term investments is primarily to seek the preservation of capital and liquidity, and to generate the highest possible current income consistent with a prudent level of risk available from investing in a diversified portfolio of short-term fixed income securities. The Investment Guidelines of the short term portfolio state that the average maturity of the investments shall be managed such that it will not exceed 180 days.
Long Term Fixed Income InvestmentsDuration(Dollars in Thousands)
Investment Type (by portfolio)Portfolio Net Asset Value
Effective Duration
Benchmark Duration Difference
Core PortfolioCommercial Mortgage Backed Securities 547,053$ 3.11 3.14 -0.03Credit Obligations 7,200,489 6.55 6.62 -0.07Mortgage Backed Securities 6,818,081 4.25 4.08 0.17U.S. Government & Agency Obligations 8,396,819 4.87 4.88 -0.01
Debt OpportunisticCorporate High Yield 2,368,521 3.69 3.91 -0.22Debt Core Plus 3,198,419 4.83 5.02 -0.19Leveraged Loans 677,562 0.35 0.25 0.10Special Situations 116,239 0.13 5.05 -4.92
Debt Transition - 0.21 5.05 -4.84Total 29,323,183$ 4.85 5.05 -0.20
The above net asset value excludes joint investments with real estate and absolute return totaling $38,517 (in thousands)as of June 30, 2014.
Short Term SecuritiesSegmented Time Distribution(Dollars in Thousands)
Investment Type 0-30 days 31-90 days 91-120 days 121-180 days 181-365 days TOTALS Corporate Bonds -$ 9,995$ -$ -$ 9,999$ 19,994$ Money Market Securities 2,224,767 998,218 174,977 89,967 305,675 3,793,604 Pooled Money Investment Account 171,401 - - - - 171,401 Short Term Investment Fund 357,962 - - - - 357,962 US Government and Agency Obligations 1,500 115,780 - - 99,934 217,214 Total 2,755,630$ 1,123,993$ 174,977$ 89,967$ 415,608$ 4,560,175$ Weightings 60.43% 24.65% 3.84% 1.97% 9.11% 100.00%
NOTES TO THE BASIC FINANCIAL STATEMENTS
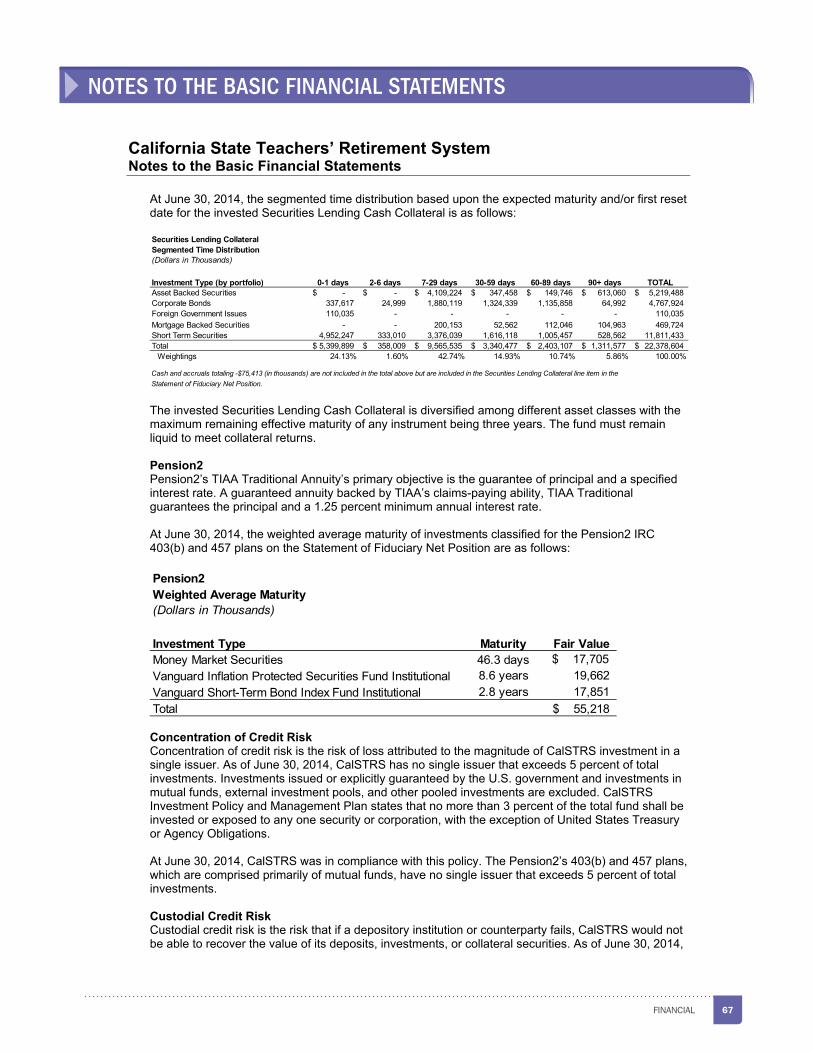
67FINANCIAL
California State Teachers’ Retirement System Notes to the Basic Financial Statements
43
At June 30, 2014, the segmented time distribution based upon the expected maturity and/or first reset date for the invested Securities Lending Cash Collateral is as follows:
The invested Securities Lending Cash Collateral is diversified among different asset classes with the maximum remaining effective maturity of any instrument being three years. The fund must remain liquid to meet collateral returns.
Pension2 Pension2’s TIAA Traditional Annuity’s primary objective is the guarantee of principal and a specified interest rate. A guaranteed annuity backed by TIAA’s claims-paying ability, TIAA Traditional guarantees the principal and a 1.25 percent minimum annual interest rate.
At June 30, 2014, the weighted average maturity of investments classified for the Pension2 IRC 403(b) and 457 plans on the Statement of Fiduciary Net Position are as follows:
Concentration of Credit Risk Concentration of credit risk is the risk of loss attributed to the magnitude of CalSTRS investment in a single issuer. As of June 30, 2014, CalSTRS has no single issuer that exceeds 5 percent of total investments. Investments issued or explicitly guaranteed by the U.S. government and investments in mutual funds, external investment pools, and other pooled investments are excluded. CalSTRS Investment Policy and Management Plan states that no more than 3 percent of the total fund shall be invested or exposed to any one security or corporation, with the exception of United States Treasury or Agency Obligations.
At June 30, 2014, CalSTRS was in compliance with this policy. The Pension2’s 403(b) and 457 plans, which are comprised primarily of mutual funds, have no single issuer that exceeds 5 percent of total investments.
Custodial Credit Risk Custodial credit risk is the risk that if a depository institution or counterparty fails, CalSTRS would not be able to recover the value of its deposits, investments, or collateral securities. As of June 30, 2014,
Securities Lending CollateralSegmented Time Distribution(Dollars in Thousands)
Investment Type (by portfolio) 0-1 days 2-6 days 7-29 days 30-59 days 60-89 days 90+ days TOTAL Asset Backed Securities -$ -$ 4,109,224$ 347,458$ 149,746$ 613,060$ 5,219,488$ Corporate Bonds 337,617 24,999 1,880,119 1,324,339 1,135,858 64,992 4,767,924Foreign Government Issues 110,035 - - - - - 110,035Mortgage Backed Securities - - 200,153 52,562 112,046 104,963 469,724Short Term Securities 4,952,247 333,010 3,376,039 1,616,118 1,005,457 528,562 11,811,433Total 5,399,899$ 358,009$ 9,565,535$ 3,340,477$ 2,403,107$ 1,311,577$ 22,378,604$
Weightings 24.13% 1.60% 42.74% 14.93% 10.74% 5.86% 100.00%
Cash and accruals totaling -$75,413 (in thousands) are not included in the total above but are included in the Securities Lending Collateral line item in the Statement of Fiduciary Net Position.
Pension2Weighted Average Maturity(Dollars in Thousands)
Investment Type Maturity Fair ValueMoney Market Securities 46.3 days $ 17,705 Vanguard Inflation Protected Securities Fund Institutional 8.6 years 19,662 Vanguard Short-Term Bond Index Fund Institutional 2.8 years 17,851 Total 55,218$
NOTES TO THE BASIC FINANCIAL STATEMENTS

68 CALSTRS COMPREHENSIVE ANNUAL FINANCIAL REPORT 2014
California State Teachers’ Retirement System Notes to the Basic Financial Statements
44
all of CalSTRS non-cash investments, other than Pension2 investments, are held in CalSTRS name and/or CalSTRS nominee name and are not exposed to custodial credit risk. Cash held with the master custodian is insured up to $250,000 under the Federal Deposit Insurance Corporation (FDIC) general deposit insurance rules. CalSTRS does not have a general policy relating to custodial credit risk.
As of June 30, 2014, 100 percent of the Pension2’s 403(b) and 457 plans are held in the name of TIAA-CREF.
Foreign Currency Risk Foreign currency risk is the risk that changes in exchange rates will adversely affect the fair value of an investment or a deposit.
At June 30, 2014, CalSTRS investments in foreign currencies are as follows:
Foreign Currency Risk(Dollars in Thousands)
(In U.S. Dollar Equivalents)
Currency Name Cash Equity Fixed IncomeSpot
ContractsForward
Contracts Total ExposureArgentine Peso $ - $ - $ - -$ (12)$ (12)$ Australian Dollar 6,651 1,810,156 18,273 (2) (288) 1,834,790 Brazilian Real 3,946 648,957 39,427 150 (305) 692,175 Canadian Dollar 24,308 2,395,356 32,748 (8) (2,336) 2,450,068 Chilean Peso 9 35,634 - - (68) 35,575 Colombian Peso 4 10,959 - - 5 10,968 Czech Koruna 2 42,264 - 1 (295) 41,972 Danish Krone 23 472,322 - - - 472,345 Egyptian Pound 428 2,854 - - (7) 3,275 Euro Currency 128,756 12,758,657 336,123 62 (2,069) 13,221,529 Hong Kong Dollar 10,416 1,462,638 - - - 1,473,054 Hungarian Forint 26 33,094 - - (433) 32,687 Indian Rupee 1,151 395,602 - - (1,265) 395,488 Indonesian Rupiah 947 232,360 - (1) 413 233,719 Israeli Shekel 447 88,236 - - (59) 88,624 Japanese Yen 48,772 5,225,198 10,375 (5) (28) 5,284,312 Kazakhstan Tenge - - - - 28 28 Malaysian Ringgit 355 138,894 - (2) 38 139,285 Mexican Peso 2,230 246,066 56,850 (2) 296 305,440 Moroccan Dirham - - - - 121 121 New Romanian Leu - - - - 51 51 New Russian Ruble 131 - - - 329 460 New Taiwan Dollar 7,895 615,313 - - 117 623,325 New Zealand Dollar 828 42,447 30,646 14 1,176 75,111 Nigerian Naira - - - - 96 96 Norwegian Krone 3,212 225,813 - - (1,742) 227,283 Pakistan Rupee - 26,848 - - - 26,848 Peruvian Nouveau Sol 2 1,418 - - (57) 1,363 Philippine Peso 180 80,635 - - (94) 80,721 Polish Zloty 1,095 79,605 7,357 - 169 88,226 Pound Sterling 27,772 5,462,071 226,743 65 9 5,716,660 Singapore Dollar 2,643 396,779 - - (506) 398,916 South African Rand 844 443,296 - (1) 108 444,247 South Korean Won 342 1,184,224 - 106 60 1,184,732 Swedish Krona 4,792 704,647 5,709 (2) 288 715,434 Swiss Franc 625 2,108,223 967 (20) (269) 2,109,526 Thailand Baht 238 197,447 - (36) 16 197,665 Turkish Lira 278 203,659 - - 117 204,054 Yuan Renminbi - - - 26 (92) (66) Total 279,348$ 37,771,672$ 765,218$ 345$ (6,488)$ 38,810,095$
NOTES TO THE BASIC FINANCIAL STATEMENTS

69FINANCIAL
California State Teachers’ Retirement System Notes to the Basic Financial Statements
45
CalSTRS investments denominated in foreign currencies are reported within debt securities, equity securities, alternative investments, derivative instruments and investment receivables and/or payables on the Statement of Fiduciary Net Position.
Foreign currency is comprised of international investment proceeds and income to be repatriated into U.S. dollars and funds available to purchase international securities. Foreign currency is held temporarily in foreign accounts until it is able to be repatriated or expended.
In accordance with the Investment Policy and Management Plan, CalSTRS has established a strategic allocation to non-dollar public and private equity assets (i.e. private equity investments and real estate). Considering this commitment to non-dollar assets and the impact currency fluctuations can have on the total return of dollar-based investors, CalSTRS has recognized the need to implement strategies designed to address the management of currency risk. CalSTRS believes that its Currency Management Program should emphasize the protection of the value of its non-dollar public and private equity assets against a strengthening U.S. dollar first, yet recognizes that there also exists opportunities for alpha generation (the ability to derive a return in excess of a market return) within the currency markets.
CalSTRS fixed income staff has management and/or oversight responsibilities for the Currency Management Program. The position range has been designed to allow for some degree of symmetry around the underlying exposure to the foreign denominated assets within CalSTRS in order to both protect the translation value of the assets against a strengthening U.S. dollar and to enhance returns in a declining U.S. dollar environment. As a result, the position range shall be -25 percent to 50 percent of the total notional value (in U.S. Dollars) of the non-U.S. public and non-U.S. private (i.e. Private Equity and Real Estate) equity portfolios.
As of June 30, 2014, the Pension2’s 403(b) and 457 plans are not exposed to foreign currency risk.
Derivative Instruments As of June 30, 2014, the derivative instruments held by CalSTRS are considered investments and not hedges for accounting purposes. The term hedging, as it is used elsewhere in the notes to these financial statements, denotes an economic activity and not an accounting method. The gains and losses arising from this activity are recognized as incurred in the Statement of Changes in Fiduciary Net Position.
All investment derivatives discussed below are included within the Investment Risk Schedules, which precede this section. Investments in derivative instruments are disclosed separately to provide a comprehensive and distinct view of this activity and its impact on the overall investment portfolio.
NOTES TO THE BASIC FINANCIAL STATEMENTS

70 CALSTRS COMPREHENSIVE ANNUAL FINANCIAL REPORT 2014
California State Teachers’ Retirement System Notes to the Basic Financial Statements
46
The table below presents the related net appreciation (depreciation) in fair value, the fair value amounts and the notional amounts of derivative instruments outstanding at June 30, 2014:
At June 30, 2014, all derivatives are reported as Derivative Instruments with the exception of foreign currency forward contracts, which are reported as net receivable or payable on the Statement of Fiduciary Net Position.
Counterparty Credit Risk The table below depicts the counterparty credit ratings of CalSTRS non-exchange traded investment derivative instruments outstanding and subject to loss at June 30, 2014. The ratings used to determine the quality of the individual counterparty are the S&P ratings.
The aggregate fair value of investment derivative instruments in an asset position subject to counterparty credit risk at June 30, 2014 was $19.9 million. This represents the maximum loss that would be recognized at the reporting date if all counterparties failed to perform as contracted.
CalSTRS may enter into a master netting arrangement with a counterparty. In the event of default or early termination, the master agreement permits the non-defaulting party the right to close-out all transactions in a single net settlement to one net amount payable by one counterparty to the other. At June 30, 2014, there were assets of $14.1 million, including cash collateral held by CalSTRS, and liabilities of $14.4 million from non-exchange traded derivatives subject to master netting agreements.
At June 30, 2014, CalSTRS did not have any significant exposure to counterparty credit risk with any single party.
Investment Derivative Disclosure(Dollars in Thousands)
Classification Amount Amount
Investment Derivatives InstrumentsCommodities Futures Investment Income / (Loss) 5,373$ -$ 37,838 Credit Default Swaps Investment Income / (Loss) (1,285) (1,602) 52,451 Interest Rate Swaps Investment Income / (Loss) (131) - - Foreign Currency Forwards Investment Income / (Loss) (31,217) (6,488) 4,785,947Futures (Domestic and Foreign) Investment Income / (Loss) 144,649 - 313,175 Options Investment Income / (Loss) (38,858) 13,890 976,819 Rights Investment Income / (Loss) 335 1,866 4,038 SharesWarrants Investment Income / (Loss) 814 795 396 Shares
Total Derivative Instruments 79,680$ 8,461$
The total options amount of $13,890 is comprised of options bought and options written of $14,261 and $(371), respectively. (Dollars in Thousands)
Fair Value at June 30, 2014Net Appreciation (Depreciation) in Fair Value of
Investments through June 30, 2014
Notional (Amounts / Shares)
Counterparty Credit Rating(Dollars in Thousands)
RatingsCredit Default
SwapsFixed Income
Option BoughtForeign Currency
Forwards TotalA 1,199$ 13,780$ 4,895$ 19,874$ Subtotal Investments in Asset Position 1,199$ 13,780$ 4,895$ 19,874$ Investments in Liability Position (2,801) - (11,383) (14,184) Total Investments in Asset / (Liability) Position (1,602)$ 13,780$ (6,488)$ 5,690$ The counterparty credit exposure for similar instruments with the same counterparty is netted for presentation purposes.
NOTES TO THE BASIC FINANCIAL STATEMENTS

71FINANCIAL
California State Teachers’ Retirement System Notes to the Basic Financial Statements
47
Custodial Credit Risk The custodial credit risk disclosure for exchange traded derivative instruments is made in accordance with the custodial credit risk disclosure requirements of GASB Statement 40. At June 30, 2014, all of CalSTRS investments in derivative instruments, other than Pension2 investments, are held in CalSTRS name or CalSTRS nominee name and/or are not exposed to custodial credit risk as of June 30, 2014.
Interest Rate Risk At June 30, 2014, CalSTRS is exposed to interest rate risk on its derivative instruments described below by maturity period.
Interest rate swaps are highly sensitive to changes in interest rates. The table below details the reference rate, fair value and notional amount of these derivative instruments:
Foreign Currency Risk At June 30, 2014, CalSTRS is exposed to foreign currency risk on its investments in options, rights, warrants, and forward contracts in foreign currencies.
Investment Maturities(Dollars in Thousands)
Investment Type Fair Value Less Than 1 1 - 5 6 - 10 More than 10Credit Default Swaps Bought (3,125)$ -$ (3,125)$ -$ -$ Credit Default Swaps Written 1,523 - 1,461 62 - Fixed Income Options 13,780 - - 13,780 - Total 12,178$ -$ (1,664)$ 13,842$ -$
Investment Maturities (in years)
Derivative Instruments Highly Sensitive to Interest Rate Changes(Dollars in Thousands)
Investment Type Reference Rate Fair Value NotionalFixed Income Options Bought 5YR RTP SWAPTION DEC20 4.825 PUT 5,230$ 250,000$ Fixed Income Options Bought 10YR RTP SWAPTION MAR21 5.0275 6,500 200,000 Fixed Income Options Bought 10YR RTP SWAPTION DEC20 5.77 PUT 2,050 100,000 Total 13,780$ 550,000$
NOTES TO THE BASIC FINANCIAL STATEMENTS

72 CALSTRS COMPREHENSIVE ANNUAL FINANCIAL REPORT 2014
California State Teachers’ Retirement System Notes to the Basic Financial Statements
48
At June 30, 2014, the net unrealized loss on the foreign currency forward contracts was $6.5 million.
Contingent Features At June 30, 2014, CalSTRS held no positions in derivatives containing contingent features.
Investment Allocation Policy In accordance with GASB Statement No. 67, CalSTRS discloses Investment policies pertaining to asset allocation and changes to any significant Investment policies. The board approves the allocation of investment assets as described in the board policy manual. The key goal of the asset allocation process is to develop an asset allocation policy that maximizes the likelihood that an investment portfolio’s assets will, over the planning horizon, fund plan benefits. CalSTRS conducts an asset allocation study every three years, or more frequently if there is a significant change in the liabilities or assets. The asset allocation study involves a comprehensive review of the financial condition of the plan, including the actuarial requirements of the plan, such as future benefit payments
Foreign Currency Risk(Dollars in Thousands)
(In U.S. Dollar Equivalents)
Currency Name Options Rights Warrants Net Receivables Net Payables Total ExposureArgentine Peso -$ -$ -$ -$ (12)$ (12)$ Australian Dollar 60 - - 2,525 (2,813) (228) Brazilian Real - - - 1,995 (2,300) (305) Canadian Dollar - - - 2,863 (5,199) (2,336) Chilean Peso - - - - (68) (68) Colombian Peso - - - 32 (27) 5 Czech Koruna - - - 62 (357) (295) Egyptian Pound - - - - (7) (7) Euro Currency 302 1,516 703 2,303 (4,372) 452 Hong Kong Dollar - 128 11 - - 139 Hungarian Forint - - - - (433) (433) Indian Rupee - - - - (1,265) (1,265) Indonesian Rupiah - - - 413 - 413 Israeli Shekel - - - 238 (297) (59) Japanese Yen - - - 1,516 (1,544) (28) Kazakhstan Tenge - - - 28 - 28 Malaysian Ringgit - 108 - 38 - 146 Mexican Peso - - - 296 - 296 Moroccan Dirham - - - 121 - 121 New Romanian Leu - - - 51 - 51 New Russian Ruble - - - 361 (32) 329 New Taiwan Dollar - - - 128 (11) 117 New Zealand Dollar - - - 1,716 (540) 1,176 Nigerian Naira - - - 96 - 96 Norwegian Krone - - - 773 (2,515) (1,742) Peruvian Nouveau Sol - - - 12 (69) (57) Philippine Peso - - - 49 (143) (94) Polish Zloty - - - 232 (63) 169 Pound Sterling - - - 1,964 (1,955) 9 Singapore Dollar - - - 167 (673) (506) South African Rand - - - 362 (254) 108 South Korean Won - 67 - 412 (352) 127 Swedish Krona - - - 300 (12) 288 Swiss Franc - - - 762 (1,031) (269) Thailand Baht - - - 16 - 16 Turkish Lira - - - 204 (87) 117 Yuan Renminbi - - - 17 (109) (92) Total 362$ 1,819$ 714$ 20,052$ (26,540)$ (3,593)$
Currency Forward Contracts
NOTES TO THE BASIC FINANCIAL STATEMENTS

73FINANCIAL
California State Teachers’ Retirement System Notes to the Basic Financial Statements
49
and expected cash flow of contributions. In conjunction with the long-term strategic target, a range for each asset class has been established to provide flexibility designed to reduce rebalancing costs and adapt to changing market conditions.
The following table displays the previous and current board-approved target allocation, the policy range, and the actual allocation for the Defined Benefit and Defined Benefit Supplement Programs per the portfolio allocation and management structure as of June 30, 2014:
Effective July 1, 2013, the board approved the Investment Policy and Management Plan changing the asset allocation ranges, and the asset class name of Overlay to Absolute Return.
6. Contingencies
CalSTRS is involved in litigation relating to various matters. In the opinion of management, after consultation with legal counsel, the outcome of these matters is not expected to have a material adverse effect on CalSTRS financial statements.
7. Commitments
In connection with the purchase of partnership interests under various investment portfolios, CalSTRS has remaining unfunded commitments of approximately $15.8 billion at June 30, 2014. The following table depicts the unfunded commitments by asset strategy:
Unfunded CommitmentsAsset Strategy (Dollars in Thousands) Corporate Governance $ 314,687 Fixed Income 5,484 Infrastructure 498,221 Innovation 88,846 Private Equity 7,872,120 Real Estate 7,044,974
Total $ 15,824,332
CalSTRS has entered into agreements through its Credit Enhancement Program to provide credit support and/or liquidity support on certain debt securities. At June 30, 2014, CalSTRS had commitments of approximately $999.7 million expiring through March 2017. CalSTRS is paid a fee over the term of such agreements and earned approximately $8.5 million for the period ended June 30, 2014.
Asset Class
Previous Target Allocation as of June 30, 2013
Current Target Allocation as of June 30, 2014 Policy Range
Actual Allocation as of June 30, 2014
Global Equity 53.0% 55.0% +/- 6% 57.3%Fixed Income 20.0% 17.0% +/- 3% 15.5%Real Estate 12.0% 13.0% +/- 3% 11.7%Private Equity 12.0% 13.0% +/- 3% 11.5%Cash / Liquidity 1.0% 1.0% +/- 3% 2.5%Inflation Sensitive 2.0% 1.0% +/- 3% 0.7%Absolute Return - - +/- 3% 0.8%Total Asset Allocation 100.0% 100.0% 100.0%
NOTES TO THE BASIC FINANCIAL STATEMENTS

74 CALSTRS COMPREHENSIVE ANNUAL FINANCIAL REPORT 2014
California State Teachers’ Retirement System Notes to the Basic Financial Statements
50
Medicare Premium Payment Program (MPP program)Under current board policy, the assets set aside from the future employer contributions to fund the MPP Program are equal to its actuarial obligation less the value of any assets already in the THBF. As of the June 30, 2013, actuarial valuation for the Defined Benefit Program, the future employer contributions committed to funding the MPP Program obligations total $420 million.
8. New Accounting Pronouncements
GASB Statement No. 65, Items Previously Reported as Assets and Liabilities, establishes accounting and financial reporting standards that reclassify, as deferred outflows of resources or deferred inflows of resources, certain items that were previously reported as assets and liabilities and recognizes, as outflows of resources or inflows of resources, certain items that were previously reported as assets and liabilities. The provisions of this statement have been implemented in the financial statements for the fiscal year ending June 30, 2014.
GASB Statement No. 67, Financial Reporting for Pension Plans—an amendment of GASB Statement No. 25, will improve financial reporting primarily through enhanced note disclosures and schedules of required supplementary information that will be presented by the pension plans that are within its scope. The new information will enhance the decision-usefulness of the financial reports of these pension plans, their value for assessing accountability, and their transparency by providing information about measures of net pension liabilities and explanations of how and why those liabilities changed from year to year. The provisions of this statement have been implemented in the financial statements for the fiscal year ending June 30, 2014.
GASB Statement No. 68, Accounting and Financial Reporting for Pensions—an amendment of GASB Statement No. 27, will improve the decision-usefulness of information in employer and governmental nonemployer contributing entity financial reports and will enhance its value for assessing accountability and interperiod equity by requiring recognition of the entire net pension liability and a more comprehensive measure of pension expense. Decision-usefulness and accountability also will be enhanced through new note disclosures and required supplementary information. The comparability of reported pension information also will be improved by the changes related to the attribution method used to determine service cost and the total pension liability, requirements for immediate recognition in pension expense of certain items, and the establishment of standardized expense recognition periods for amounts reported as deferred outflows of resources and deferred inflows of resources related to pensions. The provisions of this statement are effective for financial statements for periods beginning after June 15, 2014. Management is evaluating GASB Statement No. 68 and its impact to CalSTRS financial reporting and is working with the state and school districts in implementing it in their financial statements for the fiscal year ending June 30, 2015.
GASB Statement No. 69, Government Combinations and Disposals of Government Operations, will improve financial reporting by providing clarification on the accounting for these transactions. The provisions of this statement are effective for government combinations and disposals of government operations occurring in financial reporting periods beginning after December 15, 2013, and should be applied on a prospective basis. Management has evaluated GASB Statement No. 69 and determined this statement does not have an impact on CalSTRS financial reporting.
GASB Statement No. 70, Accounting and Financial Reporting for Nonexchange Financial Guarantees, improves accounting and financial reporting by state and local governments that extend and receive nonexchange financial guarantees. The provisions of this statement are effective for financial statements for reporting beginning after June 15, 2013. Management has evaluated GASB Statement No. 70 and determined the amendments made through this statement do not have an impact on CalSTRS financial reporting.
GASB Statement No. 71, Pension Transition for Contributions Made Subsequent to the Measurement Date—an amendment of GASB Statement No. 68, eliminates the source of a potential
NOTES TO THE BASIC FINANCIAL STATEMENTS

75FINANCIAL
California State Teachers’ Retirement System Notes to the Basic Financial Statements
51
understatement of restated beginning net position and expense in the first year of implementation of GASB Statement No. 68 in the accrual-basis financial statements of employers and nonemployer contributing entities by requiring that, at transition, a government recognize a beginning deferred outflow of resources for its pension contributions, if any, made subsequent to the measurement date of the beginning net pension liability. The provisions of this statement are required to be applied simultaneously with the provisions of GASB Statement No. 68, which are effective for financial statements for periods beginning after June 15, 2014. Management is evaluating GASB Statement No. 71 and its impact to CalSTRS financial reporting and is working with the state and school districts in implementing it in their financial statements for the fiscal year ending June 30, 2015.
NOTES TO THE BASIC FINANCIAL STATEMENTS

76 CALSTRS COMPREHENSIVE ANNUAL FINANCIAL REPORT 2014
52
Required Supplementary Information—Unaudited

77FINANCIAL
California State Teachers' Retirement SystemSchedule of Changes in Net Pension Liability of Employers and Nonemployer Contributing Entity (Dollars in Millions) Schedule I
53
1) This is a 10-year schedule. However, the information in this schedule is not required to be presented retroactively. Years will added to this schedule in future fiscal years until 10 years of information is available.
State Teachers' Retirement Plan
Year ended June 30 1 2014
Total Pension LiabilityService Cost 5,338$ Interest 17,822 Changes of benefit terms - Differences between expected and actual experience - Changes of assumptions - Benefit payments, including refunds of member contributions (12,035) Net change in total pension liability 11,125$
Total pension liability—beginning 237,786 Total pension liability—ending (a) 248,911$
Plan fiduciary net positionContributions- member 2,264 Contributions- employer 2,272 Contributions- state 1,383 Net investment income 30,402 Other income 2 Benefit payments, including refunds of member contributions (12,035) Administrative expense (154) Other expenses (9) Net change in plan fiduciary net position 24,125$
Plan fiduciary net position—beginning 166,349 Plan fiduciary net position—ending (b) 190,474$
Net pension liability (asset) of employersand the state—ending (a) - (b) 58,437$
SCHEDULE OF CHANGES IN NET PENSION LIABILITY OF EMPLOYERS AND NONEMPLOYER CONTRIBUTING ENTITY

78 CALSTRS COMPREHENSIVE ANNUAL FINANCIAL REPORT 2014
California State Teachers' Retirement SystemSchedule of Net Pension Liability of Employers and Nonemployer Contributing Entity (Dollars in Millions) Schedule II
54
1) This is a 10-year schedule. However, the information in this schedule is not required to be presented retroactively. Years will added to this schedule in future fiscal years until 10 years of information is available.
State Teachers' Retirement Plan
Year Ended
June 30 1
Total Pension Liability
(a)
Plan Fiduciary Net
Position(b)
Net Pension Liability (Asset) of Employers and the
State(a - b)
Plan Fiduciary Net Position as a Percentage of Total Pension
Liability(b/a)
Covered-Employee
Payroll(c)
Net Pension Liability (Asset) of Employers and the
State as a Percentage of
Covered-Employee Payroll (a-b)/c
2014 248,911$ 190,474$ 58,437$ 77% 27,486$ 213%
SCHEDULE OF NET PENSION LIABILITY OF EMPLOYERS ANDNONEMPLOYER CONTRIBUTING ENTITY

79FINANCIAL
California State Teachers' Retirement SystemSchedule of Contributions from Employers and Nonemployer Contributing Entity (Dollars in Millions) Schedule III
55
The information presented in this schedule for the State Teachers' Retirement Plan is required for defined benefit pension plans.
1) This is a 10-year schedule. However, the information in this schedule is not required to be presented retroactively because CalSTRS has not previously determined the actuarially determined contribution for the STRP. Years will added to this schedule in future fiscal years until 10 years of information is available.
2) Excludes $14.5 million in contributions to separately finance specific liabilities of an individual employer, such as benefit enhancements.
3) Includes employer contributions under Education Code sections 22711, 22713, 22905, 22950, 22951, 24260, and 26503, as well as Government Code section 7522.
4) Includes state contributions under Education Code sections 22954 and 22955, as well as Public Resources Code section 6217.
The information presented in this schedule for the Teachers' Health Benefit Fund is required for other postemployment benefit plans.
1) The ARCs for 2010, 2012, and 2014 were based on a roll-forward of figures from the June 30, 2008, June 30, 2010 and June 30, 2012 valuations respectively.
State Teachers' Retirement Plan
Year Ended June 30 (1)
Actuarially Determined
Contributions(a)
Legally Required Contributions for Employers and
State
Employer Contributions (2)(3)
(b)
State Contributions (4)
(c)
Total Contributions
(b + c)
Contribution Deficiency
(excess)a - (b + c)
Covered-Employee
Payroll(d)
Contributions as % of Covered-
Employee Payroll(b + c)/d
2014 7,158$ 3,641$ 2,258$ 1,383$ 3,641$ 3,517$ 27,486$ 13%
Teachers' Health Benefit Fund
Year Ended June 30
Annual Required Contribution
(a)
Employer Contributions
(b)
State Contributions
(c)
Total Contributions
(b + c)
Percentage Contributed
(b + c)/a
2014 (1) 38$ 33$ $ - 33$ 87%2013 38 35 - 35 92%2012 (1) 57 35 - 35 61%2011 57 36 - 36 63%2010 (1) 64 32 - 32 50%2009 62 30 - 30 48%
Medicare Premium Payment Program
SCHEDULE OF CONTRIBUTIONS FROM EMPLOYERS ANDNONEMPLOYER CONTRIBUTING ENTITY

80 CALSTRS COMPREHENSIVE ANNUAL FINANCIAL REPORT 2014
SCHEDULE OF CONTRIBUTIONS FROM EMPLOYERS & OTHER CONTRIBUTING ENTITIES
California State Teachers' Retirement SystemSchedule of Contributions from Employers and Nonemployer Contributing Entity Schedule III (Continued)
56
Changes of benefit terms The California Pension Employees’ Pension Reform Act of 2013 (PEPRA) resulted in a new benefit formula, CalSTRS 2% at 62, for members first hired on or after January 1, 2013, to perform service that could be creditable to CalSTRS. Significant changes compared to the CalSTRS 2% at 60 benefit formula include raising the normal retirement age from 60 to 62 and placing a limit on creditable compensation to 120 percent of the Social Security wage base, annually adjusted for changes in the Consumer Price Index. See Note 1 for more information on CalSTRS 2% at 62 benefit formula.
Changes of assumptions There were no changes in major assumptions from the June 30, 2012, actuarial valuation.
Method and assumptions used in calculations of actuarially determined contributions The following actuarial methods and assumptions were used to determine the actuarially determined contribution for the STRP and the annual required contribution for the MPP Program presented in the Schedule of Contributions from Employers and Nonemployer Contributing Entity:
State Teachers’ Retirement Plan1
MPP Program
Actuarial Cost Method Entry Age Normal Entry Age Normal Amortization Method Level percent of payroll basis Level dollar basis Amortization Period Open Closed Remaining Amortization Period 30 years 24 years
Asset Valuation Method Expected value with 33% adjustment to market value Fair market value of net assets
Actuarial Assumptions: Investment Rate of Return 7.50%2 4.00% Interest on Accounts 4.50% Not applicable Wage Growth 3.75% Not applicable Consumer Price Inflation 3.00% 3.00% Post-retirement Benefit Increases 2.00% simple Not applicable Healthcare Cost Trend Rate Part A Premiums Not applicable 3.5%
Healthcare Cost Trend Rate Part B Premiums Not applicable 4.5%
1) The assumptions shown above are for the actuarially determined contributions (ADC) of the DB Program. For the portion of the STRP ADC attributable to the DBS, CBB and SBMA Programs, contributions recognized on an accrual basis for the current year have been used.
2) The actuarially determined contribution is a funding amount, which is calculated using a 7.50 percent assumed investment rate of return, net of investment and administrative expenses. The 7.60 percent disclosed in Note 3 (Net Pension Liability) is net of investment expenses, but gross of administrative expenses and used to calculate the net pension liability for financial reporting.
SCHEDULE OF CONTRIBUTIONS FROM EMPLOYERS ANDNONEMPLOYER CONTRIBUTING ENTITY

81FINANCIAL
California State Teachers' Retirement SystemSchedule of Money-Weighted Investment Returns Schedule IV
57
Year Ended June 30 1Annual Money-Weighted Rate of
Return, Net of Investment Expenses
2014 18.6%
1) This is a 10-year schedule. However, the information in this schedule is not required to be presented retroactively. Years will added to this schedule in future fiscal years until 10 years of information is available.
SCHEDULE OF MONEY-WEIGHTED INVESTMENT RETURNS

82 CALSTRS COMPREHENSIVE ANNUAL FINANCIAL REPORT 2014
California State Teachers' Retirement SystemSchedule of Funding Progress (Medicare Premium Payment Program only) (Dollars in Millions) Schedule V
58
1) An actuarial valuation as of June 30, 2014, is expected to be available by April 2015.
2) An actuarial valuation for the MPP Program Fund is performed on a biennial basis and not available as of 2009, 2011 and 2013.
3) As of June 30, 2012, active members are no longer eligible for future enrollment in the MPP Program. Therefore, the covered payroll is $0 for years 2012 and later.
Actuarial Valuation Date as of June 30
Actuarial Value of Assets
(a)
Actuarial Accrued Liability
(AAL) (b)
Unfunded AAL (Funding
Excess)(UAAL)(b-a)
Funded Ratio (a/b)
Covered Payroll
(c)
UAAL as a % of
Covered Payroll (b-a)/c
Teachers' Health Benefits Fund
Medicare Premium Payment Program2014 (1) (1) (1) (1) (3) N/A2013 (2) (2) (2) (2) (2) (2)
2012 $ 0.4 $ 582 $ 582 0.1% (3) N/A2011 (2) (2) (2) (2) (2) (2)
2010 0.6 905 904 0.1% 5,011 18%2009 (2) (2) (2) (2) (2) (2)
2008 4 976 972 0.4% 6,604 15%
SCHEDULE OF FUNDING PROGRESS (MEDICARE PREMIUM PAYMENT PROGRAM ONLY)

83FINANCIAL
59
Other Supplemental Information

84 CALSTRS COMPREHENSIVE ANNUAL FINANCIAL REPORT 2014
California State Teachers' Retirement SystemSchedule of Administrative Expenses(Dollars in Thousands) Schedule VI
StateTeachers' Pension2 Pension2 Teachers' Teachers'
Retirement IRC 403(b) IRC 457 Health DeferredPlan Plan Plan Benefits Compensation Totals
Personnel Services:
Salaries and Wages 53,133$ -$ -$ 137$ 235$ 53,505$
Staff Benefits 21,985 - - 57 90 22,132
Accrued Leave Expense (866) - - (1) (56) (923)
Accrued Worker's Compensation
Expense (99) - - - - (99)
Accrued OPEB Expense 11,358 - - 26 52 11,436
Total Personnel Services 85,511$ - - 219$ 321$ 86,051$
Operating Expenses and Equipment:
General 1,880 - - 88 43 2,011
Depreciation/amortization 10,944 - - - - 10,944
Printing 1,180 - - - - 1,180
Communications 537 - - - - 537
Postage 920 - - - - 920
Insurance 44 - - - - 44
Travel 605 - - - 9 614
Training 1,063 - - - - 1,063
Facilities Operations 9,394 - - - - 9,394
Consultants and Professional Services 23,384 1,146 36 1 465 25,032
Data Processing 5,161 - - - - 5,161
Information Technology 4,349 - - - - 4,349
Indirect State Central Services 8,258 - - 19 36 8,313
Equipment 631 - - - - 631
Other 294 - - - - 294
Total Operating Expenses and Equipment 68,644$ 1,146$ 36$ 108$ 553$ 70,487$
Total 154,155$ 1,146$ 36$ 327$ 874$ 156,538$
60
SCHEDULE OF ADMINISTRATIVE EXPENSES

85FINANCIAL
California State Teachers' Retirement SystemSchedule of Investment Expenses(Dollars in Thousands) Schedule VII
Contract Start Date Amount
Investment Management FeesAberdeen Asset Management 12/15/06 2,856$ AGF Investments America, Inc. 3/19/07 1,057 Baillie Gifford Overseas, Ltd. 1/15/06 7,851 Batterymarch Financial Management, Inc. 5/11/99 2,453 Bivium Capital Partners, LLC 2/15/08 2,958 BlackRock Financial Management, Inc. 7/1/06 2,924 BlackRock Institutional Trust, N.A. 10/27/98 2,375 Blackrock International, Ltd. 5/12/99 3,645 Blackrock Realty Advisors, Inc. 7/1/99 1,220 Capital Guardian Trust Company 5/18/99 832 Capital Prospects, LLC 2/15/08 1,696 CBRE Global Investors 7/1/99 9,309 Chicago Equity Partners 11/1/98 862 Columbia Management Investment Advisers, LLC 10/1/11 332 Credit Suisse Asset Management, LLC 9/1/11 1,433 Delaware Investment Advisors 11/1/98 6,467 Delphi Management, Inc. 1/1/99 2,030 Denver Investments Advisors, LLC 1/1/99 778 DuPont Capital Management Corporation 10/1/11 5,880 FDO Partners, LLC 1/1/10 3,984 First Quadrant, LP 11/1/98 3,595 FIS Group, Inc. 2/27/04 2,719 Generation Investment Management 3/19/07 8,588 Heitman Captial Management, LLC 7/1/99 4,154 ING Clarion Partners 7/1/99 3,959 Lazard Asset Management, LLC 5/18/99 16,555 Leading Edge Investment Advisors, LLC 2/15/08 2,340 Lee Overlay Partners, Ltd. 10/15/09 1,250 Light Green Advisors 4/30/07 344 LM Capital Group, LLC 12/19/06 1,034 Mellon Capital Management Corp. 1/27/13 102 Mesirow Financial Administrative 12/1/10 990 Millennium Global Investments, Ltd. 7/1/10 3,750 Mondrian Investment Partners, Ltd. 5/13/99 3,300 Morgan Stanley Investment Management, Inc. 5/18/99 3,149 NCM Capital Management Group, Inc. 10/30/98 70 Neuberger Berman, LLC 10/1/10 43 New Amsterdam Partners, LLC 3/19/07 485 Northern Trust Global Advisors, Inc. 1/23/04 2,512 Oechsle International Advisors, LLC 5/19/99 1,510 Post Advisory Group, LLC 1/31/02 2,252 Principal Global Investors 2/15/02 17,073 Progress Investment Management 2/15/08 3,346 Pyramis Global Advisors Trust Co. 2/1/00 2,491 Sasco Capital, Inc. 10/30/98 3,128 Silvercrest Asset Management 7/1/11 1,202 State Street Global Advisors Trust Co. 12/1/00 3,131 Sterling Capital Management, LLC 3/11/04 1,786 T. Rowe Price Associates, Inc. 1/15/06 5,152 TCW Asset Management Co. 12/15/98 94 Templeton Asset Management, Ltd. 5/18/99 5,541 The Lionstone Group 1/1/14 2,138
61
SCHEDULE OF INVESTMENT EXPENSES

86 CALSTRS COMPREHENSIVE ANNUAL FINANCIAL REPORT 2014
California State Teachers' Retirement SystemSchedule of Investment Expenses(Dollars in Thousands) Schedule VII (Continued)
Contract Start Date Amount
Thomas Properties Group, LLC 11/15/99 48$ UBS Global Asset Management (Americas) 11/1/98 867 Western Asset Management Co. 10/30/06 2,196
Total Investment Management Fees 171,836$
Advisors and ConsultantsAltius Associates, Ltd. 6/1/08 544 Bard Consulting, LLC 9/20/07 579 Callan Associates 9/20/07 151 Cambridge Associates, LLC 6/1/08 4,076 Capital Hotel Management, LLC 9/20/07 165 Courtland Partners, Ltd. 9/20/07 329 David L. Bonuccelli & Associates, Inc. 9/20/07 1,215 Hewitt Ennisknupp, Inc. 7/15/11 25 LP Capital Advisors, LLC 1/1/12 465 Lyxor Asset Management, Inc. 8/1/11 1,464 Meketa Investment Group, Inc. 1/1/12 225 Nelson & Bernstein, LLC 12/1/09 85 Pension Consulting Alliance, Inc. 7/1/10 1,508 The Townsend Group, Inc. 3/1/08 568 Thompson, Cobb, Bazilio & Associates 1/1/12 112 Valuation Research Corporation 8/1/01 125
Total Advisors and Consultants 11,636$
External Services-Legal and Attorney FeeBerman DeValerio 4/19/11 87 Bingham Mccutchen, LLP 9/1/13 90 Covington & Burling, LLP 4/20/11 22 Cox, Castle & Nicholson, LLP 11/30/09 2,433 Girard Gibbs, LLP 7/1/11 36 Grant & Eisenhofer 9/1/10 16 Groom Law Group, Chartered 7/1/12 228 Mennemeier, Glassman & Stroud LLP 3/1/13 38 Morgan, Lewis & Bockius, LLP 12/9/10 167 Pepper Hamilton, LLP 4/1/11 69 Proskauer, LLP 3/9/11 128 Sheppard Mullin Richter & Hampton LLP 4/5/10 123 Miscellaneous N/A 10
Total External Services-Legal and Attorney Fee 3,447$
Master Custodian
State Street Bank & Trust Co 7/1/01 7,019
Total Master Custodian 7,019$
Research and Rating ServicesAccounting Research & Analytics, LLC 1/1/14 25 CEM Benchmarking, Inc. 7/1/12 70
62
SCHEDULE OF INVESTMENT EXPENSES

87FINANCIAL
California State Teachers' Retirement SystemSchedule of Investment Expenses(Dollars in Thousands) Schedule VII (Continued)
Contract Start Date Amount
Cornerstone Macro, LP 1/1/14 50$ Covenant Review, LLC 1/1/14 45 Creditsights, Inc. 1/1/14 24 Equilar, Inc. 7/1/13 40 Factiva, Inc. 1/1/12 26 FactSet Research System, Inc. 7/1/12 528 Fitch Ratings, Inc. 1/1/13 80 GMI Ratings (DBA) 9/26/13 110 GNA Services, LLC 1/1/14 25 Idealswork DBA IW Financial 7/1/13 12 Institutional Shareholder Services 1/1/13 33 International Strategy & Investment 1/1/12 13 KDP Investment Advisors, Inc. 10/1/11 37 Moody's Investors Service 1/1/14 299 Morningstar, Inc. 1/1/13 55 MSCI, Inc. 5/1/13 130 Property & Portfolio Research, Inc. 1/1/11 201 Real Estate Research Corporation 10/9/09 149 Russell Investment Group 7/1/12 40 Standard & Poor's 6/1/13 444 Strategas Securities, LLC 1/1/13 25 Sustainable Investments 7/1/13 27 Technical Analysis Group, LLC 2/3/14 28 Thomson Reuters Markets, LLC 9/1/12 120 Trepp, LLC 1/1/10 50 Miscellaneous N/A 22
Total Research and Rating Services 2,708$
Risk Management SystemsBarclays Capital, Inc. 7/1/13 150 BlackRock Financial Management, Inc. 7/1/06 4,358 MSCI, Inc. d/b/a Barra, LLC 4/1/14 95 Zephyr Associates, Inc. 1/12/12 27
Total Risk Management Systems 4,630$
Trading SystemsBloomberg, LP 9/6/12 519 Intex Solutions, Inc. 9/1/11 138 IPC Systems, Inc. 7/1/13 34 Market Axess Corporation 10/1/12 27 Markit N.America Inc. / Markit Group 7/15/12 117 Omgeo, LLC 11/1/09 16 Miscellaneous N/A 11
Total Trading Systems 862$
Operating ExpensesAdministrative Costs 20,581 Alliant Insurance Services 899 Council of Institutional Investors 30 EFL Associates 27
63
SCHEDULE OF INVESTMENT EXPENSES

88 CALSTRS COMPREHENSIVE ANNUAL FINANCIAL REPORT 2014
California State Teachers' Retirement SystemSchedule of Investment Expenses(Dollars in Thousands) Schedule VII (Continued)
Contract Start Date Amount
Miscellaneous 8$
Total Operating Expenses 21,545$
Subtotal 223,683$
Other Investment ExpensesForeign Tax Withheld 32,043 Miscellaneous 14,161
Total Other Investment Expenses 46,204$
Total 269,887$
64
SCHEDULE OF INVESTMENT EXPENSES

89FINANCIAL
SCHEDULE OF CONTRIBUTIONS FROM EMPLOYERS & OTHER CONTRIBUTING ENTITIES
California State Teachers' Retirement SystemSchedule of Consultant and Professional Services Expenses(Dollars in Thousands) Schedule VIII
Individual or Firm Commission/Fee Nature of ServicesState Teachers' Retirement Plan
Consulting and Professional Services
Milliman, Inc. 672$ 672$ Actuarial Services
Crowe Horwath LLP 984KPMG LLP 179Macias, Gini & O'Connell, LLP 33
1,196$ Auditing Services
Admail West 30Allegiance, Inc. 83Audio Fidelity Communications Corp. 39Background Profiles, Inc. 20Bank of America Merrill Lynch N.A. 20Burton Group, Inc. 70Bwise Guys, LLC 32CalGov Technology 486California Department Of Human Resources 85Capio Group 141CEM Benchmarking, Inc. 40Ciber, Inc. 8,008Daniel J. Edelman, Inc. 168Department of General Services 140Digital Deployment, Inc. 70Dr. Robert Yetman 35DV1 Technologies 60Employment Development Department 45Enterprising Service Providers, LLC 212Evolve Technology Group 90ExamWorks, Inc 175Forrester Research, Inc. 206Gartner, Inc. 722Global Governance Advisors, LLC 56GoldLink Pacific, Inc. 203Government Operations Agency 215Grant Thornton, LLP 1,065Hewitt Ennisknupp, Inc. 154Hewlett Packard 15HRT Associates 50Infiniti Consulting Group, Inc. 29Info Tech Software Professionals 135Informatix, Inc. 62Jaykumar Maistry 190Lexis Nexis Div. of Reed Elsevier 28LRWL Inc 1,374McLagan Partners Inc. 59Medical Support Los Angeles A Med C 16MetaVista Consulting Group 133Metric Studios, LLC 13Montridge Consulting 139Pension Benefit Information 15Pinnacle Consulting 226Proprose, LLC 88Providence Technology Group 124Sacramento IT Consulting, LLC 208Sierra Metrics Inc. 293SoftSol Technologies Inc 439
65
SCHEDULE OF CONSULTANT AND PROFESSIONAL SERVICES EXPENSES

90 CALSTRS COMPREHENSIVE ANNUAL FINANCIAL REPORT 2014
California State Teachers' Retirement SystemSchedule of Consultant and Professional Services Expenses(Dollars in Thousands) Schedule VIII (Continued)
Individual or Firm Commission/Fee Nature of ServicesState Controller's Office 2,287$ State Personnel Board 64Thomas V. Ennis Consulting 220Thomas/Ferrous, Inc. 159University of the Pacific 45Visionary Integration Professionals 139
19,220$ Consulting Services
Department Of Justice 272Hogan Lovells US, LLP 240Murphy Austin Adams Schoenfeld, LLP 28Olson Hagel & Fishburn, LLP 159Reed Smith, LLP 531
1,230$ Legal Services
Fresno County Office Of Education 348Humboldt County Office Of Education 66Kern County Superintendent Of Schools 195Monterey County Office of Education 14Orange County Department of Education 356Placer County Office Of Education 92San Bernardino County Office of Education 219San Diego County Office Of Education 390San Joaquin County Office Of Education 98San Jose Unified School District 13San Mateo-Foster City School District 30Santa Barbara County Office of Education 105Santa Cruz County Office of Education 130Shasta County Office Of Education 81Stanislaus County Office of Education 86Tulare County Office of Education 32Ventura County Office Of Education 93
2,348$ Regional Counseling Services
Others 123123$ Various Services Under $10K
Gross Consulting and Professional Services 24,789$
Less: Amounts Capitalized 1,405
Consulting and Professional Services Net of Amounts Capitalized:
23,384$
Data Processing:Office of the State Chief Information Officer 5,161 Data Processing
Total Data Processing 5,161$
IRC 403(b) Plan
Consultant and Professional Services Commission/Fee Nature of Services
TIAA-CREF 1,146 Administrative Services
Total Consulting and Professional Services: 1,146$
66
SCHEDULE OF CONSULTANT AND PROFESSIONAL SERVICES EXPENSES

91FINANCIAL
California State Teachers' Retirement SystemSchedule of Consultant and Professional Services Expenses(Dollars in Thousands) Schedule VIII (Continued)
Individual or Firm Commission/Fee Nature of ServicesIRC 457 Plan
Consultant and Professional Services Commission/Fee Nature of Services
TIAA-CREF 36$ Administrative Services
Total Consulting and Professional Services: 36$
Teachers' Health Benefits Fund
Consultant and Professional Services Commission/Fee Nature of Services
State Controller's Office 1 Consulting Services
Total Consulting and Professional Services: 1$
Teachers' Deferred Compensation Fund
Consulting and Professional Services Amount Nature of Services
JEM Resource Partners, LP 337 Consulting ServicesMeridian Fiduciary Consulting 109 Consulting ServicesMorningstar Credit Ratings, LLC 19 Consulting Services
Total Consulting and Professional Services: 465$
67
SCHEDULE OF CONSULTANT AND PROFESSIONAL SERVICES EXPENSES

92 CALSTRS COMPREHENSIVE ANNUAL FINANCIAL REPORT 2014
68
Other Pension Information—State Teachers’ Retirement Plan

93FINANCIAL
Crowe Horwath LLPIndependent Member Crowe Horwath International
1
INDEPENDENT AUDITOR'S REPORT
Teachers’ Retirement Board of the California State Teachers’ Retirement System Sacramento, California
Report on Schedules
We have audited the accompanying Schedule of Proportionate Share of Contributions for Employers and Nonemployer Contributing Entity of State Teachers’ Retirement Plan (Schedule IX), a plan administered by the California State Teachers’ Retirement System, for the year ended June 30, 2014, and the related notes. We have also audited the captions titled total net pension liability, as of June 30th, 2013; total net pension liability, as of June 30th, 2014; total deferred outflows of resources; and total deferred inflows of resources (specified caption totals) included in the accompanying Schedule of Aggregate Pension Amounts for Employers and Nonemployer Contributing Entity (Schedule X) as of June 30, 2014, and the related notes.
Management’s Responsibility for the Schedules
Management is responsible for the preparation and fair presentation of these schedules in accordance with accounting principles generally accepted in the United States of America; this includes the design, implementation, and maintenance of internal control relevant to the preparation and fair presentation of the schedules that are free from material misstatement, whether due to fraud or error.
Auditor’s Responsibility
Our responsibility is to express opinions on the schedules based on our audit. We conducted our audit in accordance with auditing standards generally accepted in the United States of America and the standards applicable to financial audits contained in Government Auditing Standards, issued by the Comptroller General of the United States. Those standards require that we plan and perform the audit to obtain reasonable assurance about whether the schedules are free from material misstatement.
An audit involves performing procedures to obtain audit evidence about the amounts and disclosures in the schedules. The procedures selected depend on the auditor’s judgment, including the assessment of the risks of material misstatement of the schedules, whether due to fraud or error. In making those risk assessments, the auditor considers internal control relevant to the entity’s preparation and fair presentation of the schedules in order to design audit procedures that are appropriate in the circumstances, but not for the purpose of expressing an opinion on the effectiveness of the entity’s internal control. Accordingly, we express no such opinion. An audit also includes evaluating the appropriateness of accounting policies used and the reasonableness of significant accounting estimates made by management, as well as evaluating the overall presentation of the schedules.
We believe that the audit evidence we have obtained is sufficient and appropriate to provide a basis for our audit opinions.
INDEPENDENT AUDITOR’S REPORT

94 CALSTRS COMPREHENSIVE ANNUAL FINANCIAL REPORT 2014
INDEPENDENT AUDITOR’S REPORT
2
Opinions
In our opinion, the schedules referred to above present fairly, in all material respects, the proportionate share of contributions for employers and nonemployer contributing entity for the year ended June 30, 2014 and total net pension liability as of June 30th, 2013; total net pension liability as of June 30th, 2014; total deferred outflows of resources; and total deferred inflows of resources for the State Teachers’ Retirement Plan as of June 30, 2014, in accordance with accounting principles generally accepted in the United States of America.
Emphasis of a Matter
In our report dated October 1, 2014, we expressed an opinion that the total pension expense was fairly presented in accordance with accounting principles generally accepted in the United States of America. As described in Note 3 the State Teachers’ Retirement Plan has restated Schedule X which now excludes the presentation of total pension expense. As a result, the opinion as previously presented related to total pension expense should no longer be relied upon. Our present opinion on the restated Schedule X, as presented herein, is different from that expressed in our previous opinion since it excludes total pension expense.
Other Matter
We have audited, in accordance with auditing standards generally accepted in the United States of America and the standards applicable to financial audits contained in Government Auditing Standards, issued by the Comptroller General of the United States, the financial statements of California State Teachers’ Retirement System, which includes the State Teachers’ Retirement Plan, as of and for the year ended June 30, 2014, and our report thereon, dated October 1, 2014, expressed an unmodified opinion on those financial statements.
Restriction on Use
Our report is intended solely for the information and use of the California State Teachers’ Retirement System, the California State Teachers’ Retirement System’s management, the governing body of the California State Teachers’ Retirement System, and the State Teachers’ Retirement Plan employers and their auditors and is not intended to be and should not be used by anyone other than these specified parties.
Other Reporting Required by Government Auditing Standards
In accordance with Government Auditing Standards, we have also issued our report dated August 3, 2015 on our consideration of State Teachers’ Retirement Plan’s internal control over financial reporting and on our tests of its compliance with certain provisions of laws, regulations, contracts, and grant agreements and other matters related to the Schedules. The purpose of that report is to describe the scope of our testing of internal control over financial reporting and compliance and the results of that testing, and not to provide an opinion on internal control over financial reporting or on compliance. That report is an integral part of an audit performed in accordance with Government Auditing Standards in considering State Teachers’ Retirement Plan’s internal control over financial reporting and compliance related to the Schedules.
Crowe Horwath LLP
October 1, 2014, except Note 3 which is dated August 3, 2015 Sacramento, California

95FINANCIAL
California State Teachers' Retirement SystemSchedule of Proportionate Share of Contributionsfor Employers and Nonemployer Contributing Entityfor the Year Ended June 30, 2014 Schedule IX
Employer Reporting Number Employer NameCalSTRS-Calculated
Employer Contribution
EmployerProportionateShare of Total
CalSTRS-CalculatedEmployer
Contribution01001 Alameda County Office of Education 684,786$ 0.019%01010 Alameda City Unified School District 3,407,814 0.093%01012 Albany City Unified School District 1,446,213 0.039%01014 Berkeley Unified School District 4,521,478 0.123%01016 Castro Valley Unified School District 3,246,512 0.088%01017 Dublin Unified School District 3,052,531 0.083%01018 Emery Unified School District 349,219 0.010%01020 Fremont Unified School District 12,554,246 0.342%01022 Hayward Unified School District 8,199,154 0.223%01024 Livermore Valley Joint Unified School District 4,208,323 0.115%01026 Newark Unified School District 2,365,992 0.064%01028 New Haven Unified School District 4,804,917 0.131%01030 Oakland Unified School District 12,749,778 0.347%01032 Piedmont City Unified School District 1,271,725 0.035%01033 Pleasanton Unified School District 5,754,469 0.157%01034 San Leandro Unified School District 3,404,964 0.093%01036 San Lorenzo Unified School District 3,983,937 0.108%01038 Sunol Glen Unified School District 89,967 0.002%01042 Mountain House Elementary 10,505 0.000%01061 Ohlone Community College District 1,255,891 0.034%01063 Peralta Community College District 3,084,829 0.084%01065 Chabot-Las Positas Community College District 2,690,194 0.073%01073 Eden Regional Occupational Program 191,777 0.005%01079 Tri-Valley Regional Occupational Program 185,658 0.005%01080 E.C. Reems Academy of Technology and Arts 67,292 0.002%01081 Aspire Public Schools 1,160,252 0.032%01082 Oakland Military Institute 235,604 0.006%01083 Oakland School for the Arts 158,537 0.004%01086 North Oakland Community Charter 53,119 0.001%01087 Oakland Unity High 62,112 0.002%01088 Kipp Summit Academy 163,316 0.004%01092 Leadership Public Schools Hayward 127,965 0.003%01093 Leadership Public Schools Oakland 5,609 0.000%01094 Families of Alameda for Multicultural 293,540 0.008%01095 Bay Area Technology School 53,598 0.001%01096 Livermore Valley Charter 443,475 0.012%01097 Education for Change at Cox Elementary 650,973 0.018%01101 Conservatory of Vocal/Instrumental Arts 43,774 0.001%01102 Arise High 84,221 0.002%01103 Nea Community Learning Center 161,162 0.004%01104 Golden Oak Montessori of Hayward 39,567 0.001%01105 Alameda Community Learning Center 96,861 0.003%01106 Envision Academy of Arts and Technology 220,157 0.006%01107 Impact Academy of Arts and Technology 129,718 0.004%01108 The Academy of Alameda 140,815 0.004%01109 Yu Ming Charter 45,167 0.001%01110 Vincent Academy 38,942 0.001%01111 Community School for Creative Education 50,238 0.001%01112 Realm Charter 162,017 0.004%01113 Urban Montessori Charter 54,699 0.001%01114 LPS Oakland Research and Development Campus 87,524 0.002%01115 100 Black Men of the Bay Area Community 18,874 0.001%01116 Silver Oak High Montessori Charter 23,327 0.001%01117 Key Academy Charter 35,035 0.001%00001 Alameda County Office of Education 88,422,369$
02001 Alpine County Office of Education 51 0.000%02010 Alpine County Unified School District 72,509 0.002%00002 Alpine County Office of Education 72,560$
03003 Amador County Office of Education 279,699 0.008%03040 Amador County Unified School District 1,010,400 0.027%00003 Amador County Office of Education 1,290,099$
04001 Butte County Office of Education 919,652 0.025%04002 Blue Oak Charter 79,525 0.002%04003 Bangor Union Elementary 35,637 0.001%
The accompanying notes are an integral part of these schedules.
3
SCHEDULE OF PROPORTIONATE SHARE OF CONTRIBUTIONS FOR EMPLOYERS AND NONEMPLOYER CONTRIBUTING ENTITY

96 CALSTRS COMPREHENSIVE ANNUAL FINANCIAL REPORT 2014
SCHEDULE OF PROPORTIONATE SHARE OF CONTRIBUTIONS FOR EMPLOYERS AND NONEMPLOYER CONTRIBUTING ENTITY
California State Teachers' Retirement SystemSchedule of Proportionate Share of Contributionsfor Employers and Nonemployer Contributing Entityfor the Year Ended June 30, 2014 Schedule IX (Continued)
Employer Reporting Number Employer NameCalSTRS-Calculated
Employer Contribution
EmployerProportionateShare of Total
CalSTRS-CalculatedEmployer
Contribution04006 Biggs Unified School District 167,270$ 0.005%04007 Chico Country Day 166,392 0.005%04008 Chico Unified School District 4,026,741 0.110%04010 Durham Unified School District 323,545 0.009%04011 Feather Falls Union Elementary 6,271 0.000%04014 Golden Feather Union Elementary District 48,967 0.001%04017 Gridley Unified School District 649,116 0.018%04019 Manzanita Elementary 85,558 0.002%04021 Nord Country 36,649 0.001%04022 Oroville City Elementary 852,830 0.023%04023 Oroville Union High 726,538 0.020%04024 Palermo Union Elementary 421,309 0.011%04025 Paradise Unified School District 1,090,258 0.030%04026 Pioneer Union Elementary 24,950 0.001%04029 Thermalito Union Elementary 473,243 0.013%04030 Butte Community College District 1,701,045 0.046%04035 Children's Community Charter 42,510 0.001%04036 Core Butte Charter 164,409 0.004%04037 Forest Ranch Charter 21,423 0.001%04038 Sherwood Montessori 26,252 0.001%04040 Ipakanni Early College Charter 7,906 0.000%04041 Pivot Charter North Valley 7,234 0.000%00004 Butte County Office of Education 12,105,230$
05030 Mark Twain Union Elementary 210,402 0.006%05031 Bret Harte Union High 307,322 0.008%05032 Calaveras Unified School District 923,476 0.025%05033 Vallecito Union School District 194,633 0.005%05099 Calaveras County Office of Education 298,458 0.008%00005 Calaveras County Office of Education 1,934,291$
06050 Colusa Unified School District 441,887 0.012%06051 Maxwell Unified School District 110,263 0.003%06052 Pierce Joint Unified School District 411,027 0.011%06053 Williams Unified School District 391,667 0.011%06099 Colusa County Office of Education 293,079 0.008%00006 Colusa County Office of Education 1,647,923$
07050 Acalanes Union High 2,280,226 0.062%07051 Canyon Elementary 15,982 0.000%07052 Lafayette Elementary 1,257,711 0.034%07053 Moraga Elementary 636,936 0.017%07054 Orinda Union Elementary 934,389 0.025%07055 Walnut Creek Elementary 1,188,942 0.032%07056 Leadership Public Schools: Richmond 176,958 0.005%07057 Manzanita Middle Charter 28,033 0.001%07059 Richmond College Prep K-5 Charter 55,540 0.002%07060 Liberty Union High 2,239,063 0.061%07061 Brentwood Union Elementary 2,911,794 0.079%07062 Byron Union Elementary 474,506 0.013%07063 Knightsen Elementary 161,795 0.004%07064 Oakley Union Elementary 1,529,042 0.042%07069 Contra Costa County Office of Education 1,428,004 0.039%07071 Antioch Unified School District 5,510,356 0.150%07072 John Swett Unified School District 474,591 0.013%07074 Martinez Unified School District 1,375,815 0.037%07075 Mt. Diablo Unified School District 10,152,303 0.276%07076 Pittsburg Unified School District 3,285,130 0.089%07077 West Contra Costa Unified School District 8,598,537 0.234%07078 San Ramon Valley Unified School District 10,208,577 0.278%07079 Contra Costa Community College District 4,899,341 0.133%07080 Making Waves Academy 281,790 0.008%07082 Antioch Charter Academy 53,323 0.001%07083 Antioch Charter Academy #2 50,907 0.001%07084 R.A.A.M.P. Charter Academy 25,452 0.001%07085 Clayton Valley Charter High 506,426 0.014%07086 Synergy Charter 55,419 0.002%
The accompanying notes are an integral part of these schedules.
4

97FINANCIAL
SCHEDULE OF PROPORTIONATE SHARE OF CONTRIBUTIONS FOR EMPLOYERS AND NONEMPLOYER CONTRIBUTING ENTITY
California State Teachers' Retirement SystemSchedule of Proportionate Share of Contributionsfor Employers and Nonemployer Contributing Entityfor the Year Ended June 30, 2014 Schedule IX (Continued)
Employer Reporting Number Employer NameCalSTRS-Calculated
Employer Contribution
EmployerProportionateShare of Total
CalSTRS-CalculatedEmployer
Contribution00007 Contra Costa County Office of Education 60,796,888$
08001 Del Norte County Unified School District 1,456,378$ 0.040%00008 Del Norte County Office of Education 1,456,378$
09001 Buckeye Union Elementary 1,438,536 0.039%09002 Camino Union Elementary 174,409 0.005%09004 Gold Oak Union Elementary 134,635 0.004%09005 Gold Trail Union Elementary 149,563 0.004%09006 Indian Diggings Elementary 9,403 0.000%09007 Lake Tahoe Unified School District 1,310,639 0.036%09008 Latrobe Elementary 57,471 0.002%09009 Black Oak Mine Unified School District 415,780 0.011%09010 Mother Lode Union Elementary 305,672 0.008%09012 Pioneer Union Elementary 101,697 0.003%09013 Placerville Union Elementary 383,118 0.010%09014 Pollock Pines Elementary 201,482 0.005%09015 Rescue Union Elementary 1,196,079 0.033%09016 Silver Fork Elementary 9,880 0.000%09018 El Dorado Union High 2,270,767 0.062%09019 El Dorado County Office of Education 1,027,750 0.028%09023 Lake Tahoe Community College District 367,178 0.010%09026 Central Sierra Regional Occupational Program 38,193 0.001%09041 CA Montessori Project, Shingle Springs Campus 85,086 0.002%09042 Aspire Public Schools- Statewide Benefit 40,144 0.001%00009 El Dorado County Office of Education 9,717,482$
10001 Fresno County Office of Education 1,969,211 0.054%10002 Alvina Elementary 45,770 0.001%10006 Big Creek Elementary 29,290 0.001%10008 Burrel Union Elementary 40,700 0.001%10012 Caruthers Unified School District 445,379 0.012%10014 Clay Joint Elementary 62,540 0.002%10015 Clovis Unified School District (10) 0.000%10016 Coalinga/Huron Joint Unified School District 1,372,683 0.037%10018 Central Unified School District 4,383,877 0.119%10021 Fowler Unified School District 731,011 0.020%10022 Firebaugh-Las Deltas Joint Unified School District 744,348 0.020%10027 Golden Plains Unified School District 548,610 0.015%10031 Kerman Unified School District 1,373,611 0.037%10034 Kingsburg Joint Union Elementary 611,229 0.017%10035 Kingsburg Joint Union High 400,532 0.011%10036 Kings Canyon Joint Unified School District 3,113,533 0.085%10037 Laton Joint Unified School District 219,738 0.006%10042 Mendota Unified School District 853,637 0.023%10043 Monroe Elementary 55,464 0.002%10045 Orange Center Elementary 90,173 0.002%10048 Pacific Union Elementary 95,551 0.003%10049 Parlier Unified School District 1,076,317 0.029%10050 Pine Ridge Elementary 53,018 0.001%10051 Raisin City Elementary 80,769 0.002%10052 Riverdale Joint Unified School District 490,536 0.013%10057 Sanger Unified School District 3,520,294 0.096%10059 Selma Unified School District 2,163,849 0.059%10060 Central Valley Pre-School JPA 6,650 0.000%10067 Sierra Unified School District 444,542 0.012%10071 Washington Colony Elementary 123,869 0.003%10073 West Park Elementary 177,288 0.005%10074 Westside Elementary 79,052 0.002%10075 Washington Unified School District 938,458 0.026%10076 Valley Regional Occupational Program 91,156 0.002%10079 W.E.B. Duboise Public Charter 95,001 0.003%10150 Clovis Unified School District 11,993,396 0.326%10170 West Hills Community College District 1,060,950 0.029%10240 Fresno Unified School District 24,577,920 0.669%10303 Valley Preparatory Academy Charter 55,350 0.002%10306 Hume Lake Charter 19,366 0.001%
The accompanying notes are an integral part of these schedules.
5

98 CALSTRS COMPREHENSIVE ANNUAL FINANCIAL REPORT 2014
SCHEDULE OF PROPORTIONATE SHARE OF CONTRIBUTIONS FOR EMPLOYERS AND NONEMPLOYER CONTRIBUTING ENTITY
California State Teachers' Retirement SystemSchedule of Proportionate Share of Contributionsfor Employers and Nonemployer Contributing Entityfor the Year Ended June 30, 2014 Schedule IX (Continued)
Employer Reporting Number Employer NameCalSTRS-Calculated
Employer Contribution
EmployerProportionateShare of Total
CalSTRS-CalculatedEmployer
Contribution10307 Valley Arts and Science Academy (Vasa) 59,089$ 0.002%10309 ACEL Fresno 36,719 0.001%10310 University High 140,316 0.004%10311 Sierra Charter 165,066 0.004%10312 Carter G. Woodson Public Charter 87,720 0.002%10313 New Millennium Charter 5,244 0.000%10315 Big Picture High 39,038 0.001%10320 New Spirit Charter Academy 20,115 0.001%10321 California Virtual Academy at Fresno 37,952 0.001%10324 Kepler Neighborhood School 49,499 0.001%10650 State Center Community College District 5,164,025 0.141%00010 Fresno County Office of Education 70,039,441$
11601 Capay Joint Union Elementary 50,514 0.001%11603 Lake Elementary 35,691 0.001%11604 Orland Joint Unified School District 633,259 0.017%11605 Plaza Elementary 32,538 0.001%11606 Princeton Joint Unified School District 73,324 0.002%11607 Stony Creek Joint Unified School District 57,408 0.002%11608 Willows Unified School District 451,930 0.012%11611 Glenn County Office of Education 404,886 0.011%11612 Hamilton Unified School District 217,195 0.006%00011 Glenn County Office of Education 1,956,745$
12001 Humboldt County Office of Education 516,751 0.014%12002 Arcata Elementary 284,159 0.008%12003 Northern Humboldt Union High 611,452 0.017%12004 Big Lagoon Union Elementary 17,203 0.000%12005 Blue Lake Union Elementary 50,458 0.001%12007 Bridgeville Elementary 21,251 0.001%12008 Cuddeback Union Elementary 38,028 0.001%12009 Cutten Elementary 164,975 0.004%12012 Eureka City Unified School District 1,201,765 0.033%12015 Fieldbrook Elementary 36,542 0.001%12017 Fortuna Union High 300,203 0.008%12018 Freshwater Elementary 94,860 0.003%12019 Garfield Elementary 11,780 0.000%12021 Green Point Elementary 8,604 0.000%12024 Hydesville Elementary 48,564 0.001%12025 Jacoby Creek Elementary 120,934 0.003%12026 Klamath-Trinity Joint Unified School District 418,253 0.011%12027 Kneeland Elementary 12,557 0.000%12028 Loleta Union Elementary 35,589 0.001%12029 Maple Creek Elementary 7,457 0.000%12031 Mckinleyville Union Elementary 343,242 0.009%12032 Orick Elementary 8,842 0.000%12033 Pacific Union Elementary 160,045 0.004%12034 Peninsula Union Elementary 11,649 0.000%12035 Redwoods Community College District 776,485 0.021%12036 Rio Dell Elementary 95,358 0.003%12038 Scotia Union Elementary 65,279 0.002%12039 South Bay Union Elementary 147,577 0.004%12040 Southern Humboldt Joint Unified School District 210,181 0.006%12041 Trinidad Union Elementary 50,998 0.001%12045 Ferndale Unified School District 153,114 0.004%12046 Mattole Unified School District 178,356 0.005%12047 Fortuna Elementary School District 383,080 0.010%12070 Northcoast Preparatory and Performing Arts Academy 19,415 0.001%12071 Pacific View Charter 38,355 0.001%12072 Alder Grove Charter 83,203 0.002%12073 Redwood Preparatory Charter 30,133 0.001%12074 Laurel Tree Charter 26,235 0.001%00012 Humboldt County Office of Education 6,782,932$
13001 Imperial Community College District 1,273,291 0.035%13010 Brawley Elementary 1,192,766 0.032%13012 Brawley Union High 653,466 0.018%
The accompanying notes are an integral part of these schedules.
6

99FINANCIAL
SCHEDULE OF PROPORTIONATE SHARE OF CONTRIBUTIONS FOR EMPLOYERS AND NONEMPLOYER CONTRIBUTING ENTITY
California State Teachers' Retirement SystemSchedule of Proportionate Share of Contributionsfor Employers and Nonemployer Contributing Entityfor the Year Ended June 30, 2014 Schedule IX (Continued)
Employer Reporting Number Employer NameCalSTRS-Calculated
Employer Contribution
EmployerProportionateShare of Total
CalSTRS-CalculatedEmployer
Contribution13015 Calexico Unified School District 2,646,621$ 0.072%13018 Calipatria Unified School District 417,958 0.011%13021 Central Union High 1,454,565 0.040%13024 El Centro Elementary 1,621,163 0.044%13027 Heber Elementary 402,760 0.011%13030 Holtville Unified School District 553,442 0.015%13033 Imperial Unified School District 1,178,550 0.032%13036 Magnolia Union Elementary 37,154 0.001%13039 Mccabe Union Elementary 339,361 0.009%13042 Meadows Union Elementary 168,172 0.005%13045 Mulberry Elementary 18,210 0.000%13048 San Pasqual Valley Unified School District 372,892 0.010%13051 Seeley Union Elementary 135,887 0.004%13054 Westmorland Union Elementary 133,169 0.004%13060 Imperial County Office of Education 700,493 0.019%13068 Imperial Valley Regional Occupational Program 42,314 0.001%13103 Imagine School at Imperial Valley 137,549 0.004%00013 Imperial County Office of Education 13,479,783$
14022 YouthBuild Charter of California Central 118,409 0.003%14023 College Bridge Academy 19,744 0.001%14024 The Education Corps 83,555 0.002%14101 Big Pine Unified School District 92,743 0.003%14111 YouthBuild Charter of California 256,459 0.007%14121 Bishop Unified School District 647,129 0.018%14401 Death Valley Unified School District 24,799 0.001%14501 Lone Pine Unified School District 131,794 0.004%14601 Owens Valley Unified School District 56,187 0.002%14701 Round Valley Joint Elementary 49,017 0.001%14901 Inyo County Office of Education 147,887 0.004%00014 Inyo County Office of Education 1,627,723$
15001 Arvin Union Elementary 901,177 0.025%15002 Bakersfield City School District 8,578,892 0.233%15003 Beardsley Elementary 418,411 0.011%15004 Belridge Elementary 25,449 0.001%15005 Blake Elementary 3,371 0.000%15007 Buttonwillow Union Elementary 93,312 0.003%15008 Caliente Union Elementary 18,575 0.001%15010 Delano Union Elementary 2,278,156 0.062%15011 Di Giorgio Elementary 50,960 0.001%15012 Edison Elementary 288,333 0.008%15013 Elk Hills Elementary 48,434 0.001%15015 Fairfax Elementary 606,138 0.016%15016 Fruitvale Elementary 878,406 0.024%15017 General Shafter Elementary 45,673 0.001%15019 Greenfield Union School District 2,329,579 0.063%15021 Kernville Union Elementary 220,805 0.006%15022 Lakeside Union School District 360,580 0.010%15023 Lamont Elementary 823,632 0.022%15025 Linns Valley-Poso Flat Union School District 7,249 0.000%15026 Lost Hills Union Elementary 157,745 0.004%15027 Maple Elementary 66,606 0.002%15029 Mckittrick Elementary 48,647 0.001%15030 Midway Elementary 49,210 0.001%15031 Norris Elementary 925,519 0.025%15032 Panama-Buena Vista Union School District 4,579,568 0.125%15033 Pond Union Elementary 66,322 0.002%15035 Richland Union Elementary 1,045,866 0.028%15036 Rio Bravo-Greeley Union Elementary 262,140 0.007%15037 Rosedale Union Elementary 1,447,876 0.039%15038 Semitropic Elementary 68,386 0.002%15039 South Fork Union School District 55,913 0.002%15040 Standard Elementary 839,266 0.023%15041 Taft City School District 530,638 0.014%15042 Vineland Elementary 200,243 0.005%15043 Wasco Union Elementary 871,963 0.024%
The accompanying notes are an integral part of these schedules.
7

100 CALSTRS COMPREHENSIVE ANNUAL FINANCIAL REPORT 2014
California State Teachers' Retirement SystemSchedule of Proportionate Share of Contributionsfor Employers and Nonemployer Contributing Entityfor the Year Ended June 30, 2014 Schedule IX (Continued)
Employer Reporting Number Employer NameCalSTRS-Calculated
Employer Contribution
EmployerProportionateShare of Total
CalSTRS-CalculatedEmployer
Contribution15044 Delano Joint Union High 1,155,061$ 0.031%15045 Kern Union High 10,753,497 0.293%15046 Taft Union High 559,782 0.015%15047 Wasco Union High 493,166 0.013%15048 Maricopa Unified School District 231,341 0.006%15049 Mojave Unified School District 664,192 0.018%15050 Muroc Joint Unified School District 440,214 0.012%15051 Southern Kern Unified School District 810,025 0.022%15052 Tehachapi Unified School District 1,092,763 0.030%15053 Kern Community College District 3,248,492 0.088%15054 West Kern Community College District 563,631 0.015%15055 Kern County Office of Education 2,124,720 0.058%15056 El Tejon Unified School District 208,152 0.006%15057 West Side Regional Occupational Program 22,836 0.001%15058 Sierra Sands Unified School District 1,445,075 0.039%15059 McFarland Unified School District 1,070,129 0.029%15060 North Kern Vocational Training Center 24,701 0.001%15063 Ridgecrest Charter 79,039 0.002%15064 The Paramount Bard Academy 205,337 0.006%15065 Grimmway Academy 101,630 0.003%15066 Abernathy Collegiate Charter 26,842 0.001%15067 Peak to Peak Mountain Charter 15,928 0.000%00015 Kern County Office of Education 54,529,593$
16010 Armona Union Elementary 332,824 0.009%16011 Central Union Elementary 777,405 0.021%16013 Hanford Elementary 1,770,924 0.048%16015 Island Union Elementary 82,955 0.002%16017 Kings River-Hardwick Union Elementary 203,334 0.006%16018 Kit Carson Union Elementary 132,566 0.004%16019 Lakeside Union Elementary 72,648 0.002%16020 Lemoore Union Elementary 911,539 0.025%16021 Pioneer Union Elementary 410,731 0.011%16027 Hanford Joint Union High 1,194,485 0.033%16031 Lemoore Union High 709,907 0.019%16038 Corcoran Joint Unified School District 1,028,857 0.028%16045 Reef-Sunset Unified School District 829,305 0.023%16073 Kings County Office of Education 619,536 0.017%16080 California Virtual Academy at Kings School 193,540 0.005%16081 California Virtual Education Partners 125,498 0.003%00016 Kings County Office of Education 9,396,054$
17001 Kelseyville Unified School District 511,552 0.014%17006 Konocti Unified School District 862,586 0.023%17009 Lake County International Charter 16,516 0.000%17011 Lakeport Unified School District 444,671 0.012%17016 Middletown Unified School District 494,198 0.013%17026 Lucerne Elementary 77,577 0.002%17031 Upper Lake Union Elementary 140,459 0.004%17036 Upper Lake Union High 87,043 0.002%17050 Lake County Office of Education 123,328 0.003%00017 Lake County Office of Education 2,757,930$
18100 Lassen County Office of Education 218,356 0.006%18110 Janesville Union Elementary 86,440 0.002%18120 Johnstonville Elementary 46,874 0.001%18150 Ravendale-Termo Elementary 13,059 0.000%18151 New Day Academy 66,722 0.002%18160 Richmond Elementary 44,195 0.001%18170 Shaffer Union Elementary 50,895 0.001%18180 Fort Sage Unified School District 87,076 0.002%18190 Long Valley Charter 83,797 0.002%18200 Big Valley Joint Unified School District 54,183 0.001%18400 Lassen Community College District 319,226 0.009%18500 Lassen Union High 240,243 0.007%18600 Susanville Elementary 257,202 0.007%18700 Westwood Unified School District 54,628 0.001%
The accompanying notes are an integral part of these schedules.
8
SCHEDULE OF PROPORTIONATE SHARE OF CONTRIBUTIONS FOR EMPLOYERS AND NONEMPLOYER CONTRIBUTING ENTITY
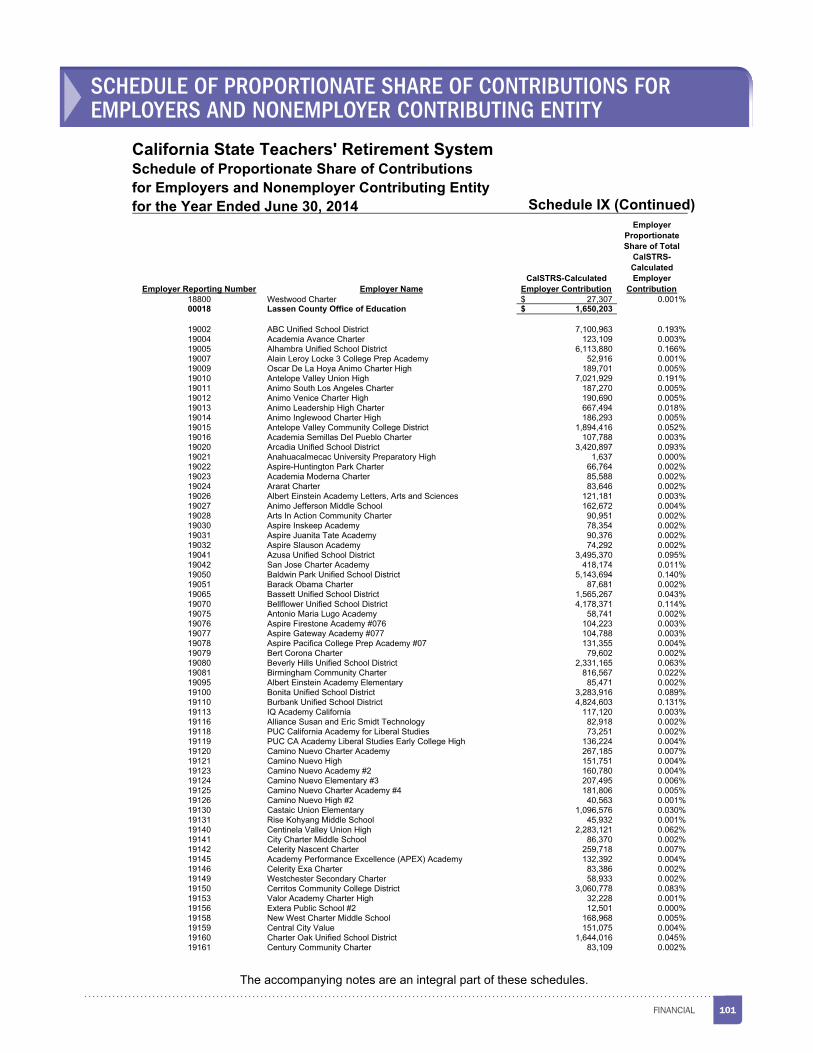
101FINANCIAL
California State Teachers' Retirement SystemSchedule of Proportionate Share of Contributionsfor Employers and Nonemployer Contributing Entityfor the Year Ended June 30, 2014 Schedule IX (Continued)
Employer Reporting Number Employer NameCalSTRS-Calculated
Employer Contribution
EmployerProportionateShare of Total
CalSTRS-CalculatedEmployer
Contribution18800 Westwood Charter 27,307$ 0.001%00018 Lassen County Office of Education 1,650,203$
19002 ABC Unified School District 7,100,963 0.193%19004 Academia Avance Charter 123,109 0.003%19005 Alhambra Unified School District 6,113,880 0.166%19007 Alain Leroy Locke 3 College Prep Academy 52,916 0.001%19009 Oscar De La Hoya Animo Charter High 189,701 0.005%19010 Antelope Valley Union High 7,021,929 0.191%19011 Animo South Los Angeles Charter 187,270 0.005%19012 Animo Venice Charter High 190,690 0.005%19013 Animo Leadership High Charter 667,494 0.018%19014 Animo Inglewood Charter High 186,293 0.005%19015 Antelope Valley Community College District 1,894,416 0.052%19016 Academia Semillas Del Pueblo Charter 107,788 0.003%19020 Arcadia Unified School District 3,420,897 0.093%19021 Anahuacalmecac University Preparatory High 1,637 0.000%19022 Aspire-Huntington Park Charter 66,764 0.002%19023 Academia Moderna Charter 85,588 0.002%19024 Ararat Charter 83,646 0.002%19026 Albert Einstein Academy Letters, Arts and Sciences 121,181 0.003%19027 Animo Jefferson Middle School 162,672 0.004%19028 Arts In Action Community Charter 90,951 0.002%19030 Aspire Inskeep Academy 78,354 0.002%19031 Aspire Juanita Tate Academy 90,376 0.002%19032 Aspire Slauson Academy 74,292 0.002%19041 Azusa Unified School District 3,495,370 0.095%19042 San Jose Charter Academy 418,174 0.011%19050 Baldwin Park Unified School District 5,143,694 0.140%19051 Barack Obama Charter 87,681 0.002%19065 Bassett Unified School District 1,565,267 0.043%19070 Bellflower Unified School District 4,178,371 0.114%19075 Antonio Maria Lugo Academy 58,741 0.002%19076 Aspire Firestone Academy #076 104,223 0.003%19077 Aspire Gateway Academy #077 104,788 0.003%19078 Aspire Pacifica College Prep Academy #07 131,355 0.004%19079 Bert Corona Charter 79,602 0.002%19080 Beverly Hills Unified School District 2,331,165 0.063%19081 Birmingham Community Charter 816,567 0.022%19095 Albert Einstein Academy Elementary 85,471 0.002%19100 Bonita Unified School District 3,283,916 0.089%19110 Burbank Unified School District 4,824,603 0.131%19113 IQ Academy California 117,120 0.003%19116 Alliance Susan and Eric Smidt Technology 82,918 0.002%19118 PUC California Academy for Liberal Studies 73,251 0.002%19119 PUC CA Academy Liberal Studies Early College High 136,224 0.004%19120 Camino Nuevo Charter Academy 267,185 0.007%19121 Camino Nuevo High 151,751 0.004%19123 Camino Nuevo Academy #2 160,780 0.004%19124 Camino Nuevo Elementary #3 207,495 0.006%19125 Camino Nuevo Charter Academy #4 181,806 0.005%19126 Camino Nuevo High #2 40,563 0.001%19130 Castaic Union Elementary 1,096,576 0.030%19131 Rise Kohyang Middle School 45,932 0.001%19140 Centinela Valley Union High 2,283,121 0.062%19141 City Charter Middle School 86,370 0.002%19142 Celerity Nascent Charter 259,718 0.007%19145 Academy Performance Excellence (APEX) Academy 132,392 0.004%19146 Celerity Exa Charter 83,386 0.002%19149 Westchester Secondary Charter 58,933 0.002%19150 Cerritos Community College District 3,060,778 0.083%19153 Valor Academy Charter High 32,228 0.001%19156 Extera Public School #2 12,501 0.000%19158 New West Charter Middle School 168,968 0.005%19159 Central City Value 151,075 0.004%19160 Charter Oak Unified School District 1,644,016 0.045%19161 Century Community Charter 83,109 0.002%
The accompanying notes are an integral part of these schedules.
9
SCHEDULE OF PROPORTIONATE SHARE OF CONTRIBUTIONS FOR EMPLOYERS AND NONEMPLOYER CONTRIBUTING ENTITY

102 CALSTRS COMPREHENSIVE ANNUAL FINANCIAL REPORT 2014
SCHEDULE OF PROPORTIONATE SHARE OF CONTRIBUTIONS FOR EMPLOYERS AND NONEMPLOYER CONTRIBUTING ENTITY
California State Teachers' Retirement SystemSchedule of Proportionate Share of Contributionsfor Employers and Nonemployer Contributing Entityfor the Year Ended June 30, 2014 Schedule IX (Continued)
Employer Reporting Number Employer NameCalSTRS-Calculated
Employer Contribution
EmployerProportionateShare of Total
CalSTRS-CalculatedEmployer
Contribution19163 CHAMPS-Charter HS of Arts-Multimedia & Performing 257,997$ 0.007%19164 Alliance Christine O'Donovan Middle Academy 13,642 0.000%19165 Alliance Richard Merkin Middle School 13,581 0.000%19166 Alliance College-Ready Middle Academy #4 116,558 0.003%19167 Alliance College-Ready Middle Academy #5 110,591 0.003%19168 Citizens of the World Charter Hollywood 109,469 0.003%19169 Citrus Community College District 2,046,111 0.056%19170 Alliance Cindy and Bill Simon Technology 155,635 0.004%19171 Alliance College-Ready Middle Academy #7 115,632 0.003%19172 Alliance College-Ready Middle Academy #12 28,909 0.001%19180 Claremont Unified School District 2,240,160 0.061%19181 Alliance Jack H. Skirball Middle School 123,173 0.003%19182 Alliance Dr. Olga Mohan High 189,535 0.005%19183 Alliance Gertz-Ressler High 302,637 0.008%19185 Community Charter Early College High 134,283 0.004%19187 Crown Preparatory Academy 95,782 0.003%19188 Alliance Technology and Math Science High 100,665 0.003%19189 Alliance College-Ready Academy High 90,825 0.002%19190 Children of Promise Preparatory Academy 41,075 0.001%19193 Celerity Octavia Charter 128,172 0.003%19195 Community Charter Middle 215,386 0.006%19200 Compton Community College District 985,002 0.027%19210 Da Vinci Design 169,243 0.005%19212 Stem Project Center 243,215 0.007%19215 Compton Unified School District 8,066,175 0.220%19220 Covina-Valley Unified School District 4,342,353 0.118%19228 Clas Affirmation 23,354 0.001%19230 Culver City Unified School District 2,386,333 0.065%19249 Downey Unified School District 7,865,516 0.214%19265 Duarte Unified School District 1,325,220 0.036%19268 PUC Early College Academy for Leaders and Scholars 116,062 0.003%19269 East San Gabriel Valley ROP 318,473 0.009%19270 East Whittier City Elementary 2,899,809 0.079%19280 Eastside Union Elementary 1,006,759 0.027%19287 Animo Charter Middle School #2 39,415 0.001%19290 El Camino Community College District 3,594,023 0.098%19291 El Camino Real Charter High 1,105,090 0.030%19300 El Monte City Elementary 3,081,200 0.084%19310 El Monte Union High 3,601,559 0.098%19315 El Rancho Unified School District 3,091,362 0.084%19318 Endeavor College Preparatory Charter 181,207 0.005%19320 El Segundo Unified School District 1,086,332 0.030%19321 Environmental Charter High 184,406 0.005%19322 Equitas Academy Charter 105,698 0.003%19323 Environmental Charter Middle School 83,104 0.002%19324 Environmental Charter Middle School Inglewood 28,239 0.001%19329 Extera Public School 112,153 0.003%19330 Fenton Avenue Charter 233,962 0.006%19331 Film and Theatre Arts Charter High 31,350 0.001%19343 Alliance Renee and Meyer Luskin Academy 155,627 0.004%19358 Futuro College Preparatory Elementary 13,964 0.000%19360 Garvey Elementary 1,841,395 0.050%19362 Gabriella Charter 147,725 0.004%19376 Ilead Lancaster Charter 57,136 0.002%19380 Glendale Unified School District 8,308,833 0.226%19381 Glendale Community College District 2,446,528 0.067%19391 Glendora Unified School District 2,462,057 0.067%19399 Goethe International Charter 65,112 0.002%19400 Gorman Elementary 28,524 0.001%19401 Gorman Learning Center 432,841 0.012%19402 Equitas Academy #2 20,342 0.001%19405 Hacienda La Puente Unified School District 7,035,686 0.191%19406 Apple Academy Charter Public 77,489 0.002%19408 USC Hybrid High 57,897 0.002%19411 Academy of Science and Engineering 66,698 0.002%19412 Math and Science College Preparatory 30,340 0.001%19413 Citizens of the World #2 80,853 0.002%
The accompanying notes are an integral part of these schedules.
10

103FINANCIAL
SCHEDULE OF PROPORTIONATE SHARE OF CONTRIBUTIONS FOR EMPLOYERS AND NONEMPLOYER CONTRIBUTING ENTITY
California State Teachers' Retirement SystemSchedule of Proportionate Share of Contributionsfor Employers and Nonemployer Contributing Entityfor the Year Ended June 30, 2014 Schedule IX (Continued)
Employer Reporting Number Employer NameCalSTRS-Calculated
Employer Contribution
EmployerProportionateShare of Total
CalSTRS-CalculatedEmployer
Contribution19414 Citizens of the World #3 40,722$ 0.001%19420 Hawthorne 2,773,754 0.075%19425 Alliance Judy Burton Technology Academy 187,882 0.005%19430 Hermosa Beach City Elementary 456,628 0.012%19433 Alliance Huntington Park College-Ready Acadmy High 226,141 0.006%19436 Aspire Centennial College Preparatory 59,756 0.002%19450 Hughes-Elizabeth Lakes Union Elementary 95,543 0.003%19458 Icef Inglewood Elementary Charter School Academy 85,058 0.002%19459 Icef Inglewood Middle Charter Academy 37,153 0.001%19460 Inglewood Unified School District 3,493,710 0.095%19461 Icef Vista Elementary Academy 78,517 0.002%19462 Icef Vista Middle Academy 42,482 0.001%19463 Ingenium Charter 76,653 0.002%19464 Wilder's Preparatory Academy Charter 89,195 0.002%19465 Wilder's Preparatory Academy Charter Middle School 36,449 0.001%19468 Larchmont Charter 422,442 0.011%19469 Larchmont Charter, West Hollywood 16,749 0.000%19470 Keppel Union School District 803,708 0.022%19473 Kipp Los Angeles College Preparatory 139,224 0.004%19481 La Canada Unified School District 1,341,869 0.037%19490 Lancaster Elementary 4,068,124 0.111%19491 Los Angeles Leadership Academy 176,441 0.005%19492 Port of Los Angeles High 364,567 0.010%19494 Los Angeles Academy of Arts and Enterprise 101,862 0.003%19500 Lakeview Charter Academy 127,999 0.003%19501 Lakeview Charter High 102,263 0.003%19502 Triumph Charter High 102,590 0.003%19503 La Puente Valley Regional Occupational Program 123,397 0.003%19505 Las Virgenes Unified School District 3,547,303 0.097%19514 Intellectual Virtues Academy 21,081 0.001%19519 Lifeline Education Charter 75,544 0.002%19520 Lawndale Elementary 2,056,531 0.056%19522 Life Source International Charter 49,023 0.001%19530 Lennox Elementary 2,313,884 0.063%19531 City Charter Elementary 11,866 0.000%19534 Metro Charter 27,519 0.001%19536 Ingenium Charter Middle School 23,990 0.001%19537 High Tech LA Charter 136,970 0.004%19539 Urban Village Middle School 26,041 0.001%19540 Little Lake City Elementary 1,332,946 0.036%19542 Prepa Tec Los Angeles 19,184 0.001%19548 Aspire Titan Academy 69,528 0.002%19549 Aspire Junior Collegiate Academy 85,989 0.002%19551 Long Beach Community College District 3,223,801 0.088%19557 New Opportunities Charter 60,099 0.002%19558 Family First Charter 47,282 0.001%19560 Los Nietos 606,272 0.016%19561 Global Education Collaborative 20,822 0.001%19567 New Horizons Charter Academy 20,524 0.001%19570 Lowell Joint Elementary 1,031,006 0.028%19572 Los Angeles International 29,669 0.001%19579 Student Empowerment Academy 87,130 0.002%19580 Lynwood Unified School District 4,612,283 0.126%19581 Magnolia Science Academy #3 114,145 0.003%19582 Magnolia Science Academy #4 54,618 0.001%19583 Magnolia Science Academy #5 65,067 0.002%19584 Magnolia Science Academy #6 36,981 0.001%19585 Magnolia Science Academy #7 61,993 0.002%19587 Magnolia Science Academy #8 126,456 0.003%19590 Manhattan Beach Unified School District 2,267,091 0.062%19599 Milagro Charter 85,677 0.002%19605 Monrovia Unified School District 1,990,278 0.054%19607 Monsenor Oscar Romero Charter Middle School 87,369 0.002%19611 Rowland Heights Charter Academy 10,574 0.000%19615 Montague Charter Academy 390,661 0.011%19619 Ivy Academia 329,546 0.009%19620 Montebello Unified School District 10,782,309 0.293%
The accompanying notes are an integral part of these schedules.
11

104 CALSTRS COMPREHENSIVE ANNUAL FINANCIAL REPORT 2014
SCHEDULE OF PROPORTIONATE SHARE OF CONTRIBUTIONS FOR EMPLOYERS AND NONEMPLOYER CONTRIBUTING ENTITY
California State Teachers' Retirement SystemSchedule of Proportionate Share of Contributionsfor Employers and Nonemployer Contributing Entityfor the Year Ended June 30, 2014 Schedule IX (Continued)
Employer Reporting Number Employer NameCalSTRS-Calculated
Employer Contribution
EmployerProportionateShare of Total
CalSTRS-CalculatedEmployer
Contribution19630 Mt. San Antonio Community College District 5,321,299$ 0.145%19640 Mountain View Elementary 2,788,108 0.076%19641 Multicultural Learning Center 100,740 0.003%19645 New Designs Charter 215,959 0.006%19646 New Designs Charter- Watts 102,376 0.003%19647 New Academy Canoga Park 125,678 0.003%19649 N.E.W. Academy of Science and Arts 84,384 0.002%19650 Newhall Elementary 2,211,925 0.060%19654 New City 102,274 0.003%19658 Ocean Charter 111,650 0.003%19659 Crenshaw Arts-Tech Charter High 57,021 0.002%19660 Norwalk-La Mirada Unified School District 6,662,567 0.181%19661 Odyssey Charter 95,434 0.003%19663 New Heights Charter 90,779 0.002%19665 New Los Angeles Charter 73,752 0.002%19667 New Millennium Secondary 107,506 0.003%19668 Opportunities Unlimited Charter High 47,802 0.001%19669 Stella Middle Charter Academy 166,962 0.005%19675 Pacoima Charter Elementary 452,637 0.012%19678 Palmdale Aerospace Academy 150,488 0.004%19680 Palmdale Elementary 5,880,205 0.160%19691 Palos Verdes Peninsula Unified School District 3,682,149 0.100%19692 Para Los Ninos Charter 115,550 0.003%19693 Aspire Ollin University Preparatory Academy 163,326 0.004%19694 Para Los Ninos-Evelyn Thurman Gratts Primary 106,875 0.003%19695 Para Los Ninos Middle Charter 38,534 0.001%19700 Paramount Unified School District 5,104,924 0.139%19705 Pasadena Area Community College District 4,246,432 0.116%19710 Pasadena Unified School District 5,904,093 0.161%19720 Pomona Unified School District 9,382,084 0.255%19725 Las Familias Del Pueblo Value Charter 136,282 0.004%19734 James Jordan Middle School 81,146 0.002%19739 Our Community Charter 111,204 0.003%19740 Redondo Beach Unified School District 3,074,476 0.084%19746 Granada Hills Charter High 1,224,342 0.033%19749 Rio Hondo Community College District 2,375,569 0.065%19760 Rosemead Elementary 919,464 0.025%19771 Rowland Unified School District 5,190,913 0.141%19780 San Gabriel Unified School District 1,571,964 0.043%19781 Animo Ralph Bunche High 196,912 0.005%19782 Animo Pat Brown 190,351 0.005%19783 Animo Watts College Preparatory Academy 166,787 0.005%19784 Alliance William and Carol Ouchi High 271,882 0.007%19786 Animo Locke Technology High 41,114 0.001%19787 Animo Locke 1 College Preparatory Academy 701,637 0.019%19788 Alliance Marc and Eva Stern Math and Science High 188,493 0.005%19789 Alliance College-Ready Academy High 228,821 0.006%19790 San Marino Unified School District 1,156,617 0.031%19791 New Village Charter 65,545 0.002%19793 Animo Jackie Robinson High 197,177 0.005%19795 Santa Clarita Community College District 2,115,747 0.058%19797 Triumph Academy 88,625 0.002%19798 Excel Academy 83,835 0.002%19800 Santa Monica-Malibu Unified School District 4,613,909 0.126%19801 Santa Monica Community College District 4,617,545 0.126%19804 Santa Monica Boulevard Community Charter 312,209 0.008%19805 Santa Rose Charter Academy 58,200 0.002%19806 Nueva Esperanza Charter 86,064 0.002%19809 Century Academy for Excellence 79,076 0.002%19810 Saugus Union Elementary 3,156,917 0.086%19813 Lou Dantzler Preparatory Charter Middle School 73,666 0.002%19814 Frederick Douglass Academy Middle School 61,861 0.002%19815 Frederick Douglass Academy High 106,899 0.003%19816 Frederick Douglass Academy Elementary 73,454 0.002%19817 Animo Locke II College Preparatory Academy 57,336 0.002%19826 Bright Star Secondary Charter Academy 129,087 0.004%19827 Los Feliz Charter for the Arts 142,899 0.004%
The accompanying notes are an integral part of these schedules.
12

105FINANCIAL
California State Teachers' Retirement SystemSchedule of Proportionate Share of Contributionsfor Employers and Nonemployer Contributing Entityfor the Year Ended June 30, 2014 Schedule IX (Continued)
Employer Reporting Number Employer NameCalSTRS-Calculated
Employer Contribution
EmployerProportionateShare of Total
CalSTRS-CalculatedEmployer
Contribution19830 Acton-Agua Dulce Unified School District 465,055$ 0.013%19831 Lou Dantzler Preparatory Charter Elementary 75,675 0.002%19832 Lou Dantzler Preparatory Charter High 11,517 0.000%19833 Soledad Enrichment Center (SEA) 539,244 0.015%19836 Palisades Charter High 985,055 0.027%19837 California Virtual Academy at Los Angele 3,598 0.000%19838 California Virtual Academy at Los Angelas 864,199 0.024%19839 Wisdom Academy for Young Scientists Charter 108,039 0.003%19840 South Bay Union High (170) 0.000%19841 Animo College Preparatory Academy 156,874 0.004%19842 Animo Charter Middle School #3 191,355 0.005%19843 Animo Charter Middle School #4 204,069 0.006%19844 Animo Westside Charter Middle School 114,576 0.003%19850 South Pasadena Unified School District 1,643,290 0.045%19857 Pasadena Rosebud Academy 37,934 0.001%19860 South Whittier Elementary 1,044,821 0.028%19863 Southeast Regional Occupational Program 163,439 0.004%19865 Southern California Regional Occupational Program 212,187 0.006%19870 Sulphur Springs Union Elementary 1,855,722 0.051%19874 Synergy Quantum Academy 158,949 0.004%19875 Synergy Charter Academy 113,949 0.003%19876 Synergy Kinetic Academy 114,974 0.003%19877 School of Arts and Enterprise 162,996 0.004%19878 Guidance Charter 104,345 0.003%19879 Teach Academy of Technologies 43,373 0.001%19880 Temple City Unified School District 1,908,271 0.052%19885 Accelerated Charter Elementary 186,482 0.005%19886 Wallis Annenberg High 114,399 0.003%19887 Accelerated Elementary Charter 56,654 0.002%19891 Los Angeles Leadership Primary Academy 52,938 0.001%19900 Torrance Unified School District 7,630,932 0.208%19905 Tri-Cities Regional Occupational Program 123,789 0.003%19906 Magnolia Science Academy #2 112,228 0.003%19907 Valor Academy Charter 137,750 0.004%19908 Valley Charter Elementary 79,428 0.002%19909 Valley Charter Middle School 43,926 0.001%19910 Valle Lindo Elementary 369,632 0.010%19911 Fenton Primary Center 227,553 0.006%19913 Vaughn Next Century Learning Center 674,880 0.018%19915 View Park Preparatory Accelerated Charter 155,017 0.004%19916 View Park Middle Preparatory Accelerated Charter 83,499 0.002%19917 View Park High Preparatory Accelerated Charter 154,172 0.004%19920 Vista Charter Middle School #920 93,973 0.003%19921 Walnut Valley Unified School District 4,508,213 0.123%19925 Watts Learning Center 92,222 0.003%19926 Alliance College-Ready Academy High 495 0.000%19927 Alliance Health Services Academy High 153,134 0.004%19928 Alliance Media Arts and Entertainment Design High 96,881 0.003%19929 Alliance Environmental Science and Technology High 201,613 0.005%19930 West Covina Unified School District 3,056,427 0.083%19931 Watts Learning Center Charter Middle School 63,231 0.002%19934 Global Education Academy 66,319 0.002%19936 Ivy Bound Academy Math, Science and Tech Charter 36,254 0.001%19937 Center for Advanced Learning 68,148 0.002%19938 Westside Innovative School House 95,524 0.003%19940 Westside Union Elementary 2,511,568 0.068%19941 Ivy Bound Academy #2 8,557 0.000%19945 Magnolia Science Academy 141,008 0.004%19950 Whittier City Elementary 2,058,359 0.056%19951 Thurgood Marshall Charter Middle School 7,203 0.000%19958 Clerity Cyad Charter 175,915 0.005%19960 Whittier Union High 4,599,732 0.125%19961 Celerity Troika Charter 143,841 0.004%19964 Micro Enterprise Charter Academy (MECA) 3,061 0.000%19965 Celerity Cardinal Charter 81,099 0.002%19966 Celerity Palmati Charter 92,695 0.003%19967 Celerity Sirius Charter 132,764 0.004%
The accompanying notes are an integral part of these schedules.
13
SCHEDULE OF PROPORTIONATE SHARE OF CONTRIBUTIONS FOR EMPLOYERS AND NONEMPLOYER CONTRIBUTING ENTITY

106 CALSTRS COMPREHENSIVE ANNUAL FINANCIAL REPORT 2014
California State Teachers' Retirement SystemSchedule of Proportionate Share of Contributionsfor Employers and Nonemployer Contributing Entityfor the Year Ended June 30, 2014 Schedule IX (Continued)
Employer Reporting Number Employer NameCalSTRS-Calculated
Employer Contribution
EmployerProportionateShare of Total
CalSTRS-CalculatedEmployer
Contribution19970 William S. Hart Union High 7,208,784$ 0.196%19980 Wilsona Elementary 340,234 0.009%19981 Santa Clarita Valley International 183,897 0.005%19990 Wiseburn Elementary 859,401 0.023%19999 Los Angeles County Superintendent 7,269,550 0.198%00019 Los Angeles County Office of Education 336,793,655$
20011 Ezequiel Tafoya Alvarado Academy 91,332 0.002%20017 Alview-Dairyland Union Elementary 93,055 0.003%20035 Bass Lake Joint Union Elementary 236,670 0.006%20040 Golden Valley Unified School District 579,465 0.016%20050 Sherman Thomas Charter 63,622 0.002%20055 Chowchilla Elementary 574,142 0.016%20088 Chawanakee Unified School District 311,310 0.008%20120 Madera Unified School District 5,524,930 0.150%20150 Raymond-Knowles Union Elementary 26,417 0.001%20670 Madera County Superintendent 859,406 0.023%20705 Chowchilla Union High 290,182 0.008%20710 Yosemite Unified School District 561,092 0.015%20755 Western Sierra Charter 76,531 0.002%00020 Madera County Office of Education 9,288,154$
21005 Bolinas-Stinson Union 102,435 0.003%21011 Dixie Elementary 733,910 0.020%21017 Kentfield Elementary 601,834 0.016%21019 Laguna Joint Elementary 10,416 0.000%21021 Lagunitas Elementary 100,178 0.003%21023 Larkspur-Corte Madera School District 680,948 0.019%21025 Lincoln Elementary 6,969 0.000%21029 Mill Valley Elementary 1,328,036 0.036%21031 Nicasio 31,197 0.001%21035 Reed Union Elementary 684,929 0.019%21037 Ross Elementary 236,378 0.006%21045 San Rafael City Elementary 1,455,671 0.040%21047 Sausalito Marin City 134,403 0.004%21053 Union Joint Elementary 5,991 0.000%21064 Shoreline Unified School District 401,275 0.011%21065 Novato Unified School District 2,625,760 0.071%21066 Novato Charter 64,921 0.002%21074 San Rafael City High 1,047,225 0.028%21076 Tamalpais Union High 2,278,914 0.062%21085 College of Marin 1,299,232 0.035%21089 Ross Valley Elementary 869,188 0.024%21091 Marin County Office of Education 640,293 0.017%00021 Marin County Office of Education 15,340,103$
22010 Mariposa County Unified School District 646,129 0.018%22013 Sierra Foothill Charter 23,782 0.001%00022 Mariposa County Office of Education 669,911$
23040 Mendocino County Office of Education 324,273 0.009%23042 Manchester Union Elementary 18,522 0.001%23044 Anderson Valley Unified School District 183,716 0.005%23045 Fort Bragg Unified School District 614,438 0.017%23046 Mendocino Unified School District 219,425 0.006%23047 Round Valley Unified School District 143,543 0.004%23048 Laytonville Unified School District 132,679 0.004%23049 Leggett Valley Unified School District 54,992 0.001%23050 Willits Unified School District 436,600 0.012%23051 Mendocino-Lake Community College District 637,338 0.017%23054 Potter Valley Community Unified School District 101,135 0.003%23055 Ukiah Unified School District 1,744,595 0.047%23056 Willits Charter 42,669 0.001%23058 Redwood Academy of Ukiah 62,893 0.002%23059 Tree of Life Charter 21,674 0.001%23060 La Vida Independent Study Charter 19,999 0.001%23061 Arena Elementary/Point Arena High 180,426 0.005%
The accompanying notes are an integral part of these schedules.
14
SCHEDULE OF PROPORTIONATE SHARE OF CONTRIBUTIONS FOR EMPLOYERS AND NONEMPLOYER CONTRIBUTING ENTITY

107FINANCIAL
SCHEDULE OF PROPORTIONATE SHARE OF CONTRIBUTIONS FOR EMPLOYERS AND NONEMPLOYER CONTRIBUTING ENTITY
California State Teachers' Retirement SystemSchedule of Proportionate Share of Contributionsfor Employers and Nonemployer Contributing Entityfor the Year Ended June 30, 2014 Schedule IX (Continued)
Employer Reporting Number Employer NameCalSTRS-Calculated
Employer Contribution
EmployerProportionateShare of Total
CalSTRS-CalculatedEmployer
Contribution23062 Eel River Charter 9,731$ 0.000%23063 River Oak Charter 53,349 0.001%23064 Three Rivers Charter 18,767 0.001%00023 Mendocino County Office of Education 5,020,764$
24010 Atwater Elementary 1,433,176 0.039%24020 Ballico-Cressey Elementary 79,199 0.002%24030 Delhi Elementary 866,906 0.024%24050 El Nido Elementary 51,651 0.001%24060 Hilmar Unified School District 675,262 0.018%24070 Merced River Union Elementary 54,262 0.001%24090 Le Grand Union Elementary 116,864 0.003%24100 Livingston Union Elementary 832,895 0.023%24110 Los Banos Unified School District 2,810,542 0.076%24120 Mcswain Union Elementary 259,144 0.007%24130 Merced City Elementary 3,572,936 0.097%24140 Gustine Unified School District 522,130 0.014%24150 Plainsburg Union Elementary 23,925 0.001%24160 Planada Elementary 267,434 0.007%24170 Snelling-Merced Falls Union Elementary 22,433 0.001%24190 Dos Palos-Oro Loma Joint Unified School District 656,642 0.018%24200 Weaver Union 887,532 0.024%24210 Winton Elementary 596,271 0.016%24230 Le Grand Union High 181,450 0.005%24240 Merced Union High 3,578,818 0.097%24250 Merced Community College District 1,581,894 0.043%24260 Merced County Office of Education 1,521,372 0.041%24550 Green Valley Charter 19,894 0.001%00024 Merced County Office of Education 20,612,632$
25067 Modoc County Office of Education 114,580 0.003%25068 Modoc Joint Unified School District 222,918 0.006%25069 Tulelake Basin Joint Unified School District 189,321 0.005%25109 Surprise Valley Joint Unified School District 41,693 0.001%00025 Modoc County Office of Education 568,512$
26009 Urban Corp Charter School of San Diego 34,010 0.001%26010 Orange County Conservation Corp Charter 19,790 0.001%26011 California Heritage Youth Build Academy 12,371 0.000%26020 Mono County Office of Education 96,164 0.003%26030 Eastern Sierra Unified School District 229,129 0.006%26040 Mammoth Unified School District 436,276 0.012%26050 Mono County Schools Community Library 4,253 0.000%00026 Mono County Office of Education 831,993$
27002 Alisal Union 2,409,223 0.066%27006 Bradley Union Elementary 30,243 0.001%27012 Carmel Unified School District 1,547,549 0.042%27014 Chualar Union Elementary 80,444 0.002%27017 Gonzales Unified School District 818,697 0.022%27020 Graves Elementary 10,641 0.000%27022 Greenfield Union Elementary 868,358 0.024%27024 Hartnell Community College District 1,156,095 0.031%27026 King City Union 867,621 0.024%27028 South Monterey County Joint Union High 566,892 0.015%27030 Lagunita Elementary 29,450 0.001%27034 Mission Union Elementary 43,776 0.001%27039 Monterey Peninsula Unified School District 3,342,381 0.091%27040 Monterey Peninsula Community College District 1,175,365 0.032%27043 North Monterey County Unified School District 1,380,912 0.038%27045 Big Sur Unified School District 14,954 0.000%27046 Pacific Grove Unified School District 1,105,841 0.030%27051 Millennium Charter High 21,760 0.001%27052 Oasis Charter Public 50,550 0.001%27053 International School of Monterey 114,636 0.003%27054 Learning for Life Charter 20,266 0.001%27055 Monterey Bay Charter 67,241 0.002%
The accompanying notes are an integral part of these schedules.
15

108 CALSTRS COMPREHENSIVE ANNUAL FINANCIAL REPORT 2014
SCHEDULE OF PROPORTIONATE SHARE OF CONTRIBUTIONS FOR EMPLOYERS AND NONEMPLOYER CONTRIBUTING ENTITY
California State Teachers' Retirement SystemSchedule of Proportionate Share of Contributionsfor Employers and Nonemployer Contributing Entityfor the Year Ended June 30, 2014 Schedule IX (Continued)
Employer Reporting Number Employer NameCalSTRS-Calculated
Employer Contribution
EmployerProportionateShare of Total
CalSTRS-CalculatedEmployer
Contribution27056 Bay View Academy 69,873$ 0.002%27057 Big Sur Charter 17,791 0.000%27058 Salinas City Elementary 2,380,518 0.065%27060 Salinas Union High 4,736,816 0.129%27062 San Antonio Union Elementary 44,045 0.001%27064 San Ardo Union Elementary 41,403 0.001%27066 San Lucas Union Elementary 19,157 0.001%27068 Santa Rita Union Elementary 784,081 0.021%27071 Soledad Unified School District 1,441,691 0.039%27072 Spreckels Union Elementary 247,190 0.007%27074 Washington Union Elementary 262,482 0.007%27099 Monterey County Office of Education 1,425,229 0.039%00027 Monterey County Office of Education 27,193,171$
28010 Calistoga Joint Unified School District 424,529 0.012%28020 Howell Mountain Elementary 49,419 0.001%28030 Napa Valley Community College District 817,417 0.022%28040 Napa County Office of Education 400,343 0.011%28050 Napa Valley Unified School District 6,109,504 0.166%28055 Stone Bridge 64,848 0.002%28060 Pope Valley Union Elementary 32,788 0.001%28070 Saint Helena Unified School District 888,917 0.024%00028 Napa County Office of Education 8,787,765$
29002 Chicago Park Elementary 49,204 0.001%29003 Clear Creek Elementary 43,332 0.001%29004 Grass Valley Elementary 558,990 0.015%29005 Nevada City Elementary 259,975 0.007%29007 Pleasant Ridge Union Elementary 433,166 0.012%29008 Pleasant Valley Elementary 141,015 0.004%29009 Ready Springs Union Elementary 85,305 0.002%29010 Union Hill Elementary 226,193 0.006%29011 Twin Ridges Elementary 37,897 0.001%29013 Nevada Joint Union High 1,059,855 0.029%29050 Nevada County Office of Education 540,357 0.015%29052 Muir Charter 468,232 0.013%29063 Los Angeles Conservation Corps Charter 6,672 0.000%29064 Nevada County Charter Services Authority 35,321 0.001%00029 Nevada County Office of Education 3,945,514$
30004 Anaheim City 6,610,249 0.180%30008 Buena Park Elementary 1,780,409 0.048%30012 Centralia Elementary 1,540,154 0.042%30016 Cypress Elementary 1,232,135 0.034%30020 Fountain Valley Elementary 1,921,760 0.052%30022 Fullerton Elementary 4,741,642 0.129%30028 Huntington Beach City Elementary 2,061,194 0.056%30030 La Habra City Elementary 1,777,533 0.048%30034 Magnolia Elementary 2,302,260 0.063%30038 Ocean View 3,070,122 0.084%30052 Savanna Elementary 799,259 0.022%30053 Orange County School of the Arts 674,979 0.018%30054 Journey Charter 77,717 0.002%30055 El Sol Santa Ana Science and Arts Academy 173,959 0.005%30057 Edward B. Cole Academy 82,232 0.002%30058 Orange County Educational Arts Academy 139,086 0.004%30060 Westminster Elementary 3,407,671 0.093%30064 Anaheim Union High 11,148,069 0.303%30066 Brea Olinda Unified School District 1,646,238 0.045%30068 Capistrano Unified School District 15,567,310 0.424%30070 Fullerton Joint Union High 5,338,318 0.145%30072 Garden Grove Unified School District 16,258,140 0.442%30074 Huntington Beach Union High 5,556,256 0.151%30075 Irvine Unified School District 9,453,317 0.257%30076 Laguna Beach Unified School District 1,559,115 0.042%30077 Los Alamitos Unified School District 3,412,908 0.093%30078 Newport-Mesa Unified School District 8,608,308 0.234%
The accompanying notes are an integral part of these schedules.
16

109FINANCIAL
SCHEDULE OF PROPORTIONATE SHARE OF CONTRIBUTIONS FOR EMPLOYERS AND NONEMPLOYER CONTRIBUTING ENTITY
California State Teachers' Retirement SystemSchedule of Proportionate Share of Contributionsfor Employers and Nonemployer Contributing Entityfor the Year Ended June 30, 2014 Schedule IX (Continued)
Employer Reporting Number Employer NameCalSTRS-Calculated
Employer Contribution
EmployerProportionateShare of Total
CalSTRS-CalculatedEmployer
Contribution30080 Orange Unified School District 9,080,134$ 0.247%30082 Placentia-Yorba Linda Unified School District 8,099,039 0.220%30083 Saddleback Valley Unified School District 9,208,039 0.251%30084 Santa Ana Unified School District 18,419,826 0.501%30087 Tustin Unified School District 7,225,808 0.197%30088 North Orange County Community College District 5,842,659 0.159%30090 Coast Community College District 4,998,623 0.136%30092 Rancho Santiago Community College District 4,978,668 0.135%30093 North Orange County Regional Occupational Program 623,076 0.017%30094 Orange County Office of Education 4,068,431 0.111%30095 Coastline Regional Occupational Program 169,517 0.005%30096 South Orange County Community College District 4,495,734 0.122%30097 Capistrano-Laguna Beach ROP 94,077 0.003%30201 Capistrano Connections Academy Charter 428,511 0.012%30205 Nova Academy Early College High 110,226 0.003%30210 SBC- Pacific Technology Santa Ana 32,385 0.001%30215 The Academy 44,041 0.001%00030 Orange County Office of Education 188,859,134$
31001 Ackerman Elementary 156,204 0.004%31002 Alta-Dutch Flat Union Elementary 35,269 0.001%31003 Auburn Union Elementary 645,561 0.018%31005 Colfax Elementary 126,455 0.003%31006 Dry Creek Joint Elementary 2,159,189 0.059%31009 Eureka Union 1,066,220 0.029%31010 Foresthill Union Elementary 106,324 0.003%31011 Loomis Union Elementary 809,116 0.022%31012 Newcastle Elementary 203,580 0.006%31016 Placer Hills Union Elementary 254,144 0.007%31018 Rocklin Unified School District 3,497,138 0.095%31019 Roseville City Elementary 3,201,695 0.087%31021 Tahoe-Truckee Unified School District 1,774,535 0.048%31022 Western Placer Unified School District 1,978,426 0.054%31031 Placer Union High 1,402,461 0.038%31032 Roseville Joint Union High 3,622,974 0.099%31050 Placer County Office of Education 932,614 0.025%31061 Horizon Charter 655,765 0.018%31062 Rocklin Academy 294,992 0.008%31063 Maria Montessori Charter Academy 80,114 0.002%31064 Core Placer Charter 58,727 0.002%31065 Sierra Expeditionary Learning 45,170 0.001%31067 Creekside Charter 62,186 0.002%00031 Placer County Office of Education 23,168,859$
32040 Plumas County Office of Education 68,424 0.002%32041 Plumas Unified School District 538,226 0.015%32051 Feather River Community College District 257,161 0.007%32061 Plumas Charter 51,533 0.001%00032 Plumas County Office of Education 915,344$
33001 Desert Community College District 1,501,008 0.041%33003 Mt. San Jacinto Community College District 1,667,525 0.045%33005 Palo Verde Community College District 323,577 0.009%33007 Riverside Community College District 5,172,051 0.141%33010 Alvord Unified School District 6,507,569 0.177%33013 Banning Unified School District 1,379,856 0.038%33018 Beaumont Unified School District 2,375,848 0.065%33021 Coachella Valley Unified School District 6,155,595 0.168%33024 Corona-Norco Unified School District 1,414,505 0.038%33027 Desert Center Unified School District 8,190 0.000%33030 Desert Sands Unified School District 8,919,374 0.243%33034 Lake Elsinore Unified School District 7,366,645 0.200%33039 Hemet Unified School District 6,709,097 0.183%33040 Santa Rose Academy 263,619 0.007%33041 River Springs Charter 1,192,166 0.032%33043 Imagine Schools Riverside County 11,944 0.000%33045 Gateway College and Career Academy 21,013 0.001%
The accompanying notes are an integral part of these schedules.
17

110 CALSTRS COMPREHENSIVE ANNUAL FINANCIAL REPORT 2014
SCHEDULE OF PROPORTIONATE SHARE OF CONTRIBUTIONS FOR EMPLOYERS AND NONEMPLOYER CONTRIBUTING ENTITY
California State Teachers' Retirement SystemSchedule of Proportionate Share of Contributionsfor Employers and Nonemployer Contributing Entityfor the Year Ended June 30, 2014 Schedule IX (Continued)
Employer Reporting Number Employer NameCalSTRS-Calculated
Employer Contribution
EmployerProportionateShare of Total
CalSTRS-CalculatedEmployer
Contribution33046 Jurupa Unified School District 6,487,267$ 0.177%33049 Menifee Union Elementary 2,754,669 0.075%33052 Moreno Valley Unified School District 11,933,659 0.325%33056 Murrieta Valley Unified School District 6,936,303 0.189%33058 Nuview Union 609,809 0.017%33061 Palm Springs Unified School District 7,300,042 0.199%33064 Palo Verde Unified School District 912,216 0.025%33067 Perris Elementary 1,887,509 0.051%33071 Perris Union High 3,181,359 0.087%33074 Riverside Unified School District 13,479,075 0.367%33081 Romoland Elementary 960,892 0.026%33084 San Jacinto Unified School District 2,831,229 0.077%33088 Temecula Valley Unified School District 9,112,262 0.248%33090 Val Verde Unified School District 6,337,087 0.172%33099 Riverside County Office of Education 3,467,429 0.094%33101 San Jacinto Valley Academy Charter 195,161 0.005%33102 Heritage Classical Charters of America 262,084 0.007%33104 Gateway to College Early College High 32,925 0.001%33105 Temecula Valley Charter 85,838 0.002%33106 Sycamore Academy of Science and Cultural Arts 55,811 0.002%33107 Nova Academy Coachella 53,374 0.001%33108 Keegan Academy 7,260 0.000%33110 Pivot Charter-Riverside 1,222 0.000%33111 Reach Leadership Academy 58,862 0.002%33112 Excel Prep Charter- IE 113,011 0.003%00033 Riverside County Office of Education 130,045,937$
34020 St. Hope Public School #7 488,717 0.013%34021 Delta Elementary Charter 62,334 0.002%34022 Capitol Heights Academy 235,396 0.006%34023 Golden Valley Charter of Sacramento 86,365 0.002%34024 Gateway Community Charters 973,480 0.026%34025 SBC- Pacific Technology Orangevale 5,981 0.000%34026 Language Academy of Sacramento 113,551 0.003%34027 Heritage Peak Charter 320,149 0.009%34029 Yav Pem Suab Academy-Sacramento 94,234 0.003%34031 California Montessori Project-Elk Grove 71,759 0.002%34032 California Montessori Project-Capitol CA 65,429 0.002%34033 CA Montessori Project-San Juan AR/CAR 243,092 0.007%34035 Capitol Collegiate Academy 41,880 0.001%34080 Arcohe Union Elementary 126,451 0.003%34081 Center Joint Unified School District 1,469,337 0.040%34082 Del Paso Heights Elementary (80) 0.000%34083 Elverta Joint Elementary 92,896 0.003%34084 Galt Joint Union Elementary 1,422,727 0.039%34086 Natomas Unified School District 3,889,392 0.106%34087 North Sacramento Elementary 139 0.000%34088 Rio Linda Union Elementary (92) 0.000%34089 Robla Elementary 833,997 0.023%34090 Twin Rivers Unified School District 9,209,115 0.251%34091 River Delta Joint Unified School District 612,877 0.017%34092 Galt Joint Union High 797,892 0.022%34093 Grant Joint Union High 4,746 0.000%34094 Los Rios Community College District 9,330,998 0.254%34095 Elk Grove Unified School District 20,894,049 0.569%34096 Folsom-Cordova Unified School District 6,279,062 0.171%34097 Sacramento City Unified School District 12,532,905 0.341%34098 San Juan Unified School District 14,555,812 0.396%34099 Sacramento County Office of Education 1,657,308 0.045%00034 Sacramento County Office of Education 86,511,898$
35102 Bitterwater-Tully Union Elementary 11,214 0.000%35103 Cienega Union Elementary 738 0.000%35104 Hollister 1,655,771 0.045%35105 Jefferson Elementary 9,716 0.000%35107 North County Joint Union Elementary 195,292 0.005%35109 Panoche Elementary 4,028 0.000%
The accompanying notes are an integral part of these schedules.
18

111FINANCIAL
SCHEDULE OF PROPORTIONATE SHARE OF CONTRIBUTIONS FOR EMPLOYERS AND NONEMPLOYER CONTRIBUTING ENTITY
California State Teachers' Retirement SystemSchedule of Proportionate Share of Contributionsfor Employers and Nonemployer Contributing Entityfor the Year Ended June 30, 2014 Schedule IX (Continued)
Employer Reporting Number Employer NameCalSTRS-Calculated
Employer Contribution
EmployerProportionateShare of Total
CalSTRS-CalculatedEmployer
Contribution35111 Southside Elementary 63,660$ 0.002%35112 Tres Pinos Union Elementary 37,138 0.001%35113 Willow Grove Union Elementary 7,366 0.000%35150 San Benito High 804,586 0.022%35180 Aromas/San Juan Unified School District 387,074 0.011%35190 San Benito County Office of Education 233,004 0.006%00035 San Benito County Office of Education 3,409,587$
36201 Adelanto Elementary 1,938,939 0.053%36202 Alta Loma Elementary 1,526,005 0.042%36203 Apple Valley Unified School District 3,664,101 0.100%36205 ASA Charter 48,177 0.001%36206 Bear Valley Unified School District 674,597 0.018%36208 Barstow Unified School District 1,390,930 0.038%36209 Central Elementary 1,267,870 0.035%36210 Chino Valley Unified School District 8,260,978 0.225%36211 New Vision Middle School 63,751 0.002%36213 Colton Joint Unified School District 6,500,119 0.177%36214 Oxford Preparatory Academy 362,078 0.010%36215 Cucamonga Elementary 822,770 0.022%36216 Excel Prep Charter 21,704 0.001%36217 Carden Virtual Academy Charter 158,294 0.004%36218 Etiwanda Elementary 3,943,427 0.107%36219 Encore High for Performing and Visual Arts 164,932 0.004%36220 Casa Ramona Academy for Tech,Community, Education 79,416 0.002%36222 Fontana Unified School District 11,570,128 0.315%36223 Hope Academy Charter 153,811 0.004%36224 Helendale Elementary 214,455 0.006%36228 Hesperia Unified School District 5,216,997 0.142%36229 Grove Charter 59,018 0.002%36230 Academy for Academic Excellence 364,199 0.010%36231 Inland Leaders Charter 186,731 0.005%36232 Lucerne Valley Unified School District 232,749 0.006%36233 Mirus Secondary 72,531 0.002%36234 Laverne Elementary Preparatory Academy 66,344 0.002%36235 Morongo Unified School District 2,650,649 0.072%36236 Mt. Baldy Joint Elementary 42,645 0.001%36237 Public Safety Academy 93,204 0.003%36238 Mountain View Elementary 706,886 0.019%36239 Summit Leadership Academy High Desert 44,317 0.001%36241 Needles Unified School District 231,848 0.006%36243 Norton Space and Aeronautics Academy 118,945 0.003%36244 Pathways to College 54,785 0.001%36245 Ontario-Montclair Elementary 7,598,140 0.207%36246 Oro Grande Elementary 760,324 0.021%36249 Redlands Unified School District 6,365,102 0.173%36250 Colton Redlands Yucaipa ROP 197,365 0.005%36251 Rim of The World Unified School District 992,406 0.027%36252 Silver Valley Unified School District 808,718 0.022%36253 Sky Mountain Charter 361,041 0.010%36254 Snowline Joint Unified School District 2,075,583 0.056%36255 Trona Joint Unified School District 137,150 0.004%36256 Upland Unified School District 37 0.000%36257 Victor Elementary 2,672,214 0.073%36258 Empire Springs Charter 64,738 0.002%36259 Upland Unified School District 2,998,632 0.082%36260 Yucaipa-Calimesa Joint Unified School District 2,508,375 0.068%36263 Chaffey Joint Union High 7,655,612 0.208%36264 Baldy View Regional Occupational Program 138,409 0.004%36266 Soar Charter Academy 99,957 0.003%36267 Excelsior Education Center Charter 324,283 0.009%36268 Victor Valley Union High 2,266,763 0.062%36270 Barstow Community College District 375,310 0.010%36271 Chaffey Community College District 2,480,126 0.067%36272 San Bernardino Community College District 2,135,259 0.058%36273 Victor Valley Community College District 1,550,618 0.042%36274 Rialto Unified School District 7,418,732 0.202%
The accompanying notes are an integral part of these schedules.
19

112 CALSTRS COMPREHENSIVE ANNUAL FINANCIAL REPORT 2014
SCHEDULE OF PROPORTIONATE SHARE OF CONTRIBUTIONS FOR EMPLOYERS AND NONEMPLOYER CONTRIBUTING ENTITY
California State Teachers' Retirement SystemSchedule of Proportionate Share of Contributionsfor Employers and Nonemployer Contributing Entityfor the Year Ended June 30, 2014 Schedule IX (Continued)
Employer Reporting Number Employer NameCalSTRS-Calculated
Employer Contribution
EmployerProportionateShare of Total
CalSTRS-CalculatedEmployer
Contribution36275 Provisional Accelerated Learning Academy 31,222$ 0.001%36276 San Bernardino City Unified School District 16,699,662 0.454%36278 Baker Valley Unified School District 59,270 0.002%36279 Copper Mountain Community College District 362,097 0.010%36286 San Bernardino County Office of Education 3,175,797 0.086%00036 San Bernardino County Office of Education 125,281,272$
37001 Alpine Union Elementary 570,042 0.016%37004 Bonsall Union Elementary 648,710 0.018%37006 Cajon Valley Union Elementary 5,250,433 0.143%37007 Cardiff Elementary 319,645 0.009%37008 Darnall E-Charter 213,361 0.006%37009 Chula Vista Elementary 9,087,308 0.247%37010 Dehesa Elementary 77,468 0.002%37011 Del Mar Union School District 1,909,525 0.052%37012 Literacy First Charter 386,301 0.011%37013 Classical Academy 178,853 0.005%37014 Encinitas Union Elementary 2,136,757 0.058%37015 Escondido Union Elementary 5,979,038 0.163%37016 Fallbrook Union Elementary 1,758,750 0.048%37017 Jamul-Dulzura Union Elementary 312,330 0.008%37018 Julian Union Elementary 136,240 0.004%37019 Lakeside Union Elementary 1,669,581 0.045%37020 La Mesa-Spring Valley 3,950,865 0.108%37021 Lemon Grove Elementary 1,286,392 0.035%37022 Julian Charter 596,266 0.016%37023 National Elementary 1,960,241 0.053%37028 Rancho Santa Fe Elementary 421,752 0.011%37030 Heritage K-8 Charter 136,231 0.004%37031 San Pasqual Union Elementary 170,520 0.005%37032 Santee Elementary 2,035,831 0.055%37033 San Ysidro Elementary 1,546,062 0.042%37034 Solana Beach Elementary 1,452,826 0.040%37035 South Bay Union Elementary 2,791,660 0.076%37036 Spencer Valley Elementary 26,055 0.001%37037 Vallecitos Elementary 75,213 0.002%37040 Escondido Union High 2,467,524 0.067%37041 Fallbrook Union High 824,116 0.022%37042 Grossmont Union High 6,463,499 0.176%37043 Julian Union High 74,432 0.002%37044 Helix High Charter 652,580 0.018%37045 San Dieguito Union High 4,615,641 0.126%37046 Sweetwater Union High 14,462,388 0.394%37047 Coronado Unified School District 1,152,655 0.031%37048 Mountain Empire Unified School District 757,238 0.021%37049 Ramona City Unified School District 1,611,960 0.044%37050 San Diego Unified School District 42,657,724 1.161%37051 Vista Unified School District 7,029,143 0.191%37052 Palomar Community College District 3,340,192 0.091%37053 Grossmont-Cuyamaca Community College District 3,064,029 0.083%37054 Miracosta Community College District 2,839,281 0.077%37055 Southwestern Community College District 2,921,703 0.080%37056 High Tech High 686,048 0.019%37058 Audeo Charter 181,394 0.005%37060 San Diego Community College District 7,183,254 0.195%37061 Poway Unified School District 10,943,302 0.298%37062 Borrego Springs Unified School District 141,297 0.004%37063 Carlsbad Unified School District 3,226,686 0.088%37064 Oceanside Unified School District 7,137,436 0.194%37065 San Marcos Unified School District 5,782,326 0.157%37066 Warner Unified School District 86,955 0.002%37067 Valley Center-Pauma Unified School District 1,458,760 0.040%37069 Charter of San Diego 580,576 0.016%37073 Guajome Park Academy Charter 337,966 0.009%37077 Escondido Charter High 232,076 0.006%37083 Siatech 483,159 0.013%37084 Coastal Academy 202,126 0.006%
The accompanying notes are an integral part of these schedules.
20

113FINANCIAL
SCHEDULE OF PROPORTIONATE SHARE OF CONTRIBUTIONS FOR EMPLOYERS AND NONEMPLOYER CONTRIBUTING ENTITY
California State Teachers' Retirement SystemSchedule of Proportionate Share of Contributionsfor Employers and Nonemployer Contributing Entityfor the Year Ended June 30, 2014 Schedule IX (Continued)
Employer Reporting Number Employer NameCalSTRS-Calculated
Employer Contribution
EmployerProportionateShare of Total
CalSTRS-CalculatedEmployer
Contribution37085 Preuss School UCSD Charter 20,105$ 0.001%37086 Dehesa Charter 282,296 0.008%37088 Learning Choice Academy 210,170 0.006%37092 Pacific View Charter 117,707 0.003%37094 California Virtual Academy at San Diego 681,168 0.019%37095 Excellence in Justice and Education Charter 158,427 0.004%37096 Bayshore Prep Charter 40,933 0.001%37097 Steele Canyon High Charter 508,621 0.014%37099 San Diego County Office of Education 3,182,497 0.087%37101 Albert Einstein Academies 257,053 0.007%37103 IFTIN Charter 108,033 0.003%37107 Explorer Elementary Charter 66,141 0.002%37110 Gompers Preparatory Academy 263,843 0.007%37111 Harriet Tubman Village Center 102,202 0.003%37116 Holly Drive Leadership Academy 30,328 0.001%37118 Keiller Leadership Academy 137,436 0.004%37119 Health Sciences High and Middle College 157,251 0.004%37120 Arroyo Paseo Charter High 48,479 0.001%37121 King-Chavez Academy of Excellence 603,860 0.016%37124 McGill School of Success 40,926 0.001%37126 Magnolia Science Academy San Diego 80,157 0.002%37128 Museum School Collaborative 56,071 0.002%37130 Ofarrell Community School 329,166 0.009%37132 San Diego Cooperative Charter 127,526 0.003%37134 Classical Academy High 131,063 0.004%37135 North County Trade Tech High 40,832 0.001%37136 High Tech High Charter 589,644 0.016%37137 Innovations Academy 78,531 0.002%37138 Urban Discovery Academy 88,208 0.002%37142 National University of Health Sciences 160,306 0.004%37144 All Tribes Charter 20,503 0.001%37145 Pacific American Academy 25,819 0.001%37148 Leonardo Da Vinci Health Sciences Charter 56,433 0.002%37150 Evangeline Roberts Institute 27,699 0.001%37154 San Diego Global Vision Academy 62,814 0.002%37155 Coleman Tech Charter 55,214 0.002%37158 Pivot Charter- San Diego 20,645 0.001%37159 Old Town Academy 49,647 0.001%37160 E3 Civic High 56,616 0.002%37161 America's Finest Charter 44,991 0.001%37162 City Heights Preparatory Charter 13,874 0.000%37163 Advanced Institute for Learning 41,482 0.001%37165 Guajome Learning Centers 21,705 0.001%37168 Epiphany Prep Charter 36,304 0.001%37170 Kavod Elementary Charter 18,751 0.001%37177 Community Montessori Charter 56,104 0.002%37178 Laurel Preparatory Academy 23,637 0.001%37179 Heritage Digital Academy Charter Middle School 15,297 0.000%00037 San Diego County Office of Education 190,028,237$
38070 San Francisco Unified School District 24,066,824 0.655%38093 San Francisco County Office of Education 92 0.000%38101 Creative Arts Charter 120,327 0.003%38102 Leadership High 84,376 0.002%38103 Gateway High Charter 255,981 0.007%38104 Edison Charter 161,965 0.004%38106 Urban Pioneers Experiential Academy (113) 0.000%38107 Five Keys Charter (SF Sheriff's) 346,349 0.009%38108 City Arts and Tech High 147,248 0.004%38110 San Franciso Flex Academy 16,287 0.000%38111 Mission Preparatory 45,820 0.001%00038 San Francisco County Office of Education 25,245,156$
39030 Banta Elementary 97,678 0.003%39075 Tracy Joint Unified School District 4,866,671 0.132%39101 Delta Charter 19,819 0.001%39131 Dr Lewis Dolphin Stallworth Sr Charter 20,655 0.001%
The accompanying notes are an integral part of these schedules.
21

114 CALSTRS COMPREHENSIVE ANNUAL FINANCIAL REPORT 2014
California State Teachers' Retirement SystemSchedule of Proportionate Share of Contributionsfor Employers and Nonemployer Contributing Entityfor the Year Ended June 30, 2014 Schedule IX (Continued)
Employer Reporting Number Employer NameCalSTRS-Calculated
Employer Contribution
EmployerProportionateShare of Total
CalSTRS-CalculatedEmployer
Contribution39148 Escalon Unified School District 883,961$ 0.024%39280 Jefferson Elementary 744,963 0.020%39300 Lammersville Unified School District 683,735 0.019%39320 Lincoln Unified School District 2,505,036 0.068%39331 Linden Unified School District 636,856 0.017%39371 Lodi Unified School District 9,266,802 0.252%39395 Acacia Elementary Charter 39,303 0.001%39401 Aspire Public Schools 808,332 0.022%39411 Manteca Unified School District 7,171,402 0.195%39450 New Hope Elementary 61,555 0.002%39460 New Jerusalem Elementary 316,431 0.009%39462 Humphreys College- ABLE 54,481 0.001%39463 California Virtual Academy at San Joaquin 145,045 0.004%39465 New Jerusalem Elementary Charter 3,842 0.000%39466 River Islands Technology Academy 63,270 0.002%39470 Great Valley Academy- Manteca 121,557 0.003%39480 Oak View Union Elementary 112,935 0.003%39500 Rio Valley Charter 84,842 0.002%39511 Ripon Unified School District 847,559 0.023%39550 San Joaquin Delta Community College District 2,386,588 0.065%39560 Stockton Unified School District 11,793,605 0.321%39570 Stockton Collegiate International 225,308 0.006%39575 Team Charter 75,531 0.002%39751 Discovery Charter 308,975 0.008%39999 San Joaquin County Office of Education 1,891,601 0.051%00039 San Joaquin County Office of Education 46,238,338$
40015 Atascadero Unified School District 1,423,267 0.039%40030 Grizzly Challenge Charter 79,265 0.002%40060 Cayucos Elementary 80,493 0.002%40139 Lucia Mar Unified School District 3,427,453 0.093%40185 Paso Robles Joint Unified School District 1,921,572 0.052%40200 Pleasant Valley Joint Union Elementary 40,442 0.001%40208 San Luis Coastal Unified School District 2,849,953 0.078%40215 San Miguel Joint Union 189,090 0.005%40225 Almond Acres Charter Academy 57,007 0.002%40240 Shandon Joint Unified School District 112,523 0.003%40267 Templeton Unified School District 727,265 0.020%40670 San Luis Obispo County Office of Education 490,294 0.013%40716 Coast Unified School District 328,980 0.009%40717 Bellevue-Santa Fe Charter 57,301 0.002%40910 San Luis Obispo County Community College District 1,676,054 0.046%00040 San Luis Obispo County Office of Education 13,460,959$
41001 Bayshore Elementary 105,670 0.003%41002 Belmont-Redwood Shores Elementary 1,342,475 0.037%41003 Brisbane Elementary 216,011 0.006%41004 Burlingame Elementary 1,102,334 0.030%41006 Woodside Elementary 357,609 0.010%41007 Hillsborough City Elementary 987,403 0.027%41008 Jefferson Elementary 1,887,178 0.051%41009 Pacifica 904,042 0.025%41011 Las Lomitas Elementary 860,088 0.023%41012 Menlo Park City Elementary 1,693,745 0.046%41013 Millbrae Elementary 758,596 0.021%41016 Portola Valley Elementary 488,579 0.013%41017 Ravenswood City Elementary 1,349,304 0.037%41018 Redwood City Elementary 3,001,935 0.082%41019 San Bruno Park Elementary 753,662 0.021%41020 San Carlos Elementary 1,170,240 0.032%41021 San Mateo-Foster City Elementary 3,793,907 0.103%41025 San Carlos Charter Learning Center 149,821 0.004%41027 Aspire East Palo Alto Phoenix Academy 214,472 0.006%41029 Summit Preparatory Charter High 123,974 0.003%41030 California Virtual Academy at San Mateo 132,461 0.004%41031 Jefferson Union High 1,644,004 0.045%41033 San Mateo Union High 4,209,920 0.115%
The accompanying notes are an integral part of these schedules.
22
SCHEDULE OF PROPORTIONATE SHARE OF CONTRIBUTIONS FOR EMPLOYERS AND NONEMPLOYER CONTRIBUTING ENTITY

115FINANCIAL
California State Teachers' Retirement SystemSchedule of Proportionate Share of Contributionsfor Employers and Nonemployer Contributing Entityfor the Year Ended June 30, 2014 Schedule IX (Continued)
Employer Reporting Number Employer NameCalSTRS-Calculated
Employer Contribution
EmployerProportionateShare of Total
CalSTRS-CalculatedEmployer
Contribution41034 Sequoia Union High 4,276,183$ 0.116%41040 South San Francisco Unified School District 2,903,653 0.079%41041 Cabrillo Unified School District 1,042,011 0.028%41042 La Honda-Pescadero Unified School District 178,475 0.005%41050 San Mateo County Community College District (7,334) 0.000%41060 San Mateo County Office of Education 1,272,174 0.035%41090 Everest Public High 278,791 0.008%41091 East Palo Alto Academy 148,630 0.004%41092 Summit Public Schools: Shasta 35,015 0.001%41093 Connect Community Charter 30,920 0.001%00041 San Mateo County Office of Education 37,405,948$
42001 Ballard Elementary 66,553 0.002%42002 Blochman Union Elementary 46,198 0.001%42004 Buellton Union Elementary 290,985 0.008%42006 Cold Spring Elementary 115,612 0.003%42007 College Elementary 184,050 0.005%42010 Goleta Union Elementary 1,641,157 0.045%42011 Guadalupe Union Elementary 408,371 0.011%42012 Hope Elementary 389,886 0.011%42014 Los Olivos Elementary 157,613 0.004%42015 Montecito Union Elementary 367,376 0.010%42016 Orcutt Union Elementary 1,563,767 0.043%42017 Santa Barbara Elementary 181 0.000%42018 Santa Maria-Bonita 4,491,821 0.122%42019 Solvang Elementary 163,887 0.004%42020 Vista Del Mar Union 69,306 0.002%42031 Santa Barbara High (296) 0.000%42032 Santa Maria Joint Union High 2,308,740 0.063%42033 Santa Ynez Valley Union High 392,068 0.011%42040 Santa Barbara Unified School District 5,047,931 0.137%42041 Lompoc Unified School District 3,049,575 0.083%42042 Carpinteria Unified School District 782,788 0.021%42043 Cuyama Joint Unified School District 86,896 0.002%42051 Allan Hancock Joint Community College District 1,540,351 0.042%42052 Santa Barbara Community College District 2,932,551 0.080%42061 Santa Barbara County Office of Education 1,258,963 0.034%42071 Santa Barbara County Special Education 32,789 0.001%42074 Manzanita Public Charter 115,771 0.003%42075 Peabody Charter 215,851 0.006%42076 Family Partnership Home Study Charter 108,938 0.003%42077 Cesar Estrada Chavez Charter 70,726 0.002%42078 Trivium Charter 95,135 0.003%00042 Santa Barbara County Office of Education 27,995,540$
43104 Alum Rock Union Elementary 4,144,065 0.113%43107 Berryessa Union Elementary 2,372,663 0.065%43108 Cambrian 1,172,094 0.032%43109 Campbell Union Elementary 2,892,438 0.079%43110 Cupertino Union 725,243 0.020%43112 Evergreen Elementary 4,406,193 0.120%43113 Franklin-Mckinley Elementary 3,255,890 0.089%43117 Lakeside Joint 45,218 0.001%43119 Loma Prieta Joint Union Elementary 145,885 0.004%43120 Los Altos Elementary 1,838,000 0.050%43121 Los Gatos Union Elementary 1,358,238 0.037%43122 Luther Burbank 174,423 0.005%43126 Moreland Elementary 1,724,071 0.047%43128 Mt. Pleasant Elementary 872,894 0.024%43129 Mountain View Whisman 1,634,064 0.044%43130 Oak Grove Elementary 3,452,034 0.094%43131 Orchard Elementary 254,367 0.007%43136 Saratoga Union Elementary 976,143 0.027%43137 Sunnyvale 2,418,821 0.066%43139 Union Elementary 1,720,688 0.047%43141 Bullis Charter 313,325 0.009%43142 Leadership Public Schools- San Jose 80,642 0.002%
The accompanying notes are an integral part of these schedules.
23
SCHEDULE OF PROPORTIONATE SHARE OF CONTRIBUTIONS FOR EMPLOYERS AND NONEMPLOYER CONTRIBUTING ENTITY

116 CALSTRS COMPREHENSIVE ANNUAL FINANCIAL REPORT 2014
SCHEDULE OF PROPORTIONATE SHARE OF CONTRIBUTIONS FOR EMPLOYERS AND NONEMPLOYER CONTRIBUTING ENTITY
California State Teachers' Retirement SystemSchedule of Proportionate Share of Contributionsfor Employers and Nonemployer Contributing Entityfor the Year Ended June 30, 2014 Schedule IX (Continued)
Employer Reporting Number Employer NameCalSTRS-Calculated
Employer Contribution
EmployerProportionateShare of Total
CalSTRS-CalculatedEmployer
Contribution43143 Charter of Morgan Hill 179,905$ 0.005%43146 Discovery Charter 241,176 0.007%43147 Rocketship Mateo Sheedy Elementary 721,620 0.020%43148 University Preparatory Academy Charter 155,858 0.004%43149 Voices College-Bound Academy 86,023 0.002%43151 Campbell Union High 2,731,190 0.074%43152 East Side Union High 8,458,815 0.230%43153 Fremont Union High 4,252,747 0.116%43155 Magnolia Science- Santa Clara 100,875 0.003%43156 Los Gatos-Saratoga Joint Union High 1,616,415 0.044%43157 Mountain View- Los Altos Union High 2,318,539 0.063%43158 Gilroy Prep School 110,554 0.003%43159 Cornerstone Academy Preparatory 77,246 0.002%43160 Summit Public School: Tahoma 92,720 0.003%43162 Metropolitan Education District ROP 378,083 0.010%43163 North County Regional Occupational Program 22,795 0.001%43165 Silicon Vally Flex Academy 29,485 0.001%43167 Rocketship Mosaic Elementary 112,920 0.003%43169 Summit Public Schools: Denali 33,443 0.001%43170 Summit Public Charter- Rainier 84,579 0.002%43171 Foothill De Anza Community College District 5,193,221 0.141%43172 Gavilan Joint Community College District 926,421 0.025%43175 West Valley-Mission Community College District 2,818,264 0.077%43176 San Jose/Evergreen Community College District 2,641,742 0.072%43181 Palo Alto Unified School District 7,351,618 0.200%43182 San Jose Unified School District 11,020,940 0.300%43183 Gilroy Unified School District 3,633,540 0.099%43184 Morgan Hill Unified School District 2,461,871 0.067%43185 Milpitas Unified School District 3,739,931 0.102%43186 Downtown College Prep- San Jose USD 120,612 0.003%43187 Downtown College Prep- Alum Rock School 118,804 0.003%43188 Santa Clara Unified School District 5,888,650 0.160%43189 Communitas Charter High 1,590 0.000%43190 Santa Clara County Office of Education 3,434,532 0.093%43240 Ace Charter 161,735 0.004%43252 Latino College Prep Academy 127,662 0.003%43282 Sunrise Middle School 32,266 0.001%43352 San Jose Conservation Corps 84,064 0.002%43452 Escuela Popular Accelerated Family Learning School 142,335 0.004%00043 Santa Clara County Office of Education 107,682,185$
44001 Bonny Doon Union Elementary 48,929 0.001%44002 Happy Valley Elementary 44,768 0.001%44003 Live Oak Elementary 759,560 0.021%44004 Mountain Elementary 49,729 0.001%44005 Pacific Elementary 36,812 0.001%44007 Scotts Valley Unified School District 654,476 0.018%44008 Soquel Union Elementary 591,748 0.016%44011 San Lorenzo Valley Unified School District 873,864 0.024%44012 Santa Cruz County Office of Education 948,532 0.026%44014 Santa Cruz City Schools 2,304,669 0.063%44020 Pajaro Valley Unified School District 6,459,384 0.176%44025 Cabrillo Community College District 1,969,130 0.054%44030 Ceiba College Preparatory 100,523 0.003%44031 Ocean Grove Charter 346,023 0.009%44034 Delta Charter 39,737 0.001%00044 Santa Cruz County Office of Education 15,227,884$
45030 Shasta County Office of Education 403,548 0.011%45031 Gateway Unified School District 833,846 0.023%45032 Anderson Union High 591,774 0.016%45034 Fall River Joint Unified School District 383,269 0.010%45035 Shasta Union High 1,811,162 0.049%45036 Shasta-Tehema-Trinity Joint Community College Dist 1,267,029 0.034%45038 Shasta-Trinity Regional Occupational Program 32,749 0.001%45041 Bella Vista Elementary 93,408 0.003%45042 Black Butte Union Elementary 61,986 0.002%
The accompanying notes are an integral part of these schedules.
24

117FINANCIAL
SCHEDULE OF PROPORTIONATE SHARE OF CONTRIBUTIONS FOR EMPLOYERS AND NONEMPLOYER CONTRIBUTING ENTITY
California State Teachers' Retirement SystemSchedule of Proportionate Share of Contributionsfor Employers and Nonemployer Contributing Entityfor the Year Ended June 30, 2014 Schedule IX (Continued)
Employer Reporting Number Employer NameCalSTRS-Calculated
Employer Contribution
EmployerProportionateShare of Total
CalSTRS-CalculatedEmployer
Contribution45045 Cascade Union Elementary 387,006$ 0.011%45046 Castle Rock Union Elementary 23,400 0.001%45047 Columbia Elementary 258,291 0.007%45048 Cottonwood Union Elementary 281,127 0.008%45049 Enterprise Elementary 1,078,524 0.029%45050 French Gulch-Whiskeytown Elementary 5,240 0.000%45051 Grant Elementary 170,420 0.005%45052 Happy Valley Union Elementary 142,282 0.004%45053 Igo, Ono, Platina Union Elementary 22,989 0.001%45054 Indian Springs Elementary 8,567 0.000%45055 Junction Elementary 62,801 0.002%45057 Millville Elementary 59,419 0.002%45058 Mountain Union Elementary 21,078 0.001%45059 North Cow Creek Elementary 67,729 0.002%45060 Oak Run Elementary 8,189 0.000%45061 Pacheco Union Elementary 138,575 0.004%45062 Redding Elementary 977,937 0.027%45064 Shasta Union Elementary 28,815 0.001%45065 Whitmore Union Elementary 9,716 0.000%45066 Chrysalis Charter 54,296 0.001%45070 Redding School of the Arts #2 147,862 0.004%45071 Academy of Personalized Learning 126,264 0.003%45072 Rocky Point Charter 41,633 0.001%45073 North Woods Discovery School 44,399 0.001%00045 Shasta County Office of Education 9,645,330$
46001 Sierra County Office of Education 27,015 0.001%46006 Sierra-Plumas Joint Unified School District 132,605 0.004%00046 Sierra County Office of Education 159,620$
47001 Big Springs Union Elementary 31,143 0.001%47002 Bogus Elementary 3,711 0.000%47003 Butteville Union Elementary 51,531 0.001%47005 Delphic Elementary 18,844 0.001%47007 Dunsmuir Elementary 44,011 0.001%47008 Dunsmuir Joint Union High 33,461 0.001%47012 Forks of Salmon Elementary 3,114 0.000%47014 Gazelle Union Elementary 5,513 0.000%47015 Grenada Elementary 52,899 0.001%47016 Happy Camp Union Elementary 41,899 0.001%47019 Hornbrook Elementary 17,044 0.000%47020 Junction Elementary 7,376 0.000%47021 Klamath River Union Elementary 6,091 0.000%47022 Little Shasta Elementary 9,979 0.000%47024 Mccloud Union Elementary 23,680 0.001%47025 Montague Elementary 47,184 0.001%47026 Mt. Shasta Union Elementary 158,857 0.004%47029 Seiad Elementary 8,175 0.000%47030 Siskiyou Union High 240,914 0.007%47031 Siskiyou Joint Community College District 382,956 0.010%47033 Golden Eagle Charter 101,124 0.003%47034 Weed Union Elementary 72,510 0.002%47035 Willow Creek Elementary 16,167 0.000%47036 Yreka Union Elementary 269,432 0.007%47037 Yreka Union High 280,153 0.008%47038 Siskiyou County Office of Education 242,507 0.007%47039 Butte Valley Unified School District 107,013 0.003%47040 Scott Valley Unified School District 209,329 0.006%00047 Siskiyou County Office of Education 2,486,617$
48500 Solano County Office of Education 829,966 0.023%48527 Solano County Community College District 1,373,434 0.037%48555 Dixon Montessori Charter 88,713 0.002%48601 Benicia Unified School District 1,582,220 0.043%48602 Dixon Unified School District 1,052,589 0.029%48603 Vallejo City Unified School District 4,214,347 0.115%48606 Travis Unified School District 1,687,297 0.046%
The accompanying notes are an integral part of these schedules.
25

118 CALSTRS COMPREHENSIVE ANNUAL FINANCIAL REPORT 2014
California State Teachers' Retirement SystemSchedule of Proportionate Share of Contributionsfor Employers and Nonemployer Contributing Entityfor the Year Ended June 30, 2014 Schedule IX (Continued)
Employer Reporting Number Employer NameCalSTRS-Calculated
Employer Contribution
EmployerProportionateShare of Total
CalSTRS-CalculatedEmployer
Contribution48608 Vacaville Unified School District 3,677,276$ 0.100%48611 Fairfield-Suisun Unified School District 6,311,386 0.172%48739 Mare Island Technology Academy 226,051 0.006%00048 Solano County Office of Education 21,043,279$
49001 Alexander Valley Union Elementary 51,833 0.001%49002 Sebastopol Independent Charter 26,275 0.001%49004 Santa Rosa Charter 45,627 0.001%49005 Bellevue Union Elementary 628,009 0.017%49006 Bennett Valley Union Elementary 300,201 0.008%49007 Kid Street Learning Center Charter 18,573 0.001%49011 Cinnabar Elementary 78,139 0.002%49012 Live Oak Charter 55,396 0.002%49015 Dunham Elementary 68,282 0.002%49017 Forestville Union Elementary 134,716 0.004%49018 Fort Ross Elementary 7,797 0.000%49020 Gravenstein Union Elementary 223,058 0.006%49021 Sunridge Charter 62,935 0.002%49022 Guerneville Elementary 101,330 0.003%49023 Pathways Charter 148,265 0.004%49024 Harmony Union Elementary 99,697 0.003%49026 Horicon Elementary 35,938 0.001%49029 Kenwood Elementary 80,803 0.002%49031 Liberty Elementary 60,394 0.002%49032 Woodland Star Charter 55,127 0.002%49033 California Virtual Academy at Sonoma 148,622 0.004%49034 Mark West Union Elementary 445,044 0.012%49035 Monte Rio Union Elementary 31,172 0.001%49036 Montgomery Elementary 16,557 0.000%49037 Abraxis Charter 10,897 0.000%49038 Oak Grove Union Elementary 276,462 0.008%49039 Old Adobe Union Elementary 469,274 0.013%49040 River Montessori Charter 35,872 0.001%49041 Pivot Online Charter- North Bay 31,612 0.001%49043 Piner-Olivet Union Elementary 407,839 0.011%49044 Piner-Olivet Charter 56,177 0.002%49046 Kashia Elementary 3,393 0.000%49047 Rincon Valley Union Elementary 1,228,787 0.033%49048 Roseland Elementary 686,260 0.019%49049 The Reach School 22,881 0.001%49051 Sebastopol Union Elementary 200,049 0.005%49052 Credo High 19,517 0.001%49053 Twin Hills Union Elementary 247,684 0.007%49054 Two Rock Union 63,254 0.002%49056 Academy of Arts and Sciences Charter 9,109 0.000%49060 Waugh Elementary 304,003 0.008%49061 West Side Union Elementary 36,389 0.001%49062 Wilmar Union Elementary 66,759 0.002%49063 Windsor Unified School District 1,443,636 0.039%49064 Wright Elementary 439,312 0.012%49065 Village Charter 24,653 0.001%49070 Sonoma Charter 62,086 0.002%49071 West Sonoma County Union High 720,317 0.020%49081 Cloverdale Unified School District 426,681 0.012%49082 Cotati-Rohnert Park Unified School District 1,637,895 0.045%49084 Geyserville Unified School District 97,215 0.003%49085 Petaluma 2,347,926 0.064%49086 Santa Rosa 5,901,022 0.161%49087 Healdsburg Unified School District 607,956 0.017%49088 Sonoma Valley Unified School District 1,436,811 0.039%49091 Santa Rosa Junior College 3,148,076 0.086%49097 Sonoma County Office of Educaton 1,237,210 0.034%49205 Stony Point Academy 12,755 0.000%00049 Sonoma County Office of Education 26,643,559$
50001 Ceres Unified School District 4,266,454 0.116%50002 Chatom Union Elementary 216,175 0.006%
The accompanying notes are an integral part of these schedules.
26
SCHEDULE OF PROPORTIONATE SHARE OF CONTRIBUTIONS FOR EMPLOYERS AND NONEMPLOYER CONTRIBUTING ENTITY

119FINANCIAL
California State Teachers' Retirement SystemSchedule of Proportionate Share of Contributionsfor Employers and Nonemployer Contributing Entityfor the Year Ended June 30, 2014 Schedule IX (Continued)
Employer Reporting Number Employer NameCalSTRS-Calculated
Employer Contribution
EmployerProportionateShare of Total
CalSTRS-CalculatedEmployer
Contribution50003 Denair Unified School District 487,106$ 0.013%50004 Empire Union Elementary 886,146 0.024%50005 Gratton Elementary 52,700 0.001%50006 Hart-Ransom Union Elementary 300,755 0.008%50007 Hickman Elementary 327,623 0.009%50008 Hughson Unified School District 718,025 0.020%50010 Keyes Union 312,482 0.009%50011 Knights Ferry Elementary 34,141 0.001%50015 Newman-Crows Landing Unified School District 851,243 0.023%50016 Oakdale Joint Unified School District 1,716,511 0.047%50017 Oakdale Joint Union High (171) 0.000%50018 Paradise Elementary 57,635 0.002%50019 Patterson Joint Unified School District 1,598,912 0.044%50020 Riverbank Unified School District 847,977 0.023%50021 Roberts Ferry Union Elementary 36,464 0.001%50022 Salida Union Elementary 793,992 0.022%50023 Shiloh Elementary 39,265 0.001%50024 Stanislaus Union Elementary 920,831 0.025%50025 Sylvan Union Elementary 2,567,457 0.070%50026 Turlock Joint Elementary (194) 0.000%50027 Turlock Joint Union High (41) 0.000%50028 Valley Home Joint Elementary 43,350 0.001%50029 Waterford Unified School District 575,438 0.016%50030 Turlock Unified School District 4,933,173 0.134%50031 Stanislaus County Office of Education 1,903,312 0.052%50051 Modesto City Elementary 11,360,236 0.309%50053 Yosemite Community College District 2,766,147 0.075%50210 Aspire Summit Charter 97,351 0.003%50215 Golden Lakes Charter 1,238 0.000%50291 Connecting Waters Charter 519,210 0.014%50310 University Charter 67,920 0.002%50311 Great Valley Academy Charter 158,861 0.004%50510 Aspire Vanguard College Prep 90,129 0.002%00050 Stanislaus County Office of Education 39,547,853$
51005 Sutter County Office of Education 576,985 0.016%51008 Brittan Elementary 132,314 0.004%51009 Browns Elementary 43,265 0.001%51012 Franklin Elementary 126,638 0.003%51016 South Sutter Charter 474,627 0.013%51017 Marcum-Illinois Union Elementary 47,732 0.001%51018 Meridian Elementary 17,093 0.000%51019 California Virtual Academy at Sutter 179,036 0.005%51020 Nuestro Elementary 42,465 0.001%51021 Pleasant Grove Joint Union 49,424 0.001%51024 Winship-Robbins 48,927 0.001%51026 East Nicolaus Joint Union High 114,909 0.003%51028 Sutter Union High 178,970 0.005%51031 Live Oak Unified School District 519,166 0.014%51035 Yuba City Unified School District 4,064,226 0.111%51037 Yuba City Charter 26,194 0.001%51038 Twin Rivers Charter 77,151 0.002%00051 Sutter County Office of Education 6,719,122$
52001 Tehama County Office of Education 354,385 0.010%52002 Antelope Elementary 210,350 0.006%52004 Corning Union Elementary 533,821 0.015%52005 Corning Union High 337,742 0.009%52006 Elkins Elementary 89 0.000%52007 Evergreen Union 325,034 0.009%52008 Flournoy Union Elementary 10,425 0.000%52009 Gerber Union Elementary 113,649 0.003%52010 Kirkwood Elementary 19,660 0.001%52011 Lassen View Union Elementary 90,381 0.002%52012 Los Molinos Unified School District 197,809 0.005%52013 Manton Joint Union Elementary 1,011 0.000%52014 Mineral Elementary 2,358 0.000%52015 Plum Valley Elementary 416 0.000%
The accompanying notes are an integral part of these schedules.
27
SCHEDULE OF PROPORTIONATE SHARE OF CONTRIBUTIONS FOR EMPLOYERS AND NONEMPLOYER CONTRIBUTING ENTITY

120 CALSTRS COMPREHENSIVE ANNUAL FINANCIAL REPORT 2014
SCHEDULE OF PROPORTIONATE SHARE OF CONTRIBUTIONS FOR EMPLOYERS AND NONEMPLOYER CONTRIBUTING ENTITY
California State Teachers' Retirement SystemSchedule of Proportionate Share of Contributionsfor Employers and Nonemployer Contributing Entityfor the Year Ended June 30, 2014 Schedule IX (Continued)
Employer Reporting Number Employer NameCalSTRS-Calculated
Employer Contribution
EmployerProportionateShare of Total
CalSTRS-CalculatedEmployer
Contribution52016 Red Bluff Union Elementary 572,822$ 0.016%52017 Red Bluff Joint Union High 576,629 0.016%52018 Reeds Creek Elementary 28,204 0.001%52019 Richfield Elementary 64,492 0.002%52020 Sacramento River Discovery Charter 14,851 0.000%52022 Escholar Academy 22,532 0.001%00052 Tehama County Office of Education 3,476,660$
53010 Burnt Ranch Elementary 19,298 0.001%53015 Coffee Creek Elementary 3,483 0.000%53020 Cox Bar Elementary (372) 0.000%53025 Douglas City Elementary 30,208 0.001%53040 Junction City Elementary 8,019 0.000%53045 Lewiston Elementary 17,395 0.000%53050 Trinity Center Elementary 4,254 0.000%53100 Trinity Alps Unified School District 213,644 0.006%53670 Trinity County Office of Education 57,624 0.002%53805 Southern Trinity Joint Unified School District 43,343 0.001%53905 Mountain Valley Unified School District 100,691 0.003%00053 Trinity County Office of Education 497,587$
54001 Allensworth Elementary 22,334 0.001%54002 Alpaugh Unified School District 109,950 0.003%54003 Alta Vista Elementary 166,823 0.005%54004 Buena Vista Elementary 53,560 0.001%54005 Burton Elementary 1,161,524 0.032%54006 Citrus South Tule Elementary 15,934 0.000%54007 Columbine Elementary 67,528 0.002%54008 Cutler-Orosi Joint Unified School District 1,337,600 0.036%54010 Ducor Union Elementary 48,967 0.001%54011 Earlimart Elementary 590,842 0.016%54014 Exeter Union Elementary 45,254 0.001%54016 Farmersville Unified School District 882,356 0.024%54018 Hope Elementary 46,220 0.001%54019 Hot Springs Elementary 10,497 0.000%54022 Kings River Union Elementary 126,474 0.003%54023 Liberty Elementary 75,145 0.002%54024 Lindsay Unified School District 1,411,622 0.038%54029 Monson-Sultana Joint Union Elementary 111,005 0.003%54030 Oak Valley Union Elementary 103,929 0.003%54032 Outside Creek Elementary 19,201 0.001%54034 Palo Verde Union Elementary 157,302 0.004%54035 Pixley Union Elementary 351,042 0.010%54036 Pleasant View Elementary 160,168 0.004%54038 Porterville Elementary 10 0.000%54039 Richgrove Elementary 253,678 0.007%54040 Rockford Elementary 98,397 0.003%54041 Saucelito Elementary 23,500 0.001%54042 Sequoia Union Elementary 77,238 0.002%54044 Springville Union Elementary 63,094 0.002%54046 Stone Corral Elementary 29,530 0.001%54047 Strathmore Union Elementary 232,062 0.006%54048 Sundale Union Elementary 219,021 0.006%54049 Sunnyside Union Elementary 94,960 0.003%54051 Terra Bella Union Elementary 252,055 0.007%54052 Three Rivers Union Elementary 29,428 0.001%54053 Tipton Elementary 166,313 0.005%54054 Traver Joint Elementary 64,939 0.002%54055 Tulare City School District 3,047,379 0.083%54057 Visalia Unified School District 8,050,403 0.219%54059 Waukena Joint Union Elementary 54,724 0.001%54060 Tulare County Dept of Ed Child Care Division 306,898 0.008%54064 Woodville Union Elementary 170,261 0.005%54066 Tulare County Office of Education 2,063,441 0.056%54068 Exeter Union High 29,197 0.001%54070 Porterville Union High 5 0.000%54072 Tulare Joint Union High 1,836,554 0.050%54075 College of the Sequoias 1,526,334 0.042%
The accompanying notes are an integral part of these schedules.
28

121FINANCIAL
SCHEDULE OF PROPORTIONATE SHARE OF CONTRIBUTIONS FOR EMPLOYERS AND NONEMPLOYER CONTRIBUTING ENTITY
California State Teachers' Retirement SystemSchedule of Proportionate Share of Contributionsfor Employers and Nonemployer Contributing Entityfor the Year Ended June 30, 2014 Schedule IX (Continued)
Employer Reporting Number Employer NameCalSTRS-Calculated
Employer Contribution
EmployerProportionateShare of Total
CalSTRS-CalculatedEmployer
Contribution54076 Tulare County Organization for Vocational Ed 3,975$ 0.000%54077 Dinuba Unified School District 2,081,688 0.057%54078 Porterville Unified School District 4,260,443 0.116%54079 Woodlake Unified School District 673,324 0.018%54080 Exeter Unified School District 795,633 0.022%54098 Eleanor Roosevelt Community Learning Center 53,519 0.001%54603 Valley Life Charter 134,741 0.004%54604 Sycamore Valley Academy 51,818 0.001%00054 Tulare County Office of Education 33,819,839$
55015 Belleview Elementary 44,906 0.001%55020 Big Oak Flat-Groveland Unified School District 153,444 0.004%55031 Columbia Union 158,345 0.004%55040 Curtis Creek Elementary 136,325 0.004%55060 Jamestown Elementary 126,270 0.003%55095 Sonora Elementary 195,277 0.005%55100 Soulsbyville Elementary 129,812 0.004%55105 Summerville Elementary 115,933 0.003%55116 Twain Harte-Long Barn Union Elementary 98,890 0.003%55670 Tuolumne County Superintendent of School 227,689 0.006%55705 Sonora Union High 339,498 0.009%55710 Summerville Union High 259,212 0.007%55900 Golden Lakes Charter 2,586 0.000%55915 Gold Rush Charter 68,079 0.002%55920 California Virtual Academy at Jamestown 30,568 0.001%00055 Tuolumne County Office of Education 2,086,834$
56601 Briggs Elementary 153,202 0.004%56602 Hueneme Elementary 2,544,408 0.069%56603 Mesa Union Elementary 166,693 0.005%56605 Mupu Elementary 50,449 0.001%56606 Ocean View Elementary 765,543 0.021%56607 Oxnard Elementary 4,665,225 0.127%56608 Pleasant Valley 1,774,440 0.048%56609 Rio Elementary 1,186,760 0.032%56610 Santa Clara Elementary 14,853 0.000%56611 Santa Paula Elementary (7,586) 0.000%56612 Somis Union 79,085 0.002%56616 Oxnard Union High 4,553,780 0.124%56617 Santa Paula Union High 713 0.000%56618 Conejo Valley Unified School District 6,130,288 0.167%56619 Fillmore Unified School District 960,917 0.026%56620 Ojai Unified School District 682,606 0.019%56621 Simi Valley Unified School District 5,103,953 0.139%56622 Ventura Unified School District 4,936,757 0.134%56623 Oak Park Unified School District 1,276,485 0.035%56624 Moorpark Unified School District 1,907,093 0.052%56625 Santa Paula Unified School District 1,485,700 0.040%56626 Ventura Community College District 3,643,294 0.099%56627 University Prep School at CSU Channel Islands 111,241 0.003%56628 University Charter Middle at CSU Channel Islands 52,867 0.001%56635 Golden Valley Charter 156,137 0.004%56636 Valley Oaks Charter 12,020 0.000%56639 Ventura Charter of Arts and Global Education 92,782 0.003%56640 Camarillo Academy of Progressive Education 119,970 0.003%56641 Meadows Arts and Technology Elementary (MATES) 87,637 0.002%56642 Ace Charter High 51,694 0.001%56643 Bridges Charter 89,001 0.002%56644 River Oaks Academy 29,655 0.001%56645 Ivy Tech Charter 36,999 0.001%56646 Acad of Arts & Sciences: Thousand Oaks/Simi Valley 58,459 0.002%56647 Academy of Arts and Sciences: Oxnard and Ventura 56,844 0.002%56648 Albert Einstein Academy Letters, Arts & Sciences 9,775 0.000%56718 Ventura County Office of Education 1,264,079 0.034%00056 Ventura County Office of Education 44,303,818$
57002 Davis Joint Unified School District 2,925,544 0.080%57003 Esparto Unified School District 284,004 0.008%
The accompanying notes are an integral part of these schedules.
29

122 CALSTRS COMPREHENSIVE ANNUAL FINANCIAL REPORT 2014
SCHEDULE OF PROPORTIONATE SHARE OF CONTRIBUTIONS FOR EMPLOYERS AND NONEMPLOYER CONTRIBUTING ENTITY
California State Teachers' Retirement SystemSchedule of Proportionate Share of Contributionsfor Employers and Nonemployer Contributing Entityfor the Year Ended June 30, 2014 Schedule IX (Continued)
Employer Reporting Number Employer NameCalSTRS-Calculated
Employer Contribution
EmployerProportionateShare of Total
CalSTRS-CalculatedEmployer
Contribution57004 Washington Unified School District 2,221,062$ 0.060%57005 Winters Joint Unified School District 500,414 0.014%57006 Woodland Joint Unified School District 3,175,743 0.086%57007 Yolo County Office of Education 429,463 0.012%57041 West Sacramento Early College Prep Charter 39,750 0.001%57061 Woodland Polytechnic Academy 25,255 0.001%00057 Yolo County Office of Education 9,601,235$
58040 Plumas Lake Elementary 319,025 0.009%58041 Wheatland Union High 214,318 0.006%58042 Wheatland Elementary 455,445 0.012%58043 Camptonville Elementary 12,364 0.000%58044 Camptonville Academy Charter 87,859 0.002%58045 Yuba Community College District 1,373,653 0.037%58095 Marysville Joint Unified School District 2,817,259 0.077%58096 Yesca/Yuba Environmental Science Charter 22,895 0.001%58097 Paragon Collegiate Academy 34,991 0.001%58099 Yuba County Office of Education 390,160 0.011%00058 Yuba County Office of Education 5,727,969$
59174 Department of Education 434,652 0.012%59184 School for the Blind 11,101 0.000%59192 Commission On Teacher Credentialing 38,344 0.001%59193 Diagnostic Center Central 94,527 0.003%59199 Diagnostic Center Northern 17,327 0.000%59202 Diagnostic Center Southern 55,915 0.002%59205 California School for the Deaf 11,241 0.000%59364 Board of Governors, California Community 7,790 0.000%59630 Department of Consumer Affairs 7,012 0.000%00059 State Agencies 677,909$
00061 Los Angeles Unified School District 210,854,048 5.738%00061 Los Angeles Unified School District 210,854,048$
62555 Los Angeles Community College District 14,659,585 0.399%00062 Los Angeles Community College District 14,659,585$
63098 City College of San Francisco 6,372,065 0.173%00063 City College of San Francisco 6,372,065$
01014 Berkeley Unified School District 64,193 0.002%01014 Berkeley Unified School District 64,193$
01020 Fremont Unified School District 51,287 0.001%01020 Fremont Unified School District 51,287$
01061 Ohlone Community College District 154,379 0.004%01061 Ohlone Community College District 154,379$
01063 Peralta Community College District 368,482 0.010%01063 Peralta Community College District 368,482$
01065 Chabot-Las Positas Community College District 259,454 0.007%01065 Chabot-Las Positas Community College District 259,454$
04030 Butte Community College District 110,992 0.003%04030 Butte Community College District 110,992$
07077 West Contra Costa Unified School District 47,493 0.001%07077 West Contra Costa Unified School District 47,493$
07079 Contra Costa Community College District 417,732 0.011%07079 Contra Costa Community College District 417,732$
19015 Antelope Valley Community College District 128,471 0.003%19015 Antelope Valley Community College District 128,471$
The accompanying notes are an integral part of these schedules.
30

123FINANCIAL
SCHEDULE OF PROPORTIONATE SHARE OF CONTRIBUTIONS FOR EMPLOYERS AND NONEMPLOYER CONTRIBUTING ENTITY
California State Teachers' Retirement SystemSchedule of Proportionate Share of Contributionsfor Employers and Nonemployer Contributing Entityfor the Year Ended June 30, 2014 Schedule IX (Continued)
Employer Reporting Number Employer NameCalSTRS-Calculated
Employer Contribution
EmployerProportionateShare of Total
CalSTRS-CalculatedEmployer
Contribution
19290 El Camino Community College District 287,974$ 0.008%19290 El Camino Community College District 287,974$
19381 Glendale Community College District 306,837 0.008%19381 Glendale Community College District 306,837$
19550 Long Beach Unified School District 27,860,878 0.758%19550 Long Beach Unified School District 27,860,878$
19795 Santa Clarita Community College District 182,522 0.005%19795 Santa Clarita Community College District 182,522$
19801 Santa Monica Community College District 303,926 0.008%19801 Santa Monica Community College District 303,926$
31042 Sierra Joint Community College District 2,404,380 0.065%31042 Sierra Joint Community College District 2,404,380$
33024 Corona-Norco Unified School District 17,134,864 0.466%33024 Corona-Norco Unified School District 17,134,864$
37044 Helix High Charter 1,475 0.000%37044 Helix High Charter 1,475$
41050 San Mateo County Community College District 3,787,893 0.103%41050 San Mateo County Community College District 3,787,893$
43110 Cupertino Union 5,664,202 0.154%43110 Cupertino Union 5,664,202$
43171 Foothill De Anza Community College District 449,671 0.012%43171 Foothill De Anza Community College District 449,671$
43176 San Jose/Evergreen Community College District 248,325 0.007%43176 San Jose/Evergreen Community College District 248,325$
48527 Solano County Community College District 113,698 0.003%48527 Solano County Community College District 113,698$
56626 Ventura Community College District 211,613 0.006%56626 Ventura Community College District 211,613$
58045 Yuba Community College District 74,496 0.002%58045 Yuba Community College District 74,496$
62555 Los Angeles Community College District 1,462,452 0.040%62555 Los Angeles Community College District 1,462,452$
63098 City College of San Francisco 492,192 0.013%63098 City College of San Francisco 492,192$
Total CalSTRS-calculated employer contributions 2,291,104,886$ 62.350%State contributions (nonemployer contributing entity) 1 1,383,468,047 37.650%Total employer and state contributions 3,674,572,933$ 100.000%
Plus: Contributions for separately financed liabilities of individual employers 2 14,456,510Less: Employer contributions redirected to fund MPPP (33,394,757)Total employer and state contributions 3,655,634,686$
1 CalSTRS recognizes state contributions for the entire fiscal year at the beginning of each fiscal year per CalSTRS revenue recognition policy.2 Contributions excluded from proportionate share calculation per CalSTRS policy. These include employer contributions for retirement incentives, additional service credit, and unused sick leave.
The accompanying notes are an integral part of these schedules.
31

124 CALSTRS COMPREHENSIVE ANNUAL FINANCIAL REPORT 2014
California State Teachers' Retirement SystemState Teachers' Retirement PlanSchedule of Aggregate Pension Amounts forEmployers and Nonemployer Contributing Entity as of June 30, 2014 (as restated)(Dollars in Millions)
Total Net Pension Liability, as of June 30, 2013 $ 71,438
Total Net Pension Liability, as of June 30, 2014 58,437
Increase (decrease) in Net Pension Liability $ (13,001)
Less: Items subject to amortization 1Differences between expected and actual experience - Changes of assumptions - Differences between projected and actual earnings on plan investments (17,987) Change in NPL recognized immediately in pension expense $ 4,986
Plus: Current year amortization of deferred outflows of resources 1
Differences between expected and actual experience 2 - Changes of assumptions 2 - Differences between projected and actual earnings on plan investments 3 -
$ - Less: Current year amortization of deferred inflows of resources 1
Differences between expected and actual experience 2 - Changes of assumptions 2 - Differences between projected and actual earnings on plan investments 3 3,597
$ 3,597
Deferred outflows of resources:Differences between expected and actual experience - Changes of assumptions - Differences between projected and actual earnings on plan investments 3 - Total deferred outflows of resources $ -
Deferred inflows of resources:Differences between expected and actual experience - Changes of assumptions - Differences between projected and actual earnings on plan investments 3 14,390 Total deferred inflows of resources $ 14,390
Schedule X
1) This schedule does not include deferred outflows/inflows of resources for changes in the employer's proportionate share of contributions or employer contributions made subsequent to the measurement date.
2) These items are amortized over a closed period equal to the average remaining service life of plan members, which is 7 years as of June 30, 2014
3) Deferred outflows and inflows related to differences between projected and actual earnings on plan investments are netted and amortized over a closed 5-year period.
The accompanying notes are an integral part of these schedules.
32
SCHEDULE OF AGGREGATE PENSION AMOUNTS FOR EMPLOYERS AND NONEMPLOYER CONTRIBUTING ENTITY (AS RESTATED)

125FINANCIAL
California State Teachers’ Retirement System Notes to Other Pension Information-State Teachers’ Retirement Plan (as restated)
33
1. Notes to Schedule of Proportionate Share of Contributions for Employers and Nonemployer Contributing Entity (Schedule IX)
Employer contributions to the State Teachers’ Retirement Plan (STRP), a plan administered by the California State Teachers’ Retirement System (CalSTRS), are presented on Schedule IX in order by CalSTRS assigned employer reporting number within a grouping for each CalSTRS reporting source (typically a county office of education). Individual employers which report their Cash Balance Benefit contributions separately may appear twice on the schedule— once within the grouping by CalSTRS reporting source for their STRP Defined Benefit Program contributions, and once as a separate reporting source for their STRP Cash Balance Benefit Program contributions (near the end of Schedule IX).
Summary of Significant Accounting Policies Employer contributions to the State Teachers’ Retirement Plan are calculated by CalSTRS based on creditable compensation for active members reported by employers. Employer and state contributions are accrued when earned and the employer or state has made a formal commitment to provide the contributions. Cash remittances of contributions due are received from employers prior to their reports of creditable earnings by member. As a result, CalSTRS accrues employer contributions due monthly based on estimates. CalSTRS accrues contributions due from the State of California, a nonemployer contributing entity, at the beginning of each fiscal year based on the creditable earnings reported by employers for the fiscal year ending in the immediately preceding calendar year.
The Schedule of Proportionate Share of Contributions for Employers and Nonemployer Contributing Entity reflects current year employer contributions calculated by CalSTRS with consideration given to separately financed and irregular employer contributions. Contributions and adjustments to contributions reported in the current year for service performed in a prior year are recognized as contributions in the current year and included in the schedule of proportionate share. The schedule includes the following for each individual employer and the state:
Employer or nonemployer contributing entity
The amount of the employer or nonemployer contributing entity’s contributions as defined by this policy for the fiscal year, offset by the prior year accrual for the same employer or nonemployer contributing entity
The employer or nonemployer contributing entity’s contributions as a percentage of total employer and state contributions as defined by this policy.
The Employer Proportionate Share of Total CalSTRS-Calculated Employer Contribution has been rounded to the nearest thousandth of a percentage point (five decimal places).
Basis of Accounting Contributions for employers and nonemployer contributing entities are recognized on an accrual basis of accounting.
Use of Estimates in the Preparation of the Schedule The preparation of this schedule in conformity with accounting principles generally accepted in the U.S. requires management to make estimates and assumptions that affect certain amounts and disclosures. CalSTRS accrues contributions from employers monthly using estimates based on historical data. Actual results could differ from those estimates.
Relationship to the Basic Financial Statements The schedule also includes reconciliation from total employer and state contributions included in the proportionate share calculation to employer and state contributions shown in CalSTRS Statement of Changes in Fiduciary Net Position.
NOTES TO OTHER PENSION INFORMATION (AS RESTATED)

126 CALSTRS COMPREHENSIVE ANNUAL FINANCIAL REPORT 2014
NOTES TO OTHER PENSION INFORMATION (AS RESTATED)
California State Teachers’ Retirement System Notes to Other Pension Information- State Teachers’ Retirement Plan (as restated) (continued)
34
2. Notes to Schedule of Aggregate Pension Amounts for Employers and Nonemployer Contributing Entity (Schedule X)
Summary of Significant Policies The components of the net pension liability of the State Teachers’ Retirement Plan (STRP), a plan administered by the California State Teachers’ Retirement System (CalSTRS), for participating employers and the State of California (nonemployer contributing entity) as of June 30, 2014 and 2013, are as follows (dollars in millions):
2014 2013 Total pension liability $ 248,911 $ 237,786Less: STRP fiduciary net position 190,474 166,348
Net pension liability of employers and the state $ 58,437 $ 71,438
Actuarial methods and assumptions The total pension liability for the STRP was determined by applying update procedures to a financial reporting actuarial valuation as of June 30, 2013, and rolling forward the total pension liability to June 30, 2014. The financial reporting actuarial valuation as of June 30, 2013, used the following actuarial methods and assumptions, applied to all prior periods included in the measurement:
Valuation Date June 30, 2013 Experience Study July 1, 2006, through June 30, 2010 Actuarial Cost Method Entry age normal Investment Rate of Return1 7.60% Consumer Price Inflation 3.00% Wage Growth 3.75% Post-retirement Benefit Increases 2.00% simple for DB
Not applicable for DBS/CBB
CalSTRS uses custom mortality tables to best fit the patterns of mortality among its members. These custom tables are based on RP2000 series tables adjusted to fit CalSTRS experience. RP2000 series tables are an industry standard set of mortality rates published by the Society of Actuaries. See CalSTRS July 1, 2006 – June 30, 2010 Experience Analysis for more information.
The long-term expected rate of return on pension plan investments was determined using a building-block method in which best-estimate ranges of expected future real rates of return (expected returns, net of pension plan investment expense and inflation) are developed for each major asset class. The best-estimate ranges were developed using capital market assumptions from CalSTRS general investment consultant (Pension Consulting Alliance - PCA) as an input to the process. Based on the model from CalSTRS consulting actuary’s (Milliman) investment practice, a best estimate range was determined by assuming the portfolio is re-balanced annually and that annual returns are lognormally distributed and independent from year to year to develop expected percentiles for the long-term distribution of annualized returns. The assumed asset allocation by PCA is based on board policy for target asset allocation in effect on February 2, 2012, the date the current experience study was approved by the board.
Discount rate The discount rate used to measure the total pension liability was 7.60 percent. The projection of cash flows used to determine the discount rate assumed that contributions from plan members and employers will be made at statutory contribution rates in accordance with the rate increase per Assembly Bill 1469. Projected inflows from investment earnings were calculated using the long-term assumed investment rate of return (7.60 percent) and assuming that contributions, benefit payments,
1 Net of investment expenses, but gross of administrative expenses. CalSTRS uses a 7.5 percent assumed investment rate of returnfor funding purposes, which is net of administrative expenses.

127FINANCIAL
NOTES TO OTHER PENSION INFORMATION (AS RESTATED)
California State Teachers’ Retirement System Notes to Other Pension Information- State Teachers’ Retirement Plan (as restated) (continued)
35
and administrative expense occur midyear. Based on those assumptions, the STRP’s fiduciary net position was projected to be available to make all projected future benefit payments to current plan members. Therefore, the long-term assumed investment rate of return was applied to all periods of projected benefit payments to determine the total pension liability.
The schedule includes only certain categories of deferred outflows of resources and deferred inflows of resources. These include differences between expected and actual experience, changes of assumptions and differences between projected and actual earnings on plan investments. The schedule does not include deferred outflows/inflows of resources for changes in the employer’s proportionate share of contributions or employer contributions made subsequent to the measurement date. Differences between expected and actual experience and changes in assumptions are amortized over a closed period equal to the average remaining service life of plan members, which is 7 years as of June 30, 2014. The STRP net pension liability as of June 30, 2013 and the STRP net pension liability as of June 30, 2014 are based on the June 30, 2013 actuarial valuation for the first year of implementation. As a result there are no differences between expected and actual experience or changes in assumptions subject to amortization. Deferred outflows and inflows related to differences between projected and actual earrings on plan investments are netted and amortized over a closed 5-year period. Deferred inflows of $14,390 million are the unamortized portion of the actual net increase in STRP net position that exceeded the increase projected based on the 7.60% assumed investment rate of return.
Basis of Accounting The net pension liability, deferred outflows of resources, and deferred inflows of resources are recognized on an accrual basis of accounting.
Use of Estimates in the Preparation of the Schedule The preparation of this schedule in conformity with accounting principles generally accepted in the U.S. requires management to make estimates and assumptions that affect certain amounts and disclosures. CalSTRS presents the net appreciation (depreciation) in the fair value of its investments, which consists of the realized gains and losses on securities sold and the unrealized appreciation (depreciation) on those investments still held in the portfolio. The value and performance of CalSTRS investments are subject to various risks. Actual results could differ from those estimates.
Relationship to the Basic Financial Statements The components of the schedule associated with deferred outflows and inflows of resources have been determined based on the net increase in fiduciary net position for the STRP shown in the CalSTRS Statement of Changes in Fiduciary Net Position and in accordance with requirements promulgated by the Government Accounting Standards Board statements 67 and 68. The net pension liability at June 30, 2014 is reported in the Notes to CalSTRS Basic Financial Statements and Required Supplementary Information Schedule I. The net pension liability at June 30, 2013 is supported by CalSTRS Basic Financial Statements for the net position restricted for pension/other postemployment benefits as of the beginning of the year for the STRP per the Statement of Changes in Fiduciary Net Position and Required Supplementary Information Schedule I.
3. Schedule X Restatement
Total pension expense previously reported in Schedule X of $1.389 billion has been removed from the schedule and should no longer be relied upon. In addition, total net pension liability as of June 30, 2013 has been added to the schedule. This information was not previously presented but it is included for further information, though not a required disclosure.

128 CALSTRS COMPREHENSIVE ANNUAL FINANCIAL REPORT 2014
THIS PAGE INTENTIONALLY LEFT BLANK

129FINANCIAL
THIS PAGE INTENTIONALLY LEFT BLANK

130 CALSTRS COMPREHENSIVE ANNUAL FINANCIAL REPORT 2014
THIS PAGE INTENTIONALLY LEFT BLANK

133 Investment Consultant’s Report
134 Investments
Tables 134 Asset Allocation
134 Market Value of Investments
135 Annual Performance Returns
135 Time-Weighted Performance Returns for Major Asset Categories
137 Largest Fixed Income Holdings
139 Largest Equity Holdings
141 Investment Summary
142 Schedule of Investment Expenses
142 Global Equity Broker Commissions
The CalSTRS Investment Portfolio increased by $23.3 billion over the past 12 months, ending with a value of $189.1 billion on June 30, 2014.
INVESTMENTS

132 CALSTRS COMPREHENSIVE ANNUAL FINANCIAL REPORT 2014

133INVESTMENTS
P e n s i o n C o n s u l t i n g A l l i a n c e , I n c . Los Angeles • Portland • New York
he CalSTRS investment portfolio decreased by ($4.9) billion over the past twelve months, ending with a value of $150.6 billion on June 30, 2012. As highlighted below, the CalSTRS portfolio is broadly diversified, holding investments ranging from publicly traded short-term bonds to privately held partnerships. Clearly,
the scale and breadth of investments make the management and oversight of these assets highly complex. In light of these factors, CalSTRS has been effective in utilizing its resources in a cost-efficient manner to ensure that benefits continue to flow to CalSTRS participants.
Investment Allocation The Board adopts long-term asset allocation targets to be implemented over several years. The fiscal year-end report reflects strategic allocation guidelines for the 2011-2012 fiscal year as adopted by the Board effective July 2011 (see left pie chart). The portfolio’s actual allocation is slightly different from policy. As of 6/30/2012, the Private Equity, Real Estate, Cash, and Overlay asset classes were modestly overweighted, while the Global Equity, Fixed Income, and Inflation Sensitive asset classes were slightly underweighted (see right pie chart). Investment Results Over the last year, the CalSTRS investment portfolio produced an absolute return of 1.8%, ranking in the second quartile among its large public pension fund peers1 (top bar chart). During this period, portfolio results underperformed the policy benchmark return by (1.5%).2 Relative underperformance by the Private Equity and Real Estate asset classes contributed to this result.
During the last three years, CalSTRS’ portfolio generated a 12.0% average annual return, underperforming the policy benchmark by (1.1%) per year and ranking in the second quartile among peer funds. Underperformance over this time period was largely attributable to the Private Equity and Real Estate asset classes. Over the last five years, the CalSTRS investment portfolio produced an average annual return of 0.3%, trailing its policy benchmark by (1.4%) per year (bottom bar chart). These results are primarily below CalSTRS’ actuarial rate of return. Successive one-year periods are presented here as well. CalSTRS’ portfolio has outperformed its policy benchmark in two of the last five fiscal year periods, ending June 30.3
1 Per TUCS Universe of Master Trust Public Funds with assets in excess of $10 billion. 2 The policy benchmark consists of passively managed asset class portfolios weighted by CalSTRS’ policy allocations. The difference between actual results and the
benchmark are due to two factors: i) deviations from policy and ii) active decisions on the part of CalSTRS and its investment managers. 3 CalSTRS’ investment performance is calculated using a daily time-weighted return geometrically linked to calculate a monthly return. Periods longer than one month
are geometrically linked to calculate annualized “time-weighted” rates of return.
T
The CalSTRS Investment Portfolio increased by $23.3 billion over the past twelve months, ending with a value of $189.1 billion on June 30, 2014. As highlighted below, the CalSTRS portfolio is broadly diversified, holding investments ranging from publicly traded short-term bonds to privately held partnerships. Clearly, the scale and breadth of investments make the management and oversight of these assets highly complex. In light of these factors, CalSTRS has been effective in utilizing its resources in a cost-efficient manner to ensure that benefits continue to flow to CalSTRS participants.
Investment AllocationThe Teachers' Retirement Board adopts long-term strategic allocation targets to be implemented over several years. The fiscal year-end report reflects strategic allocation guidelines for the 2013–2014 fiscal year as adopted by the board, September 2013 (see left pie chart). The portfolio’s actual allocation is slightly different from policy. As of June 30, 2014, the Global Equity, Absolute Return, and Cash classes were modestly overweighted, while the Fixed Income, Real Estate, and Private Equity classes were slightly underweighted. The Inflation Sensitive class was in-line with policy (see right pie chart).
Investment ResultsOver the last year, the CalSTRS Investment Portfolio produced an absolute return of 18.7%, ranking in the first quartile among its large public pension fund peers1 (top bar chart). During this period, portfolio results underperformed the policy benchmark return by 50 basis points2. Benchmark misspecification within the Private Equity strategic class contributed to this result. The benchmark has since been adjusted for fiscal year 2014–2015 and forward.
During the last three years, the CalSTRS portfolio generated an 11.2% average annual return, ranking in the first quartile among peer funds. Over the last five years, the CalSTRS/investment Portfolio produced an average annual return of 13.7%, trailing its policy benchmark by 70 basis points per year (bottom bar chart). Due in large part to benchmark
misspecification, the Private Equity strategic class was the primary contributor to the relative underperformance over this period. Overall, these total portfolio results are well-above CalSTRS’ actuarial rate of return. Successive one-year periods are presented here as well. CalSTRS’ portfolio has outperformed its policy benchmark in two of the last five fiscal year periods, ending June 303.
¹ Per TUCS Universe of Master Trust Public Funds with assets in excess of $10 billion.
²The policy benchmark consists of passively managed strategic class portfolios weighted by CalSTRS’s policy allocations. The difference between actual results and the benchmark are due to two factors: i) deviations from policy and ii) active decisions on the part of CalSTRS and its investment managers.
³ CalSTRS’s investment performance is calculated using a daily time-weighted return geometrically linked to calculate a monthly return. Periods longer than one month are geometrically linked to calculate annualized “time-weighted” rates of return.
CalSTRS Policy
Global Equity 55%
Absolute Return 0%
Inflation Sensitive 1%
Fixed Income 17%
Private Equity 13%
Real Estate 13%
Cash 1%
CalSTRS Actual
Policy Bench
INVESTMENTS
he CalSTRS investment portfolio increased by $23.3 billion over the past twelve months, ending with a value of $189.1 billion on June 30, 2014. As highlighted below, the CalSTRS portfolio is broadly diversified, holding investments ranging from publicly traded short-term bonds to privately held partnerships. Clearly, the scale and
breadth of investments make the management and oversight of these assets highly complex. In light of these factors, CalSTRS has been effective in utilizing its resources in a cost-efficient manner to ensure that benefits continue to flow to CalSTRS participants. Investment Allocation The Board adopts long-term strategic allocation targets to be implemented over several years. The fiscal year-end report reflects strategic allocation guidelines for the 2013-2014 fiscal year as adopted by the Board, September 2013 (see left pie chart). The portfolio’s actual allocation is slightly different from policy. As of 6/30/2014, the Global Equity, Absolute Return, and Cash classes were modestly overweighted, while the Fixed Income, Real Estate, and Private Equity classes were slightly underweighted. The Inflation Sensitive class was in-line with policy (see right pie chart). Investment Results Over the last year, the CalSTRS investment portfolio produced an absolute return of 18.7%, ranking in the first quartile among its large public pension fund peers1 (top bar chart). During this period, portfolio results underperformed the policy benchmark return by 50 basis points.2 Benchmark misspecification within the Private Equity strategic class contributed to this result. The benchmark has since been adjusted for fiscal year 2014-2015 and forward. During the last three years, CalSTRS’s portfolio generated an 11.2% average annual return, ranking in the first quartile among peer funds. Over the last five years, the CalSTRS investment portfolio produced an average annual return of 13.7%, trailing its policy benchmark by 70 basis points per year (bottom bar chart). Due in large part to benchmark misspecification, the Private Equity strategic class was the primary contributor to the relative underperformance over this period. Overall, these total portfolio results are well-above CalSTRS’s actuarial rate of return. Successive one-year periods are presented here as well. CalSTRS’s portfolio has outperformed its policy benchmark in two of the last five fiscal year periods, ending June 30.3
1 Per TUCS Universe of Master Trust Public Funds with assets in excess of $10 billion. 2 The policy benchmark consists of passively managed strategic class portfolios weighted by CalSTRS’s policy allocations. The difference between actual
results and the benchmark are due to two factors: i) deviations from policy and ii) active decisions on the part of CalSTRS and its investment managers. 3 CalSTRS’s investment performance is calculated using a daily time-weighted return geometrically linked to calculate a monthly return. Periods longer
than one month are geometrically linked to calculate annualized “time-weighted” rates of return.
T
Global Eq 55%
Cash 1%
Real Estate 13% Private
Equity 13%
Fixed Income
17%
Inflation Sensitive
1% Absolute Return
0%
CalSTRS Policy
Global Eq 57%
Cash 2%
Real Estate 12%
Private Equity 11%
Fixed Income
16%
Inflation Sensitive
1% Absolute
Return 1%
CalSTRS Actual
18.7
24.7
5.8
19.2
24.2
4.7
0.0
5.0
10.0
15.0
20.0
25.0
Total Equities Fixed Income
% R
etu
rn
Last 12 Months
13.7
18.7
13.8
1.8
23.1
12.2 14.4
19.2
13.4
3.3
22.2
14.7
0.0
5.0
10.0
15.0
20.0
25.0
30.0
5 Years 2014 2013 2012 2011 2010
% R
etu
rn
Periods Ending June 30
CalSTRS Actual Policy Bench
Last 12 Months
% R
etur
n
Total
18.7 19.2
24.7 24.2
5.8 4.7
Equities Fixed Income0
5
10
15
20
25
Periods Ending June 30
% R
etur
n 13.7
18.7
23.1
1.8
12.213.814.4
19.2
22.2
3.3
14.713.4
5 Years 20132014 2012 2011 20100
5
10
15
20
25
CalSTRS Actual
Global Equity 57%
Absolute Return 1%
Inflation Sensitive 1%
Fixed Income 16%
Private Equity 11%
Real Estate 12%
Cash 2%

134 CALSTRS COMPREHENSIVE ANNUAL FINANCIAL REPORT 2014
Investments and the related returns for the CalSTRS Investment Portfolio are presented differently within the Investments and Financial sections of the CAFR. In the preceding pages, press releases and on the Internet, the investment and related returns are presented using common industry practices that reflect the way in which CalSTRS manages the investment portfolio. The presentation based on industry practices provides timely information that is easily compared to benchmarks and peer results. Within the Financial section, the same information is reported in accordance with Generally Accepted Accounting Principles. The primary difference between the presentations is in the way investments are categorized. Additional differences result from the timing of recognition of performance for long-term investments in the portfolio. In accordance with industry practices, private asset performance is reported with a quarter lag, while for financial reporting purposes, adjustments may be made to bring results current through fiscal year end.
As shown on Table 3, performance information in the CAFR is reported as gross returns and is calculated using a time-weighted return methodology. For the most current investment portfolio information, we encourage the public and the CAFR reader to refer to the CalSTRS web site. The investment information on the CalSTRS web site is reported consistent with investment industry standards and is comparable to the global financial markets and other pension plans and institutional investors.
Continued growth in the equity market, coupled with a bias to U.S. companies, fed a second year of healthy investment returns for the investment portfolio, which closed the 2013–14 fiscal year with an 18.7 percent return on its investments. On a long-term, portfolio-wide basis, CalSTRS returns reflect the following performance levels; 11.2 percent over three years, 13.7 percent over five years, and 8.4 percent over 20 years. CalSTRS returns ranked in the top quartile for the year and top docile over three years of the U.S. public pension plans and ranked even higher among large multi-billion portfolios.
Table 1 Market Value of Investments (dollars in millions)
INVESTMENTS
Asset Allocation as of June 30, 2014
Total Investment Portfolio of $189.1 billion
Inflation Sensitive 0.7%
Global Equity 57.3%
Fixed Income 15.5%
Private Equity 11.5%
Real Estate 11.7%
Absolute Return 0.8%
Cash 2.5%
Portfolio values and performance results may vary from information presented in the Basic Financial Statements due to rounding, portfolio management requirements and Generally Accepted Accounting Principles.
2000 2001 2002 2003 2004 2005 2006 2007 2008 2009 2010 2011 2012 2013 2014
$112,640$102,808
$96,696$100,525
$116,178
$129,592
$143,848
$171,899$161,459
$118,875$129,961
$155,513 $150,611
$165,820
$189,080
$ m
illio
ns

135INVESTMENTS
Portfolio Type/Associated Indicies 1 Yr 3 Yr 5 Yr 10 YrTotal Fund 18.66% 11.21% 13.69% 7.65%
Total Fund Custom (1) 19.17 11.76 14.37 7.72
Global Equity 24.73 12.96 16.83 8.28
Global Equity Custom (2) 24.22 12.80 16.53 8.06
U.S. Equity 25.97 16.42 19.40 8.19
Russell 3000 25.38 16.44 19.27 8.09
Non-U.S. Equity 22.27 6.21 11.73 8.24
MSCI All Country World Index ex-U.S. 21.80 5.63 10.99 7.77
MSCI Europe, Australia, Far East & Canada 23.89 7.47 11.54 6.96
MSCI Emerging Market 14.36 (0.45) 9.17 11.98
Fixed Income 5.79 4.64 6.29 5.53
U.S. Debt Custom (3) 4.72 3.95 5.29 5.12
Barclays Capital U.S. Aggregate 4.37 3.66 4.85 4.93
Barclays Capital High Yield Cash Pay 11.72 9.50 13.92 9.10
Real Estate 14.52 12.58 7.98 7.40
Real Estate Custom (lagged 1 quarter) (4) 12.75 12.22 8.19 8.83
Private Equity 19.61 13.02 16.56 13.84
Private Equity Custom (lagged 1 quarter) (5) 26.43 17.96 25.42 10.00
Inflation Sensitive 10.54 5.82 - -
Inflation Sensitive Custom (6) 8.38 5.69 - -
Barclays Global Inflation Linked 10.42 4.60 6.13 5.85
Infrastructure Custom Index (7)ustom Index (7) 7.17 6.91 7.11 7.36
Absolute Return (8) 0.13 0.25 0.02 -
Absolute Return Custom (9) 1.07 - - -
Cash/Liquidity (10) 0.57 2.40 5.55 2.04 Barclays Capital 3-Month Treasury Bill (11) 0.07 0.09 0.13 1.65
CalSTRS' investment performance is calculated using a daily time-weighted return geometrically linked to calculate a monthly return. Periods longer than one month are geometrically linked to calculate annualized 'time-weighted' rates of return. Per board approved benchmark changes in April 2014, firearm free excludes securities of companies that manufacture firearms which are illegal in California. (1) Policy weighted blend of asset class
benchmarks. (2) Weighted blend of Russell 3000 tobacco
and firearm free combined with the MSCI All Country World Index (ex-U.S.) tobacco and firearm free.
(3) 95% Barclays Capital U.S. Aggregate tobacco and firearm free + 5% U.S. High Yield Cash Pay 2% Issuer Constrained Index tobacco and firearm free. Previously LB U.S. Aggregate tobacco free through 03/31/2007.
(4) NCREIF ODCE Value Net of Fees Index. Previously NCREIF through 06/30/2013.
(5) Blend of the Russell 3000 + 3% tobacco and firearm free. Previously Russell 3000 + 5% + Barclays Capital 3-Month Treasury Bill from 04/01/1999 through 09/30/2008.
(6) Weighted blend of Barclay's Global Inflation Linked and Infrastructure Index effective 07/01/2012.
(7) Consumer Price Index (CPI) + 5%.(8) Absolute Return name change approved
by the TRB September 2013; Asset class formally adopted by TRB April 2012 with a portion of assets in this program held by CalSTRS for more than five years.
(9) Barclays Capital 3-Month Treasury Bill plus 1%. Benchmark returns not applicable for 3,5 and 10 year periods.
(10) Includes the Securities Lending Program loss incurred in FY 2008-2009 and subsequent income earned through December 2013.
(11) Barclays Capital 3-Month Treasury Bill. Previously Citigroup 3-Month Treasury Bill prior to 07/01/2006.
Investment returns have begun to show a positive trend following years of market volatility as economic recovery slowly took root. The fund’s second consecutive double-digit performance follows a 13.8 percent portfolio return in fiscal year 2012–13. That was preceded in fiscal year 2011–12 by a flat 1.8 percent return. And in fiscal year 2010–11, CalSTRS posted an impressive 23.1 percent return.
While this annual report provides a significant amount of information regarding the CalSTRS Investment Portfolio; it only represents one point in time, June 30, 2014. It is difficult to compare this time measurement to the movement and complexity of the investment portfolio in this highly dynamic global financial market. As previously mentioned, the reader is strongly encouraged to visit the CalSTRS.com website and other publications for more current investment information.
CalSTRS Returns
Assumed Actuarial Rate
* In February 2012 the board adopted the actuarial rate of 7.5 percent as of June 30, 2011
** The Investment section of the CAFR presents gross returns unless otherwise stated
Table 2 Annual Performance Returns (percent)**
Table 3 Time-Weighted Performance Returns for Major Asset Categories
INVESTMENTS
7.7512.69
-9.12 -5.953.41
17.38
11.09 13.21
21.03
-3.69 -25.03
12.2
23.10
1.84
13.8018.66
8 8
7.75 *7.5 7.57.75
25
20
15
10
5
0
–5
–10
–15
–20
–25
–30 99/00 00/01 01/02 02/03 03/04 04/05 05/06 06/07 07/08 08/09 09/10 10/11 11/12 12/13 13/14

136 CALSTRS COMPREHENSIVE ANNUAL FINANCIAL REPORT 2014
Absolute ReturnThe Absolute Return asset class consists of three separate areas: Innovation, Overlay and Stable Return.
Innovation and Risk (Innovation)The Innovation portfolio, managed by the Innovation and Risk unit, is a subset of the Absolute Return asset class with a long-term allocation goal not to exceed 2.5 percent of the total plan assets. The Innovation Portfolio Policy was approved in March 2009 with the primary goal to research, incubate and recommend new investment opportunities to the board. Each new strategy is expected to improve the risk/return efficiency of the total plan or an asset class by increasing its return, decreasing its risk or achieving both. The unit is also building a fund-wide risk management process, which will help CalSTRS monitor risk factors driving performance of the investment portfolio. The framework will help improve CalSTRS' investment process and provide tools to lessen the impact of a severe macroeconomic or market event.
As of June 30, 2014, the Innovation portfolio had total assets of approximately $1.2 billion. The Innovation portfolio returned 6.05 percent, outperforming its policy benchmark by 193 basis points for the fiscal year ending June 30, 2014. For more detailed information on the type and commitment size of strategies being incubated, refer to the Innovation and Risk Quarterly Activity Reports in the Investments section of CalSTRS.com.
Currency Management Program (Overlay)The Currency Management Program, managed by the Fixed Income unit, is designed to address the global nature of all the fund’s assets and attempts to add value on a fund-wide basis. The currency markets are some of the most liquid and volatile markets within which CalSTRS operates. The internally managed Core strategy performance was negative 11 basis points for the year ending June 30, 2014, while the Opportunistic external strategy was negative 38 basis points for same period. Some of the underperformance can be attributed to lower volatility and geopolitical concerns of the global economy as well as narrow alpha opportunities available. Since inception, the Currency Management Program has added 55 basis points to the value of the fund.
INVESTMENTS
Home Loan Program (Stable Return)The CalSTRS Home Loan Program was established by legislation in 1984 and provided home ownership to qualified participants, which attributed to CalSTRS' investment mortgage asset objectives. New home loan origination activity was suspended by the board on October 1, 2011; however, staff continues to manage the existing assets of $249.7 million, as of June 30, 2014.
Credit Enhancement (Stable Return)CalSTRS enters into agreements with a number of domestic issuers of debt to provide credit support and/or liquidity support on specific debt obligations. In return, CalSTRS earns fee income for these commitments. As of June 30, 2014, the Credit Enhancement Program had commitments of approximately $999.7 million and fee income earned during the fiscal year was approximately $8.5 million.
Inflation SensitiveFor the fiscal year ending June 30, 2014, the $1.3 billion Inflation Sensitive portfolio represented 0.7 percent of the total fund with a current allocation goal of one percent. Global Inflation Securities (Linkers) represent 43 percent of this asset class with the balance consisting of Infrastructure investments. The long-term allocation target, as set by the board in September 2013, for the Inflation Sensitive portfolio is six percent allocated between Linkers and Infrastructure.
The Inflation Sensitive portfolio returned 10.5 percent for the fiscal year ending June 30, 2014, versus the benchmark return of 8.4 percent. Over the previous three years, the Inflation Sensitive portfolio outperformed its benchmark by 13 basis points. The Linkers portfolio had a positive return of 10.4 percent. The Infrastructure portfolio, which holds its assets in limited partnership structures, returned a positive 10.6 percent.
Short-term results for the Infrastructure portion of this portfolio are not particularly significant, as performance expectations will be better measured over the long term as investments mature and achieve their full cash flow potential. Infrastructure has begun to enter a more mature phase as it approaches its three-to-five year window, and is

137INVESTMENTS
Securities Lending ProgramThe Securities Lending Program is a low-risk strategy that allows CalSTRS to use its existing asset base and lending expertise to generate additional income. Over the past year, demand to borrow “specials” (i.e., individual securities with larger spreads) continued to fall, along with increased supply from new entrants in the marketplace and lower demand due to tighter broker-dealer balance sheets impacted by potential regulations. These factors were large contributors to declining earnings for the period. Low interest rates and spreads for cash collateral also diminished during the fiscal year causing a decline in reinvestment opportunities and yields. In addition, higher yielding securities matured and were reinvested at lower short-term interest rates. All of these factors led to lower reinvestment rates and lower overall securities lending returns. Despite these headwinds, for the fiscal year ended June 30, 2014, the Securities Lending Program earned approximately $90.5 million in additional income for the fund. For additional information on the Securities Lending Program, please consult the Fixed Income Securities Lending Program 2013 Annual Report available on CalSTRS.com.
Issue Maturity Date Interest Rate Par Market Value Average Cost Unrealized Gain(Loss)
US TREASURY N/B 10/31/18 1.250% 400,000,000 $396,899,992 $398,535,764 $(1,635,771.88)
US TREASURY N/B 3/31/16 2.375 380,000,000 393,459,570 398,288,141 (4,828,571)
US TREASURY N/B 5/15/24 2.500 328,410,000 327,910,817 327,156,720 754,097
US TREASURY N/B 8/31/17 0.625 320,000,000 316,483,203 315,975,000 508,203
US TREASURY N/B 1/31/20 1.375 320,000,000 312,912,013 320,743,841 (7,831,828)
US TREASURY N/B 11/30/17 0.625 300,000,000 295,427,994 293,625,000 1,802,994
US TREASURY N/B 8/15/16 0.625 270,000,000 270,666,905 268,024,609 2,642,296
US TREASURY N/B 2/28/17 3.000 245,000,000 259,641,195 254,968,404 4,672,791
US TREASURY N/B 8/31/15 0.375 255,000,000 255,617,092 254,601,563 1,015,529
US TREASURY N/B 12/31/14 2.625 250,000,000 253,157,500 260,371,094 (7,213,594)
Table 4 Largest Fixed Income Holdings as of June 30, 2014 (CalSTRS maintains a complete list of portfolio holdings)
INVESTMENTS
beginning to achieve greater cash flow potential. For more information about the Inflation Sensitive portfolio, refer to the Investment section of CalSTRS.com.
Fixed Income For the fiscal year ending June 30, 2014, the Fixed Income portfolio had total assets of $29.4 billion representing 15.5 percent of the total fund. The Fixed Income unit operates a hybrid model portfolio which takes advantage of the benefits and efficiencies of both internal and external asset management. Eighty-one percent of the portfolio’s assets are managed by internal staff using enhanced core and high yield strategies with a moderate level of risk. The remaining 19 percent is managed by external managers using broader opportunistic strategies which assume a higher level of risk and therefore a higher level of expected return. The Fixed Income portfolio outperformed its benchmark by 107 basis points (5.79 percent vs. 4.72 percent). The three, five, and ten year returns were positive and have outperformed the benchmark by 69, 100, and 41 basis points, respectively. For more information, please review the Fixed Income Quarterly Activity Report on CalSTRS.com.
The Fixed Income unit manages two additional programs: Currency Management, which is discussed in the Overlay section, and Securities Lending discussed below.
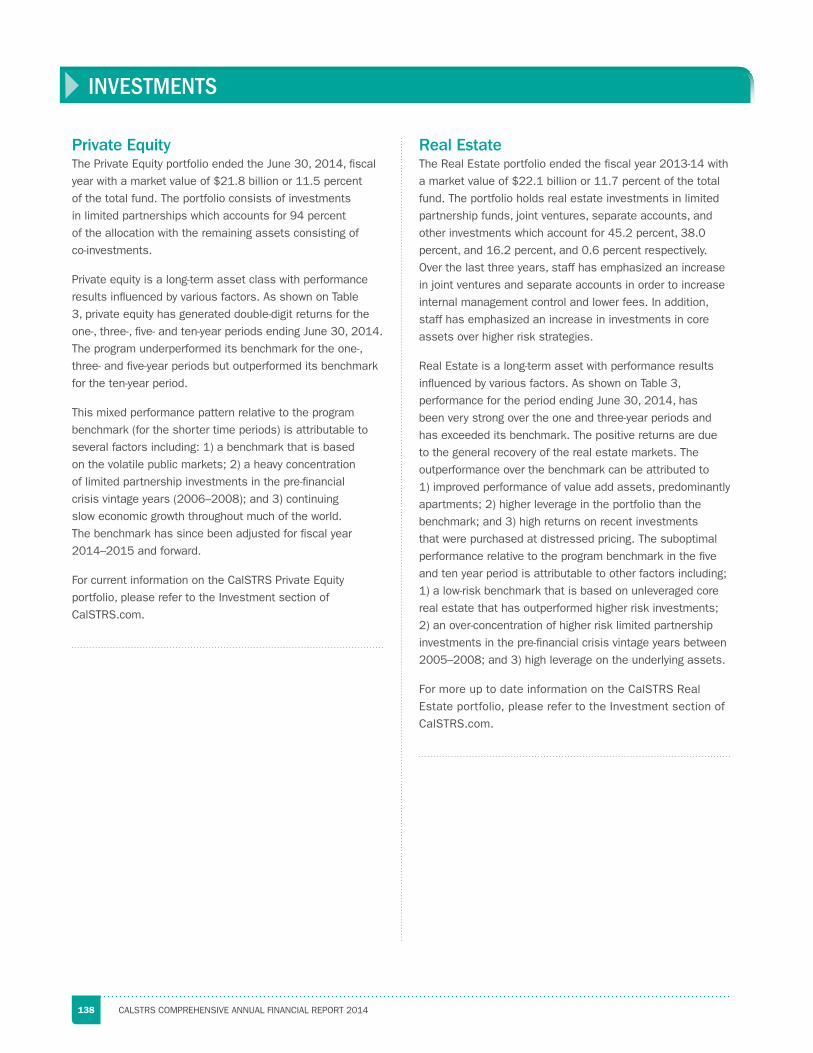
138 CALSTRS COMPREHENSIVE ANNUAL FINANCIAL REPORT 2014
Private EquityThe Private Equity portfolio ended the June 30, 2014, fiscal year with a market value of $21.8 billion or 11.5 percent of the total fund. The portfolio consists of investments in limited partnerships which accounts for 94 percent of the allocation with the remaining assets consisting of co-investments.
Private equity is a long-term asset class with performance results influenced by various factors. As shown on Table 3, private equity has generated double-digit returns for the one-, three-, five- and ten-year periods ending June 30, 2014. The program underperformed its benchmark for the one-, three- and five-year periods but outperformed its benchmark for the ten-year period.
This mixed performance pattern relative to the program benchmark (for the shorter time periods) is attributable to several factors including: 1) a benchmark that is based on the volatile public markets; 2) a heavy concentration of limited partnership investments in the pre-financial crisis vintage years (2006–2008); and 3) continuing slow economic growth throughout much of the world. The benchmark has since been adjusted for fiscal year 2014–2015 and forward.
For current information on the CalSTRS Private Equity portfolio, please refer to the Investment section of CalSTRS.com.
Real EstateThe Real Estate portfolio ended the fiscal year 2013-14 with a market value of $22.1 billion or 11.7 percent of the total fund. The portfolio holds real estate investments in limited partnership funds, joint ventures, separate accounts, and other investments which account for 45.2 percent, 38.0 percent, and 16.2 percent, and 0.6 percent respectively. Over the last three years, staff has emphasized an increase in joint ventures and separate accounts in order to increase internal management control and lower fees. In addition, staff has emphasized an increase in investments in core assets over higher risk strategies.
Real Estate is a long-term asset with performance results influenced by various factors. As shown on Table 3, performance for the period ending June 30, 2014, has been very strong over the one and three-year periods and has exceeded its benchmark. The positive returns are due to the general recovery of the real estate markets. The outperformance over the benchmark can be attributed to 1) improved performance of value add assets, predominantly apartments; 2) higher leverage in the portfolio than the benchmark; and 3) high returns on recent investments that were purchased at distressed pricing. The suboptimal performance relative to the program benchmark in the five and ten year period is attributable to other factors including; 1) a low-risk benchmark that is based on unleveraged core real estate that has outperformed higher risk investments; 2) an over-concentration of higher risk limited partnership investments in the pre-financial crisis vintage years between 2005–2008; and 3) high leverage on the underlying assets.
For more up to date information on the CalSTRS Real Estate portfolio, please refer to the Investment section of CalSTRS.com.
INVESTMENTS
–

139INVESTMENTS
Global EquityFor the fiscal year ending June 30, 2014, the $108.4 billion Global Equity portfolio represented 57.3 percent of the total fund. U.S. Equity accounted for 67 percent of the total equity allocation, while Non-U.S. Equity accounted for the remaining 33 percent.
The Global Equity portfolio returned 24.73 percent, outperforming its policy benchmark by 51 basis points (24.73 vs. 24.22 percent). The relative outperformance was driven by the U.S. equity portfolio which outperformed the Russell 3000 ex-tobacco ex-firearm Index by 59 basis points (25.97 percent vs. 25.38 percent). The Non-U.S. equity portfolio had a positive relative return, outperforming the MSCI ACWI ex-U.S. ex-tobacco ex-firearm Index by 47 basis points (22.27 percent vs. 21.80 percent). For more information about the Global Equity portfolio, comprehensive Quarterly Investment Reports can be found in the Investment section of CalSTRS.com.
During fiscal year 2013–14, the Global Equity team focused on two key initiatives: 1) Increased internal asset management—Global Equity staff implemented a new trade and risk management system in 2013 which established the foundation to support additional internal management; 2) Refresh the active manager pool—Global Equity staff began the process of reviewing and refreshing the pools of our active external managers. Staff will be able to allocate and rebalance to these new managers as conditions warrant. Our goal is to partner with managers who have the
highest probability of generating positive alpha while also contributing to our knowledge and understanding of the global equity markets.
Corporate GovernanceDuring fiscal year 2013–14, CalSTRS staff voted on 74,666 proxy proposals submitted by 7,060 corporations that were held by CalSTRS. The 74,666 proposals represented a 12 percent increase from the 66,670 proposals voted in 2012–13.
1. Election of Directors: CalSTRS generally votes in favor of a director unless the proxy statement shows circumstances contrary to policy. Examples of such circumstances include: potential conflict of interest due to other directorships or employment, providing legal or investment banking advice and poor board meeting attendance (less than 75 percent).
• Number Voted: 17,546 • Voted For: 11,616 (66 percent) • Voted Against: 5,930 (34 percent)
2. Selection of Auditors: CalSTRS will vote in favor of the independent auditors recommended by management unless the auditor provides services that run contrary to what CalSTRS policy allows. Examples of such services are: consulting, information system design and implementation, investment banking support and excessive non-audit fees (greater than 30 percent of the total fees billed).
Issue Shares Market Value Average Cost Unrealized Gain (Loss)
APPLE INC 17,906,003 $1,664,004,859 $1,240,918,343 $423,086,516
EXXON MOBIL CORP 12,134,410 1,221,692,399 967,798,999 253,893,400
MICROSOFT CORP 24,639,383 1,027,462,271 746,543,545 280,918,726
JOHNSON + JOHNSON 9,098,296 951,863,728 620,122,438 331,741,290
CHEVRON TEXACO CORP 5,851,575 763,923,116 579,392,362 184,530,754
WELLS FARGO + CO 14,161,674 744,337,585 474,660,583 269,677,002
GENERAL ELECTRIC CO 27,833,077 731,453,264 550,106,939 181,346,325
VERIZON COMMUNICATIONS INC 13,969,745 683,541,987 592,680,646 90,861,341
BERKSHIRE HATHAWAY INC CL B 5,274,320 667,517,939 457,573,227 209,944,712
PFIZER INC 21,949,170 651,451,366 515,208,919 136,242,447
Table 5 Largest Equity Holdings as of June 30, 2014 (CalSTRS maintains a complete list of portfolio holdings)
INVESTMENTS

140 CALSTRS COMPREHENSIVE ANNUAL FINANCIAL REPORT 2014
• Number Voted: 2,776 • Voted For: 2,536 (91 percent)
• Voted Against: 240 (9 percent)
3. Compensation Plans (Stock Option Plans, Employee Stock Purchase Plans, etc.): Companies provide a variety of compensation plans for executives, employees and non-employee directors. Many of these plans provide for the issuance of long-term incentives to attract, reward and retain key employees. Compensation plans are evaluated based on CalSTRS' Executive Compensation Model Guidelines.
• Number Voted: 1,273 • Voted For: 1,042 (82 percent) • Voted Against: 231 (18 percent)
4. Advisory Vote on Compensation: More commonly known as Say-on-Pay, these votes provide shareholders the opportunity to ratify the compensation of the executives named in the proxy. CalSTRS votes on these proposals on a case-by-case basis.
• Number Voted: 2,533 • Voted For: 2,114 (83 percent) • Voted Against: 419 (17 percent)
5. Approve Merger/Acquisition— Management: CalSTRS evaluates mergers and acquisitions on a case-by-case basis utilizing a total portfolio view.
• Number Voted: 130 • Voted For: 127 (98 percent) • Voted Against: 3 (2 percent)
6. Corporate Actions/Corporate Governance Issues: These are issues related to spin-offs, incorporation, stock issuance, stock splits, and bylaw amendments. CalSTRS votes on these proposals on a case-by-case basis.
• Number Voted: 524 • Voted For: 378 (72 percent) • Voted Against: 146 (28 percent)
7. Miscellaneous Issues—Management: The most common miscellaneous votes considered are requests to transact other business or adjourn a meeting. CalSTRS votes these issues on a case-by-case basis.
• Number Voted: 237 • Voted For: 35 (15 percent) • Voted Against: 202 (85 percent)
8. Frequency of Advisory Vote on Compensation: More commonly known as Say-When-On-Pay, this vote is a requirement of the Dodd-Frank Act and allows shareholders to vote on the frequency of future advisory votes on compensation. Under the rule, shareholder can choose to vote every one-, two-, or three-years. CalSTRS routinely supports annual Say-On-Pay votes.
• Number Voted: 120 • 1-year: 120 (100 percent) • 2-year: 0 • 3-year: 0
9. Shareholder Proposals: CalSTRS votes on a variety of shareholder proposals. Examples of the issues voted on include: social and environmental issues, removing classified boards of directors, requiring an independent board chairman, giving shareholder access to the nomination process, tying compensation plans to company performance, and requiring shareholder approval for large severance packages.
• Number Voted: 555 • Voted For: 397 (72 percent) • Voted Against: 158 (28 percent)
The Corporate Governance unit continues to manage nine governance funds, which accounts for $5 billion in assets under management as of June 30, 2014 with returns of 33.6 percent. These funds invest in companies with poor governance structures and engage management to improve governance and enhance long-term shareholder value.
INVESTMENTS

141INVESTMENTS
Cash Balance Benefit Program
The Cash Balance Benefit Program contributions were invested into pooled funds from inception in February 1997 through June 2001. Sixty percent of the contributions were allocated to the S&P 500 Portfolio and 40 percent to the Government Index Portfolio. In July 2001, the program’s contributions were invested in CalSTRS entire portfolio, excluding Private Equity and Real Estate Investments. As of June 30, 2014, the market value was approximately $236.8 million and the rate of return for the Cash Balance Benefit Program for the fiscal year was 19.45 percent.
Defined Benefit Supplemental Program
The Defined Benefit Supplement Program contributions were invested in CalSTRS entire portfolio, excluding Private Equity and Real Estate Investments from January 2001 through June 2011. In July 2011, the program contributions were invested in CalSTRS entire portfolio. As of June 30, 2014, the market value was approximately $10.6 billion and the rate of return for the Defined Benefit Supplement Program for the fiscal year was 18.66 percent.
For further information on the Cash Balance Benefit Program or the Defined Benefit Supplement Program, please see the supplemental program information at CalSTRS.com.
June 30, 2013
Portfolio Type Book Value Net Asset Value
Global Equity $75,430 $88,769
Fixed Income 27,791 27,813
Private Equity 21,647 21,878
Real Estate 27,119 22,918
Inflation Sensitive 697 710
Absolute Return 982 1,037
Cash 2,694 2,695
Portfolio Total $156,360 $165,820
Adjustments:
Securities Lending Collateral 23,216
Accruals 1,693
Cash & Cash Equiv (1827)
STRS PLAN ASSETS-INVESTMENTS $188,902
June 30, 2014
Book Value Net Asset Value % of Net Asset Value Net Value Change
$80,666 $108,350 57.3% $19,581
28,956 29,362 15.5% 1,549
21,111 21,771 11.5% (107)
25,322 22,120 11.7% (798)
1,253 1,342 0.7% 632
1,309 1,397 0.8% 360
4,737 4,738 2.5% 2,043
$163,354 $189,080 100% $23,260
22,303
3,098
(288)
$214,193
Table 6 Investment Summary for the Current and Previous Fiscal Year (dollars in millions)
INVESTMENTS

142 CALSTRS COMPREHENSIVE ANNUAL FINANCIAL REPORT 2014
Investment Categories Net Asset Value Investment Expenses* Basis Points
Global Equity $108,350,490 $133,970 12.4
Fixed Income 29,361,701 18,797 6.4
Private Equity 21,771,165 10,317 4.7
Real Estate 22,120,081 47,585 21.5
Inflation Sensitive 1,342,210 984 7.3
Absolute Return 1,396,709 11,754 **
Cash 4,737,690 276 0.6
Total Assets And Expenses $189,080,046 $223,683 11.8
* Investment Expenses reflected in this table generally represent direct costs associated with investing. Certain expenses including carried interest and management fees related to private assets are not included.
** Absolute Return includes the Currency Management Program (CMP) which calculates basis points using notional values instead of net asset values.
Table 7 Schedule of Investment Expenses July 1, 2013 through June 30, 2014 (dollars in thousands)
Broker Name Commission Shares Commission Per Share (Avg)
Credit Suisse First Boston $2,242,880 451,376,998 $0.005
State Street Bank and Trust Company 2,215,570 515,767,191 0.004
JP Morgan 1,853,741 185,247,836 0.010
Goldman Sachs 1,664,339 328,431,207 0.005
Citigroup 1,629,649 326,350,166 0.005
Morgan Stanley 1,359,006 359,094,708 0.004
Deutsche Bank 1,280,624 242,982,615 0.005
Merrill Lynch 1,222,264 136,290,904 0.009
UBS AG 1,185,571 156,468,403 0.008
Instinet 1,179,173 122,911,430 0.010
All Other Brokers 11,558,357 1,478,616,258 0.008
Total Commissions $27,391,174 4,303,537,716 $0.006
Table 8 Global Equity Broker Commissions July 1, 2013 Through June 30, 2014
INVESTMENTS

Defined Benefit Program145 Actuary’s Certification Letter
147 Summary of Actuarial Assumptions and Methods
148 Actuarial Assumptions
148 Actuarial Methods
149 Independent Actuarial Review
150 Summary of Defined Benefit Program Provisions
153 Changes in Defined Benefit Program Provisions
156 Schedule of Active Member Valuation Data
157 Schedule of Retired Members and Beneficiaries Added to and Removed from Rolls
157 Solvency Test
158 Analysis of Financial Experience
158 Schedule of Funding Progress
Defined Benefit Supplement Program159 Actuary’s Certification Letter
161 Summary of Actuarial Assumptions and Methods
161 Actuarial Assumptions
162 Independent Actuarial Review
162 Summary of Defined Benefit Supplement Program Provisions
163 Changes in Defined Benefit Supplement Program Provisions
166 Schedule of Active Member Valuation Data
167 Schedule of Retired Members and Beneficiaries Added to and Removed from Annuity Rolls
167 Solvency Test
CalSTRS administers retirement, disability and survivor benefits for California’s 879,329 public school educators (from pre-kindergarten through community college) and their beneficiaries.
ACTUARIAL

168 Analysis of Financial Experience
168 Schedule of Funding Progress
Cash Balance Benefit Program169 Actuary’s Certification Letter
171 Summary of Actuarial Assumptions and Methods
171 Actuarial Assumptions
172 Independent Actuarial Review
172 Summary of Cash Balance Benefit Program Provisions
173 Changes in Cash Balance Benefit Program Provisions
176 Schedule of Active Participant Valuation Data
177 Schedule of Retired Participants and Beneficiaries Added to and Removed from Annuity Rolls
177 Solvency Test
178 Analysis of Financial Experience
178 Schedule of Funding Progress
Medicare Premium Payment Program179 Actuary’s Certification Letter
181 Summary of Actuarial Assumptions and Methods
181 Actuarial Methods
181 Independent Actuarial Review
181 Summary of Medicare Premium Payment Program Provisions
182 Changes in the Medicare Premium Payment Program Provisions
186 Schedule of Medicare Part A Enrollment Rates
186 Schedule of Retired Members Added to and Removed from Medicare Part A Premium Rolls
187 Solvency Test
187 Analysis of Financial Experience
ACTUARIAL (CONTINUED)

145ACTUARIAL
ctrj0235.docx - 1 20 0003 STR 12 / 20.003.STR.11.2013.1 / MCO/NJC/nlo
1301 Fifth Avenue
Suite 3800
Seattle, WA 98101-2605
USA
Tel +1 206 624 7940
Fax +1 206 623 3485
milliman.com
Offices in Principal Cities Worldwide
November 24, 2014
Teachers’ Retirement Board California State Teachers’ Retirement System
Re: Valuation of the Defined Benefit Program
Dear Members of the Board:
The basic financial goal of the Defined Benefit Program of the California State Teachers' Retirement System (CalSTRS) is to establish contributions which fully fund the obligations and which, as a percent of payroll, remain level for each generation of active members. Annual actuarial valuations measure the progress toward this goal, as well as test the adequacy of the contribution rates.
CalSTRS measures its funding status as the Funded Ratio of the actuarial value of valuation assets over the actuarial accrued liabilities. The funding status based on the past three actuarial valuations is shown below:
Valuation Date Funded Ratio
June 30, 2011 69% June 30, 2012 67% June 30, 2013 67%
Based on the June 30, 2013 actuarial valuation, the income from member, employer, and State contributions was not projected to finance the DB Program on an actuarially sound basis. However, legislation enacted subsequent to the valuation provides for graded increases in the contribution rates for all three contributing groups. Based on the additional contribution schedule, CalSTRS is projected to reach a 100% Funded Ratio in 2046.
The June 30, 2013 valuation results are based on the membership data and the asset information provided by CalSTRS. In our examination of these data, we have found them to be reasonably consistent and comparable with data used for other purposes, although we have not audited the data at the source. Since the valuation results are dependent on the integrity of the data supplied, the results can be expected to differ if the underlying data is incomplete or missing. It should be noted that if any data or other information is found to be materially inaccurate or incomplete, our calculations will need to be revised.
Milliman did not prepare the summaries or schedules shown the Financial and Actuarial Sections. However, the actuarial information contained in Schedule I, II, III and V of the Financial Section and in this Actuarial Section was derived from our June 30, 2013 actuarial valuation report for funding and our September 25, 2014 letter which communicated the actuarial results for financial reporting for June 30, 2014.
The actuarial computations presented in the valuation report are for purposes of determining the recommended funding amounts for CalSTRS consistent with our understanding of their funding requirements and goals. The liabilities are determined by using the entry age normal funding method. The actuarial assets are determined by using a one-third smoothed recognition method of the difference between the actual market value to the expected actuarial value.
VALUATION OF THE DEFINED BENEFIT PROGRAM

146 CALSTRS COMPREHENSIVE ANNUAL FINANCIAL REPORT 2014
Teachers' Retirement Board
November 24, 2014 Page 2
ctrj0235.docx - 2 20 0003 STR 12 / 20.003.STR.11.2013.1 / MCO/NJC/nlo
The valuation is based on our understanding of the current benefit provisions of the DB Program and the actuarial assumptions which were last reviewed and adopted by the Board in February of 2012. The assumptions will be reviewed in detail again in the fiscal year ending June 30, 2016. The assumptions used for financial reporting under GASB 67 are the same as the funding valuation assumptions with the following exceptions:
1. The discount rate of 7.60% is gross of administrative expenses; and
2. The market value of assets is used for the Fiduciary Net Position.
For financial reporting purposes, all programs within the State Teachers’ Retirement Plan are reported in aggregate.
We believe the actuarial assumptions and methods are internally consistent, reasonable and meet the parameters of Governmental Accounting Standards Board Statement No. 67 for fulfilling financial accounting requirements. Nevertheless, the emerging costs will vary from those presented in our report to the extent that actual experience differs from that projected by the actuarial assumptions. Future actuarial measurements may differ significantly from the current measurements as presented in the valuation report due to many factors. Due to the limited scope of our assignment, we did not perform an analysis of the potential range of future measurements.
Our valuation report and this letter have been prepared exclusively for CalSTRS for a specific and limited purpose. Milliman does not intend to benefit and assumes no duty or liability to other parties who receive this work. It is a complex, technical analysis that assumes a high level of knowledge concerning CalSTRS operations, and uses CalSTRS data, which Milliman has not audited. No third party recipient of Milliman’s work product should rely upon Milliman’s work product. Such recipients should engage qualified professionals for advice appropriate to their own specific needs.
The consultants who worked on these assignments are pension actuaries. Milliman’s advice is not intended to be a substitute for qualified legal or accounting counsel. The signing actuaries are independent of the plan sponsor. We are not aware of any relationship that would impair the objectivity of our work.
We certify that the June 30, 2013 valuation was performed in accordance with the Actuarial Standards Board (ASB) standards of practice and by qualified actuaries. We are members of the American Academy of Actuaries and have experience in performing valuations for public retirement systems.
Respectfully submitted,
Mark C. Olleman, FSA, EA, MAAA Nick J. Collier, ASA, EA, MAAA Principal and Consulting Actuary Principal and Consulting Actuary
VALUATION OF THE DEFINED BENEFIT PROGRAM

147ACTUARIAL
Summary of Actuarial Assumptions and MethodsCalSTRS, through its consulting actuary, performs an experience study every four years to determine appropriate demographic and economic assumptions. These assumptions are then applied when the consulting actuary performs an actuarial valuation to monitor the funding status of the Defined Benefit Program. The study was adopted by the Teachers’ Retirement Board on February 2, 2012.
The most recent experience study for 2006–2010 was completed as of June 30, 2010. The most recent actuarial valuation was completed as of June 30, 2013 and adopted by the Teachers’ Retirement Board on April 3, 2014.
The following summary and tables were prepared by CalSTRS staff. All of the assumptions used in the actuarial valuation were adopted by the Teachers’ Retirement Board when the experience study was adopted on February 2, 2012.
The following is a summary of the assumptions and methods adopted by the Teachers’ Retirement Board for funding this program:
• Investment return rate and discount rate is 7.50 percent, net of investment and administrative expenses.
• Method used to value program assets for actuarial valuation purposes: expected actuarial value adjusted for one-third of the difference between actual market value and expected actuarial value.
• Assumption for general wage increase is 3.75 percent, of which 3.00 percent is due to inflation and 0.75 percent is due to expected gains in productivity.
• The actuarial cost method used by the program is the entry age normal actuarial cost method, with the actuarial gains/losses and the unfunded actuarial obligation amortized over 30 years.
• The extent to which benefits are expected to increase as a result of cost-of-living type adjustments is an annual 2 percent increase to the initial benefit beginning on September 1 following the first anniversary of the effective date of the benefit. Since 1972, this increase is applied to all eligible continuing benefits.
Actuarial Cost Method For funding purposes the entry age normal cost method was selected for the Defined Benefit Program since it is the most common cost method among public sector pension plans. The advantage to using this method is that the cost over time tends to remain fairly level as a percentage of overall payroll. This is well-suited to most public systems, which tend to contribute as a percentage of pay, and which benefit from a stable contribution rate for budgeting and planning purposes.
Financial Reporting Under GASB 67 financial reporting the State Teachers' Retirement Plan (STRP) includes the Defined Benefit, Defined Benefit Supplement, Cash Balance Benefit, Supplemental Benefit Maintenance Account and Teachers' Replacement Benefit programs.
Actuarial method and assumptions for GASB 67 financial reporting
• The discount rate is 7.60 percent, net of investment expenses but gross of administrative expenses.
• The actuarial cost method is the entry age normal cost method.
• General wage increase is 3.75 percent, of which 3.00 percent is due to inflation.
• Postretirement benefit increases of 2.00 percent simple for Defined Benefit Program and 85% purchasing power level for SBMA program. Not applicable for Cash Balance Benefit and Defined Benefit Supplement programs.
As required by GASB 67, the discount rate used for financial reporting of 7.60 percent is net of investment expenses but gross of administrative expenses. The 7.50 percent investment return rate used for funding and administrative purposes is net of investment and administrative expenses. The 2011 CalSTRS mortality tables were used in both financial funding and administrative calculations. Table 6 provides more details of the mortality assumptions. For the valuation used for funding and administrative, the DB Program actuarial value of assets ("smoothed value") is used in the determination of the Unfunded Actuarial Obligation. For financial reporting, the aggregate assets for all programs in the State Teachers' Retirement Plan on a market basis are used in the determination of the Net Pension Liability.
DEFINED BENEFIT PROGRAM

148 CALSTRS COMPREHENSIVE ANNUAL FINANCIAL REPORT 2014
Discussion of recent changes: The nature of the program—Since the last experience study as of June 30, 2010, program amendments have been made that have affected the June 30, 2013 actuarial valuation.
Changes to the plan: Effective January 1, 2013 Chapter 296, Statutes of 2012 (AB 340-Furutani), was enacted in 2012. The new law reduces retirement benefits for educators who became members after 2012. Specifically, for new members some of the key provisions of the law are: 1) the benefit factors at all ages less than age 65 are reduced; 2) final compensation is based on a 36-month period; 3) the definition of creditable compensation is restricted; and, 4) compensation for benefit purposes is limited to no more than 120% of the Social Security taxable wage base. Additional changes that do not directly affect the calculated retirement benefits apply to all members.
Funding: The Teachers’ Retirement Board had no authority to set contribution rates and had to rely upon remedy from the Legislature and the Governor, who this year enacted a responsible funding plan. Assembly Bill (AB) 1469 enacted in Chapter 47, Statutes of 2014 is projected to fully fund the CalSTRS Defined Benefit Program in 32 years through shared contribution increases among CalSTRS members, employers and State of California. Contribution increases will be phased in over several years with the first increases taking effect July 1, 2014. Member contribution increases will be phased in over the next three years and increase by an additional 2.25 percent of payroll for CalSTRS 2% at 60 members and an additional 1.205 percent for CalSTRS 2% at 62 members. Employer contributions will increase from 8.25 percent to a total of 19.1 percent, phased in over the next seven years. State contributions will increase over the next three years to a total of 6.328 percent. AB 1469 grants the Teachers’ Retirement Board limited rate setting authority to adjust up or down state and employer contribution rates.
Actuarial Assumptions The actuarial valuation utilizes various methods and two different types of assumptions: economic and demographic. Economic assumptions are related to the general economy and its impact on CalSTRS or to the operation of the membership. Demographic assumptions predict the future experience of the membership with respect to eligibility and
benefits and are directly related to the specific experience of CalSTRS members.
Economic assumptions: The two major economic assumptions are investment return and wage growth and each is affected by the underlying assumed rate of inflation. Table 5 provides economic actuarial assumptions for this program as reflected in the most recent actuarial valuation as of June 30, 2013.
Demographic assumptions: Tables 1–4 and 6–8 provide demographic assumption information for this program as reflected in the most recent actuarial valuation as of June 30, 2013.
Actuarial MethodsThe asset smoothing method projects an Expected Value of Assets using the assumed rate of investment return, then one-third of the difference between the Expected Value and the Market Value is recognized in the Actuarial Value of Assets. There were no revisions to either the Actuarial Cost Method or the Asset Valuation Method for this actuarial valuation.
Valuation ResultsCalSTRS contracts for many actuarial services. The current contractor, Milliman, has been the program’s actuary since January 15, 2000.
Tables 9–12 provide summaries of the valuation results. The data displayed in Table 9 is as of June 30 of the specified year. Other information, specifically annual payroll amounts, reported in the financial section of this report will generally not be consistent with this data. The reason for this is that the financial data reflects payroll for all individuals who were active during the year, while Table 9 only includes those individuals who are active as of June 30. It does not include those individuals who were active at some point during the year but not as of June 30.
Amounts provided in Table 10 represent the status of the population as of June 30 of the indicated year. The information provided in “The Removed from Rolls” and “Rolls End of Year” columns include the application of the annual postretirement 2 percent not-compounded cost-of-living adjustment.
DEFINED BENEFIT PROGRAM

149ACTUARIAL
The data provided for each year end in Table 10 is a snapshot of the population taken following year-end closing for the indicated period. It is likely adjustments will be made subsequent to this closing. No attempt is made to update the data in Table 10 for these adjustments.
The following significant plan changes have taken place during the time depicted in Table 11. These program amendments include:
Effective January 1, 2005 • Recalculated benefits to part-time and adult education
community college employees who were members prior to July 1, 1996.
• Expanded eligibility for partial lump-sum benefits. • Eliminated one-year prohibition on employment in a
California public school for members who receive a Retirement Incentive benefit.
• Extended five-year prohibition on postretirement employment with an incentive granting employer to Community College and County Office of Education members.
• Extended existing postretirement earnings exemption for retired members who fill a vacant administrative position in an emergency situation for up to two years.
• Extended retirement date and sunset date for other existing postretirement earnings exemptions.
• Allowed up to 0.2 of one year of unused sick leave service credit to count towards qualifying for one-year final compensation, longevity bonus and other benefit enhancements.
Effective January 1, 2009Funding • Effective with fiscal year 2009–10 through fiscal year
2012–13, payment of previously withheld contributions and interest of $56,979,949, will be made each fiscal year to the SBMA program.
• Actuarial valuations for the Defined Benefit Program will be completed every year.
The most recent actuarial valuation of the system as of June 30, 2013, determined there is an unfunded actuarial obligation for this program. The prior actuarial valuation as of June 30, 2012, also indicated there was an unfunded actuarial obligation.
With one exception, actuarial valuations have been performed every year since June 30, 1997, to analyze the sufficiency of the statutory contributions to meet the current and future obligations of the program. By using the actuarial methods and assumptions adopted by the Teachers’ Retirement Board, the actuarial valuation provides the best estimate of the program’s long-term financing.
Comparing the unfunded actuarial obligation as of two valuation dates does not provide enough information to determine if there were actuarial gains or losses. The correct comparison is between the unfunded actuarial obligation on the valuation date and the expected unfunded actuarial obligation projected from the prior valuation date using the actuarial assumptions in effect for the period of comparison.
Actuarial gains reduce the unfunded actuarial obligation as of the valuation date, and actuarial losses increase the unfunded actuarial obligation. Most actuarial gains and losses are a result of short-term fluctuations in experience or changes in actuarial assumptions. Because of the long-term nature of actuarial assumptions, future patterns of emerging experience may offset these short-term fluctuations.
Independent Actuarial ReviewActuarial services for CalSTRS are provided under contract by a qualified independent actuarial firm, with additional review provided by the actuarial staff.
Through the competitive bid process, the work of a prior actuary will be verified in a subsequent actuarial valuation performed by a new contract actuary. Should the same actuarial firm continue for a period of 10 years, provision is made for an independent review of that firm’s work through an actuarial audit completed by another firm. These audit services are acquired using the competitive bid process.
An audit of the 2007 Actuarial Experience Analysis of the Defined Benefit Program was performed by the firm, The Segal Company. The result of the audit was reported to the board on September 8, 2011.
DEFINED BENEFIT PROGRAM

150 CALSTRS COMPREHENSIVE ANNUAL FINANCIAL REPORT 2014
An audit of the 2008 Actuarial Valuation of the CalSTRS Defined Benefit Program was performed by the firm Cheiron. The result of the audit was reported to the Teachers’ Retirement Board on February 11, 2011.
The current actuarial consultant was retained on January 15, 2000 and in 2006 and 2012, as a result of the competitive bid process.
Summary of Defined Benefit Program ProvisionsThe following summary and tables were prepared by CalSTRS staff. All information is considered in the June 30, 2013 actuarial valuation.
Normal RetirementEligibility Requirement
CalSTRS 2% at 60 Members: Age 60 with five years of credited service.
CalSTRS 2% at 62 Members: Age 62 with five years of credited service.
Benefit2 percent of final compensation for each year of credited service.
Benefit FactorsCredited Service—For each year of membership, credited service is granted based on the ratio of salary earned to full-time salary earnable for one position.No more than one full year of service credit is allowed during any school year; however, the contributions for any service in excess of one year are deposited to the member and employer contribution accounts within the Defined Benefit Supplement Program.
Final Compensation—CalSTRS 2% at 60 Members: Average salary earnable for the highest three consecutive years of credited service for one position. For members with 25 years of service, the calculation is based on the highest average compensation earnable in a consecutive 12-month period.
CalSTRS 2% at 62 Members: Final compensation is based on the highest three consecutive years of salary earnable. Compensation is limited to 120 percent of the Social
Security Wage Base. The limit for 2013 is $136,440 (after applying the 120 percent factor) and is adjusted annually based on the changes in the Consumer Price Index for All Urban Consumers. CalSTRS 2% at 62 members are not eligible for the one-year final compensation benefit enhancement.
Sick Leave Service Credit—Credited Service is granted for unused sick leave at the time of retirement. Sick leave service credit of up to 0.2 years of credited service may be used for eligibility for one-year final compensation or to attain the career factor or the longevity bonus for eligible members.
Career Factor—If a CalSTRS 2% at 60 member has 30 years of credited service, the age factor is increased by 0.2 percent. However, the maximum age factor is 2.4 percent. The career factor does not apply to CalSTRS 2% at 62 members.
Longevity Bonus—For CalSTRS 2% at 60 members attaining 30 years of service by January 1, 2011, a longevity bonus of $200 per month is added to the Member-Only Benefit. The bonus is increased to $300 per month with 31 years of service and $400 per month with 32 or more years of service. The longevity bonus does not apply to CalSTRS 2% at 62 members.
Postretirement Benefit AdjustmentBenefit Improvement Factor—Two percent simple increase on September 1 following the first anniversary of the effective date of the benefit, applied to all continuing benefits.
IRC Section 401(a)(17)Compensation is limited under Internal Revenue Code section 401(a)(17) and assumed to increase at the rate of inflation.
IRC Section 415(b)For CalSTRS 2% at 60 members benefits are subject to limits imposed under Internal Revenue Code Section 415(b). However, no limits are imposed in the valuation of Defined Benefit Program in order to address the potential pay-as-you-go funding needs of the Teachers’ Replacement Benefits Program Fund. CalSTRS 2% at 62 members will not receive any benefits in excess of the federal limit.
DEFINED BENEFIT PROGRAM

151ACTUARIAL
Early RetirementEligibility Requirement—CalSTRS 2% at 60 Members: Age 55 with five years of credited service, or age 50 with 30 years of credited service.
CalSTRS 2% at 62 Members: Age 55 with five years of credited service.
Benefit Reduction—CalSTRS 2% at 60 Members: A .50 percent reduction in the normal retirement allowance for each full month or partial month the member is younger than age 60, plus a reduction of .25 percent for each full month or partial month the member is younger than age 55.
CalSTRS 2% at 62 Members: A .50 percent reduction in the normal retirement allowance for each full month or partial month the member is younger than age 62.
Late RetirementBenefit—CalSTRS 2% at 60 Members: Members continue to earn additional service credit after age 60. The 2 percent age factor increases by 0.033 percent for each quarter year of age that the member is over age 60, up to a maximum of 2.4 percent.
CalSTRS 2% at 62 Members: Members continue to earn additional service credit after age 62. The 2 percent age factor increases by 0.033 percent for each quarter year of age that the member is over age 62, up to a maximum of 2.4 percent.
Deferred RetirementBenefit—Any time after satisfying the minimum service requirement, a member may cease active service, leave the accumulated contributions on deposit, and later retire upon attaining the minimum age requirement.
Disability Allowance—Coverage AEligibility Requirement—Member has five years of credited California service and has not attained age 60, or if a member has earned one year of creditable service and is disabled due to an unlawful act of bodily harm committed by another person while performing creditable service.
Benefit—Fifty percent of final compensation.
- or -
Five percent of final compensation for each year of service credit if over age 45 with fewer than 10 years of service credit.
Children’s Benefit—Ten percent for each eligible dependent child, up to a maximum of 40 percent of final compensation. The increment for each eligible child continues until the child marries or attains age 22.
Offsets—Benefit, including children’s increment, is reduced by disability benefits payable under Social Security, workers’ compensation and employer-paid income protection plan.
Disability Allowance—Coverage BEligibility Requirement—Member has five years of credited California service, or if a member has earned one year of creditable service and is disabled due to an unlawful act of bodily harm committed by another person while performing creditable service.
Benefit—Fifty percent of final compensation, regardless of age and service credit.
Children’s Benefit—Ten percent for each eligible child up to four children, for a maximum of 40 percent of final compensation. The increment for each child continues until the child attains age 21, regardless of student, marital or employment status.
Offsets—The member’s benefit is reduced by disability benefits payable under workers’ compensation.
Death Before Retirement—Coverage AEligibility Requirement—One or more years of service credit for active members or members receiving a disability benefit.
Lump-Sum Payment—The one-time death benefit recipient receives a $6,163 lump-sum payment.
Benefit—The surviving spouse or registered domestic partner with eligible children will receive a family benefit of 40 percent of final compensation for as long as there is at least one eligible child. An additional 10 percent of final compensation is payable for each eligible child up to a maximum benefit of 90 percent.
DEFINED BENEFIT PROGRAM

152 CALSTRS COMPREHENSIVE ANNUAL FINANCIAL REPORT 2014
DEFINED BENEFIT PROGRAM
If there is no surviving spouse or registered domestic partner, a benefit of 10 percent of final compensation is payable to eligible children up to a maximum benefit of 50 percent.
When there are no eligible children, the spouse or registered domestic partner may elect to receive one-half of a 50 percent joint and survivor benefit projected to age 60 or take a lump-sum payment of the remaining contributions and interest.
Death Before Retirement—Coverage BEligibility—One or more years of service credit for active members.
Lump-Sum Payment—The one-time death benefit recipient receives a $24,652 lump-sum payment.
Benefit—A lump-sum payment of the contributions and interest.
- or -
One-half of a 50 percent joint and survivor benefit, beginning on the member’s 60th birthday or immediately with a reduction based on the member’s age and that of the spouse or registered domestic partner at the time the benefit begins.
If the surviving spouse or registered domestic partner elects a monthly benefit, or there is no surviving spouse, each eligible child would receive 10 percent of the member’s final compensation, with a maximum benefit of 50 percent.
Death After RetirementLump-Sum Payment—The one-time death benefit recipient receives a $6,163 lump-sum payment.
Members of retirement age may make a pre-retirement election of an option to designate a beneficiary.
Annuity Form—If the retired member had elected one of the joint and survivor options, the retirement benefit would be reduced in accordance with the option elected.
If no option had been elected, payment of the unpaid contributions and interest, if any, remaining in the member’s account will be made to the beneficiary, if one is named, or to the deceased member’s estate.
Termination from CalSTRSRefund—Refund of the member’s contributions with interest as credited to the member’s account to date of withdrawal. A refund terminates membership and all rights to future benefits from the program.
Re-entry After Refund—Former members who re-enter the program may redeposit all amounts previously refunded plus regular interest. The member must earn one year of credited service after re-entry before becoming eligible for program benefits.
FundingMember Contribution—CalSTRS 2% at 60 Members: eight percent of creditable compensation.
CalSTRS 2% at 62 Members: Equal to one-half of the Normal Cost rate determined in the valuation rounded to the nearest quarter percent. Member rates only change when the Normal Cost rate changes by one percent of pay as compared to the initial Normal Cost rate (or at the time of the last adjustment). Currently, the member contribution rate is equal to eight percent of creditable compensation.
Employer Contribution—Eight percent of the total creditable compensation on which member contributions are based. In addition, funding for the Teachers’ Health Benefits Fund and Teachers’ Replacement Benefit Fund is directed as needed from the employer contributions on a pay-as-you-go basis.
- plus -
0.25 percent of the total creditable compensation on which members’ contributions are based to pay costs for unused sick leave service credit.
State Contribution—The state pays 2.017 percent of the total creditable compensation of the fiscal year ending in the immediately preceding calendar year upon which members’ contributions are based, calculated annually on October 1 and updated on or before the subsequent April 15th and paid in four equal quarterly payments.
- plus -

153ACTUARIAL
DEFINED BENEFIT PROGRAM
Up to 1.505 percent of the total creditable compensation of the fiscal year ending in the immediately preceding calendar year upon which members’ contributions are based, calculated annually on October 1 and updated on or before the subsequent April 15th and paid in four equal quarterly payments. This contribution is made if there is an unfunded obligation or normal cost deficit for benefits in effect on July 1, 1990. Due to an unfunded actuarial obligation as of June 30, 2012 related to the 1990 Benefit Structure, an additional 1.024 percent contribution was made in 2013–14.
Changes in Defined Benefit Program ProvisionsNone.

154 CALSTRS COMPREHENSIVE ANNUAL FINANCIAL REPORT 2014
All demographic assumptions used in the actuarial valuation were adopted by the Teachers’ Retirement Board when the experience study was adopted on February 2, 2012.
Male Female
Age 2011 2011
50 0.114% 0.073%
55 0.164 0.118
60 0.300 0.254
65 0.596 0.468
70 1.095 0.864
75 1.886 1.451
80 3.772 2.759
85 7.619 5.596
90 14.212 11.702
95 22.860 17.780
DB Program Benefits
Age
1990 Benefits
Under 30 years
30 or More Years
Male 55 5.8% 2.7% 8.0%
60 25.0 6.3 27.0
65 20.0 13.5 32.5
70 100.0 10.8 30.0
75 100.0 100.0 100.0
Female 55 7.0% 4.5% 9.0%
60 22.0 9.0 31.0
65 18.0 14.4 37.5
70 100.0 13.5 35.0
75 100.0 100.0 100.0
1Probabilities of retirement are adjusted for members with service between 25 and 30 years.
Table 2 Service Retirement (sample ages)¹
Entry Ages
Duration Under 25 25–29 30–34 35–39 40+
Male
Under 5 100% 100% 100% 100% 100%
10 46 46 38 36 36
15 38 38 31 21 —
20 28 31 15 — —
25 15 15 — — —
Female
Under 5 100% 100% 100% 100% 100%
10 34 32 32 29 29
15 27 24 24 24 —
20 19 14 14 — —
25 10 10 — — —
Table 3 Probabilities of Refund by Sample Duration of Members and Sample Entry Ages (continued)
Table 1 Post-Retirement Mortality Table for Sample Ages
Duration
Male
1 13.0%
2 9.0
3 6.4
4 4.6
5 3.9
10 1.8
15 0.9
20 0.5
25 0.3
Female
1 12.0%
2 8.5
3 6.4
4 4.6
5 3.9
10 1.8
15 0.9
20 0.5
25 0.3
Table 3 Probabilities of Withdrawal from Active Service Before Age and Service Retirement for Sample Age
DEFINED BENEFIT PROGRAM

155ACTUARIAL
Entry Ages
Duration Under 25 25–29 30–34 35–39 40–44 45+
1 5.6% 5.3% 5.1% 4.8% 4.8% 3.5%
5 5.5 4.8 4.5 3.8 3.8 2.6
10 3.2 3.0 2.7 2.3 2.2 1.6
20 1.3 1.1 1.1 0.8 0.8 0.6
30 0.9 0.7 0.6 0.5 — —
40 0.8 0.6 — — — —
Retired Members¹
Male 2011 CalSTRS Retired-M
Female 2011 CalSTRS Retired-F
Active Members
Male 2011 CalSTRS Retired-M (-2 years)
Female 2011 CalSTRS Retired-F (-2 years)
Beneficiaries1
Male 2011 CalSTRS Beneficiary-M
Female 2011 CalSTRS Beneficiary-F
1Future retirees and beneficiaries are valued with a two-year age setback.
Table 4 Assumption for Pay Increases Due to Promotions and Longevity for Sample Ages (exclusive of the assumed general wage increase, which includes inflation)
Consumer Price Inflation 3.00%
Investment Yield (Net of Expenses) 7.50
Wage Inflation 3.75
Interest on Member Accounts 4.50
Table 5 Economic AssumptionsTable 6 Mortality Assumptions
Male
Age
<70 2% at age 40 and under, graded to 3.2% at age 70
>70 RP 2000 male white collar +7 projected to 2025 at age 70 smoothed to +1 age 85 (select rates in first three years, regardless of age)
Female
Age
<70 1.5% at age 40 and less graded to 2.25% at age 70
>70 RP 2000 female white collar +6 projected to 2025 at age 70 smoothed to +2 at age 80 (select rates in first three years, regardless of age)
¹Future disabled members are valued with a two-year age setback.
Table 7 Termination from Disability Due to Death¹
DEFINED BENEFIT PROGRAM

156 CALSTRS COMPREHENSIVE ANNUAL FINANCIAL REPORT 2014
Active Members
Date (as of June 30)
Number of Participating Employers*
Number Annual Payroll Annual Average Pay% Increase In Average Pay
2004 1,262 444,680 $22,589,060,244 $50,798 0.6%
2005 1,285 450,282 23,256,622,046 51,649 1.7
2006 1,322 453,365 24,239,606,097 53,466 3.5
2007 1,356 455,693 25,905,691,360 56,849 6.3
2008 1,428 461,378 27,118,230,762 58,777 3.4
2009 1,472 459,009 27,327,386,616 59,536 1.3
2010 1,514 441,544 26,274,889,981 59,507 0.0
2011 1,587 429,600 25,576,008,636 59,534 0.0
2012 1,660 421,499 25,388,209,920 60,233 1.2
2013 1,670 416,643 25,479,056,693 61,153 1.5
Coverage A
Male 25 0.018%
30 0.027
40 0.072
50 0.144
55 0.189
Female 25 0.018%
30 0.027
40 0.081
50 0.198
55 0.252
Coverage B
Male 25 0.010%
30 0.020
35 0.030
40 0.060
45 0.100
50 0.140
55 0.245
Female 25 0.020%
30 0.020
35 0.040
40 0.070
45 0.110
50 0.185
55 0.300
Table 9 Schedule of Active Member Valuation Data
Table 8 Disability Rates (sample ages)
DEFINED BENEFIT PROGRAM
* Account employers who submit the last contribution line for the active member in the target fiscal year.

157ACTUARIAL
Added to Rolls Removed from Rolls Rolls – End of Year
Date (as of June 30)
Number Annual Allowances1
Number Annual Allowances1
Number Annual Allowances1
% Increase in Annual Allowances
Average Annual Allowances
2005 12,489 $519,053 5,846 $118,053 201,241 $6,018,468 9.5% $29,907
2006 11,517 489,261 6,252 132,275 207,846 6,505,067 8.1% 31,298
2007 12,457 562,542 6,162 137,474 215,641 7,078,199 8.8% 32,824
2008 13,246 626,567 6,419 147,966 223,968 7,711,132 8.9% 34,430
2009 13,420 657,984 6,163 149,998 228,969 8,340,671 8.2% 36,427
2010 16,201 777,293 6,499 165,404 243,796 9,171,309 10.0% 37,619
2011 14,559 671,868 6,938 181,927 253,041 9,802,995 6.9% 38,741
2012 14,316 635,935 6,860 187,271 262,039 10,458,555 6.7% 39,912
2013 12,377 555,751 7,119 205,779 269,429 11,091,944 6.1% 41,168
2014 11,383 507,801 7,299 221,733 275,627 11,624,220 4.8% 42,173
1Dollars in thousands.
Table 10 Schedule of Retired Members and Beneficiaries Added to and Removed from Rolls
Aggregate Accrued Liabilities For (in millions) Funding of Liabilities
Valuation Date (as of June 30)
(1) Active Member Con-tributions on Deposit
(2) Future Benefits to Benefit Recipients
(3) Service Already Rendered by Active Members (Financed by Employer)
Actuarial Value of Assets
(1) (2) (3)
2004 $24,442 $58,225 $52,010 $ 114,094 100.0% 100.0% 60.4%
2005 24,619 63,762 53,812 121,882 100.0 100.0 62.3
2006 25,124 68,774 56,974 131,237 100.0 100.0 65.5
2007 25,895 75,612 65,622 148,427 100.0 100.0 71.5
2008 26,881 81,984 68,869 155,215 100.0 100.0 67.3
2009 27,477 88,927 69,279 145,142 100.0 100.0 41.5
2010 27,105 99,135 70,075 140,291 100.0 100.0 20.1
2011 27,038 109,984 71,383 143,930 100.0 100.0 9.7
2012 27,245 116,475 71,469 144,232 100.0 100.0 0.7
2013 27,683 121,714 72,884 148,614 100.0 99.4 0
Table 11 Solvency Test
DEFINED BENEFIT PROGRAM

158 CALSTRS COMPREHENSIVE ANNUAL FINANCIAL REPORT 2014
Actuarial Valuation as of June 30
2013 (2012)
2012 (2011)
Actuarial Obligation at June 30: $215,189 $208,405
Normal Cost 4,714 4,704
Benefit Payments (10,922) (10,291)
Expected Interest 15,910 15,425
Expected Actuarial Obligation at June 30: 224,891 218,243
Expected Actuarial Value of Assets at June 30: 149,003 149,261
Expected UAO at June 30 75,888 68,982
Actuarial (Gains) or Losses
Change in Assumptions 0 0
Investment Return Assumptions (517) 3,908
Demographic Assumptions (2,610) (3,054)
Net Change Other Sources 906 1,121
Total Actuarial (Gains) & Losses (2,221) 1,975
Unfunded Actuarial Obligation at June 30 73,667 70,957
Funded Ratio 67% 67%
Table 12 Analysis of Financial Experience (gains and losses in unfunded actuarial obligation resulting from differences between assumed and actual experience) (dollars in millions)
DEFINED BENEFIT PROGRAM
Table 13 Schedule of Funding Progress (Dollars in Millions)
Actuarial Valuation Date as of June 30
Actuarial Value of Assets
(a)
Actuarial Accrued Liability (AAL)
(b)
Unfunded AAL (Funding Excess)
(UAAL) (b-a)
Funded Ratio (a/b)
Covered Payroll ( c)
UAAL as a % of Covered Payroll
((b-a)/c)
2014 (1) (1) (1) (1) (1) (1)
2013 $148,614 $222,281 $73,667 67% $26,483 278%
2012 144,232 215,189 70,957 67% 26,404 269%
2011 143,930 208,405 64,475 69% 26,592 242%
2010 140,291 196,315 56,024 71% 26,275 213%
2009 145,142 185,683 40,541 78% 27,327 148%
2008 155,215 177,734 22,519 87% 27,118 83%
2007 146,419 167,129 20,710 88% 25,906 80%
2006 131,237 150,872 19,635 87% 24,240 81%
2005 121,882 142,193 20,311 86% 23,257 87%
Note: Information of actuarially determined and actual contributions for the State Teachers' Retirement Plan is provided in the Financial section, Schedule III, Contributions of Employer and Nonemployer Contributing Entity table.
¹Actuarial Valuation as of June 30, 2014 are expected to be available by April 2015.

159ACTUARIAL
VALUATION OF THE DEFINED BENEFIT SUPPLEMENT PROGRAM
ctrj0236ver2 - 1 20 0003 STR 12 / 20.003.STR.11.2013 / MCO/NJC/nlo
1301 Fifth Avenue Suite 3800 Seattle, WA 98101-2605 USA
Tel +1 206 624 7940 Fax +1 206 623 3485
milliman.com
Offices in Principal Cities Worldwide
November 24, 2014
Teachers’ Retirement Board California State Teachers’ Retirement System
Re: Valuation of the Defined Benefit Supplement Program
Dear Members of the Board:
The basic financial goal of the Defined Benefit Supplement (DBS) Program of the California State Teachers' Retirement System (CalSTRS) is to maintain sufficient resources to fully fund the obligations. Annual actuarial valuations measure the progress toward this goal, as well as test the adequacy of the contribution rates.
CalSTRS measures its funding status as the Funded Ratio of the actuarial value of valuation assets over the actuarial accrued liabilities. The funding status based on the past three actuarial valuations is shown below:
Valuation Date Funded Ratio June 30, 2011 104% June 30, 2012 101% June 30, 2013 106%
The market gain for the fiscal year ended in 2013 caused an increase in the Funded Ratio. As of June 30, 2013, the Market Value of Assets for the DBS Program exceeds the Actuarial Obligation. Additional interest and annuity credits were granted based on the Program’s funded level and are reflected in the Funded Ratio shown above. Prior to the additional credits, the Funded Ratio was 110% (as reported in the Management’s Discussion and Analysis).
The June 30, 2013 valuation results are based on the membership data and the asset information provided by CalSTRS. In our examination of these data, we have found them to be reasonably consistent and comparable with data used for other purposes, although we have not audited the data at the source. Since the valuation results are dependent on the integrity of the data supplied, the results can be expected to differ if the underlying data is incomplete or missing. It should be noted that if any data or other information is found to be materially inaccurate or incomplete, our calculations will need to be revised.
Milliman did not prepare the summaries or schedules shown the Financial and Actuarial Sections. However, the actuarial information contained in Schedule I, II, III and V of the Financial Section and in this Actuarial Section was derived from our June 30, 2013 actuarial valuation report for funding and our September 25, 2014 letter which communicated the actuarial results for financial reporting for June 30, 2014.
The actuarial computations presented in the valuation report are for purposes of determining the recommended funding amounts for CalSTRS consistent with our understanding of their funding requirements and goals. The liabilities are determined by using the traditional unit credit funding method. The actuarial assets are equal to fair market value.

160 CALSTRS COMPREHENSIVE ANNUAL FINANCIAL REPORT 2014
VALUATION OF THE DEFINED BENEFIT SUPPLEMENT PROGRAM
Teachers' Retirement BoardNovember 24, 2014
Page 2
ctrj0236ver2 - 2 20 0003 STR 12 / 20.003.STR.11.2013 / MCO/NJC/nlo
The funding valuation is based on our understanding of the current benefit provisions of the DBS Program and the actuarial assumptions which were last reviewed and adopted by the Board in February of 2012. The assumptions will be reviewed in detail again in 2015. The assumptions used for financial reporting under GASB 67 are the same as the funding valuation assumptions with the following exceptions:
1. The discount rate of 7.60% is gross of administrative expenses; and
2. The individual entry age normal cost method is used.
For financial reporting purposes, all programs within the State Teachers’ Retirement Plan are reported in aggregate.
We believe the actuarial assumptions and methods are internally consistent, reasonable and meet the parameters of Governmental Accounting Standards Board Statement No. 67 for fulfilling financial accounting requirements. Nevertheless, the emerging costs will vary from those presented in our report to the extent that actual experience differs from that projected by the actuarial assumptions. Future actuarial measurements may differ significantly from the current measurements as presented in the valuation report due to many factors. Due to the limited scope of our assignment, we did not perform an analysis of the potential range of future measurements.
Our valuation report and this letter have been prepared exclusively for CalSTRS for a specific and limited purpose. Milliman does not intend to benefit and assumes no duty or liability to other parties who receive this work. It is a complex, technical analysis that assumes a high level of knowledge concerning CalSTRS operations, and uses CalSTRS data, which Milliman has not audited. No third party recipient of Milliman’s work product should rely upon Milliman’s work product. Such recipients should engage qualified professionals for advice appropriate to their own specific needs.
The consultants who worked on these assignments are pension actuaries. Milliman’s advice is not intended to be a substitute for qualified legal or accounting counsel. The signing actuaries are independent of the plan sponsor. We are not aware of any relationship that would impair the objectivity of our work.
We certify that the June 30, 2013 valuation was performed in accordance with the Actuarial Standards Board (ASB) standards of practice and by qualified actuaries. We are members of the American Academy of Actuaries and have experience in performing valuations for public retirement systems.
Respectfully submitted,
Mark C. Olleman, FSA, EA, MAAA Nick J. Collier, ASA, EA, MAAA Principal and Consulting Actuary Principal and Consulting Actuary

161ACTUARIAL
Summary of Actuarial Assumptions and MethodsCalSTRS, through its consulting actuary, performs an experience study at least every four years to determine appropriate demographic and economic assumptions. These assumptions are then applied every year when the consulting actuary performs an actuarial valuation to monitor the funding status of the Defined Benefit Supplement Program. The most recent actuarial valuation was completed as of June 30, 2013, and adopted by the Teachers’ Retirement Board April 3, 2014. The following summary and tables were prepared by CalSTRS staff. All information is considered in the June 30, 2013 actuarial valuation.
The Defined Benefit Supplement Program was established January 1, 2001. The demographic assumptions were based on those adopted for the Defined Benefit Program by the Board on February 2, 2012, and were used to complete the latest actuarial valuation. The Defined Benefit Program and Defined Benefit Supplement Program share the same population, so it is reasonable to use most of the same assumptions for both programs. All of the assumptions used in the actuarial valuation were adopted by the Teachers’ Retirement Board when the experience study was adopted on February 2, 2012. Following are the assumptions adopted by the Teachers’ Retirement Board for this program.
• Investment return rate and discount rate is 7.50 percent, net of investment and administrative expenses.
• Method used to value plan assets for actuarial valuation purposes: Fair market value.
• Assumption for general wage increase is 3.75 percent, of which 3.00 percent is due to inflation and 0.75 percent is due to expected gains in productivity.
• The actuarial cost method used by the program is the traditional unit credit cost method.
• The Defined Benefit Supplement Program does not provide cost-of-living adjustments for benefit recipients.
Actuarial Cost Method For funding purposes, the Traditional Unit Credit Cost Method was selected for the Defined Benefit Supplement Program since the projected benefits of each individual member are allocated by a consistent formula to valuation years. As a result, the actuarial obligation is equal to the accumulated account balances, and the normal cost is equal to the total annual contribution.
Financial Reporting Under GASB 67 financial reporting the State Teachers' Retirement Plan (STRP) includes the Defined Benefit, Defined Benefit Supplement, Cash Balance Benefit, Supplemental Benefit Maintenance Account and Teachers' Replacement Benefit Programs.
Actuarial method and assumptions for GASB 67 financial reporting
• The discount rate is 7.60 percent, net of investment expenses but gross of administrative expenses.
• The actuarial cost method is the entry age normal cost method.
• General wage increase is 3.75 percent, of which 3.00 percent is due to inflation.
• Postretirement benefit increases of 2.00 percent simple for Defined Benefit Program and 85% purchasing power level for SBMA program. Not applicable for Cash Balance Benefit and Defined Benefit Supplement programs.
As required by GASB 67, the discount rate used for financial reporting of 7.60 percent is net of investment expenses but gross of administrative expenses. The 7.50 percent investment return rate used for funding and administrative purposes is net of investment and administrative expenses. GASB 67 also specifies using the entry age normal cost method to calculate pension liability for financial reporting. The traditional unit credit method is used for funding. In addition, the 2011 CalSTRS mortality tables were used in both financial reporting and funding calculations. Table 6 provides more details of the mortality assumptions.
Discussion of recent changes in:The nature of the program—The Defined Benefit Supplement Program was established January 1, 2001. All provisions of the program were considered when completing the most recent actuarial valuation.
Actuarial AssumptionsThe following assumptions were used to complete the valuation for this program.
Under the traditional unit credit actuarial cost method, neither the economic nor the demographic assumptions affect the actuarial obligation for the Defined Benefit
DEFINED BENEFIT SUPPLEMENT PROGRAM

162 CALSTRS COMPREHENSIVE ANNUAL FINANCIAL REPORT 2014
Supplement Program. Those assumptions for this program will have minimal impact under the traditional unit credit cost method or only have significance when participants elect to annuitize the account balance. Under the program, a member must have at least $3,500 in his or her account to elect to annuitize the account balance.
The actuarial methods used for the program’s actuarial valuation as of June 30, 2013, result in an actuarial surplus of $492,156,000 after additional credits.
CalSTRS contracts for many actuarial services. The current contractor, Milliman, has been CalSTRS actuary from the program’s inception.
There are no other specific assumptions that have a material impact on valuation results for this program.
Independent Actuarial ReviewActuarial services for CalSTRS are provided under contract by a qualified independent actuarial firm, with additional review provided by the actuarial staff.
Through the competitive bid process, the work of a prior actuary will be verified in a subsequent actuarial valuation performed by a new contract actuary. Should the same actuarial firm continue for a period of 10 years, provision is made for an independent review of that firm’s work through an actuarial audit completed by another firm. These audit services are acquired using the competitive bid process.
An audit of the 2007 Actuarial Experience Analysis of the Defined Benefit Supplement Program was performed by the firm, The Segal Company. The result of the audit was reported to the Teachers’ Retirement Board on September 8, 2011.
The current actuarial consultant was retained on January 15, 2000 and in 2006 and 2012, as a result of the competitive bid process.
Summary of Defined Benefit Supplement Program ProvisionsThe following tables and summary were prepared by CalSTRS staff. All information is considered in the June 30, 2013 actuarial valuation.
MembershipEligibility Requirement—All members of the Defined Benefit Program who perform creditable service and earn creditable compensation after December 31, 2000, have a Defined Benefit Supplement account.
Member—An eligible employee with creditable service subject to coverage, who has contributions credited in the program or is receiving an annuity from the program.
Account BalanceAccount Balance—Nominal accounts are established for the purpose of determining Defined Benefit Supplement benefits payable to the member. Accounts are credited with contributions, interest at the minimum interest rate, and, if applicable, additional earnings credits.
Contributions—Member and employer contributions are credited to the member’s Defined Benefit Supplement account for service greater than one year during a single school year and compensation for limited-term enhancements and retirement incentives.
Minimum Interest Rate—Annual rate determined for the plan year by the Teachers’ Retirement Board in accordance with federal laws and regulations. The minimum interest rate is equal to the average of the yields on 30-year Treasury Notes for the twelve months ending in February preceding the beginning of the plan year, rounded to the next highest 0.25 percent. The minimum interest rate is not less than the rate at which interest is credited under the Defined Benefit Program.
Additional Earnings Credit—Annual rate determined for the plan year by the Teachers’ Retirement Board based on the actual earnings during the plan year but only to the extent the earnings are sufficient to credit the minimum interest rate and provide any additions to the gain and loss reserve deemed warranted by the board. The board adopted an additional earnings credit of 3.61 percent for the fiscal year ending June 30, 2013.
DEFINED BENEFIT SUPPLEMENT PROGRAM

163ACTUARIAL
Additional Annuity Credit—Annual rate determined for the plan year by the Teachers’ Retirement Board based on the actual earnings during the plan year, but only to the extent the earnings are sufficient to credit the minimum interest rate and provide any additions to the gain and loss reserve deemed warranted by the board. The board adopted an additional annuity credit of 3.61 percent for the fiscal year ending June 30, 2013.
Normal RetirementEligibility Requirement—Receipt of a corresponding benefit under the Defined Benefit Program.
Benefit—The account balance at the benefit effective date subject to limits imposed under Internal Revenue Code section 415.
Form of Payment—The normal form of payment is a lump-sum distribution. Annuity options are available if the account balance is at least $3,500.
Early RetirementEligibility Requirement—Same as Normal Retirement.
Benefit and Form of Payment—Same as Normal Retirement.
Late RetirementBenefit and Form of Payment—Same as Normal Retirement.
Contributions and earnings may continue to be credited to the account balance.
Deferred RetirementBenefit—A member must receive a Defined Benefit Supplement Program benefit when the corresponding benefit is received under the Defined Benefit Program.
Disability BenefitEligibility Requirement—Receipt of a corresponding benefit under the Defined Benefit Program.
Benefit—The account balance at the date the disability benefit becomes payable.
DEFINED BENEFIT SUPPLEMENT PROGRAM
Form of Payment—Same as Normal Retirement. An annuity benefit is discontinued upon termination of the corresponding Defined Benefit Program benefit.
Death Before RetirementEligibility Requirement—Deceased member has an account balance.
Benefit—The account balance at the date of death payable to the designated beneficiary.
Form of Payment—Similar to Normal Retirement.
Death After RetirementEligibility Requirement—The deceased member was receiving an annuity.
Benefit—According to the terms of the annuity elected by the member.
Termination from the ProgramEligibility Requirement—Termination of all CalSTRS-covered employment.
More than five years has elapsed since the most recent termination benefit, if any, has been paid.
Benefit and Form of Payment—Lump-sum distribution of the account balance as of the date of distribution.
Changes in Defined Benefit Supplement Program ProvisionsThere have been no program amendments that would affect an actuarial valuation of the Defined Benefit Supplement Program since the last CalSTRS annual financial report was issued. All program provisions were considered in the completion of the June 30, 2013 actuarial valuation.

164 CALSTRS COMPREHENSIVE ANNUAL FINANCIAL REPORT 2014
All of the assumptions used in the actuarial valuation were adopted by the Teachers’ Retirement Board when the experience study was adopted on February 2, 2012. Following are the assumptions adopted by the Teachers’ Retirement Board for this program.
DEFINED BENEFIT SUPPLEMENT PROGRAM
Male Female
Age
2011 CalSTRS Retired–M
2011 CalSTRS Retired–F
50 0.114% 0.073%
55 0.164 0.118
60 0.300 0.254
65 0.596 0.468
70 1.095 0.864
75 1.886 1.451
80 3.772 2.759
85 7.619 5.596
90 14.212 11.702
95 22.860 17.780
Under 30 years 30 or more years
Age Male Female Male Female
55 2.7% 4.5% 8.0% 9.0%
60 6.3 9.0 27.0 31.0
65 13.5 14.4 32.5 37.5
70 10.8 13.5 30.0 35.0
75 100.0 100.0 100.0 100.0
1Probabilities of retirement are adjusted for members with service between 25 and 30 years.
Duration
Male Female
1 13.0% 1 12.0%
2 9.0 2 8.5
3 6.4 3 6.4
4 4.6 4 4.6
5 3.9 5 3.9
10 1.8 10 1.8
15 0.9 15 0.9
20 0.5 20 0.5
25 0.3 25 0.3
30 0.2 30 0.2
Table 1 Post-Retirement Mortality Table for Sample Ages
Table 2 Probabilities of Retirement for Sample Ages1
Table 3 Probabilities of Withdrawal from Active Service Before Age and Service Retirement for Sample Ages
DEFINED BENEFIT SUPPLEMENT PROGRAM

165ACTUARIAL
Entry Ages
Duration Under 25 25–29 30–34 35–39 40–44 45+
1 5.6% 5.3% 5.1% 4.8% 4.8% 3.5%
5 5.5 4.8 4.5 3.8 3.8 2.6
10 3.2 3.0 2.7 2.3 2.2 1.6
20 1.3 1.1 1.1 0.8 0.8 0.6
30 0.9 0.7 0.6 0.5 — —
40 0.8 0.6 — — — —
Male
Age
<70 2% at age 40 and under, graded to 3.2% at age 70
>70 RP 2000 male white collar +7 projected to 2025 at age 70 smoothed to +1 age 85 (select rates in first three years, regardless of age)
Female
Age
<70 1.5% at age 40 and less graded to 2.25% at age 70
>70 RP 2000 female white collar +6 projected to 2025 at age 70 smoothed to +2 at age 80 (select rates in first three years, regardless of age)
1Future disabled members are valued with a two-year age setback.
Table 4 Assumption for Pay Increases Due to Promotions and Longevity for Sample Ages (exclusive of the assumed general wage increase, which includes inflation)
Table 7 Termination from Disability Due to Death¹
Retired Members1
Male 2011 CalSTRS Retired-M
Female 2011 CalSTRS Retired-F
Active Members
Male 2011 CalSTRS Retired-M (-2 years)
Female 2011 CalSTRS Retired-F (-2 years)
Beneficiaries1
Male 2011 CalSTRS Beneficiary-M
Female 2011 CalSTRS Beneficiary-F
1Future retirees and beneficiaries are valued with a 2-year age setback.
Table 6 Mortality Assumptions
Consumer Price Inflation 3.00%
Investment Yield 7.50
Wage Inflation 3.75
Interest on Member Accounts 7.50
Table 5 Economic Assumptions
DEFINED BENEFIT SUPPLEMENT PROGRAM

166 CALSTRS COMPREHENSIVE ANNUAL FINANCIAL REPORT 2014
Active Members
Date (as of June 30)
Number of Participating Employers*
Number Annual Payroll Annual Average Pay% Increase in Average Pay
2004 1,262 444,316 $23,764,350,000 $53,485 0.309%
2005 1,285 449,773 24,481,444,000 54,431 1.768
2006 1,322 453,131 25,524,878,188 56,330 3.489
2007 1,356 455,453 27,076,457,044 59,450 5.539
2008 1,428 460,961 28,574,701,507 61,989 4.270
2009 1,472 458,736 28,763,266,744 62,701 1.148
2010 1,514 441,326 27,340,840,174 61,952 (1.195)
2011 1,587 423,366 26,758,301,370 63,204 2.021
2012 1,660 403,117 26,556,820,635 65,879 4.232
2013 1,670 390,465 26,444,290,250 67,725 2.802
Table 9 Schedule of Active Member Valuation Data
Coverage A
Male 25 0.018%
30 0.027
40 0.072
50 0.144
55 0.189
Female 25 0.018%
30 0.027
40 0.081
50 0.198
55 0.252
Coverage B
Male 25 0.010
30 0.020
35 0.030
40 0.060
45 0.100
50 0.140
55 0.245
Female 25 0.020
30 0.020
35 0.040
40 0.070
45 0.110
50 0.185
55 0.300
Table 8 Disability Rates—Coverage B (sample ages)
DEFINED BENEFIT SUPPLEMENT PROGRAM
* Account employers who submit the last contribution line for the active member in the target fiscal year.

167ACTUARIAL
Added to Rolls* Removed from Rolls Rolls - End of Year
Date (as of June 30)
Number Annual Allowances
Number Annual Allowances
Number Annual Allowances
% Increase in Annual Allowances
Average Annual Allowances
2005 2,9511 $4,765,4041 181 $29,1921 5,477 $7,624,364 256.0% $1,392
2006 4,0671 7,984,9121 3631 588,4581 9,302 15,183,661 99.1% 1,632
2007 4,841 11,483,366 651 1,405,165 13,561 25,387,837 67.2% 1,872
2008 5,404 14,810,571 1,113 3,006,699 17,900 37,308,946 47.0% 2,084
2009 6,668 22,090,439 1,582 4,948,230 23,010 55,237,098 48.1% 2,401
2010 8,796 31,707,577 1,816 6,612,662 30,048 80,571,112 45.9% 2,681
2011 8,811 31,693,536 343 1,329,718 36,110 103,087,388 27.9% 2,855
2012 8,257 32,650,936 2,386 11,666,909 42,055 124,148,784 20.4% 2,952
2013 7,425 30,392,875 2,657 13,354,982 47,014 141,044,393 13.6% 3,000
2014 6,753 27,678,797 3,115 16,285,428 50,963 153,375,082 8.7% 3,010
*The Defined Benefit Supplement Program was established January 1, 2001. As of June 30, 2003, all members who had retired or became disabled had elected a lump-sum distribution.1Revised in 2007.
Table 10 Schedule of Retired Members and Beneficiaries Added to and Removed from Annuity Rolls
Aggregate Accrued Liabilities for Funding of Liabilities
Valuation Date (as of June 30)
(1) Active Member Contributions on Deposit
(2) Future Benefits to Benefit Recipients
(3) Service Already Rendered by Active Members (Financed by Employer)
Actuarial Value of Assets
(1) (2) (3)
2004 2,025,400,000 9,652,000 0 2,203,682,000 100.0% 100.0% —
2005 2,722,432,000 33,767,000 0 3,023,177,000 100.0 100.0 —
2006 3,546,575,000 69,684,000 0 3,951,327,000 100.0 100.0 —
2007 4,498,170,000 123,876,000 0 5,381,585,000 100.0 100.0 —
2008 5,434,171,000 193,173,000 0 5,636,113,000 100.0 100.0 —
2009 6,316,154,000 283,161,000 0 5,145,981,000 81.5 — —
2010 7,012,291,000 444,151,000 0 6,412,180,000 91.4 — —
2011 7,196,652,000 577,115,000 0 8,054,962,000 100.0 100.0 —
2012 7,280,977,000 710,586,000 0 8,042,090,000 100.0 100.0 —
2013 7,641,488,000 850,275,000 0 8,983,919,000 100.0 100.0 —
Table 11 Solvency Test
DEFINED BENEFIT SUPPLEMENT PROGRAM

168 CALSTRS COMPREHENSIVE ANNUAL FINANCIAL REPORT 2014
Table 12 Analysis of Financial Experience (gains and losses in unfunded actuarial obligation resulting from differences between assumed and actual experience) (dollars in thousands)
DEFINED BENEFIT SUPPLEMENT PROGRAM
Actuarial Valuation as of June 30
2013 (2012)
2012 (2011)
Actuarial Obligation at June 30 $7,991,563 $7,773,767
Expected Changes:
Contributions 160,771 102,570
Benefits Paid (304,415) (247,847)
Expected Earnings/Credits 593,981 577,585
Expected Actuarial Obligation at June 30 8,441,900 8,206,075
Expected Actuarial Value of Assets at June 30 8,496,216 8,508,359
Expected UAO at June 30 (54,316) (302,284)
Actuarial (Gains) or Losses
(Gain) on Actuarial Obligation (246,009) (214,512)
(Gain) on Assets 487,703 466,269
Total Actuarial (Gains) & Losses (733,712) 251,757
Additional Earnings and Annuity Credits
Additional Earnings Credit 266,247 0
Additional Annuity Credit 29,625 0
Total Additional Earnings and Annuity Credits 295,872 0
Unfunded Actuarial Obligation (Surplus) at June 30 (492,156) (50,527)
Funded Ratio 106% 101%
Table 13 Schedule of Funding Progress (Dollars in Millions)
Actuarial Valuation Date as of June 30
Actuarial Value of Assets
(a)
Actuarial Accrued Liability (AAL)
(b)
Unfunded AAL (Funding Excess)
(UAAL) (b-a)
Funded Ratio (a/b)
Covered Payroll(1) (c)
UAAL as a % of Covered Payroll
((b-a)/c)
2014 (2) (2) (2) (2) (2) (2)
2013 $8,984 $8,492 (492) 106% $27,461 (2%)
2012 8,042 7,992 (50) 101% 27,407 0%
2011 8,055 7,774 (281) 104% 27,666 (1%)
2010 6,412 7,456 1,044 86% 27,340 4%
2009 5,146 6,599 1,453 78% 28,763 5%
2008 5,636 5,627 (9) 100% 27,118 0%
2007 5,382 4,622 (760) 116% 25,906 (3%)
2006 3,951 3,616 (335) 109% 24,239 (1%)
2005 3,023 2,756 (267) 110% 23,263 (1%)
Note: Information of actuarially determined and actual contributions for the State Teachers' Retirement Plan is provided in the Financial section, Schedule III, Contributions of Employer and Nonemployer Contributing Entity table.
¹From the June 30, 2005 to the June 30, 2008 valuation, covered payroll excludes limited term incentive pay and extra service credit pay in order to present the payroll based most relevant to the funding of any unfunded actuarial accrued liabilities of the Defined Benefit Supplement Program.2Actuarial Valuation as of June 30, 2014 are expected to be available by April 2015.

169ACTUARIAL
VALUATION OF THE CASH BALANCE BENEFIT PROGRAM
ctrj0237ver2 - 1 20 0003 STR 12 / 20.003.STR.11.2013 / MCO/NJC/nlo
1301 Fifth Avenue Suite 3800 Seattle, WA 98101-2605 USA
Tel +1 206 624 7940 Fax +1 206 623 3485
milliman.com
Offices in Principal Cities Worldwide
November 24, 2014
Teachers’ Retirement Board California State Teachers’ Retirement System
Re: Valuation of the Cash Balance Benefit Program
Dear Members of the Board:
The basic financial goal of the Cash Balance Benefit (CBB) Program of the California State Teachers' Retirement System (CalSTRS) is to maintain sufficient resources to fully fund the obligations. Annual actuarial valuations measure the progress toward this goal, as well as test the adequacy of the contribution rates.
CalSTRS measures its funding status as the Funded Ratio of the actuarial value of valuation assets over the actuarial accrued liabilities. The funding status based on the past three actuarial valuations is shown below:
Valuation Date Funded Ratio June 30, 2011 105% June 30, 2012 100% June 30, 2013 107%
The market gain for the fiscal year ended in 2013 caused an increase in the Funded Ratio. As of June 30, 2013, the Market Value of Assets for the CBB Program exceeds the Actuarial Obligation. Additional interest and annuity credits were granted based on the Program’s funded level and are reflected in the Funded Ratio shown above. Prior to the additional credits, the Funded Ratio was 111% (as reported in the Management’s Discussion and Analysis).
The June 30, 2013 valuation results are based on the membership data and the asset information provided by CalSTRS. In our examination of these data, we have found them to be reasonably consistent and comparable with data used for other purposes, although we have not audited the data at the source. Since the valuation results are dependent on the integrity of the data supplied, the results can be expected to differ if the underlying data is incomplete or missing. It should be noted that if any data or other information is found to be materially inaccurate or incomplete, our calculations will need to be revised.
Milliman did not prepare the summaries or schedules shown the Financial and Actuarial Sections. However, the actuarial information contained in Schedule I, II, III and V of the Financial Section and in this Actuarial Section was derived from our June 30, 2013 actuarial valuation report for funding and our September 25, 2014 letter which communicated the actuarial results for financial reporting for June 30, 2014.
The actuarial computations presented in the valuation report are for purposes of determining the recommended funding amounts for CalSTRS consistent with our understanding of their funding requirements and goals. The liabilities are determined by using the traditional unit credit funding method. The actuarial assets are equal to fair market value.

170 CALSTRS COMPREHENSIVE ANNUAL FINANCIAL REPORT 2014
VALUATION OF THE CASH BALANCE BENEFIT PROGRAMVALUATION OF THE CASH BALANCE BENEFIT PROGRAM
Teachers' Retirement BoardNovember 24, 2014
Page 2
ctrj0237ver2 - 2 20 0003 STR 12 / 20.003.STR.11.2013 / MCO/NJC/nlo
The funding valuation is based on our understanding of the current benefit provisions of the CBB Program and the actuarial assumptions which were last reviewed and adopted by the Board in February of 2012. The assumptions will be reviewed in detail again in in the fiscal year ending June 30, 2016. The assumptions used for financial reporting under GASB 67 are the same as the funding valuation assumptions with the following exceptions:
1. The discount rate of 7.60% is gross of administrative expenses; and
2. The individual entry age normal cost method is used.
For financial reporting purposes, all programs within the State Teachers’ Retirement Plan are reported in aggregate.
We believe the actuarial assumptions and methods are internally consistent, reasonable and meet the parameters of Governmental Accounting Standards Board Statement No. 67 for fulfilling financial accounting requirements. Nevertheless, the emerging costs will vary from those presented in our report to the extent that actual experience differs from that projected by the actuarial assumptions. Future actuarial measurements may differ significantly from the current measurements as presented in the valuation report due to many factors. Due to the limited scope of our assignment, we did not perform an analysis of the potential range of future measurements.
Our valuation report and this letter have been prepared exclusively for CalSTRS for a specific and limited purpose. Milliman does not intend to benefit and assumes no duty or liability to other parties who receive this work. It is a complex, technical analysis that assumes a high level of knowledge concerning CalSTRS operations, and uses CalSTRS data, which Milliman has not audited. No third party recipient of Milliman’s work product should rely upon Milliman’s work product. Such recipients should engage qualified professionals for advice appropriate to their own specific needs.
The consultants who worked on these assignments are pension actuaries. Milliman’s advice is not intended to be a substitute for qualified legal or accounting counsel. The signing actuaries are independent of the plan sponsor. We are not aware of any relationship that would impair the objectivity of our work.
We certify that the June 30, 2013 valuation was performed in accordance with the Actuarial Standards Board (ASB) standards of practice and by qualified actuaries. We are members of the American Academy of Actuaries and have experience in performing valuations for public retirement systems.
Respectfully submitted,
Mark C. Olleman, FSA, EA, MAAA Nick J. Collier, ASA, EA, MAAA Principal and Consulting Actuary Principal and Consulting Actuary

171ACTUARIAL
Summary of Actuarial Assumptions and MethodsCalSTRS, through its consulting actuary, will perform an experience study at least every four years to determine appropriate demographic and economic assumptions. These assumptions are then applied every year when the consulting actuary performs an actuarial valuation to monitor the funding status of the Cash Balance Benefit Program. The most recent actuarial valuation was completed as of June 30, 2013, and adopted by the Teachers’ Retirement Board on April 3, 2014. The following summary and tables were prepared by CalSTRS staff. All information is considered in the June 30, 2013 actuarial valuation.
The Cash Balance Benefit Program was established July 1, 1996. The most recent experience study of the program was completed as of June 30, 2010. The experience study was adopted by the Teachers’ Retirement Board on February 2, 2012 and was used to complete the latest actuarial valuation. All of the assumptions used in the actuarial valuation was adopted by the Teachers’ Retirement Board when the experience study was adopted. Following are the assumptions adopted by the Teachers’ Retirement Board for this program.
• Investment return rate and discount rate is 7.00 percent, net of investment and administrative expenses.
• Method used to value plan assets for actuarial valuation purposes: Fair market value.
• Assumption for general wage increase is 3.75 percent, of which 3.00 percent is due to inflation and 0.75 percent is due to expected gains in productivity.
• The actuarial cost method used by the program is the traditional unit credit cost method.
• The Cash Balance Benefit Program does not provide cost-of-living adjustments for benefit recipients.
Actuarial Cost Method For funding purposes, the Traditional Unit Credit Cost Method was selected for the Defined Benefit Supplement Program since the projected benefits of each individual member are allocated by a consistent formula to valuation years. As a result, the actuarial obligation is equal to the accumulated account balances, and the normal cost is equal to the total annual contribution.
Financial Reporting Under GASB 67 financial reporting the State Teachers' Retirement Plan (STRP) includes the Defined Benefit, Defined Benefit Supplement, Cash Balance Benefit, Supplemental Benefit Maintenance Account and Teachers' Replacement Benefit Programs.
Actuarial method and assumptions for GASB 67 financial reporting
• The discount rate is 7.60 percent, net of investment expenses but gross of administrative expenses.
• The actuarial cost method is the entry age normal cost method.
• General wage increase is 3.75 percent, of which 3.00 percent is due to inflation.
• Postretirement benefit increases of 2.00 percent simple for Defined Benefit Program and 85% purchasing power level for SBMA program. Not applicable for Cash Balance Benefit and Defined Benefit Supplement programs.
As required by GASB 67, the discount rate used for financial reporting of 7.60 percent is the expected return for all programs in the State Teachers' Retirement Plan and is net of investment expenses but gross of administrative expenses. The 7.00 percent investment return rate used for funding purposes is for Cash Balance Benefit Program assets only and is net of investment and administrative expenses. GASB 67 also specifies using the entry age normal cost method to calculate pension liability for financial reporting. The traditional unit credit method is used for funding. In addition, the 2011 CalSTRS mortality tables were used in both financial reporting and funding calculations. Table 6 provides more details of the mortality assumptions.
Discussion of recent changes in:The nature of the program—The Cash Balance Benefit Program was established July 1, 1996.
Program amendments include:
Effective January 1, 2006 • Reduced the one-year waiting period for the receipt of
termination benefits to six months. • Extended eligibility to members hired by a community
college district to perform creditable service on a part-time or temporary basis (semester to semester), or for not more than 60 percent of the hours per week considered a regular full-time assignment.
CASH BALANCE BENEFIT PROGRAMCASH BALANCE BENEFIT PROGRAM

172 CALSTRS COMPREHENSIVE ANNUAL FINANCIAL REPORT 2014
Actuarial Assumptions
The following assumptions were used to complete the valuation for this program.
Neither the economic nor the demographic assumptions for the actuarial valuation as of June 30, 2013, affected the actuarial surplus. Those assumptions for this program will have minimal impact under the traditional unit credit cost method or only have significance when participants elect to annuitize the account balance. Under the program, a participant must have at least $3,500 in his or her account to elect to annuitize the account balance.
The actuarial methods used for the program’s actuarial valuation as of June 30, 2013, result in an actuarial surplus of $12,428,000 after additional credits.
CalSTRS contracts for many actuarial services. The current contractor, Milliman, has been CalSTRS actuary since January 15, 2000.
There are no other specific assumptions that have a material impact on valuation results for this program.
Independent Actuarial ReviewActuarial services for CalSTRS are provided under contract by a qualified independent actuarial firm, with additional review provided by the actuarial staff. The current actuarial consultant was retained on January 15, 2000 and in 2006 and 2012, as a result of the competitive bid process.
Through the competitive bid process, the work of a prior actuary will be verified in a subsequent actuarial valuation performed by a new contract actuary. Should the same actuarial firm continue for a period of 10 years, provision is made for an independent review of that firm’s work through an actuarial audit completed by another firm. These audit services are acquired using the competitive bid process.
An audit of the 2007 Actuarial Experience Analysis of the Cash Balance Benefit Program was performed by the firm, The Segal Company. The result of the audit was reported to the Teachers’ Retirement Board on September 8, 2011.
Summary of Cash Balance Benefit Program ProvisionsThe following tables and summary were prepared by CalSTRS staff. All information is considered in the June 30, 2013 actuarial valuation.
MembershipEligibility Requirement—Membership if employed at less than 50 percent of a full-time position for a California school district, community college district or county office of education that has elected to offer the Cash Balance Benefit Program.
Participant—An eligible employee with creditable service subject to coverage who has contributions credited in the program or is receiving an annuity from the program.
Account BalanceAccount Balance—Nominal accounts established for the purpose of determining benefits payable to the participant. Accounts are credited with contributions, minimum interest rate and additional earnings credits.
Contributions—Generally, participant contributions are 4 percent of salary and employer contributions are 4 percent of salary.
Rules for contribution rates may differ for participants covered by a collective bargaining agreement, but the sum of the participant and employer contributions must equal or exceed 8 percent of salary, and in no event can the employer contribution rate be less than 4 percent of salary.
The Teachers’ Retirement Board may adjust employer contributions for a fixed number of years, but the adjustment shall not exceed 0.25 percent of salaries in any plan year.
Minimum Interest Rate—Annual rate determined for the plan year by the Teachers’ Retirement Board in accordance with federal laws and regulations. The minimum interest rate is equal to the average of the yields on 30-year Treasury Notes for the 12 months ending in February preceding the beginning of the plan year, rounded to the next highest 0.25 percent.
Additional Earnings Credit—Annual rate determined for the plan year by the Teachers’ Retirement Board based on the actual earnings during the plan year, but only to the extent
CASH BALANCE BENEFIT PROGRAM

173ACTUARIAL
the earnings are sufficient to credit the minimum interest rate and provide any additions to the gain and loss reserve deemed warranted by the board. The board adopted an additional earnings credit of 3.25 percent for the fiscal year ending June 30, 2013.
Additional Annuity Credit—Annual rate determined for the plan year by the Teachers’ Retirement Board based on the actual earnings during the plan year, but only to the extent the earnings are sufficient to credit the Minimum Interest Rate and provide any additions to the Gain and Loss Reserve deemed warranted by the board. The board adopted an additional annuity credit of 3.25 percent for the fiscal year ending June 30, 2013.
Normal RetirementEligibility Requirement—Age 60.
Benefit—The account balance at the retirement date subject to limits imposed under Internal Revenue Code section 415.
Form of Payment—The normal form of payment is a lump-sum distribution. Annuity options are available if the sum of the employer and employee accounts equals or exceeds $3,500.
Early RetirementEligibility Requirement—Age 55.
Benefit and Form of Payment—Same as Normal Retirement.
Late RetirementBenefit and Form of Payment—Same as Normal Retirement. Contributions and interest continue to be credited to the account balances until distributed.
Deferred RetirementBenefit—A participant may cease active service, leave the accumulated account balance on deposit and later retire upon attaining the minimum age requirement.
Disability BenefitEligibility Requirement—Determination by the Teachers’ Retirement Board that the participant has a total and permanent disability.
CASH BALANCE BENEFIT PROGRAM
Benefit—The account balance at the date of disability. An annuity benefit is discontinued if the participant is re-employed before age 60 and performs service creditable under the program.
Form of Payment—Same as Normal Retirement.
Death Before RetirementEligibility Requirement—Deceased participant has an account balance.
Benefit—The account balance at the date of death payable to the designated beneficiary.
Form of Payment—Normal distribution is a lump-sum benefit. A participant’s beneficiary may elect to receive the benefit in the form of a period-certain annuity if the sum of the balance of credits to the participant’s employee and employer accounts equals or exceeds $3,500.
Death After RetirementEligibility Requirement—The deceased participant was receiving an annuity.
Benefit—According to the terms of the annuity elected by the participant.
Termination from the ProgramEligibility Requirement—More than five years has elapsed since the most recent termination benefit, if any, has been paid.
Benefit and Form of Payment—Lump-sum distribution of the account balance as of the date of distribution. The benefit is payable six months from the termination of creditable service.
Changes in Cash Balance Benefit Program ProvisionsThere have been no program amendments that would affect an actuarial valuation of the Cash Balance Benefit Program since the last CalSTRS annual financial report was issued. All program provisions were considered in the completion of the June 30, 2013 actuarial valuation.

174 CALSTRS COMPREHENSIVE ANNUAL FINANCIAL REPORT 2014
All demographic assumptions used in the actuarial valuation were adopted by the Teachers’ Retirement Board when the experience study was adopted on February 2, 2012. The following are the assumptions adopted by the Teachers’ Retirement Board for this program.
Duration
Male Female
1 13.0% 1 12.0%
2 9.0 2 8.5
3 6.4 3 6.4
4 4.6 4 4.6
5 3.9 5 3.9
10 1.8 10 1.8
15 0.9 15 0.9
20 0.5 20 0.5
25 0.3 25 0.3
30 0.2 30 0.2
35 — 35 —
40 — 40 —
Table 3 Probabilities of Withdrawal from Active Service Before Age and Service Retirement for Sample Ages
Male Female
Age
2011 CalSTRS Retired–M
2011 CalSTRS Retired–F
50 0.114% 0.073%
55 0.164 0.118
60 0.300 0.254
65 0.596 0.468
70 1.095 0.864
75 1.886 1.451
80 3.772 2.759
85 7.619 5.596
90 14.212 11.702
95 22.860 17.780
Table 1 Post-Retirement Mortality Table for Sample Ages
Under 30 years 30 or more years
Age Male Female Male Female
55 2.7% 4.5% 8.0% 9.0%
60 6.3 9.0 27.0 31.0
65 13.5 14.4 32.5 37.5
70 10.8 13.5 30.0 35.0
75 100.0 100.0 100.0 100.0
1Probabilities of retirement are adjusted for members with service between 25 and 30 years.
Table 2 Probabilities of Retirement for Sample Ages1
CASH BALANCE BENEFIT PROGRAM

175ACTUARIAL
Entry Ages
Duration Under 25 25–29 30–34 35–39 40–44 45+
1 5.6% 5.3% 5.1% 4.8% 4.8% 3.5%
5 5.5 4.8 4.5 3.8 3.8 2.6
10 3.2 3.0 2.7 2.3 2.2 1.6
20 1.3 1.1 1.1 0.8 0.8 0.6
30 0.9 0.7 0.6 0.5 — —
40 0.8 0.6 — — — —
Table 4 Assumption for Pay Increases Due to Promotions and Longevity for Sample Ages (exclusive of the assumed general wage increase, which includes inflation)
Male
Age
<70 2% at age 40 and under, graded to 3.2% at age 70
>70 RP 2000 male white collar +7 projected to 2025 at age 70 smoothed to +1 age 85 (select rates in first three years, regardless of age)
Female
Age
<70 1.5% at age 40 and less graded to 2.25% at age 70
>70 RP 2000 female white collar +6 projected to 2025 at age 70 smoothed to +2 at age 80 (select rates in first three years, regardless of age)
1Future disabled members are valued with a two-year age setback.
Table 7 Termination from Disability Due to Death¹
Retired Members1
Male 2011 CalSTRS Retired-M
Female 2011 CalSTRS Retired-F
Active Members
Male 2011 CalSTRS Retired-M (-2 years)
Female 2011 CalSTRS Retired-F (-2 years)
Beneficiaries1
Male 2011 CalSTRS Beneficiary-M
Female 2011 CalSTRS Beneficiary-F
Table 6 Mortality Assumptions
Consumer Price Inflation 3.00%
Investment Yield 7.00
Wage Inflation 3.75
Interest on Member Accounts 7.00
Table 5 Economic Assumptions
CASH BALANCE BENEFIT PROGRAM
1Future retirees and beneficiaries are valued with a 2-year age setback.

176 CALSTRS COMPREHENSIVE ANNUAL FINANCIAL REPORT 2014
Coverage A
Male 25 0.018%
30 0.027
40 0.072
50 0.144
55 0.189
Female 25 0.018%
30 0.027
40 0.081
50 0.198
55 0.252
Coverage B
Male 25 0.010
30 0.020
35 0.030
40 0.060
45 0.100
50 0.140
55 0.245
Female 25 0.020
30 0.020
35 0.040
40 0.070
45 0.110
50 0.185
55 0.300
Table 8 Disability Rates—Coverage B (sample ages)
Active Members
Date (as of June 30)
Number of Participating Employers
Number Annual Payroll Annual Average Pay% Increase In Average Pay
2004 28 9,114 $96,199,000 $10,555 16.9%
2005 28 9,385 106,951,000 11,396 8.0
2006 30 9,869 122,316,000 12,394 8.8
2007 30 10,579 144,516,000 13,661 10.2
2008 33 11,627 181,104,000 15,576 14.0
2009 33 11,332 182,871,332 16,138 3.6
2010 33 10,378 163,248,119 15,730 (2.5)
2011 33 9,923 158,501,388 15,973 1.5
2012 33 9,273 151,284,621 16,315 2.1
2013 31 9,129 151,281,260 16,572 1.6
Table 9 Schedule of Active Participant Valuation Data
CASH BALANCE BENEFIT PROGRAM

177ACTUARIAL
Added to Rolls* Removed from Rolls Rolls–End of Year
Date (as of June 30)
Number Annual Allowances
Number Annual Allowances
Number Annual Allowances
% Increase in Annual Allowances
Average Annual Allowances
2005 4 $9,700 1 $803 6 $13,716 184.6% $2,286
2006 5 10,708 0 0 11 24,423 78.1% 2,220
2007 5 10,715 0 0 16 35,139 43.9% 2,196
2008 7 21,650 0 0 23 56,788 61.6% 2,469
2009 12 29,184 2 4,104 33 81,935 44.3% 2,483
2010 17 51,207 5 23,079 45 110,061 34.3% 2,446
2011¹ 24 66,664 2 6,899 67 169,827 54.3% 2,535
2012² 42 139,297 5 18,110 104 290,014 70.8% 2,789
2013 30 132,912 8 26,578 126 397,126 36.9% 3,152
2014 42 212,087 10 43,746 158 564,696 42.2% 3,574
*The Cash Balance Benefit Program was established July 1, 1996. As of June 30, 2003, all participants who had retired or became disabled had elected a lump-sum distribution.1Revised Annual Allowance figures in 2013.
²Revised Counts and Annual Allowances figures in 2013.
Table 10 Schedule of Retired Participants and Beneficiaries Added to and Removed from Annuity Rolls
Aggregate Accrued Liabilities For (in millions) Funding of Liabilities
Valuation Date (as of June 30)
(1) Active Member Contributions on Deposit
(2) Future Benefit to Benefit Recipients
(3) Service Already Rendered by Active Members (Financed by Employer)
Actuarial Value of Assets
(1) (2) (3)
2004 41,972,042 31,000 0 42,003,000 100.0% 100.0% —
2005 51,728,731 52,000 0 53,918,000 100.0 100.0 —
2006 62,749,487 140,000 0 68,797,000 100.0 100.0 —
2007 79,691,000 191,000 0 93,182,000 100.0 100.0 —
2008 97,802,000 229,000 0 98,892,000 100.0 100.0
2009 114,338,000 354,000 0 91,793,000 80.2 — —
2010 129,065,000 509,000 0 114,418,000 88.7 — —
2011 143,695,000 767,000 0 151,248,000 100.0 100.0 —
2012 156,600,000 1,386,000 0 158,020,000 100.0 100.0 —
2013 174,171,000 1,952,000 0 188,551,000 100.0 100.0 —
Table 11 Solvency Test
CASH BALANCE BENEFIT PROGRAM

178 CALSTRS COMPREHENSIVE ANNUAL FINANCIAL REPORT 2014
Actuarial Valuation as of June 30
2013 (2012)
2012 (2011)
Actuarial Obligation at June 30: $157,986 $144,462
Expected Changes:
Contributions 13,425 11,846
Benefits Paid (5,021) (4,742)
Expected Earnings/Credits 11,353 10,361
Expected Actuarial Obligation at June 30: 177,743 161,927
Expected Actuarial Value of Assets at June 30: 177,780 169,188
Expected UAO at June 30 (37) (7,261)
Actuarial (Gains) or Losses
(Gain) on Actuarial Obligation (7,164) (3,941)
(Gain) on Assets (10,771) 11,168
Total Actuarial (Gains) & Losses (17,935) 7,227
Additional Earnings and Annuity Credits
Additional Earnings Credit 5,483 0
Additional Annuity Credit 61 0
Total Additional Earnings and Annuity Credits 5,544 0
Unfunded Actuarial Obligation (Surplus) at June 30 (12,428) (34)
Funded Ratio 107% 100%
Table 12 Analysis of Financial Experience (gains and losses in unfunded actuarial obligation resulting from differences between assumed and actual experience) (dollars in thousands)
CASH BALANCE BENEFIT PROGRAM
Table 13 Schedule of Funding Progress (Dollars in Millions)
Actuarial Valuation Date as of June 30
Actuarial Value of Assets
(a)
Actuarial Accrued Liability (AAL)
(b)
Unfunded AAL (Funding Excess)
(UAAL) (b-a)
Funded Ratio (a/b)
Covered Payroll ( c)
UAAL as a % of Covered Payroll
((b-a)/c)
2014 (1) (1) (1) (1) (1) (1)
2013 $189 $176 $(13) 107% $151 (9%)
2012 158 158 0 100% 151 0%
2011 151 144 (7) 105% 158 (4%)
2010 114 130 16 88% 163 10%
2009 92 115 23 80% 182 13%
2008 99 98 (1) 101% 181 (1%)
2007 93 80 (13) 117% 145 (9%)
2006 69 63 (6) 109% 122 (5%)
2005 54 52 (2) 104% 107 (2%)
Note: Information of actuarially determined and actual contributions for the State Teachers' Retirement Plan is provided in the Financial section, Schedule III, Contributions of Employer and Nonemployer Contributing Entity table.
¹Actuarial Valuation as of June 30, 2014 are expected to be available by April 2015.

179ACTUARIAL
GASB 43 REPORTING FOR THE MEDICARE PREMIUM PAYMENT PROGRAM
ctrj0238ver2 - 1 20 0003 STR 12 / 20.003.STR.50.2013 / MCO/NJC/nlo
1301 Fifth Avenue Suite 3800 Seattle, WA 98101-2605 USA
Tel +1 206 624 7940 Fax +1 206 623 3485
milliman.com
Offices in Principal Cities Worldwide
November 24, 2014
Teachers’ Retirement Board California State Teachers’ Retirement System
Re: GASB 43 Reporting for the Medicare Premium Payment Program
Dear Members of the Board:
The basic financial goal of the Medicare Premium Payment (MPP) Program of the California State Teachers' Retirement System (CalSTRS) is to maintain sufficient resources to fully fund the obligations. Actuarial valuations used for GASB 43 reporting are performed every two years and measure the progress toward this goal, as well as test the adequacy of the contribution rates. The most recent valuation was as of June 30, 2012.
The MPP Program is essentially funded on a pay-as-you-go basis with a portion of contributions to the DB Program diverted to the Teachers’ Health Benefit Fund to make MPP Program payments. As of June 30, 2012, $424 million of future employer contributions to the DB Program have been allocated to pay the MPPP benefits; however, this amount is not included as an asset for GASB 43 reporting. This gives the appearance that the MPP Program is significantly underfunded in the GASB 43 results. However, based on the commitment to transfer a portion of future contributions from the DB Program to fund the MPP Program, it is our opinion that the MPP Program continues in sound financial condition as of June 30, 2012.
The June 30, 2012 valuation results are based on the membership data and the asset information provided by CalSTRS. In our examination of these data, we have found them to be reasonably consistent and comparable with data used for other purposes, although we have not audited the data at the source. Since the valuation results are dependent on the integrity of the data supplied, the results can be expected to differ if the underlying data is incomplete or missing. It should be noted that if any data or other information is found to be materially inaccurate or incomplete, our calculations will need to be revised.
Milliman did not prepare the summaries or schedules shown the Financial and Actuarial Sections. However, the actuarial information contained in Schedule I, II, III and V of the Financial Section and in this Actuarial Section was derived from our June 30, 2012 actuarial valuation report.
The valuation is based on our understanding of the current benefit provisions of the MPP Program and the actuarial assumptions which were last reviewed and adopted by the Board at the April 2013 meeting.
We believe the actuarial assumptions and methods are internally consistent, reasonable and meet the parameters of Governmental Accounting Standards Board Statement No. 43 for fulfilling financial accounting requirements. It should be noted that we relied on advice from Milliman’s health actuaries on our recommendations of assumptions specific to health costs. Nevertheless, the emerging costs will vary from those presented in our report to the extent that actual experience differs from that projected by the actuarial assumptions. Future actuarial measurements may differ significantly from the current measurements as presented in the

180 CALSTRS COMPREHENSIVE ANNUAL FINANCIAL REPORT 2014
GASB 43 REPORTING FOR THE MEDICARE PREMIUM PAYMENT PROGRAM
Teachers' Retirement BoardNovember 22, 2013
Page 2
ctrj0238ver2 - 2 20 0003 STR 12 / 20.003.STR.50.2013 / MCO/NJC/nlo
valuation report due to many factors. Due to the limited scope of our assignment, we did not perform an analysis of the potential range of future measurements.
Our valuation report and this letter have been prepared exclusively for CalSTRS for a specific and limited purpose. Milliman does not intend to benefit and assumes no duty or liability to other parties who receive this work. It is a complex, technical analysis that assumes a high level of knowledge concerning CalSTRS operations, and uses CalSTRS data, which Milliman has not audited. No third party recipient of Milliman’s work product should rely upon Milliman’s work product. Such recipients should engage qualified professionals for advice appropriate to their own specific needs.
The consultants who worked on these assignments are pension actuaries. Milliman’s advice is not intended to be a substitute for qualified legal or accounting counsel. The signing actuaries are independent of the plan sponsor. We are not aware of any relationship that would impair the objectivity of our work.
In conclusion, the results presented in this report satisfy GASB 43 reporting purposes. Based on the current actuarial assumptions, the current assets of the MPP Program fund 0.1% of the accrued liabilities. It should be noted that these calculations do not include $601 million of future employer contributions to the DB Program that has been allocated to pay the MPPP benefits.
We certify that the June 30, 2012 valuation was performed in accordance with the Actuarial Standards Board (ASB) standards of practice and by qualified actuaries. We are members of the American Academy of Actuaries and have experience in performing valuations for public retirement systems.
Respectfully submitted,
Mark C. Olleman, FSA, EA, MAAA Nick J. Collier, ASA, EA, MAAA Principal and Consulting Actuary Principal and Consulting Actuary

181ACTUARIAL
Summary of Actuarial Assumptions and MethodsCalSTRS, through its consulting actuary, will perform an experience study at least every four years to determine appropriate demographic and economic assumptions. These assumptions are then applied every two years when the consulting actuary produces GASB 43 reporting information for the CalSTRS Medicare Premium Payment Program. The GASB 43 reporting information was completed as of June 30, 2012, and adopted by the Teachers’ Retirement Board April 11, 2013. The following tables and summary were prepared by CalSTRS staff.
The Medicare Premium Payment Program was established January 1, 2001. Assumptions specific to the Medicare Premium Payment Program were adopted by the Teachers’ Retirement Board on June 5, 2009. The economic and demographic assumptions were based on those adopted for the Defined Benefit Program by the Teachers’ Retirement Board on February 2, 2012. The economic and demographic assumptions were used for GASB 43 reporting information. The Defined Benefit Program and the Medicare Premium Payment Program share the same population, so it is reasonable to use most of the same assumptions for both programs. Following are the assumptions adopted by the Teachers’ Retirement Board for GASB 43 reporting:
• GASB 43 discount rate is 4.00 percent. • Method used to value plan assets for GASB 43 reporting
purposes: market value of assets held in the Health Benefit Trust Fund.
• Assumption for the price increase is 3.00 percent. • The actuarial cost method used for GASB 43 reporting
purposes is entry age normal.
Discussion of recent changes in:The nature of the program—The Medicare Premium Payment Program was established January 1, 2001. All provisions of the program as of June 2012 were considered when producing GASB 43 reporting information.
Actuarial Assumptions—There have been several changes to the assumptions since the June 30, 2012 valuation. The most significant changes were the reductions in the probabilities of enrollment in the Medicare Premium Payment Program and the reduced investment return assumption. The following assumptions were used to complete the valuation for this program.
Actuarial MethodsActuarial Cost Method Level Dollar Entry Age Normal
Asset Valuation Method Fair Market Value in the Health Benefit Trust Fund
The actuarial methods used for GASB 43 reporting purposes as of June 30, 2012, result in an unfunded actuarial accrued liability of $581.7 million.
CalSTRS contracts for many actuarial services. The current contractor, Milliman, has been CalSTRS actuary since the program’s inception.
There are no other specific assumptions that have a material impact on GASB 43 reporting information.
Independent Actuarial ReviewActuarial services for CalSTRS are provided under contract by a qualified independent actuarial firm, with additional review provided by the actuarial staff.
Through the competitive bid process, the work of a prior actuary will be verified in a subsequent actuarial valuation performed by a new contract actuary. Should the same actuarial firm continue for a period of 10 years, provision is made for an independent review of that firm's work through an actuarial audit completed by another firm. These audit services are acquired using the competitive bid process.
An audit of the 2007 Actuarial Experience Analysis of the Medicare Premium Payment Program was performed by the firm, The Segal Company. The result of the audit was reported to the Teachers’ Retirement Board on September 8, 2011.
Summary of Medicare Premium Payment Program ProvisionsThe following tables and summary were prepared by CalSTRS staff. All information is considered for GASB 43 reporting purposes as of June 30, 2012.
MEDICARE PREMIUM PAYMENT PROGRAM

182 CALSTRS COMPREHENSIVE ANNUAL FINANCIAL REPORT 2014
MembershipEligibility requirement—Part A
Member—satisfies either:
1) Retired or disabled prior to January 1, 2001; hired prior to April 1, 1986; age 65 or above; enrolled in Medicare Part A and Part B; and not eligible for Part A without premium payment.
- or - 2) Meet all above requirements, except retired or
disabled before July 1, 2007; district completed a Medicare Division election prior to retirement; and active member less than 58 years of age at the time of the election.
Spouse eligibility—Spouses of members are not eligible to participate in the program.
Eligibility requirement—Part BOnly those currently enrolled are eligible.
Benefits PaidPart A – Part A premium ($451 per month in 2012)
Part B – Part B penalty. Based on Part B premium ($99.90 per month in 2012). Small group of high earners will have higher premiums, up to $319.70 in 2012.
Changes in the Medicare Premium Payment Program ProvisionsThe following amendments were considered for June 30, 2012 GASB 43 reporting:
Effective April 5, 2007 • Medicare Premium Payment Program was extended for a
five-year period to include members retiring or becoming disabled prior to July 1, 2012.
MEDICARE PREMIUM PAYMENT PROGRAM

183ACTUARIAL
Demographic assumptions used for GASB 43 reporting were adopted by the Teachers’ Retirement Board when the experience study was adopted on February 2, 2012. Following are assumptions adopted by the Teachers' Retirement Board for this program.
NOT APPLICABLE
Male Female
Age
2011 CalSTRS Retired–M
2011 CalSTRS Retired–F
50 0.114% 0.073%
55 0.164 0.118
60 0.300 0.254
65 0.596 0.468
70 1.095 0.864
75 1.886 1.451
80 3.772 2.759
85 7.619 5.596
90 14.212 11.702
95 22.860 17.780
Table 1 Post-Retirement Mortality Table for Sample Ages
NOT APPLICABLE
Table 2 Probabilities of Retirement for Sample Ages
Table 3 Probabilities of Withdrawal from Active Service Before Age and Service Retirement for Sample Age
MEDICARE PREMIUM PAYMENT PROGRAM

184 CALSTRS COMPREHENSIVE ANNUAL FINANCIAL REPORT 2014
Investment Yield
GASB Reporting 4.00%
Medical Inflation
Part A Premiums 3.50%
Part B Premiums 4.50%
Price Inflation 3.00%
Table 5 Economic Assumptions Table 6 Mortality Assumptions
Retired Members1
Male 2011 CalSTRS Retired-M
Female 2011 CalSTRS Retired-F
Active Members
Male N/A
Female N/A
Beneficiaries1
Male 2011 CalSTRS Beneficiary-M
Female 2011 CalSTRS Beneficiary-F
1Future retirees and beneficiaries are valued with a two-year age setback.
NOT APPLICABLE
Table 4 Probability of Refund
MEDICARE PREMIUM PAYMENT PROGRAM

185ACTUARIAL
Table 6 Mortality Assumptions
MEDICARE PREMIUM PAYMENT PROGRAM
NOT APPLICABLE
Table 8 Service Retirement (sample ages)
NOT APPLICABLE
Table 9 Disability Rates (sample ages)
Male
Age
<70 2% at age 40 and under, graded to 3.2% at age 70
>70 RP 2000 male white collar +7 projected to 2025 at age 70 smoothed to +1 age 85 (select rates in first three years, regardless of age)
Female
Age
<70 1.5% at age 40 and less graded to 2.25% at age 70
>70 RP 2000 female white collar +6 projected to 2025 at age 70 smoothed to +2 at age 80 (select rates in first three years, regardless of age)
1Future disabled members are valued with a two-year age setback.
Table 7 Termination from Disability Due to Death¹
MEDICARE PREMIUM PAYMENT PROGRAM

186 CALSTRS COMPREHENSIVE ANNUAL FINANCIAL REPORT 2014
Added to Rolls1 Removed from Rolls Rolls-End of Year
Date (as of June 30)
Number Annual Allowances2
Number Annual Allowances2
Number Annual Allowances2
% Increase in Annual Allowances
Average Annual Allowances
2005 319 $905 195 $514 6,120 $25,977 7.7% $4,245
2006 405 1,193 219 613 6,188 27,326 5.2% 4,416
2007 391 1,274 215 630 6,268 29,618 8.4% 4,725
2008 389 1,296 213 608 6,300 31,328 5.8% 4,973
2009 399 1,489 208 604 6,431 35,8143 14.3% 5,569
2010 347 1,215 220 660 6,475 34,015 -5.0% 5,253
2011 537 2,202 231 695 6,709 34,677 1.9% 5,169
2012 359 1,177 218 634 6,742 33,708 -2.8% 5,000
2013* 305 1,009 212 641 6,770 33,663 -0.1% 4,972
2014 235 751 259 703 6,684 32,047 -4.8% 4,795
1The Medicare Premium Payment Program was established July 1, 2001. 2Dollars in thousands.3This does not include the $8.04 million credit adjustments and deletions. If including the credit adjustments and deletions, the Total Annual Benefits would be $28.3 million, the percentage increase in annual benefits would be -9.6% and the average annual benefit would be $4,402.
*Numbers revised in 2014.
MEDICARE PREMIUM PAYMENT PROGRAM
Assumption Best Estimate
Male Female
% of Actives and Under 65 Retirees Enrolling (Retired On or After 2001)
2.80% 2.80%
% of Under 65 Retirees Enrolling (Retired Before 2001)
4.50 4.50
% of Over 65 Retirees Enrolling (For Those Not Currently Enrolled) at Age:
65 1.20 1.20
66 0.12 0.12
67 0.10 0.10
68 0.08 0.08
69 0.06 0.06
70-84 0.02 0.02
85 & above 0.00 0.00
Table 11 Schedule of Retired Members Added to and Removed from Medicare Part A Premium Rolls
Table 10 Schedule of Medicare Part A Enrollment Rates
MEDICARE PREMIUM PAYMENT PROGRAM

187ACTUARIAL
Aggregate Accrued Liabilities for (in millions) Funding of Liabilities
Valuation Date (as of June 30)
(1) Active Member Contributions on Deposit
(2) Future Benefit to Benefit Recipients
(3) Service Already Rendered by Active Members
Actuarial Value of Assets
(1) (2) (3)
2006 $0 $796.5 $0 $2.7 100% 0.3% 0%
2008 0 976.3 0 4.2 100 0.4 0
2010 0 905.0 0 0.6 100 0.1 0
2012 0 582.1 0 0.4 100 0.1 0
1GASB 43 reporting information was determined for the first time as of June 30, 2006.
GASB 43 reporting as of June 30
2012 (2011)
2010 (2009)
Actuarial Obligation at June 30:
Expected Changes:
Eligibility Extended not calculated not calculated
Benefits Paid ($35.0) ($36.0)
Interest not calculated not calculated
Expected Actuarial Obligation at June 30: not calculated not calculated
Expected Actuarial Value of Assets at June 30: not calculated not calculated
Expected UAO at June 30 not calculated not calculated
Actuarial (Gains) or Losses
(Gain) on Medical Trend Assumption not calculated not calculated
(Gain) on Premium/Penalty not calculated not calculated
(Gain) on Part B Premium for higher earners not calculated not calculated
(Gain) other sources not calculated not calculated
Total Actuarial Gains & Losses not calculated not calculated
Unfunded Actuarial Obligation (Surplus) at June 30 $581.7 $904.4
Funded Ratio 0.1% 0.1%
MEDICARE PREMIUM PAYMENT PROGRAM
Table 12 Solvency Test¹
Table 13 Analysis of Financial Experience (gains and losses in unfunded actuarial obligation resulting from differences between assumed and actual experience) (dollars in millions)
MEDICARE PREMIUM PAYMENT PROGRAM

188 CALSTRS COMPREHENSIVE ANNUAL FINANCIAL REPORT 2014

191 Statistical
193 State Teachers' Retirement Plan Schedules
195 Defined Benefit Program Schedules
203 Defined Benefit and Defined Benefit Supplement Program Participating Employers
207 Defined Benefit Supplement Program Schedules
210 Cash Balance Benefit Program Schedules
212 Cash Balance Benefit Program Participating Employers
213 Programs Administered or Overseen by the Retirement System
215 Medicare Premium Payment Program
In fiscal year 2013–14, CalSTRS members, on average, retired at age 62 after about 25 years of service with a pension replacing about 54 percent of their highest salary.
STATISTICAL

190 CALSTRS COMPREHENSIVE ANNUAL FINANCIAL REPORT 2014

191STATISTICAL
STATISTICAL
The Statistical section presents additional detailed information that assists users in using the basic financial statements, notes to basic financial statements and required supplementary information to assess the economic condition of CalSTRS. The section provides financial trend information for the State Teachers’ Retirement Plan (STRP), Pension2 and the Medicare Premium Payment program, as well as operating information for the Defined Benefit, Defined Benefit Supplement, Cash Balance Benefit, Pension2 and Medicare Premium Payment programs. Previously financial trend information for the STRP was presented by program—Defined Benefit, Defined Benefit Supplement and Cash Balance Benefit. Financial trend information for those programs has been consolidated and presented as the STRP to be consistent with the basic financial statements. Operating information for STRP programs continues to be presented separately because consolidation would not provide meaningful information due to the unique characteristics of those programs. The Teachers’ Deferred Compensation Fund is deemed immaterial and is not presented.
The financial trend schedules assist users in understanding and assessing how the system’s financial position has changed over time and include:
• Changes in Fiduciary Net Position • Benefit and Refund Deductions From Net Position by Type
The operating information schedules provide data about the system’s operations and resources to assist users in understanding CalSTRS benefits and services, and include:
• Members and Benefit Recipient Statistics • Participating Employers Statistics
The information in this section was derived from the CalSTRS pension administration system, START, except where noted.
Notes:
Supplemental statistical tables are available on request by calling CalSTRS at 800-228-5453.
STATISTICAL

192 CALSTRS COMPREHENSIVE ANNUAL FINANCIAL REPORT 2014

193STATISTICAL
Fiscal Year Ending June 30
2014 2013 2012 2011 2010 2009 2008 2007 2006 2005
Additions
Member Contributions
$2,263.6 $2,336.8 $2,279.9 $2,355.9 $2,331.5 $2,500.6 $2,511.8 $2,334.9 $2,230.8 $2,326.5
Employer Contributions
2,272.2 2,283.3 2,238.0 2,310.2 2,286.3 2,464.2 2,453.3 2,285.7 2,203.6 2,104.7
State of California/Federal Government²
1,383.5 1,328.3 1,302.5 1,193.3 1,221.6 1,140.4 1,629.6 1,084.4 1,018.7 1,218.6
Investment Income
30,401.9 20,682.4 1,071.3 30,030.3 15,089.3 (40,357.7) (9,655.1) 29,839.9 16,077.7 14,137.7
Other Income 2.1 1.2 4.1 6.5 7.7 7.5 213.1 0.5 0.1 1.4
Total Additions
$36,323.3 $26,631.9 $6,895.8 $35,896.2 $20,936.4 $(34,245.0) $(2,847.3) $35,545.4 $21,530.9 $19,788.9
Deductions
Benefit Payments to Members3
$11,725.3 $11,133.3 $10,442.5 $9,854.5 $9,085.3 $8,256.2 $7,591.7 $6,937.6 $6,433.7 $5,912.6
Refunds of Member Contributions
107.6 105.0 108.1 116.1 100.2 105.8 101.8 106.2 97.4 88.0
Purchasing Power Benefits
202.2 221.5 234.6 237.6 272.6 348.1 229.8 230.3 215.3 221.3
Administration Expenses
154.2 136.9 138.4 110.4 140.2 113.2 109.4 105.9 95.6 94.6
Other Expense 8.8 4.4 0.0 0.0 0.0 0.0 (0.2) 0.0 0.0 10.1
Total Deductions
$12,198.1 $11,601.1 $10,923.6 $10,318.6 $9,598.3 $8,823.2 $8,032.4 $7,380.0 $6,842.1 $6,326.6
Change in Fiduciary Net Position
$24,125.2 $15,030.8 $(4,027.7) $25,577.6 $11,338.1 $(43,068.2) $(10,879.6) $28,165.4 $14,688.8 $13,462.3
There may be immaterial rounding differences between the figures presented in this table and in the Statement of Changes in Fiduciary Net Position. 1Includes the Replacement Benefit Program beginning in 2009, the year the Replacement Benefit Program began being reported as part of the State Teachers' Retirement Plan.2Includes Elder Full Funding, SBMA contributions, and school lands revenue. 3Includes member elected administrative transfers to purchase service credit in the Defined Benefit program.
Table 1 Changes in Fiduciary Net Position¹
(dollars in millions)
STATE TEACHERS' RETIREMENT PLAN

194 CALSTRS COMPREHENSIVE ANNUAL FINANCIAL REPORT 2014
Fiscal Year Ending June 30
2014 2013 2012 2011 2010 2009 2008 2007 2006 2005
Type of Benefit
Age & Service Benefits
Retired Members(2) $10,821.1 $10,280.6 $9,703.8 $9,167.4 $8,356.8 $7,609.0 $6,965.1 $6,382.8 $5,912.9 $5,419.3
Survivors 547.3 527.9 502.8 464.8 503.9 443.6 426.6 376.9 351.9 329.9
Death 57.0 73.6 31.0 35.3 42.8 37.0 39.3 29.2 29.6 36.3
Purchasing Power Benefits
202.2 221.5 234.6 237.6 272.6 348.1 229.8 230.3 215.3 221.3
Disability Benefits
Retired Members 299.9 251.2 204.9 187.1 181.8 166.5 160.8 148.7 139.2 127.1
Survivors 0.0 0.0 0.0 0.0 0.0 0.0 0.0 0.0 0.0 0.0
Total Benefits $11,927.5 $11,354.8 $10,677.1 $10,092.2 $9,357.9 $8,604.2 $7,821.6 $7,167.9 $6,649.0 $6,133.9
Type of Refund
Separation $107.6 $105.0 $108.1 $116.1 $100.2 $105.8 $101.8 $106.2 $97.5 $88.0
Total Refunds $107.6 $105.0 $108.1 $116.1 $100.2 $105.8 $101.8 $106.2 $97.5 $88.0
There may be immaterial rounding differences between the figures presented in this table and in the Statement of Changes in Fiduciary Net Position. 1Includes the Replacement Benefit Program beginning in 2009.2Benefit payments include member elected administrative transfers to purchase service credit in the Defined Benefit Program.
Table 2 Benefit and Refund Deductions from Fiduciary Net Position by Type1
(dollars in millions)
DEFINED BENEFIT PROGRAMSTATE TEACHERS' RETIREMENT PLAN

195STATISTICAL
Fiscal Year Ending June 30
CountAverage
Earnable Salary1 Average AgeAverage
Service CreditAverage Service
Projected to Age 60
2005 450,282 55,900 44.5 10.7 26.2
2006 453,365 57,698 44.6 10.8 26.1
2007 455,693 61,097 44.7 10.8 26.1
2008 461,378 63,281 44.7 10.8 26.2
2009 459,009 64,044 44.8 11.0 26.2
2010 441,544 64,156 45.1 11.3 26.3
2011 429,600 64,069 45.3 11.7 26.3
2012 421,499 64,743 45.5 11.9 26.5
2013 416,643 65,571 45.6 12.2 26.6
2014 420,887 67,276 45.6 12.3 26.6
1Average salary that would be paid if members worked full-time basis.
Table 1 Active Member Characteristics
Monthly Unmodified Allowance2 Count
Average Age at Retirement3
Average Service Credit3
Average Final Compensation3
Average Allowance Payable3
Less than $500 474 62.7 5.507 $3,536 $314
500–1000 697 62.4 9.193 4,311 730
1000–1500 651 61.9 12.596 5,223 1,225
1500–2000 719 62.5 15.183 5,796 1,693
2000–2500 836 62.3 17.880 6,199 2,180
2500–3000 881 62.9 19.939 6,504 2,652
3000–3500 876 62.9 22.508 6,704 3,123
3500–4000 770 62.8 25.032 6,929 3,600
4000–4500 798 63.2 26.914 7,077 4,089
4500–5000 723 63.1 28.966 7,249 4,564
5000–5500 670 62.8 30.670 7,465 5,061
5500–6000 568 62.5 32.576 7,489 5,527
6000 & Greater 2,073 62.8 35.990 8,788 7,292
Total 10,736 62.7 23.819 $6,774 $3,777
1Does not include formerly disabled members.2As of the June 30, 2004 population report the longevity bonus is included in the unmodified allowance.3Overall averages.
Table 2 Members Retired for Service During Fiscal Year 2013–14, Classified by Unmodified Allowance¹
DEFINED BENEFIT PROGRAM

196 CALSTRS COMPREHENSIVE ANNUAL FINANCIAL REPORT 2014
Option types
Age Total Unmodified 2 3 4 5 6 7 8 9
Under 55 19 12 3 1 3
55 427 281 102 21 4 19
56 286 184 60 28 2 12
57 353 220 76 35 1 21
58 408 231 82 54 2 39
59 550 302 108 67 6 67
60 970 495 191 148 8 128
61 1,406 690 3 297 237 20 159
62 1,367 712 8 294 191 21 141
63 1,305 739 12 1 243 166 22 122
64 802 479 7 1 138 95 10 72
65 736 424 6 1 133 88 20 64
66 587 350 7 1 99 77 4 49
67 442 263 4 84 51 6 34
68 262 161 2 45 26 5 23
69 202 134 3 29 20 5 11
70 183 122 3 1 22 19 3 13
71 125 92 1 14 11 7
72 79 44 1 16 8 3 7
73 64 49 1 7 4 1 2
74 46 39 2 2 2 1
75 and over 117 69 2 1 15 20 4 6
Age Unknown -
Total 10,736 6,092 62 5 1 2,060 1,369 147 1,000
% of Total 100% 57% 1% 0% 0% 0% 19% 13% 1% 9%
1Does not include formerly disabled members. 2Option Elected:
Option 2 - Beneficiary receives 100% of member’s modified allowance.
Option 3 - Beneficiary receives 50% of member’s modified allowance.
Option 4 - Beneficiary receives 2/3 of member’s modified allowance.
Option 5 - Survivors receive 50% of member’s modified allowance, upon death of either member of beneficiary.
Option 6 - Beneficiary receives 100% of member’s modified allowance. If beneficiary pre-deceases the member the allowance pops up to the unmodified amount.
Option 7 - Beneficiary receives 50% of member’s modified allowance. If beneficiary pre-deceases the member the allowance pops up to the unmodified amount.
Option 8 - Compound option that allows the member to provide for more than one beneficiary.
Option 9 - Beneficiary receives 75% of member’s modified allowance. If beneficiary pre-deceases the member the allowance pops up to the unmodified amount.
Table 3 Members Retired for Service During Fiscal Year 2013–14¹, Classifed by Age and Joint & Survivor Option Elected²
DEFINED BENEFIT PROGRAMDEFINED BENEFIT PROGRAM

197STATISTICAL
Fiscal Year Ending June 30
CountAverage Disability Allowance Payable
Average Service Credit
Average Final Compensation
Average Age at Disability
2005 538 2,488 14.016 5,103 53.5
2006 402 2,522 14.061 5,134 54.5
2007 501 2,579 13.959 5,281 54.7
2008 510 2,660 14.074 5,478 54.5
2009 511 2,728 13.934 5,567 53.8
2010 498 2,825 14.524 5,827 55.3
2011 504 2,784 14.297 5,781 55.0
2012 488 2,825 14.321 5,823 55.4
2013 571 2,788 14.800 5,742 54.9
2014 494 2,875 14.993 5,967 55.1
Fiscal Year Ending June 30
Service Retirement
Disability Benefits
Benefits for Survivors
Total Benefit Recipients
2005 176,008 7,571 17,662 201,241
2006 181,833 7,683 18,330 207,846
2007 188,659 7,915 19,067 215,641
2008 195,960 8,170 19,838 223,968
2009 203,649 8,380 20,588 232,617
2010 213,952 8,581 21,263 243,796
2011 222,222 8,813 22,006 253,041
2012 230,278 9,036 22,724 262,038
2013 236,487 9,374 23,413 269,274
2014 241,920 9,604 24,103 275,627
Table 4 Characteristics of Members Going on Disability
Table 5 Total Number of Benefit Recipients by Type of Benefit
DEFINED BENEFIT PROGRAM

198 CALSTRS COMPREHENSIVE ANNUAL FINANCIAL REPORT 2014
1Does not include formerly disabled members.2The Average unmodified allowance for this fiscal year includes the Longevity Bonus.
Table 6 Members Retired for Service Characteristics¹ by Year of Retirement
DEFINED BENEFIT PROGRAMDEFINED BENEFIT PROGRAM
Effective Date of Retirement by Service Credit
Number of Retirements
Average Service Credit
Average Unmodified Allowance
Average Final Compensation
Average Age at Retirement
7/1/2004 thru 6/30/20052
0–5 122 2.5 $268 — —
5–10 1,008 7.2 591 — —
10–15 897 12.6 1,170 — —
15–20 1,311 17.5 1,906 — —
20–25 1,286 22.3 2,579 — —
25–30 1,217 27.0 3,475 — —
30–35 3,208 32.5 4,847 — —
35–40 2,162 37.2 6,100 — —
40 & over 413 42.0 7,422 — —
Total 11,624 26.3 $3,744 $5,944 61.7
7/1/2005 thru 6/30/20062
0–5 115 2.4 $281 $5,724 61.2
5–10 980 7.3 607 4,056 61.7
10–15 919 12.5 1,197 4,756 61.2
15–20 1,235 17.6 1,935 5,387 61.2
20–25 1,198 22.2 2,631 5,758 61.3
25–30 1,143 27.0 3,678 6,423 61.9
30–35 2,843 32.5 4,982 6,685 60.4
35–40 2,091 37.2 6,279 7,024 61.2
40 & over 353 42.2 7,575 7,163 65.1
Total 10,877 26.0 $3,810 $6,079 61.2
7/1/2006 thru 6/30/20072
0–5 105 2.5 $253 $5,127 61.0
5–10 1,080 7.3 620 4,075 62.0
10–15 1,019 12.4 1,239 4,874 61.4
15–20 1,311 17.5 2,039 5,625 61.5
20–25 1,248 22.2 2,802 5,987 61.8
25–30 1,249 27.1 3,847 6,678 62.0
30–35 3,078 32.5 5,312 7,087 60.6
35–40 2,259 37.3 6,680 7,434 61.4
40 & over 413 42.2 8,151 7,830 65.0
Total 11,762 26.1 $4,059 $6,371 61.5

199STATISTICAL
1Does not include formerly disabled members.2The Average unmodified allowance for this fiscal year includes the Longevity Bonus.
Table 6 Members Retired for Service Characteristics¹ by Year of Retirement (continued)
DEFINED BENEFIT PROGRAM
Effective Date of Retirement by Service Credit
Number of Retirements
Average Service Credit
Average Unmodified Allowance
Average Final Compensation
Average Age at Retirement
7/1/2008 thru 6/30/20092
0–5 126 2.4 $291 $5,814 62.4
5–10 1,022 7.4 668 4,236 62.8
10–15 1,145 12.4 1,336 5,140 62.1
15–20 1,323 17.7 2,235 5,995 61.8
20–25 1,535 22.3 3,116 6,537 62.1
25–30 1,406 27.1 4,125 7,076 62.2
30–35 3,161 32.4 5,687 7,506 61.1
35–40 2,574 37.2 7,122 7,866 61.7
40 & over 461 42.2 8,594 8,316 64.9
Total 12,753 26.3 $4,396 $6,796 61.9
7/1/2007 thru 6/30/20082
0–5 129 2.6 $286 $5,393 61.5
5–10 1,038 7.3 643 4,213 62.2
10–15 1,093 12.4 1,307 5,090 61.6
15–20 1,324 17.7 2,148 5,822 61.6
20–25 1,463 22.2 2,902 6,203 61.7
25–30 1,408 27.0 4,000 6,921 62.1
30–35 3,203 32.5 5,526 7,315 60.9
35–40 2,443 37.3 6,908 7,685 61.4
40 & over 467 42.0 8,242 7,990 64.6
Total 12,568 26.3 $4,239 $6,612 61.6
7/1/2009 thru 6/30/20102
0–5 148 2.3 $289 $5,535 61.4
5–10 1,356 7.4 686 4,287 63.0
10–15 1,436 12.6 1,446 5,385 62.4
15–20 1,663 17.6 2,326 6,138 62.3
20–25 2,323 22.4 3,236 6,658 62.4
25–30 1,885 27.1 4,231 7,165 62.5
30–35 3,620 32.4 5,665 7,478 61.2
35–40 2,481 37.2 7,228 7,999 61.6
40 & over 581 42.3 8,759 8,409 65.4
Total 15,493 25.5 $4,256 $6,800 62.2

200 CALSTRS COMPREHENSIVE ANNUAL FINANCIAL REPORT 2014
1Does not include formerly disabled members.2The Average unmodified allowance for this fiscal year includes the Longevity Bonus.
Table 6 Members Retired for Service Characteristics¹ by Year of Retirement (continued)
DEFINED BENEFIT PROGRAMDEFINED BENEFIT PROGRAM
Effective Date of Retirement by Service Credit
Number of Retirements
Average Service Credit
Average Unmodified Allowance
Average Final Compensation
Average Age at Retirement
7/1/2010 thru 6/30/20112
0–5 194 2.401 $305 $6,182 62.0
5–10 1,388 7.301 663 4,187 62.9
10–15 1,506 12.508 1,487 5,491 62.7
15–20 1,571 17.475 2,320 6,191 62.2
20–25 2,005 22.433 3,278 6,729 62.5
25–30 1,834 27.053 4,237 7,186 62.4
30–35 2,874 32.412 5,693 7,508 61.3
35–40 2,068 37.241 7,313 8,091 61.8
40 & over 456 42.267 9,037 8,738 65.6
Total 13,896 24.534 $4,088 $6,763 62.3
7/1/2011 thru 6/30/2012²
0–5 167 2.441 $310 $6,013 63.0
5–10 1,497 7.306 676 4,224 63.2
10–15 1,659 12.521 1,437 5,315 62.7
15–20 1,743 17.425 2,316 6,122 62.7
20–25 1,962 22.535 3,350 6,788 62.6
25–30 1,878 27.097 4,318 7,212 62.8
30–35 2,547 32.504 5,750 7,550 61.4
35–40 1,770 37.203 7,364 8,093 61.9
40 & over 396 42.138 9,487 9,113 65.2
Total 13,619 23.710 $3,936 $6,670 62.5
7/1/2012 thru 6/30/2013²
0–5 132 2.527 $311 $6,092 62.8
5–10 1,017 7.246 710 4,540 63.1
10–15 1,298 12.573 1,521 5,528 63.1
15–20 1,678 17.421 2,392 6,272 63.0
20–25 1,760 22.589 3,367 6,802 62.8
25–30 1,817 27.222 4,319 7,169 62.7
30–35 2,150 32.509 5,700 7,528 61.6
35–40 1,522 37.206 7,329 8,038 61.8
40 & over 271 42.344 8,924 8,439 65.6
Total 11,645 24.085 $3,980 $6,769 62.6

201STATISTICAL
Fiscal Year Ending June 30
Average Age at Retirement
Average Years of Service Credit
Average Final Compensation
Average Current Allowance Payable
2005 60.8 26.1 $4,103 $2,617
2006 60.8 26.2 4,264 2,741
2007 60.8 26.3 4,437 2,878
2008 60.8 26.3 4,620 3,021
2009 60.8 26.4 4,798 3,164
2010 60.9 26.3 4,983 3,302
2011 61.0 26.3 5,138 3,417
2012 61.1 26.2 5,271 3,517
2013 61.1 26.1 5,385 3,609
2014 61.2 26.0 5,487 3,694
1Does not include formerly disabled members.
1Does not include formerly disabled members.2The Average unmodified allowance for this fiscal year includes the Longevity Bonus.
Effective Date of Retirement by Service Credit
Number of Retirements
Average Service Credit
Average Unmodified Allowance
Average Final Compensation
Average Age at Retirement
7/1/2013 thru 6/30/20142
0–5 144 2.230 $268 $5,994 62.9
5–10 950 7.416 721 4,463 63.2
10–15 1,176 12.645 1,533 5,553 63.1
15–20 1,604 17.432 2,425 6,286 63.2
20–25 1,593 22.411 3,334 6,743 62.9
25–30 1,845 27.167 4,443 7,367 63.0
30–35 1,814 32.332 5,607 7,532 61.6
35–40 1,374 37.179 7,295 7,973 61.9
40 & over 236 42.214 9,197 8,741 65.5
Total 10,736 23.819 $3,939 $6,774 62.7
Table 6 Members Retired for Service Characteristics¹ by Year of Retirement (continued)
Table 7 Members Retired for Service Characteristics¹
DEFINED BENEFIT PROGRAM

202 CALSTRS COMPREHENSIVE ANNUAL FINANCIAL REPORT 2014
Type of Benefit1 Option selected2
Monthly Unmodified Allowance4 Total 13 2 3 Unmodified 2 3 4 5 6 7 8 9
Less than $500 17,808 15,317 109 2,382 13,091 1,499 491 68 85 1,655 622 87 210
500–1000 26,249 22,501 660 3,088 17,733 2,190 1,183 120 107 2,828 1,484 105 499
1000–1500 27,069 22,529 1,020 3,520 15,990 2,732 1,525 217 158 3,335 2,341 102 669
1500–2000 28,558 23,596 1,619 3,343 15,927 2,584 1,196 469 185 3,737 3,447 130 883
2000–2500 28,658 23,205 2,263 3,190 14,981 2,409 1,031 400 211 4,339 4,107 176 1,004
2500–3000 24,599 20,171 1,959 2,469 12,354 1,868 650 301 129 4,305 3,816 167 1,009
3000–3500 20,279 17,144 1,338 1,797 9,900 1,313 415 251 71 3,888 3,238 192 1,011
3500–4000 15,741 14,210 423 1,108 7,547 934 292 172 60 3,056 2,700 139 841
4000–4500 14,308 13,385 127 796 6,659 789 234 102 39 2,792 2,693 184 816
4500–5000 13,707 12,970 48 689 6,188 721 216 69 30 2,961 2,531 187 804
5000–5500 13,485 12,970 21 494 5,941 675 178 66 20 2,998 2,537 195 875
5500–6000 11,857 11,462 9 386 5,121 583 153 60 17 2,713 2,157 189 864
6000 & Greater 33,309 32,460 8 841 12,623 2,039 337 141 44 8,834 5,718 801 2,772
Total 275,627 241,920 9,604 24,103 144,055 20,336 7,901 2,436 1,156 47,441 37,391 2,654 12,257
1Type of Benefit: 1) Service Retirement 2) Disability Benefits 3) Survivor Benefits2Option Selected: Option 2 - Beneficiary receives 100% of member’s modified allowance.
Option 3 - Beneficiary receives 50% of member’s modified allowance. Option 4 - Beneficiary receives 2/3 of member’s modified allowance. Option 5 - Survivors receive 50% of member’s modified allowance, upon death of either member of beneficiary. Option 6 - Beneficiary receives 100% of member’s modified allowance. If beneficiary pre-deceases the member the allowance pops up to the unmodified amount. Option 7 - Beneficiary receives 50% of member’s modified allowance. If beneficiary pre-deceases the member the allowance pops up to the unmodified amount. Option 8 - Compound option that allows the member to provide for more than one beneficiary. Option 9 - Beneficiary receives 75% of member’s modified allowance. If beneficiary pre-deceases the member the allowance pops up to the unmodified amount.
3Does not include formerly disabled members.4As of the June 30, 2004 population report the longevity bonus is included in the unmodified allowance.
Table 8 Retired Members by Type of Benefit and Option Selected
DEFINED BENEFIT PROGRAMDEFINED BENEFIT PROGRAM

203STATISTICAL
2013–2014
Rank Participating Employers *Covered Employees
Percentage of Total System
1 Los Angeles Unified School District 38,651 8.05%
2 San Diego Unified School District 8,662 1.80
3 San Francisco Unified School District 5,011 1.04
4 Long Beach Unified School District 4,998 1.04
5 Fresno Unified School District 4,916 1.02
6 Elk Grove Unified School District 4,031 0.84
7 San Bernardino Unified School District 3,603 0.75
8 Corona-Norco Unified School District 3,445 0.72
9 Santa Ana Unified School District 3,294 0.69
10 Oakland Unified School District 3,227 0.67
11 Garden Grove Unified School District 3,020 0.63
12 San Juan Unified School District 2,959 0.62
Top 12 Total 85,817 17.87
All Other 394,422 82.13
Total Covered Employees 480,239 100.00%
Table 9 Principal Participating Defined Benefit and Defined Benefit Supplement Employers for Current Year and Nine Years Ago
DEFINED BENEFIT PROGRAM
2004–2005
Rank Participating Employers Covered Employees
Percentage of Total System
1 Los Angeles Unified School District 50,760 9.86%
2 San Diego Unified School District 11,061 2.15
3 Long Beach Unified School District 6,997 1.36
4 Fresno Unified School District 5,914 1.15
5 San Francisco Unified School District 4,453 0.87
6 Elk Grove Unified School District 4,054 0.79
7 San Bernardino City Unified School District 4,038 0.78
8 Sacramento City Unified School District 3,940 0.77
9 Oakland Unified School District 3,834 0.74
10 Santa Ana Unified School District 3,829 0.74
Top 10 Total 98,880 19.21
All Other 415,824 80.79
Total Covered Employees 514,704 100.00%
*Covered employees are calculated as all employees for whom an employer reports service credit during the fiscal year. Covered employees in this table are counted more than once if they are reported by multiple employers. They are also counted if their employer reports service credit for a retired employee from prior fiscal years. Therefore, the total number of covered employees in this table is higher than the number of active members shown in Table 9 on page 156 of the Actuarial section.

204 CALSTRS COMPREHENSIVE ANNUAL FINANCIAL REPORT 2014
Calendar Year of Benefit Effective Date
CCPI Increases Since Benefit Effective Date
Average Allowance Increases Since Benefit Effective Date
Average Purchasing Power of Current Allowance
Average Increase Needed to Restore Full Purchasing Power
Average Annual Supplemental Increase
(1) (2) (3) (4) (5) (6)
Prior to 1956 841.3% 309.3% 43.5% 130.0% $3,333
1956 823.4% 285.0% 41.7% 139.8% $4,158
1957 792.7% 197.1% 33.3% 200.5% $4,430
1958 760.9% 217.0% 36.8% 171.6% $1,458
1959 748.9% 173.8% 32.3% 210.0% $6,043
1960 731.4% 140.4% 28.9% 245.8% $6,867
1961 720.1% 127.0% 27.7% 261.3% $5,938
1962 706.4% 118.3% 27.1% 269.4% $8,395
1963 701.1% 139.2% 29.9% 234.9% $5,059
1964 685.5% 115.3% 27.4% 264.8% $6,956
1965 665.6% 102.5% 26.5% 278.1% $6,035
1966 653.7% 110.5% 27.9% 258.1% $5,513
1967 635.3% 113.0% 29.0% 245.2% $7,138
1968 605.3% 107.5% 29.4% 239.9% $7,110
1969 572.0% 108.6% 31.0% 222.1% $8,150
1970 538.3% 97.7% 31.0% 222.9% $8,602
1971 514.0% 99.3% 32.5% 208.1% $8,205
1972 497.3% 93.4% 32.4% 208.8% $12,715
1973 466.6% 91.9% 33.9% 195.3% $13,838
1974 413.6% 84.0% 35.8% 179.1% $11,951
1975 365.2% 81.1% 38.9% 156.9% $11,297
1976 338.3% 77.7% 40.5% 146.7% $10,968
1977 306.6% 74.8% 43.0% 132.6% $10,837
1978 274.5% 71.8% 45.9% 118.0% $10,125
1979 240.7% 69.7% 49.8% 100.8% $9,046
1980 190.4% 67.4% 57.6% 73.5% $6,594
1981 168.5% 64.6% 61.3% 63.1% $5,805
1982 145.6% 62.6% 66.2% 51.0% $4,791
1983 144.1% 60.5% 65.8% 52.1% $5,324
1984 133.5% 58.4% 67.8% 47.4% $4,911
1985 123.2% 55.7% 69.8% 43.4% $4,538
1986 115.6% 53.4% 71.2% 40.5% $4,393
Explanation of source and/or calculation of data in columns 3, 4 and 5:
Column 3—Increases from all sources as a percentage of initial allowance. Obtained by dividing total current allowance by total initial allowance and adjusting to a percentage.
Column 4—Purchasing Power as of June 2013. Obtained by dividing total current allowance payable by full CCPI adjusted allowance. Based on totals for all benefit types by calendar year of effective date.
Column 5—Percentage increase in current allowance payable required to restore full 100 percent purchasing power as of June 2013. Obtained by dividing the fully adjusted CCPI allowance factor (column 2) by the percentage increase to date (column 3) and adjusting to a percentage.
Example: (841.3 + 100) / (309.3 + 100) = 2.300 x 100 = 230.0 – 100 = 130.0 percent.
Table 10 Average Allowance Purchasing Power for Fiscal Year 2013–14
DEFINED BENEFIT PROGRAM

205STATISTICAL
Calendar Year of Benefit Effective Date
CCPI Increases Since Benefit Effective Date
Average Allowance Increases Since Benefit Effective Date
Average Purchasing Power of Current Allowance
Average Increase Needed to Restore Full Purchasing Power
Average Annual Supplemental Increase
(1) (2) (3) (4) (5) (6)
1987 108.0% 51.7% 72.9% 37.1% $4,119
1988 98.8% 49.3% 75.1% 33.2% $3,451
1989 88.7% 47.7% 78.3% 27.8% $2,339
1990 80.1% 45.8% 80.9% 23.5% $1,444
1991 72.7% 45.1% 84.0% 19.0% $383
1992 66.6% 42.8% 85.7% 16.7% $0
1993 62.5% 40.8% 86.6% 15.4% $0
1994 60.5% 39.0% 86.6% 15.5% $0
1995 56.9% 37.0% 87.3% 14.5% $0
1996 54.5% 34.8% 87.3% 14.6% $0
1997 51.2% 32.8% 87.9% 13.9% $0
1998 47.9% 31.2% 88.7% 12.7% $0
1999 44.2% 28.5% 89.1% 12.2% $0
2000 39.0% 26.6% 91.1% 9.8% $0
2001 32.1% 25.9% 95.3% 4.9% $0
2002 30.1% 23.7% 95.0% 5.2% $0
2003 27.4% 21.5% 95.4% 4.9% $0
2004 23.6% 19.2% 96.4% 3.7% $0
2005 20.2% 17.0% 97.4% 2.7% $0
2006 14.7% 14.9% 100.1% -0.2% $0
2007 11.3% 12.6% 101.2% -1.2% $0
2008 6.0% 10.5% 104.3% -4.1% $0
2009 7.5% 8.3% 100.8% -0.7% $0
2010 6.5% 6.1% 99.7% 0.4% $0
2011 3.7% 4.1% 100.4% -0.4% $0
2012 3.3% 1.9% 98.6% 1.4% $0
2013 2.8% 0.0% 97.3% 2.8% $0
2014 0.0% 0.0% 100.0% 0.0% $0
Explanation of source and/or calculation of data in columns 3, 4 and 5:
Column 3—Increases from all sources as a percentage of initial allowance. Obtained by dividing total current allowance by total initial allowance and adjusting to a percentage.
Column 4—Purchasing Power as of June 2013. Obtained by dividing total current allowance payable by full CCPI adjusted allowance. Based on totals for all benefit types by calendar year of effective date.
Column 5—Percentage increase in current allowance payable required to restore full 100 percent purchasing power as of June 2013. Obtained by dividing the fully adjusted CCPI allowance factor (column 2) by the percentage increase to date (column 3) and adjusting to a percentage.
Example: (841.3 + 100) / (309.3 + 100) = 2.300 x 100 = 230.0 – 100 = 130.0 percent.
Table 10 Average Allowance Purchasing Power for Fiscal Year 2013–14 (Continued)
DEFINED BENEFIT PROGRAM

206 CALSTRS COMPREHENSIVE ANNUAL FINANCIAL REPORT 2014
Retirees' Purchasing Power Protection Account Payments
Income Source
Year Purchasing Power Count Total $ Paid School Lands Investment Earnings General Fund
83–84 58.40% 35,654 $21,394,183 $n/a $894,183 $20,500,000
84–85 62.40% 57,189 54,306,976 10,119,124 2,426,456 41,761,396
85–86 65.50% 56,811 85,675,243 7,770,757 3,994,458 73,910,028
86–87 68.20% 57,343 122,275,289 4,167,970 5,511,448 112,595,871
87–88 68.20% 59,092 128,231,357 6,083,374 5,317,456 116,830,527
88–89 68.20% 58,037 143,061,285 4,479,266 5,956,019 132,626,000
89–90 68.20% 55,971 158,274,048 2,751,075 n/a 155,522,973¹
Supplemental Benefit Payments
Income Source
Year Purchasing Power Count Total $ Paid School Lands Teachers' Retirement Fund SBMA
90–91 68.20% 52,199 $168,922,827 $2,964,211 $111,103,596 $54,855,020
91–92 68.20% 48,650 178,057,887 2,913,338 56,985,521 118,159,028
92–93 68.20% 54,029 184,551,442 6,658,800 0 177,892,642
93–94 68.20% 49,113 178,886,980 4,225,808 0 174,661,172
94–95 68.20% 46,459 168,359,918 4,973,687 0 163,386,231
95–96 68.20% 41,703 168,517,183 1,171,779 0 167,345,404
96–97 68.20% 38,939 159,786,521 1,870,825 0 157,915,696
97–98 68.2%²/75.0% 44,887 179,308,000 2,586,920 0 176,721,080
98–99 75.00% 42,624 197,860,324 4,168,363 0 193,691,961
99–00 75.00% 41,048 190,478,334 2,704,171 0 187,774,163
00–01 75.00% 44,699 189,388,495 4,023,007 0 185,365,488
01–02³ 80.00% 60,428 256,976,205 7,967,992 0 249,008,212
02–03 80.00% 58,591 233,814,578 3,543,362 0 230,271,216
03–04 80.00% 55,779 223,501,415 2,922,844 0 220,578,571
04–05 80.00% 57,079 221,271,471 3,318,095 0 217,953,375
05–06 80.00% 54,360 215,257,813 4,301,959 0 210,955,854
06–07 80.00% 56,002 230,336,755 6,205,860 0 224,130,894
07–08 80.00% 53,122 229,860,350 6,522,856 0 223,337,493
08–09 85.00%4 89,142 348,105,380 7,036,201 0 341,069,179
09–10 85.00% 63,949 272,579,523 6,334,670 0 266,244,852
10–11 85.00% 53,870 237,572,962 1,929,606 0 235,643,356
11–12 85.00% 57,337 234,612,294 5,227,046 0 229,385,248
12–13 85.00% 54,847 221,451,056 10,277,064 0 211,173,992
13–14 85.00% 50,331 202,231,779 10,297,864 0 191,933,914
¹The 89-90 appropriation was from the Teachers' Retirement Fund. This amount plus regular interest was repaid from General Fund contributions to the SBMA.
²Percentage changed to 75% effective 1/1/98 and payable 4/1/98 (Chapter 939, Statutes of 1997).
³Percentage changed to 80% effective 1/1/2002 and payable 10/1/2001 (Chapter 840, Statutes of 2001).4Percentage changed to 85% effective 9/30/2008 and payable 10/1/2008 (Chapter 751, Statutes of 2008).
Table 11 Restoration of Allowance Purchasing Power Through Supplemental Benefit Payments
DEFINED BENEFIT PROGRAM

207STATISTICAL
Regular Annuity Period Certain
Age Total Single Life with
Cash
100% Joint and Survivor
75% Joint and Survivor
50% Joint and Survivor
10 Years
9 Years
8 Years
7 Years
6 Years
5 Years
4 Years
3 Years
Under 55 17 4 2 1 2 5 3
55 295 97 35 3 10 50 3 2 2 38 15 40
56 150 46 19 3 3 28 5 6 2 4 21 4 9
57 214 54 33 5 7 38 3 7 8 3 23 3 30
58 285 69 41 4 4 65 4 4 7 11 33 8 35
59 409 92 49 5 17 85 6 14 23 64 7 47
60 604 125 80 19 31 133 4 3 6 16 116 18 53
61 948 212 155 25 42 210 20 17 15 14 125 44 69
62 718 177 93 16 33 142 8 11 22 19 93 23 81
63 622 160 74 21 30 116 8 2 17 18 79 13 84
64 447 144 47 12 29 89 2 3 9 11 48 8 45
65 430 116 66 11 21 94 4 2 3 8 67 8 30
66 318 103 37 9 22 65 2 4 7 34 15 20
67 207 73 25 4 11 40 2 2 1 25 8 16
68 147 40 19 4 4 28 3 2 5 21 3 18
69 120 43 17 1 7 19 2 2 1 12 3 13
70 100 29 9 1 4 35 4 8 1 9
71 60 15 6 2 5 15 1 1 6 2 7
72 37 9 3 2 2 9 1 6 1 4
73 32 14 4 1 5 1 5 1 1
74 30 8 3 1 8 1 4 1 4
75 and over 55 18 3 2 8 4 3 2 8 7
Age Unknown 0
Total 6,245 1,648 820 151 291 1,280 77 64 113 149 841 186 625
1Does not include formerly disabled members.
Table 1 Members Retired for Service During Fiscal Year 2013–14¹, Classified by Age and Option Elected
DEFINED BENEFIT SUPPLEMENT PROGRAM

208 CALSTRS COMPREHENSIVE ANNUAL FINANCIAL REPORT 2014
Fiscal Year Ending June 30
CountAverage Monthly
Retirement AnnuityAverage Accumulated
Credits2
Average Age at Retirement
20031 — $ — $ — —
2004 1,902 94 3,120 61.1
2005 5,394 118 4,317 61.3
2006 9,153 138 5,257 61.3
2007 13,299 158 6,379 61.4
2008 17,517 176 7,636 61.4
2009 22,474 203 9,019 61.6
2010 29,261 227 10,651 61.7
2011 34,917 241 12,004 61.9
2012 40,493 250 13,133 62.0
2013 45,110 254 14,088 62.1
2014 48,745 255 14,848 62.2
Fiscal Year Ending June 30
CountAverage Monthly Disability Annuity
Average Accumulated Credits2
Average Age at Retirement
20031 — $ — $ — —
2004 25 82 2,152 55.4
2005 52 94 2,765 55.2
2006 76 106 3,335 55.8
2007 125 121 4,367 55.6
2008 175 129 5,332 55.2
2009 236 163 6,308 54.8
2010 336 201 7,673 55.6
2011 575 239 9,436 55.4
2012 747 239 10,404 55.5
2013 977 244 11,495 55.6
2014 1,123 239 12,407 55.8
1The Defined Benefit Supplement Program was established January 1, 2001. As of June 30, 2003, all members who had retired or become disabled had elected a lump-sum distribution.2Neither service credit nor final compensation are factors in determining a benefit from the Defined Benefit Supplement Program and therefore are not included in this table.
1The Defined Benefit Supplement Program was established January 1, 2001. As of June 30, 2003, all members who had retired or become disabled had elected a lump-sum distribution.2Neither service credit nor final compensation are factors in determining a benefit from the Defined Benefit Supplement Program and therefore are not included in this table.
Table 2 Characteristics of All Members Retired for Service and Receiving an Annuity
Table 3 Characteristics of All Members Retired for Disability and Receiving an Annuity
DEFINED BENEFIT SUPPLEMENT PROGRAM

209STATISTICAL
Table 4 Retired Members by Type of Benefit and Option Selected (as of June 30, 2014)
DEFINED BENEFIT SUPPLEMENT PROGRAM
Monthly Unmodified Allowance
Type of Benefit Less than $250 $250 - 500 $500 - 750 $750 - 1,000 $1,000 & Greater Total
Retirement 31,154 12,289 3,739 987 576 48,745
Disability 765 249 84 15 10 1,123
Survivors 655 223 65 24 17 984
Total 32,574 12,761 3,888 1,026 603 50,852
Type of Payment
Regular Annuity
Single Life Without Cash 1,097 1 0 0 0 1,098
Single Life With Cash 13,856 1,248 106 20 4 15,234
100% J&S 8,022 986 91 17 11 9,127
75% J&S 1,041 154 22 3 1 1,221
50% J&S 2,491 319 41 7 2 2,860
Period Certain Annuity
10 Year 4,689 4,487 530 131 71 9,908
9 Year 290 370 59 6 9 734
8 Year 134 305 33 9 5 486
7 Year 146 570 112 24 11 863
6 Year 102 601 180 19 14 916
5 Year 412 3,054 1,576 295 167 5,504
4 Year 56 242 320 73 38 729
3 Year 238 424 818 422 270 2,172
Total 32,574 12,761 3,888 1,026 603 50,852

210 CALSTRS COMPREHENSIVE ANNUAL FINANCIAL REPORT 2014
Regular Annuity Period Certain Annuity
Age
Total
Participant Only2
100% Beneficiary3
75% Beneficiary4
50% Beneficiary5
10 Years
9 Years
8 Years
7 Years
6 Years
5 Years
4 Years
3 Years
Under 55 0
55 1 1
56 0
57 0
58 0
59 0
60 0
61 2 2
62 2 2
63 4 1 1 1 1
64 1 1
65 1 1
66 6 1 1 1 2 1
67 5 2 1 2
68 2 1 1
69 2 2
70 3 1 1 1
71 3 1 1 1
72 0
73 1 1
74 2 1 1
75 1 1
Over 75 4 1 1 1 1
Total 40 9 4 0 1 6 0 0 1 1 5 3 10
1Does not include formerly disabled members.2Formerly known as the Single Life Annuity with Cash Refund.3Formerly known as the 100% Joint and Survivor Annuity.4New option available for selection effective January 1, 2007.5Formerly known as the 50% Joint and Survivor Annuity.
Table 1 Participants Retired for Service During the 2013–14 Fiscal Year¹ Classified by Age and Type of Annuity Selected
CASH BALANCE BENEFIT PROGRAM

211STATISTICAL
Fiscal Year Ending June 30 Average Age At Retirement Average Annuitant Reserve Average Monthly Annuity
2002 — $ — $ —
2003 — — —
2004 67.8 10,344 134
2005 65.0 13,187 191
2006 67.51 11,596 185
2007 66.9 10,892 183
2008 67.2 12,400 206
2009 67.3 13,054 201
2010 68.1 12,701 204
2011 67.8 13,388 215
2012 67.7 15,945 233
2013 67.1 18,442 263
2014 67.5 20,365 281
1Revised 2007.
Monthly Unmodified Allowance
Type of Benefit Less than $250 $250–500 $500–750 $750–1,000 $1,000 & Greater Total
Retirement 97 30 14 5 6 152
Disability 0 0 0 0 1 1
Survivors 3 2 0 0 0 5
Total 100 32 14 5 7 158
Type of Payment
Regular Annuity
Single Life With Cash 2 0 0 0 0 2
Single Life Without Cash 2 0 0 0 0 2
Participant Only 43 5 2 1 1 52
100% Beneficiary Annuity 11 1 0 1 0 13
75% Beneficiary Annuity 0 0 0 0 0 0
50% Beneficiary Annuity 3 2 0 0 0 5
Period-Certain Annuity
10 Year 21 5 2 0 0 28
9 Year 2 0 0 0 0 2
8 Year 0 1 0 0 0 1
7 Year 1 3 0 0 0 4
6 Year 0 3 1 0 0 4
5 Year 7 7 3 2 1 20
4 Year 1 1 0 1 1 4
3 Year 7 4 6 0 4 21
Total 100 32 14 5 7 158
Table 2 Characteristics of All Members Retired for Service and Receiving an Annuity
Table 3 All Participants Receiving an Annuity by Type of Benefit and Type of Annuity Selected
CASH BALANCE BENEFIT PROGRAM

212 CALSTRS COMPREHENSIVE ANNUAL FINANCIAL REPORT 2014
CASH BALANCE BENEFIT PROGRAM
Table 4 Principal Participating Employers for the Cash Balance Benefit Program, Current Year and Nine Years Ago
2004–2005
Rank Participating Employers Covered Employees
Percentage of Total System
1 Contra Costa Community College District 1,697 7.77%
2 Los Angeles Community College District 1,688 7.73
3 West Contra Costa Unified School District 1,606 7.36
4 City College of San Francisco 1,528 7.00
5 Peralta Community College District 1,465 6.71
6 Chabot-Las Positas Community College District 1,435 6.57
7 San Jose/Evergreen Community College District 1,206 5.52
8 Santa Rosa Junior College 1,023 4.30
9 Glendale Community College District 938 4.30
10 Foothill-De Anza Community College District 928 4.25
Top 10 Total 13,514 61.90
All Other 8,318 38.10
Total Covered Employees 21,832 100.00%
2013–2014
Rank Participating Employers *Covered Employees
Percentage of Total System
1 Los Angeles Community College District 4,745 13.13%
2 Contra Costa Community College District 2,413 6.68
3 Peralta Community College District 2,276 6.30
4 West Contra Costa Unified School District 2,137 5.92
5 City College of San Francisco 1,924 5.33
6 San Jose/Evergreen Community College District 1,803 4.99
7 Chabot-Las Positas Community College District 1,717 4.75
8 Foothill-De Anza Community College District 1,559 4.32
9 Santa Rosa Junior College 1,460 4.04
10 Glendale Community College District 1,455 4.03
Top 10 Total 21,489 59.48
All Other 14,639 40.52
Total Covered Employees 36,128 100.00%
*Covered employees are calculated as all employees for whom an employer reports service credit during the fiscal year. Covered employees in this table are counted more than once if they are reported by multiple employers. They are also counted if their employer reports service credit for a retired employee from prior fiscal years.

213STATISTICAL
Fiscal Year Ending June 30
2014 2013 2012 2011 2010 20092 20082 2007 2006 2005
Additions
Participant Contributions $66,545 $57,273 $53,111 $47,181 $53,536 $42,966 $26,289 $23,338 $21,509 $20,379
Interest, Dividends and Investment Income
66,002 43,151 6,132 43,782 17,175 (28,479) (12,569) 22,793 10,245 6,143
Other Income 179 269 188 225 0 0 17 16 0 0
Total Additions $132,726 $100,693 $59,431 $91,188 $70,711 $14,487 $13,737 $46,147 $31,754 $26,522
Deductions
Distributions and Withdrawals1
$22,173 $25,727 $19,978 $16,690 $11,892 $8,644 $9,570 $8,451 $ — $ —
Benefit Payments to Participant
0 0 0 0 0 0 0 0 2,286 2,645
Refunds of Participant Contributions
2,523 0 0 0 0 0 0 0 7,481 6,131
Administration Expenses 1,146 754 606 538 374 278 526 782 935 917
Total Deductions $25,842 $26,481 $20,584 $17,228 $12,266 $8,922 $10,096 $9,233 $10,702 $9,693
Change in Fiduciary Net Position
$106,884 $74,212 $38,847 $73,960 $58,445 $5,565 $3,641 $36,914 $21,052 $16,829
1Distributions and Withdrawals reflects the Benefit Payments to Participant and Refunds of Participant Contributions combined for fiscal year 2006/07 and thereafter.2Certain reclassifications have been made to the totals for fiscal years 2007/2008 and 2008/2009.
Fiscal Year Ending June 30 2014 2013 2012 2011 2010 2009
Additions
Participant Contributions $3,230 $2,591 $6,877 $1,289 $674 $37
Interest, Dividends and Investment Income 1,934 1,081 219 155 60 1
Other Income 51 37 37 42 0 0
Total Additions $5,215 $3,709 $7,133 $1,486 $734 $38
Deductions
Distributions and Withdrawals $358 $530 $19 $82 $0 $0
Benefit Payments to Participant 0 0 0 0 0 0
Refunds of Participant Contributions 45 0 0 0 0 0
Administration Expenses 36 22 8 2 0 0
Total Deductions $439 $552 $27 $84 $0 $0
Change in Fiduciary Net Position $4,776 $3,157 $7,106 $1,402 $734 $38
The Pension2 IRC 457 Plan began in fiscal year 2008–09.
Table 1A Changes in Fiduciary Net Position for Pension2 IRC 403(b) Plan (dollars in thousands)²
Table 1B Changes in Fiduciary Net Position for Pension2 IRC 457 Plan (dollars in thousands)
PROGRAMS ADMINISTERED OR OVERSEEN BY THE RETIREMENT SYSTEM (PENSION2)

214 CALSTRS COMPREHENSIVE ANNUAL FINANCIAL REPORT 2014
Table 2 Largest Participating Employers for CalSTRS Pension2, Current Year and Eight Years Ago¹
PROGRAMS ADMINISTERED OR OVERSEEN BY THE RETIREMENT SYSTEM (PENSION2)
¹Due to change in record keeper, data is only available since 2006.
* If Employer offers 403 & 457 they are counted twice.
2014
Rank Participating Employers Covered Employees
Percentage
1 Los Angeles Unified School District 5,591 44.04%
2 San Diego City Unified School District 199 1.57
3 Los Angeles Community College District 174 1.37
4 Fremont Unified School District 164 1.29
5 City College of San Francisco 122 0.96
6 San Francisco Unified School District 111 0.87
7 Long Beach Unified School District 105 0.83
8 Sacramento City Unified School District 102 0.80
9 Riverside Community College 96 0.76
10 San Juan Unified School District 86 0.68
Top 10 Total 6,750 53.17
All Other 5,945 46.83
Total (798 Employers)* 12,695 100.00%
2006
Rank Participating Employers Covered Employees
Percentage
1 Los Angeles Unified School District 525 14.47%
2 San Diego City Unified School District 65 1.79
3 San Francisco Unified School District 44 1.21
4 Long Beach Unified School District 43 1.18
5 Sacramento City Unified School District 42 1.16
6 Capistrano Unified School District 37 1.02
7 Fresno Unified School District 33 0.91
8 Mt. Diablo Unified School District 31 0.85
9 San Juan Unified School District 29 0.80
10 Orange Unified School District 28 0.77
All Other 2,752 75.83
Total (745 employers) 3,872 100.00%

215STATISTICAL
Fiscal Year Ending June 30
2014 2013 2012 2011 2010 2009 2008 2007 2006 2005
Additions
Employer Contributions $33,395 $35,022 $34,614 $36,145 $31,749 $29,962 $33,239 $32,257 $29,602 $28,483
Interest, Dividends and Investment Income
10 6 8 10 33 106 205 240 143 87
Other Income 0 0 0 0 0 0 0 0 0 (158)
Total Additions $33,405 $35,028 $34,622 $36,155 $31,782 $30,068 $33,444 $32,497 $29,745 $28,412
Deductions
Premiums Paid $32,632 $34,702 $34,412 $35,785 $35,421 $29,415 $32,689 $31,270 $29,313 $27,416
Administration Expenses 327 340 370 345 309 316 334 190 359 429
Total Deductions $32,959 $35,042 $34,782 $36,130 $35,730 $29,731 $33,023 $31,460 $29,672 $27,845
Change in Fiduciary Net Position
$446 ($14) ($160) $25 ($3,948) $337 $421 $1,037 $73 $567
Fiscal Year Ending June 30
2014 2013 2012 2011 2010 2009 2008 2007 2006 2005
Type of Benefit
Age & Service Benefits
Retired Members $32,632 $34,702 $34,412 $35,785 $35,421 $29,415 $32,689 $31,270 $29,313 $27,416
Total Benefits $32,632 $34,702 $34,412 $35,785 $35,421 $29,415 $32,689 $31,270 $29,313 $27,416
Table 1 Changes in Fiduciary Net Position (dollars in thousands)
Table 2 Benefit and Refund Deductions from Net Position by Type (dollars in thousands)
MEDICARE PREMIUM PAYMENT PROGRAM

216 CALSTRS COMPREHENSIVE ANNUAL FINANCIAL REPORT 2014
Age Total
<55 3
55–56 21
56–57 17
57–58 15
58–59 28
59–60 22
60–61 43
61–62 53
62–63 11
63–64 16
64–65 3
65–66 1
66–67 1
67–68 0
68–69 1
69–70 0
70–71 0
71–72 0
72–73 0
73–74 0
74–75 0
>=75 0
Grand Total 235
Fiscal Year Ending June 30
Average Age at Retirement
Average Monthly Medicare Premium
2002 60.4 $301
2003 60.4 301
2004 60.4 339
2005 60.4 354
2006 60.4 368
2007 60.4 394
2008 60.4 414
2009 60.3 464
2010 60.3 438
2011 60.3 431
2012 60.3 417
2013 60.3 413
2014 60.3 400
Table 3 Retired Members Enrolled in Medicare Premium Payment Program During Fiscal Year 2013–14 Classified by Age at Retirement
Table 4 Characteristics of All Retired Members Enrolled in Medicare Premium Payment Program
MEDICARE PREMIUM PAYMENT PROGRAM


P.O. BOX 15275Sacramento, CA 95851-0275800-228-5453CalSTRS.comCOM 1782 12/14
Printed on recycled paper