movestic sicav · 2020-01-22 · 12, rue gabriel lippmann, l-5365 munsbach, luxembourg rcs no. b...
TRANSCRIPT
MOVESTIC SICAV
(RCS No. B 185.082)
SOCIETE D’INVESTISSEMENT A CAPITAL VARIABLE
ORGANIZED UNDER THE LAWS OF THE GRAND DUCHY OF LUXEMBOURG
SEMI-ANNUAL REPORT AS OF 30 JUNE 2018
COMPANY:MOVESTIC SICAV
Subscriptions to the Company’s shares are only valid if they are made in accordance with the latest
published Key Investor Information Documents (‘‘KIID’’) and the current prospectus accompanied
by the most recent annual report available and, in addition, by the most recent half-year report if this
was published after the most recent annual report.


CONTENTS
ORGANISATION ................................................................................................................................ 4
STATEMENT OF NET ASSETS .......................................................................................................... 6
STATISTICAL INFORMATION ...........................................................................................................15
STATEMENT OF INVESTMENTS AND OTHER NET ASSETS ...........................................................25
MOVESTIC SICAV - Balanserad .....................................................................................................25
MOVESTIC SICAV - Forsiktig........................................................................................................26
MOVESTIC SICAV - Offensiv ........................................................................................................27
MOVESTIC SICAV - Movestic Bevara ............................................................................................28
MOVESTIC SICAV - Movestic Bygga .............................................................................................29
MOVESTIC SICAV - Monyx Balanserad .........................................................................................30
MOVESTIC SICAV - Monyx Sverige/Varlden ..................................................................................31
MOVESTIC SICAV - Monyx Varlden ..............................................................................................32
MOVESTIC SICAV - Proaktiv 75 M ...............................................................................................33
MOVESTIC SICAV - Proaktiv 80 M ...............................................................................................34
MOVESTIC SICAV - Proaktiv 85 M ...............................................................................................35
MOVESTIC SICAV - Proaktiv 90 M ...............................................................................................36
MOVESTIC SICAV - Aktiv Allokering ............................................................................................37
MOVESTIC SICAV - Movestic Europa Smabolag.............................................................................38
MOVESTIC SICAV - Movestic Korta Rantor Plus ............................................................................40
MOVESTIC SICAV - Movestic Sverige ...........................................................................................43
MOVESTIC SICAV - Ascensus Trend Movestic ...............................................................................45
MOVESTIC SICAV - Ascensus Offensiv Movestic ...........................................................................46
MOVESTIC SICAV - Modernac ......................................................................................................47
MOVESTIC SICAV - Movestic Global.............................................................................................48
MOVESTIC SICAV - Movestic Europa ............................................................................................51
MOVESTIC SICAV - Movestic Healthcare .......................................................................................53
MOVESTIC SICAV - Movestic Index ..............................................................................................55
MOVESTIC SICAV - Fastigheter .....................................................................................................56
MOVESTIC SICAV - Sverige Smabolag ..........................................................................................57
MOVESTIC SICAV - Globala Tillvaxtmarknader ..............................................................................58
NOTES TO THE FINANCIAL STATEMENTS .....................................................................................59
INFORMATION ..................................................................................................................................64
This Semi-Annual Report does not constitute an offer or an
invitation to purchase shares of the Company. Statements on
future performances cannot be made on basis of this Semi-
Annual Report. The subscription of shares is based on the most
recent version of the Prospectus, the Statutes of the Company
and the latest Annual Report. If the cut-off day of the Annual
Report exceeds more than eight months a more recent Semi-
Annual Report will be provided in addition to the Annual
Report.
The Prospectus is available free of charge at the Company, at
the Custodian Bank and at the Paying and Distribution Agents
mentioned in this Report.
A statement of the changes to the schedule of investments in
the period under review is available free of charge from the
Company, the Paying Agents and the Distribution Agents.
MOVESTIC SICAV
3
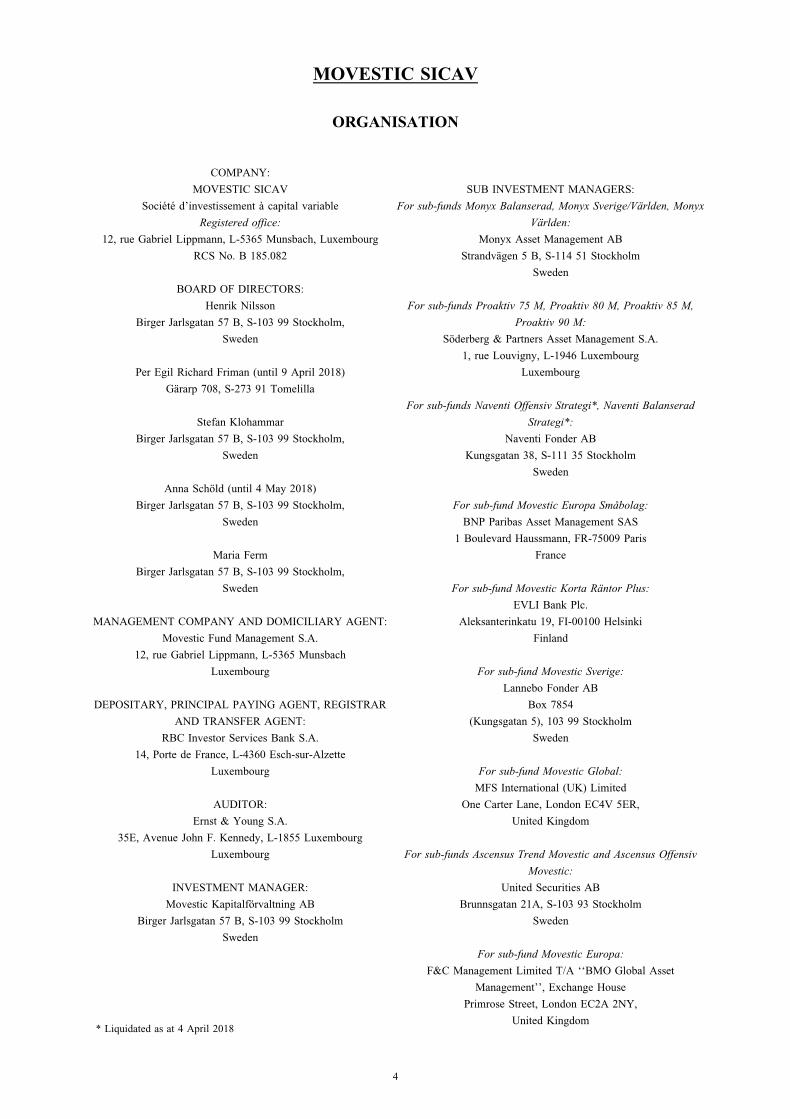
ORGANISATION
COMPANY:
MOVESTIC SICAV
Societe d’investissement a capital variable
Registered office:
12, rue Gabriel Lippmann, L-5365 Munsbach, Luxembourg
RCS No. B 185.082
BOARD OF DIRECTORS:
Henrik Nilsson
Birger Jarlsgatan 57 B, S-103 99 Stockholm,
Sweden
Per Egil Richard Friman (until 9 April 2018)
Gararp 708, S-273 91 Tomelilla
Stefan Klohammar
Birger Jarlsgatan 57 B, S-103 99 Stockholm,
Sweden
Anna Schold (until 4 May 2018)
Birger Jarlsgatan 57 B, S-103 99 Stockholm,
Sweden
Maria Ferm
Birger Jarlsgatan 57 B, S-103 99 Stockholm,
Sweden
MANAGEMENT COMPANY AND DOMICILIARY AGENT:
Movestic Fund Management S.A.
12, rue Gabriel Lippmann, L-5365 Munsbach
Luxembourg
DEPOSITARY, PRINCIPAL PAYING AGENT, REGISTRAR
AND TRANSFER AGENT:
RBC Investor Services Bank S.A.
14, Porte de France, L-4360 Esch-sur-Alzette
Luxembourg
AUDITOR:
Ernst & Young S.A.
35E, Avenue John F. Kennedy, L-1855 Luxembourg
Luxembourg
INVESTMENT MANAGER:
Movestic Kapitalforvaltning AB
Birger Jarlsgatan 57 B, S-103 99 Stockholm
Sweden
SUB INVESTMENT MANAGERS:
For sub-funds Monyx Balanserad, Monyx Sverige/Varlden, Monyx
Varlden:
Monyx Asset Management AB
Strandvagen 5 B, S-114 51 Stockholm
Sweden
For sub-funds Proaktiv 75 M, Proaktiv 80 M, Proaktiv 85 M,
Proaktiv 90 M:
Soderberg & Partners Asset Management S.A.
1, rue Louvigny, L-1946 Luxembourg
Luxembourg
For sub-funds Naventi Offensiv Strategi*, Naventi Balanserad
Strategi*:
Naventi Fonder AB
Kungsgatan 38, S-111 35 Stockholm
Sweden
For sub-fund Movestic Europa Smabolag:
BNP Paribas Asset Management SAS
1 Boulevard Haussmann, FR-75009 Paris
France
For sub-fund Movestic Korta Rantor Plus:
EVLI Bank Plc.
Aleksanterinkatu 19, FI-00100 Helsinki
Finland
For sub-fund Movestic Sverige:
Lannebo Fonder AB
Box 7854
(Kungsgatan 5), 103 99 Stockholm
Sweden
For sub-fund Movestic Global:
MFS International (UK) Limited
One Carter Lane, London EC4V 5ER,
United Kingdom
For sub-funds Ascensus Trend Movestic and Ascensus Offensiv
Movestic:
United Securities AB
Brunnsgatan 21A, S-103 93 Stockholm
Sweden
For sub-fund Movestic Europa:
F&C Management Limited T/A ‘‘BMO Global Asset
Management’’, Exchange House
Primrose Street, London EC2A 2NY,
United Kingdom
MOVESTIC SICAV
4
* Liquidated as at 4 April 2018
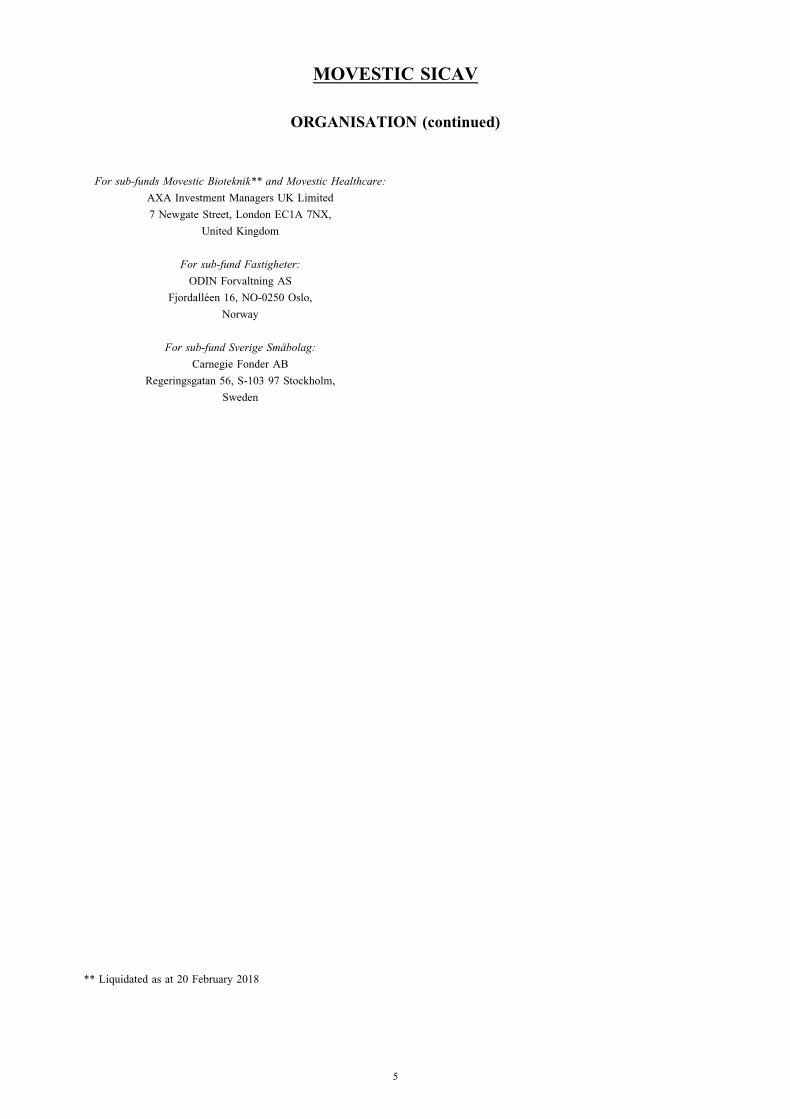
For sub-funds Movestic Bioteknik** and Movestic Healthcare:
AXA Investment Managers UK Limited
7 Newgate Street, London EC1A 7NX,
United Kingdom
For sub-fund Fastigheter:
ODIN Forvaltning AS
Fjordalleen 16, NO-0250 Oslo,
Norway
For sub-fund Sverige Smabolag:
Carnegie Fonder AB
Regeringsgatan 56, S-103 97 Stockholm,
Sweden
** Liquidated as at 20 February 2018
MOVESTIC SICAV
5
ORGANISATION (continued)
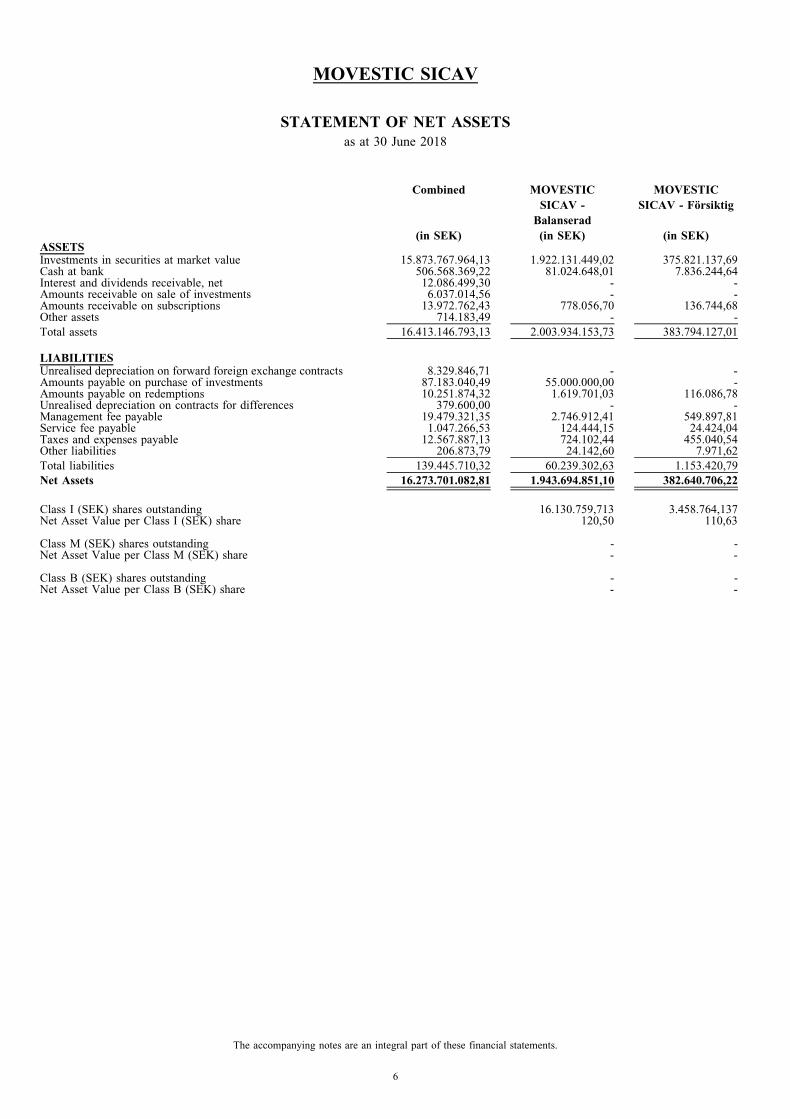
STATEMENT OF NET ASSETS
as at 30 June 2018
Combined MOVESTIC
SICAV -
Balanserad
MOVESTIC
SICAV - Forsiktig
(in SEK) (in SEK) (in SEK)ASSETSInvestments in securities at market value 15.873.767.964,13 1.922.131.449,02 375.821.137,69Cash at bank 506.568.369,22 81.024.648,01 7.836.244,64Interest and dividends receivable, net 12.086.499,30 - -Amounts receivable on sale of investments 6.037.014,56 - -Amounts receivable on subscriptions 13.972.762,43 778.056,70 136.744,68Other assets 714.183,49 - -
Total assets 16.413.146.793,13 2.003.934.153,73 383.794.127,01
LIABILITIESUnrealised depreciation on forward foreign exchange contracts 8.329.846,71 - -Amounts payable on purchase of investments 87.183.040,49 55.000.000,00 -Amounts payable on redemptions 10.251.874,32 1.619.701,03 116.086,78Unrealised depreciation on contracts for differences 379.600,00 - -Management fee payable 19.479.321,35 2.746.912,41 549.897,81Service fee payable 1.047.266,53 124.444,15 24.424,04Taxes and expenses payable 12.567.887,13 724.102,44 455.040,54Other liabilities 206.873,79 24.142,60 7.971,62
Total liabilities 139.445.710,32 60.239.302,63 1.153.420,79
Net Assets 16.273.701.082,81 1.943.694.851,10 382.640.706,22
Class I (SEK) shares outstanding 16.130.759,713 3.458.764,137Net Asset Value per Class I (SEK) share 120,50 110,63
Class M (SEK) shares outstanding - -Net Asset Value per Class M (SEK) share - -
Class B (SEK) shares outstanding - -Net Asset Value per Class B (SEK) share - -
MOVESTIC SICAV
The accompanying notes are an integral part of these financial statements.
6
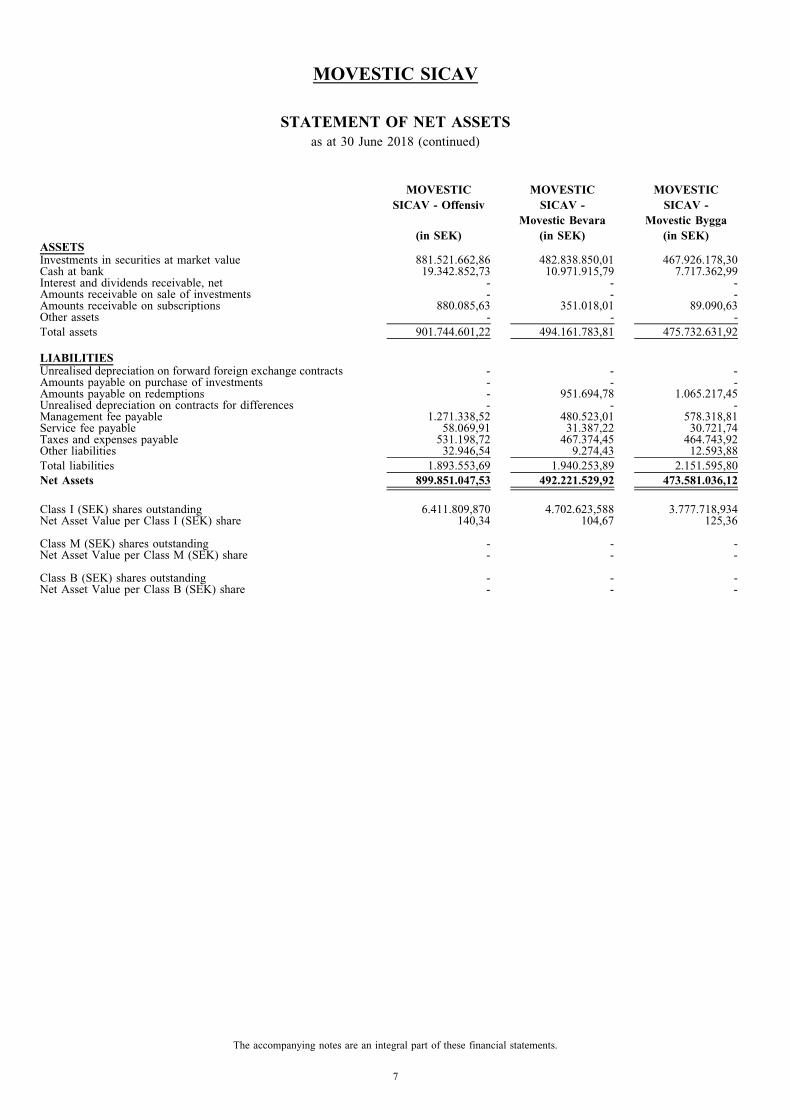
MOVESTIC
SICAV - Offensiv
MOVESTIC
SICAV -
Movestic Bevara
MOVESTIC
SICAV -
Movestic Bygga
(in SEK) (in SEK) (in SEK)ASSETSInvestments in securities at market value 881.521.662,86 482.838.850,01 467.926.178,30Cash at bank 19.342.852,73 10.971.915,79 7.717.362,99Interest and dividends receivable, net - - -Amounts receivable on sale of investments - - -Amounts receivable on subscriptions 880.085,63 351.018,01 89.090,63Other assets - - -
Total assets 901.744.601,22 494.161.783,81 475.732.631,92
LIABILITIESUnrealised depreciation on forward foreign exchange contracts - - -Amounts payable on purchase of investments - - -Amounts payable on redemptions - 951.694,78 1.065.217,45Unrealised depreciation on contracts for differences - - -Management fee payable 1.271.338,52 480.523,01 578.318,81Service fee payable 58.069,91 31.387,22 30.721,74Taxes and expenses payable 531.198,72 467.374,45 464.743,92Other liabilities 32.946,54 9.274,43 12.593,88
Total liabilities 1.893.553,69 1.940.253,89 2.151.595,80
Net Assets 899.851.047,53 492.221.529,92 473.581.036,12
Class I (SEK) shares outstanding 6.411.809,870 4.702.623,588 3.777.718,934Net Asset Value per Class I (SEK) share 140,34 104,67 125,36
Class M (SEK) shares outstanding - - -Net Asset Value per Class M (SEK) share - - -
Class B (SEK) shares outstanding - - -Net Asset Value per Class B (SEK) share - - -
MOVESTIC SICAV
The accompanying notes are an integral part of these financial statements.
7
STATEMENT OF NET ASSETS
as at 30 June 2018 (continued)

MOVESTIC
SICAV - Monyx
Balanserad
MOVESTIC
SICAV - Monyx
Sverige/Varlden
MOVESTIC
SICAV - Monyx
Varlden
(in SEK) (in SEK) (in SEK)ASSETSInvestments in securities at market value 129.976.417,48 302.577.424,51 448.225.758,54Cash at bank 10.360.343,04 28.227.359,74 13.742.934,68Interest and dividends receivable, net - - -Amounts receivable on sale of investments - - -Amounts receivable on subscriptions 19.717,45 24.737,13 -Other assets - - -
Total assets 140.356.477,97 330.829.521,38 461.968.693,22
LIABILITIESUnrealised depreciation on forward foreign exchange contracts - - -Amounts payable on purchase of investments - 21.550.000,00 -Amounts payable on redemptions 171.859,48 83.533,99 144.772,86Unrealised depreciation on contracts for differences - - -Management fee payable 177.544,60 494.620,68 828.978,88Service fee payable 8.877,23 19.784,84 29.474,79Taxes and expenses payable 431.231,59 453.547,34 469.149,05Other liabilities 12.033,72 3.524,07 8.913,80
Total liabilities 801.546,62 22.605.010,92 1.481.289,38
Net Assets 139.554.931,35 308.224.510,46 460.487.403,84
Class I (SEK) shares outstanding 1.103.492,795 2.538.896,782 3.350.507,853Net Asset Value per Class I (SEK) share 126,47 121,40 137,44
Class M (SEK) shares outstanding - - -Net Asset Value per Class M (SEK) share - - -
Class B (SEK) shares outstanding - - -Net Asset Value per Class B (SEK) share - - -
MOVESTIC SICAV
The accompanying notes are an integral part of these financial statements.
8
STATEMENT OF NET ASSETS
as at 30 June 2018 (continued)
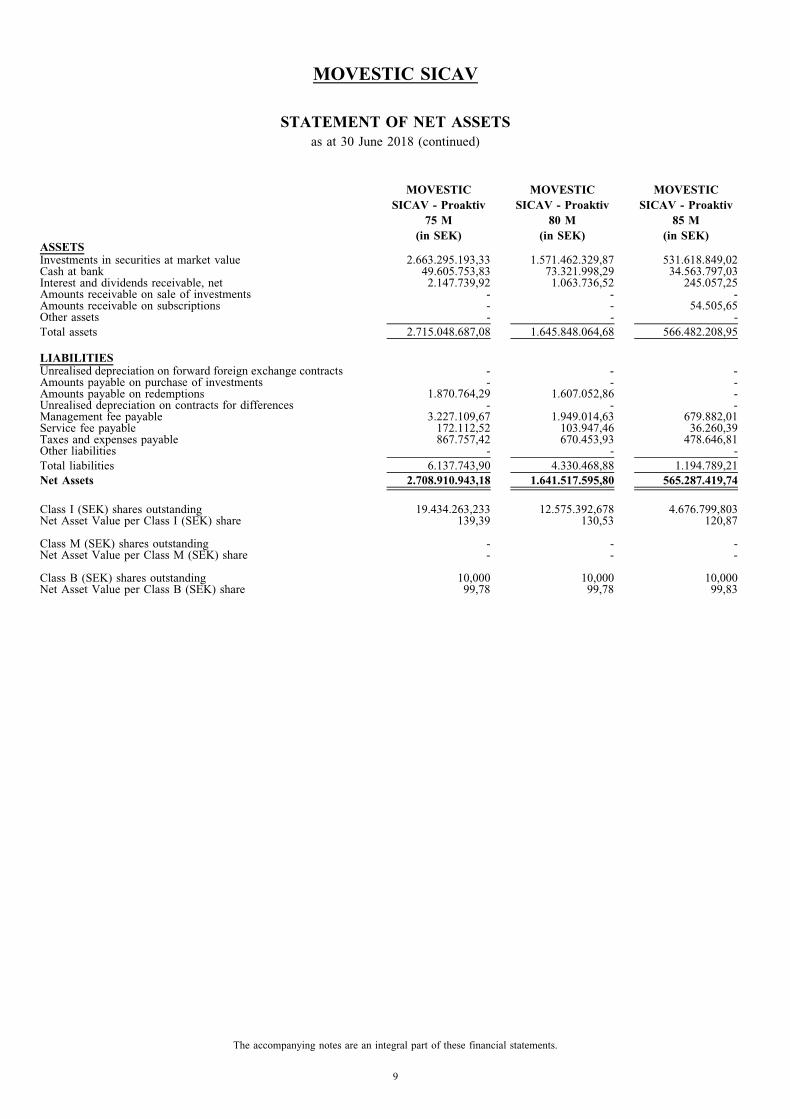
MOVESTIC
SICAV - Proaktiv
75 M
MOVESTIC
SICAV - Proaktiv
80 M
MOVESTIC
SICAV - Proaktiv
85 M
(in SEK) (in SEK) (in SEK)ASSETSInvestments in securities at market value 2.663.295.193,33 1.571.462.329,87 531.618.849,02Cash at bank 49.605.753,83 73.321.998,29 34.563.797,03Interest and dividends receivable, net 2.147.739,92 1.063.736,52 245.057,25Amounts receivable on sale of investments - - -Amounts receivable on subscriptions - - 54.505,65Other assets - - -
Total assets 2.715.048.687,08 1.645.848.064,68 566.482.208,95
LIABILITIESUnrealised depreciation on forward foreign exchange contracts - - -Amounts payable on purchase of investments - - -Amounts payable on redemptions 1.870.764,29 1.607.052,86 -Unrealised depreciation on contracts for differences - - -Management fee payable 3.227.109,67 1.949.014,63 679.882,01Service fee payable 172.112,52 103.947,46 36.260,39Taxes and expenses payable 867.757,42 670.453,93 478.646,81Other liabilities - - -
Total liabilities 6.137.743,90 4.330.468,88 1.194.789,21
Net Assets 2.708.910.943,18 1.641.517.595,80 565.287.419,74
Class I (SEK) shares outstanding 19.434.263,233 12.575.392,678 4.676.799,803Net Asset Value per Class I (SEK) share 139,39 130,53 120,87
Class M (SEK) shares outstanding - - -Net Asset Value per Class M (SEK) share - - -
Class B (SEK) shares outstanding 10,000 10,000 10,000Net Asset Value per Class B (SEK) share 99,78 99,78 99,83
MOVESTIC SICAV
The accompanying notes are an integral part of these financial statements.
9
STATEMENT OF NET ASSETS
as at 30 June 2018 (continued)

MOVESTIC
SICAV - Proaktiv
90 M
MOVESTIC
SICAV - Aktiv
Allokering
MOVESTIC
SICAV - Movestic
Europa Smabolag
(in SEK) (in SEK) (in SEK)ASSETSInvestments in securities at market value 234.028.614,31 173.223.262,57 291.519.509,03Cash at bank 16.715.199,49 2.983.197,00 14.217.677,25Interest and dividends receivable, net 84.732,32 - 352.896,27Amounts receivable on sale of investments - - -Amounts receivable on subscriptions 9.401.833,49 14.565,69 -Other assets - - 141.010,35
Total assets 260.230.379,61 176.221.025,26 306.231.092,90
LIABILITIESUnrealised depreciation on forward foreign exchange contracts - - -Amounts payable on purchase of investments - - -Amounts payable on redemptions 121.221,94 - 151.747,93Unrealised depreciation on contracts for differences - - -Management fee payable 297.306,61 189.113,13 336.802,83Service fee payable 15.860,56 11.206,69 19.466,31Taxes and expenses payable 442.447,22 435.799,74 441.345,09Other liabilities - 4.577,61 -
Total liabilities 876.836,33 640.697,17 949.362,16
Net Assets 259.353.543,28 175.580.328,09 305.281.730,74
Class I (SEK) shares outstanding 2.283.532,465 1.383.579,292 1.568.247,962Net Asset Value per Class I (SEK) share 109,46 126,90 149,89
Class M (SEK) shares outstanding - - 485.077,337Net Asset Value per Class M (SEK) share - - 144,75
Class B (SEK) shares outstanding 94.162,009 - -Net Asset Value per Class B (SEK) share 99,87 - -
MOVESTIC SICAV
The accompanying notes are an integral part of these financial statements.
10
STATEMENT OF NET ASSETS
as at 30 June 2018 (continued)

MOVESTIC
SICAV - Movestic
Korta Rantor Plus
MOVESTIC
SICAV -
Movestic Sverige
MOVESTIC
SICAV - Ascensus
Trend Movestic
(in SEK) (in SEK) (in SEK)ASSETSInvestments in securities at market value 475.735.782,82 451.936.724,25 134.214.986,56Cash at bank 10.796.115,17 24.518.217,42 11.497.436,61Interest and dividends receivable, net 4.933.065,24 - -Amounts receivable on sale of investments - 2.204.928,80 -Amounts receivable on subscriptions 186.209,75 85.273,47 19.986,18Other assets - 71.050,40 -
Total assets 491.651.172,98 478.816.194,34 145.732.409,35
LIABILITIESUnrealised depreciation on forward foreign exchange contracts 8.329.846,71 - -Amounts payable on purchase of investments 3.133.465,20 7.420.329,34 -Amounts payable on redemptions - 330.385,87 -Unrealised depreciation on contracts for differences - 379.600,00 -Management fee payable 263.369,62 406.124,99 255.400,08Service fee payable 30.880,96 32.511,28 9.287,28Taxes and expenses payable 477.962,25 460.607,66 432.679,17Other liabilities - 23.589,90 9.912,59
Total liabilities 12.235.524,74 9.053.149,04 707.279,12
Net Assets 479.415.648,24 469.763.045,30 145.025.130,23
Class I (SEK) shares outstanding 2.412.432,604 1.602.859,592 1.275.574,436Net Asset Value per Class I (SEK) share 102,05 133,64 113,69
Class M (SEK) shares outstanding 2.269.660,928 2.070.848,546 -Net Asset Value per Class M (SEK) share 102,75 123,40 -
Class B (SEK) shares outstanding - - -Net Asset Value per Class B (SEK) share - - -
MOVESTIC SICAV
The accompanying notes are an integral part of these financial statements.
11
STATEMENT OF NET ASSETS
as at 30 June 2018 (continued)
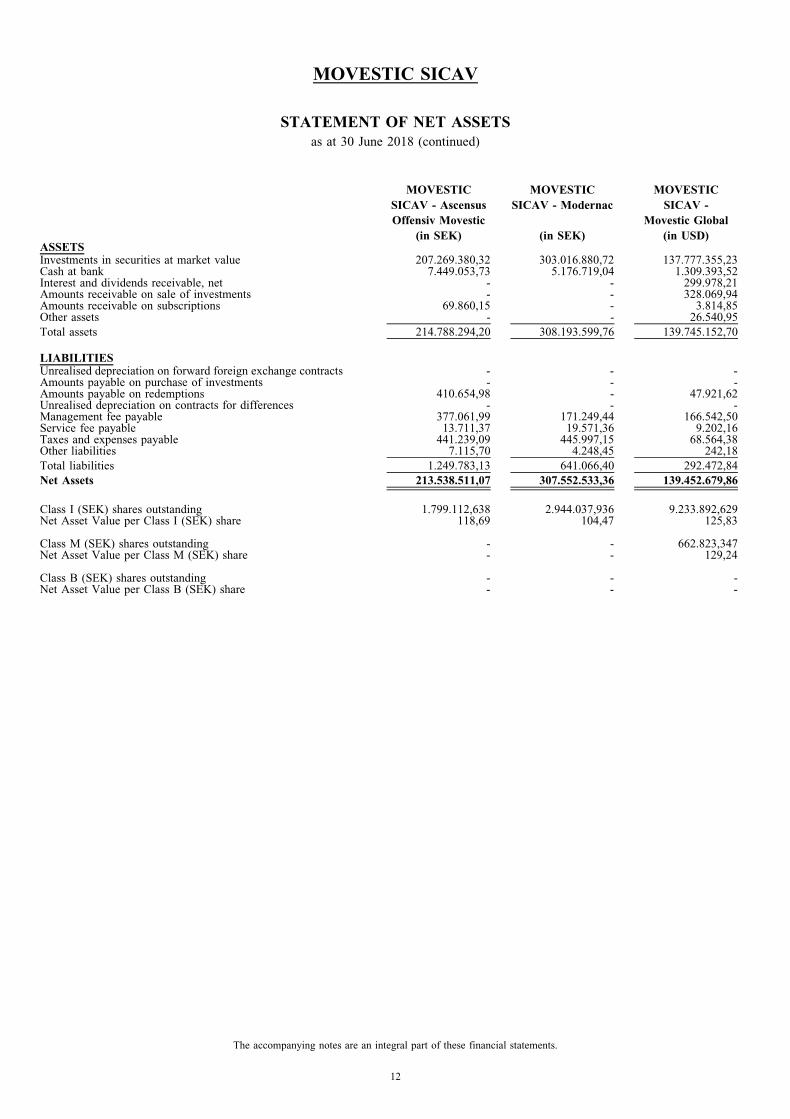
MOVESTIC
SICAV - Ascensus
Offensiv Movestic
MOVESTIC
SICAV - Modernac
MOVESTIC
SICAV -
Movestic Global
(in SEK) (in SEK) (in USD)ASSETSInvestments in securities at market value 207.269.380,32 303.016.880,72 137.777.355,23Cash at bank 7.449.053,73 5.176.719,04 1.309.393,52Interest and dividends receivable, net - - 299.978,21Amounts receivable on sale of investments - - 328.069,94Amounts receivable on subscriptions 69.860,15 - 3.814,85Other assets - - 26.540,95
Total assets 214.788.294,20 308.193.599,76 139.745.152,70
LIABILITIESUnrealised depreciation on forward foreign exchange contracts - - -Amounts payable on purchase of investments - - -Amounts payable on redemptions 410.654,98 - 47.921,62Unrealised depreciation on contracts for differences - - -Management fee payable 377.061,99 171.249,44 166.542,50Service fee payable 13.711,37 19.571,36 9.202,16Taxes and expenses payable 441.239,09 445.997,15 68.564,38Other liabilities 7.115,70 4.248,45 242,18
Total liabilities 1.249.783,13 641.066,40 292.472,84
Net Assets 213.538.511,07 307.552.533,36 139.452.679,86
Class I (SEK) shares outstanding 1.799.112,638 2.944.037,936 9.233.892,629Net Asset Value per Class I (SEK) share 118,69 104,47 125,83
Class M (SEK) shares outstanding - - 662.823,347Net Asset Value per Class M (SEK) share - - 129,24
Class B (SEK) shares outstanding - - -Net Asset Value per Class B (SEK) share - - -
MOVESTIC SICAV
The accompanying notes are an integral part of these financial statements.
12
STATEMENT OF NET ASSETS
as at 30 June 2018 (continued)
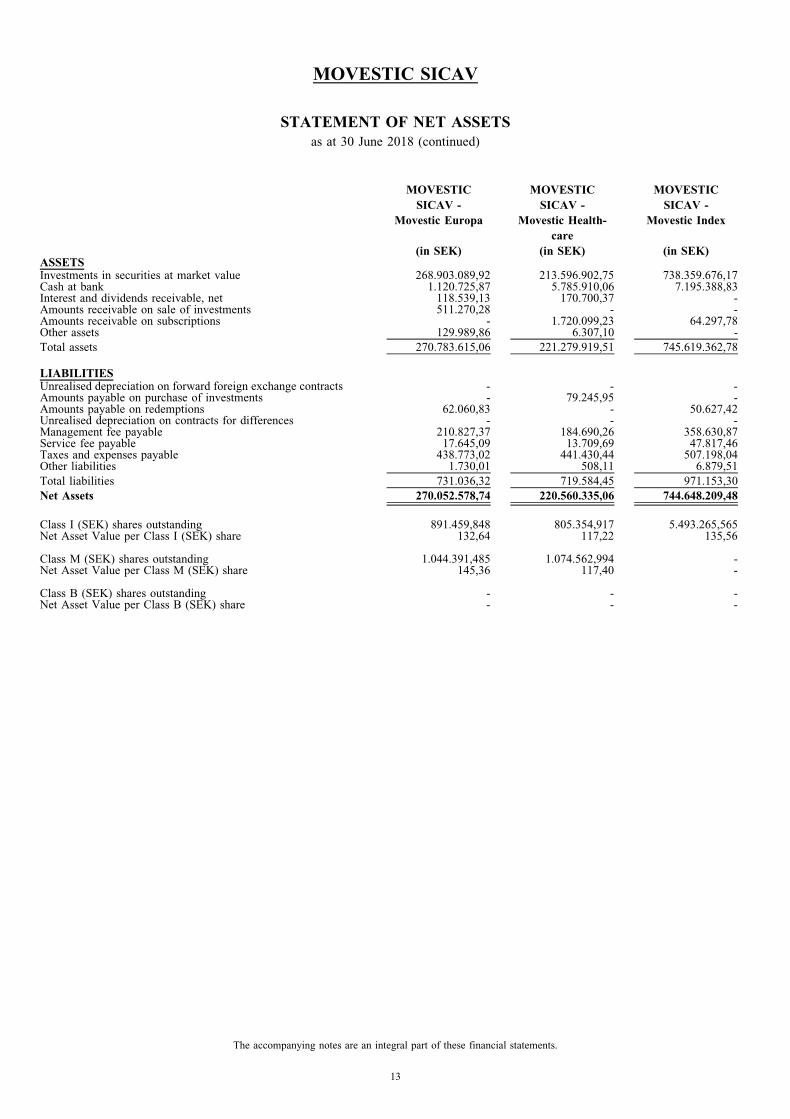
MOVESTIC
SICAV -
Movestic Europa
MOVESTIC
SICAV -
Movestic Health-
care
MOVESTIC
SICAV -
Movestic Index
(in SEK) (in SEK) (in SEK)ASSETSInvestments in securities at market value 268.903.089,92 213.596.902,75 738.359.676,17Cash at bank 1.120.725,87 5.785.910,06 7.195.388,83Interest and dividends receivable, net 118.539,13 170.700,37 -Amounts receivable on sale of investments 511.270,28 - -Amounts receivable on subscriptions - 1.720.099,23 64.297,78Other assets 129.989,86 6.307,10 -
Total assets 270.783.615,06 221.279.919,51 745.619.362,78
LIABILITIESUnrealised depreciation on forward foreign exchange contracts - - -Amounts payable on purchase of investments - 79.245,95 -Amounts payable on redemptions 62.060,83 - 50.627,42Unrealised depreciation on contracts for differences - - -Management fee payable 210.827,37 184.690,26 358.630,87Service fee payable 17.645,09 13.709,69 47.817,46Taxes and expenses payable 438.773,02 441.430,44 507.198,04Other liabilities 1.730,01 508,11 6.879,51
Total liabilities 731.036,32 719.584,45 971.153,30
Net Assets 270.052.578,74 220.560.335,06 744.648.209,48
Class I (SEK) shares outstanding 891.459,848 805.354,917 5.493.265,565Net Asset Value per Class I (SEK) share 132,64 117,22 135,56
Class M (SEK) shares outstanding 1.044.391,485 1.074.562,994 -Net Asset Value per Class M (SEK) share 145,36 117,40 -
Class B (SEK) shares outstanding - - -Net Asset Value per Class B (SEK) share - - -
MOVESTIC SICAV
The accompanying notes are an integral part of these financial statements.
13
STATEMENT OF NET ASSETS
as at 30 June 2018 (continued)

MOVESTIC
SICAV -
Fastigheter
MOVESTIC
SICAV - Sverige
Smabolag
MOVESTIC
SICAV - Globala
Tillvaxtmarknader
(in SEK) (in SEK) (in USD)ASSETSInvestments in securities at market value 200.875.376,54 519.075.444,83 72.888.911,51Cash at bank 5.037.748,92 32.524.918,46 1.466.695,75Interest and dividends receivable, net 286.431,97 - -Amounts receivable on sale of investments 385.907,00 - -Amounts receivable on subscriptions 1.082,85 41.470,37 -Other assets - 128.390,85 -
Total assets 206.586.547,28 551.770.224,51 74.355.607,26
LIABILITIESUnrealised depreciation on forward foreign exchange contracts - - -Amounts payable on purchase of investments - - -Amounts payable on redemptions 370.218,92 207.116,66 54.599,94Unrealised depreciation on contracts for differences - - -Management fee payable 264.216,43 800.018,48 99.539,82Service fee payable 13.210,83 36.057,57 4.974,68Taxes and expenses payable 257.753,77 334.608,17 42.859,93Other liabilities - 27.633,91 794,86
Total liabilities 905.399,95 1.405.434,79 202.769,23
Net Assets 205.681.147,33 550.364.789,72 74.152.838,03
Class I (SEK) shares outstanding 1.778.092,262 4.494.624,724 5.048.879,504Net Asset Value per Class I (SEK) share 115,68 122,45 131,39
Class M (SEK) shares outstanding - - -Net Asset Value per Class M (SEK) share - - -
Class B (SEK) shares outstanding - - -Net Asset Value per Class B (SEK) share - - -
MOVESTIC SICAV
The accompanying notes are an integral part of these financial statements.
14
STATEMENT OF NET ASSETS
as at 30 June 2018 (continued)

STATISTICAL INFORMATION
as at 30 June 2018
MOVESTIC SICAV -
Balanserad
MOVESTIC SICAV -
Forsiktig
MOVESTIC SICAV -
Offensiv
Total net assets
- as at 30.06.2018 SEK 1.943.694.851,10 SEK 382.640.706,22 SEK 899.851.047,53- as at 31.12.2017 SEK 1.960.181.920,96 SEK 383.707.417,65 SEK 887.177.859,01- as at 31.12.2016 SEK 1.695.053.519,40 SEK 354.771.867,08 SEK 895.178.893,22
Number of Class I (SEK) shares
- outstanding at the beginning of the period 16.389.845,233 3.477.655,708 6.499.467,702- issued 659.946,342 230.619,355 251.838,064- redeemed (919.031,862) (249.510,926) (339.495,896)
- outstanding at the end of the period 16.130.759,713 3.458.764,137 6.411.809,870
Net Asset Value per Class I (SEK) share
- as at 30.06.2018 SEK 120,50 SEK 110,63 SEK 140,34- as at 31.12.2017 SEK 119,60 SEK 110,34 SEK 136,50- as at 31.12.2016 SEK 113,41 SEK 108,93 SEK 127,45
Number of Class M (SEK) shares
- outstanding at the beginning of the period - - -- issued - - -- redeemed - - -
- outstanding at the end of the period - - -
Net Asset Value per Class M (SEK) share
- as at 30.06.2018 - - -- as at 31.12.2017 - - -- as at 31.12.2016 - - -
Number of Class B (SEK) shares
- outstanding at the beginning of the period - - -- issued - - -- redeemed - - -
- outstanding at the end of the period - - -
Net Asset Value per Class B (SEK) share
- as at 30.06.2018 - - -- as at 31.12.2017 - - -- as at 31.12.2016 - - -
MOVESTIC SICAV
The accompanying notes are an integral part of these financial statements.
15

MOVESTIC SICAV -
Movestic Bevara
MOVESTIC SICAV -
Movestic Bygga
MOVESTIC SICAV -
Monyx Balanserad
Total net assets
- as at 30.06.2018 SEK 492.221.529,92 SEK 473.581.036,12 SEK 139.554.931,35- as at 31.12.2017 SEK 525.124.531,35 SEK 496.287.154,61 SEK 123.336.057,15- as at 31.12.2016 SEK 570.928.303,69 SEK 413.368.730,84 SEK 109.406.703,75
Number of Class I (SEK) shares
- outstanding at the beginning of the period 4.942.148,727 3.947.798,752 1.008.866,754- issued 357.655,939 290.697,446 188.778,013- redeemed (597.181,078) (460.777,264) (94.151,972)
- outstanding at the end of the period 4.702.623,588 3.777.718,934 1.103.492,795
Net Asset Value per Class I (SEK) share
- as at 30.06.2018 SEK 104,67 SEK 125,36 SEK 126,47- as at 31.12.2017 SEK 106,25 SEK 125,71 SEK 122,25- as at 31.12.2016 SEK 106,31 SEK 117,64 SEK 116,06
Number of Class M (SEK) shares
- outstanding at the beginning of the period - - -- issued - - -- redeemed - - -
- outstanding at the end of the period - - -
Net Asset Value per Class M (SEK) share
- as at 30.06.2018 - - -- as at 31.12.2017 - - -- as at 31.12.2016 - - -
Number of Class B (SEK) shares
- outstanding at the beginning of the period - - -- issued - - -- redeemed - - -
- outstanding at the end of the period - - -
Net Asset Value per Class B (SEK) share
- as at 30.06.2018 - - -- as at 31.12.2017 - - -- as at 31.12.2016 - - -
MOVESTIC SICAV
The accompanying notes are an integral part of these financial statements.
16
STATISTICAL INFORMATION
as at 30 June 2018 (continued)

MOVESTIC SICAV -
Monyx Sverige/Varlden
MOVESTIC SICAV -
Monyx Varlden
MOVESTIC SICAV -
Proaktiv 75 M
Total net assets
- as at 30.06.2018 SEK 308.224.510,46 SEK 460.487.403,84 SEK 2.708.910.943,18- as at 31.12.2017 SEK 334.975.731,03 SEK 464.941.577,29 SEK 2.382.163.931,04- as at 31.12.2016 SEK 375.830.221,75 SEK 505.147.920,15 SEK 2.081.432.127,17
Number of Class I (SEK) shares
- outstanding at the beginning of the period 2.754.515,834 3.500.641,582 18.033.142,913- issued 67.344,599 67.544,724 1.885.005,994- redeemed (282.963,651) (217.678,453) (483.885,674)
- outstanding at the end of the period 2.538.896,782 3.350.507,853 19.434.263,233
Net Asset Value per Class I (SEK) share
- as at 30.06.2018 SEK 121,40 SEK 137,44 SEK 139,39- as at 31.12.2017 SEK 121,61 SEK 132,82 SEK 132,10- as at 31.12.2016 SEK 115,14 SEK 122,86 SEK 120,81
Number of Class M (SEK) shares
- outstanding at the beginning of the period - - -- issued - - -- redeemed - - -
- outstanding at the end of the period - - -
Net Asset Value per Class M (SEK) share
- as at 30.06.2018 - - -- as at 31.12.2017 - - -- as at 31.12.2016 - - -
Number of Class B (SEK) shares
- outstanding at the beginning of the period - - -- issued - - 20,000- redeemed - - (10,000)
- outstanding at the end of the period - - 10,000
Net Asset Value per Class B (SEK) share
- as at 30.06.2018 - - SEK 99,78- as at 31.12.2017 - - -- as at 31.12.2016 - - -
MOVESTIC SICAV
The accompanying notes are an integral part of these financial statements.
17
STATISTICAL INFORMATION
as at 30 June 2018 (continued)

MOVESTIC SICAV -
Proaktiv 80 M
MOVESTIC SICAV -
Proaktiv 85 M
MOVESTIC SICAV -
Proaktiv 90 M
Total net assets
- as at 30.06.2018 SEK 1.641.517.595,80 SEK 565.287.419,74 SEK 259.353.543,28- as at 31.12.2017 SEK 1.478.338.283,17 SEK 478.424.345,24 SEK 225.431.665,53- as at 31.12.2016 SEK 1.364.974.349,82 SEK 431.717.712,32 SEK 200.591.467,34
Number of Class I (SEK) shares
- outstanding at the beginning of the period 11.811.221,057 4.071.925,858 2.089.618,729- issued 1.200.862,768 914.900,219 292.932,354- redeemed (436.691,147) (310.026,274) (99.018,618)
- outstanding at the end of the period 12.575.392,678 4.676.799,803 2.283.532,465
Net Asset Value per Class I (SEK) share
- as at 30.06.2018 SEK 130,53 SEK 120,87 SEK 109,46- as at 31.12.2017 SEK 125,16 SEK 117,49 SEK 107,88- as at 31.12.2016 SEK 116,91 SEK 111,99 SEK 105,60
Number of Class M (SEK) shares
- outstanding at the beginning of the period - - -- issued - - -- redeemed - - -
- outstanding at the end of the period - - -
Net Asset Value per Class M (SEK) share
- as at 30.06.2018 - - -- as at 31.12.2017 - - -- as at 31.12.2016 - - -
Number of Class B (SEK) shares
- outstanding at the beginning of the period - - -- issued 20,000 20,000 95.389,675- redeemed (10,000) (10,000) (1.227,666)
- outstanding at the end of the period 10,000 10,000 94.162,009
Net Asset Value per Class B (SEK) share
- as at 30.06.2018 SEK 99,78 SEK 99,83 SEK 99,87- as at 31.12.2017 - - -- as at 31.12.2016 - - -
MOVESTIC SICAV
The accompanying notes are an integral part of these financial statements.
18
STATISTICAL INFORMATION
as at 30 June 2018 (continued)
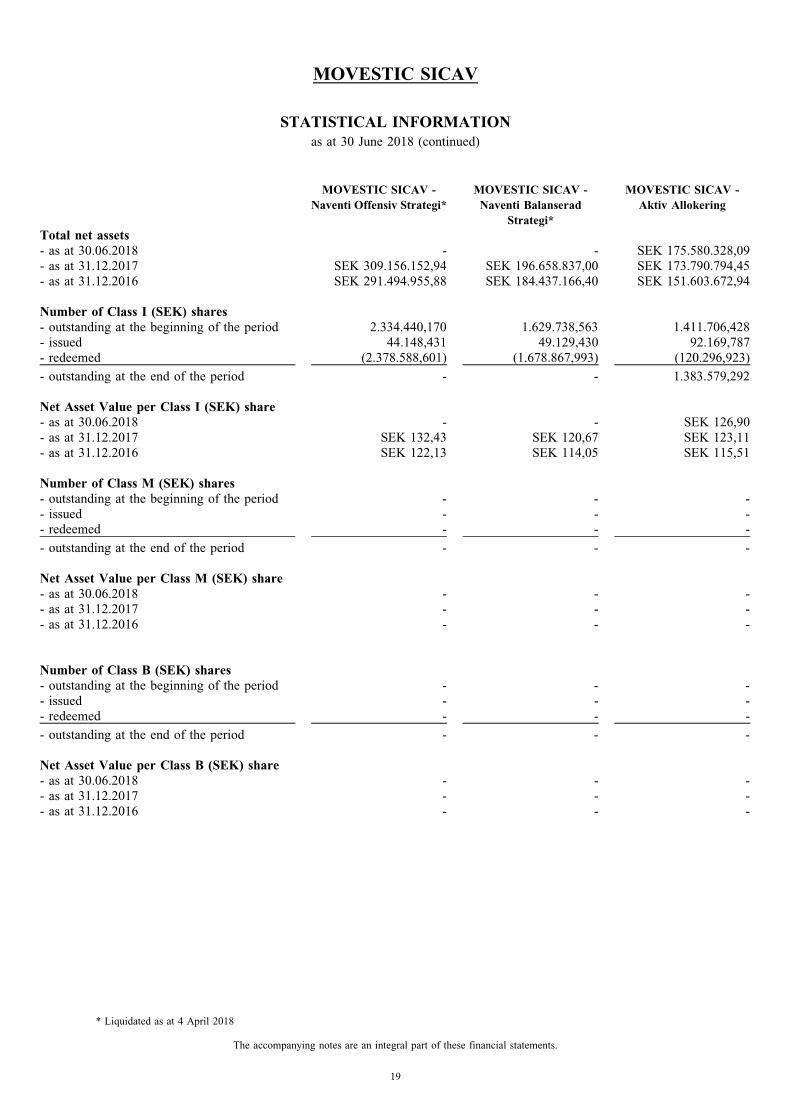
MOVESTIC SICAV -
Naventi Offensiv Strategi*
MOVESTIC SICAV -
Naventi Balanserad
Strategi*
MOVESTIC SICAV -
Aktiv Allokering
Total net assets
- as at 30.06.2018 - - SEK 175.580.328,09- as at 31.12.2017 SEK 309.156.152,94 SEK 196.658.837,00 SEK 173.790.794,45- as at 31.12.2016 SEK 291.494.955,88 SEK 184.437.166,40 SEK 151.603.672,94
Number of Class I (SEK) shares
- outstanding at the beginning of the period 2.334.440,170 1.629.738,563 1.411.706,428- issued 44.148,431 49.129,430 92.169,787- redeemed (2.378.588,601) (1.678.867,993) (120.296,923)
- outstanding at the end of the period - - 1.383.579,292
Net Asset Value per Class I (SEK) share
- as at 30.06.2018 - - SEK 126,90- as at 31.12.2017 SEK 132,43 SEK 120,67 SEK 123,11- as at 31.12.2016 SEK 122,13 SEK 114,05 SEK 115,51
Number of Class M (SEK) shares
- outstanding at the beginning of the period - - -- issued - - -- redeemed - - -
- outstanding at the end of the period - - -
Net Asset Value per Class M (SEK) share
- as at 30.06.2018 - - -- as at 31.12.2017 - - -- as at 31.12.2016 - - -
Number of Class B (SEK) shares
- outstanding at the beginning of the period - - -- issued - - -- redeemed - - -
- outstanding at the end of the period - - -
Net Asset Value per Class B (SEK) share
- as at 30.06.2018 - - -- as at 31.12.2017 - - -- as at 31.12.2016 - - -
MOVESTIC SICAV
The accompanying notes are an integral part of these financial statements.
19
STATISTICAL INFORMATION
as at 30 June 2018 (continued)
* Liquidated as at 4 April 2018
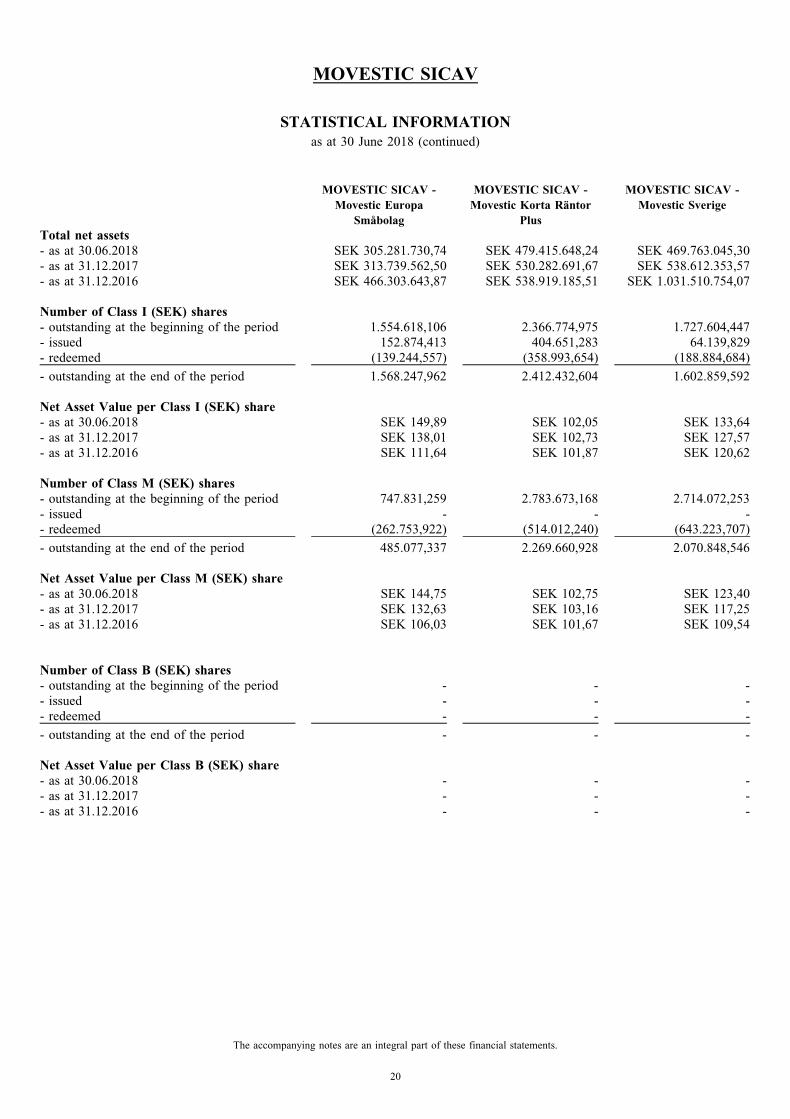
MOVESTIC SICAV -
Movestic Europa
Smabolag
MOVESTIC SICAV -
Movestic Korta Rantor
Plus
MOVESTIC SICAV -
Movestic Sverige
Total net assets
- as at 30.06.2018 SEK 305.281.730,74 SEK 479.415.648,24 SEK 469.763.045,30- as at 31.12.2017 SEK 313.739.562,50 SEK 530.282.691,67 SEK 538.612.353,57- as at 31.12.2016 SEK 466.303.643,87 SEK 538.919.185,51 SEK 1.031.510.754,07
Number of Class I (SEK) shares
- outstanding at the beginning of the period 1.554.618,106 2.366.774,975 1.727.604,447- issued 152.874,413 404.651,283 64.139,829- redeemed (139.244,557) (358.993,654) (188.884,684)
- outstanding at the end of the period 1.568.247,962 2.412.432,604 1.602.859,592
Net Asset Value per Class I (SEK) share
- as at 30.06.2018 SEK 149,89 SEK 102,05 SEK 133,64- as at 31.12.2017 SEK 138,01 SEK 102,73 SEK 127,57- as at 31.12.2016 SEK 111,64 SEK 101,87 SEK 120,62
Number of Class M (SEK) shares
- outstanding at the beginning of the period 747.831,259 2.783.673,168 2.714.072,253- issued - - -- redeemed (262.753,922) (514.012,240) (643.223,707)
- outstanding at the end of the period 485.077,337 2.269.660,928 2.070.848,546
Net Asset Value per Class M (SEK) share
- as at 30.06.2018 SEK 144,75 SEK 102,75 SEK 123,40- as at 31.12.2017 SEK 132,63 SEK 103,16 SEK 117,25- as at 31.12.2016 SEK 106,03 SEK 101,67 SEK 109,54
Number of Class B (SEK) shares
- outstanding at the beginning of the period - - -- issued - - -- redeemed - - -
- outstanding at the end of the period - - -
Net Asset Value per Class B (SEK) share
- as at 30.06.2018 - - -- as at 31.12.2017 - - -- as at 31.12.2016 - - -
MOVESTIC SICAV
The accompanying notes are an integral part of these financial statements.
20
STATISTICAL INFORMATION
as at 30 June 2018 (continued)

MOVESTIC SICAV -
Ascensus Trend Movestic
MOVESTIC SICAV -
Ascensus
Offensiv Movestic
MOVESTIC SICAV -
Modernac
Total net assets
- as at 30.06.2018 SEK 145.025.130,23 SEK 213.538.511,07 SEK 307.552.533,36- as at 31.12.2017 SEK 146.293.717,55 SEK 210.001.776,12 SEK 303.066.161,89- as at 31.12.2016 SEK 148.151.564,30 SEK 183.244.685,47 SEK 271.562.462,80
Number of Class I (SEK) shares
- outstanding at the beginning of the period 1.332.173,960 1.844.228,207 2.876.983,182- issued 91.949,133 144.420,830 67.054,754- redeemed (148.548,657) (189.536,399) -
- outstanding at the end of the period 1.275.574,436 1.799.112,638 2.944.037,936
Net Asset Value per Class I (SEK) share
- as at 30.06.2018 SEK 113,69 SEK 118,69 SEK 104,47- as at 31.12.2017 SEK 109,82 SEK 113,87 SEK 105,34- as at 31.12.2016 SEK 102,55 SEK 105,17 SEK 101,71
Number of Class M (SEK) shares
- outstanding at the beginning of the period - - -- issued - - -- redeemed - - -
- outstanding at the end of the period - - -
Net Asset Value per Class M (SEK) share
- as at 30.06.2018 - - -- as at 31.12.2017 - - -- as at 31.12.2016 - - -
Number of Class B (SEK) shares
- outstanding at the beginning of the period - - -- issued - - -- redeemed - - -
- outstanding at the end of the period - - -
Net Asset Value per Class B (SEK) share
- as at 30.06.2018 - - -- as at 31.12.2017 - - -- as at 31.12.2016 - - -
MOVESTIC SICAV
The accompanying notes are an integral part of these financial statements.
21
STATISTICAL INFORMATION
as at 30 June 2018 (continued)

MOVESTIC SICAV -
Movestic Global
MOVESTIC SICAV -
Movestic Europa
MOVESTIC SICAV -
Movestik Bioteknik*
Total net assets
- as at 30.06.2018 USD 139.452.679,86 SEK 270.052.578,74 -- as at 31.12.2017 USD 176.391.813,54 SEK 259.138.694,41 SEK 55.661.092,15- as at 31.12.2016 USD 158.128.722,51 SEK 149.106.025,92 SEK 71.175.974,76
Number of Class I (SEK) shares
- outstanding at the beginning of the period 9.587.475,681 856.353,996 490.543,188- issued 370.874,988 103.273,320 17.807,492- redeemed (724.458,040) (68.167,468) (508.350,680)
- outstanding at the end of the period 9.233.892,629 891.459,848 -
Net Asset Value per Class I (SEK) share
- as at 30.06.2018 SEK 125,83 SEK 132,64 -- as at 31.12.2017 SEK 120,45 SEK 122,90 SEK 113,47- as at 31.12.2016 SEK 112,04 SEK 106,41 SEK 107,56
Number of Class M (SEK) shares
- outstanding at the beginning of the period 2.350.866,288 1.147.759,948 -- issued - - -- redeemed (1.688.042,941) (103.368,463) -
- outstanding at the end of the period 662.823,347 1.044.391,485 -
Net Asset Value per Class M (SEK) share
- as at 30.06.2018 SEK 129,24 SEK 145,36 -- as at 31.12.2017 SEK 123,12 SEK 134,08 -- as at 31.12.2016 SEK 113,19 SEK 114,68 -
Number of Class B (SEK) shares
- outstanding at the beginning of the period - - -- issued - - -- redeemed - - -
- outstanding at the end of the period - - -
Net Asset Value per Class B (SEK) share
- as at 30.06.2018 - - -- as at 31.12.2017 - - -- as at 31.12.2016 - - -
MOVESTIC SICAV
The accompanying notes are an integral part of these financial statements.
22
STATISTICAL INFORMATION
as at 30 June 2018 (continued)
* Liquidated as at 20 February 2018

MOVESTIC SICAV -
Movestic Healthcare
MOVESTIC SICAV -
Movestic Index
MOVESTIC SICAV -
Fastigheter
Total net assets
- as at 30.06.2018 SEK 220.560.335,06 SEK 744.648.209,48 SEK 205.681.147,33- as at 31.12.2017 SEK 207.613.600,07 SEK 725.455.016,80 -- as at 31.12.2016 SEK 213.964.301,70 SEK 297.959.572,17 -
Number of Class I (SEK) shares
- outstanding at the beginning of the period 813.184,939 5.586.419,861 -- issued 82.436,957 149.454,596 2.030.706,229- redeemed (90.266,979) (242.608,892) (252.613,967)
- outstanding at the end of the period 805.354,917 5.493.265,565 1.778.092,262
Net Asset Value per Class I (SEK) share
- as at 30.06.2018 SEK 117,22 SEK 135,56 SEK 115,68- as at 31.12.2017 SEK 104,10 SEK 129,86 -- as at 31.12.2016 SEK 101,90 SEK 116,54
Number of Class M (SEK) shares
- outstanding at the beginning of the period 1.185.236,568 - -- issued - - -- redeemed (110.673,574) - -
- outstanding at the end of the period 1.074.562,994 - -
Net Asset Value per Class M (SEK) share
- as at 30.06.2018 SEK 117,40 - -- as at 31.12.2017 SEK 103,74 - -- as at 31.12.2016 SEK 100,37 - -
Number of Class B (SEK) shares
- outstanding at the beginning of the period - - -- issued - - -- redeemed - - -
- outstanding at the end of the period - - -
Net Asset Value per Class B (SEK) share
- as at 30.06.2018 - - -- as at 31.12.2017 - - -- as at 31.12.2016 - - -
MOVESTIC SICAV
The accompanying notes are an integral part of these financial statements.
23
STATISTICAL INFORMATION
as at 30 June 2018 (continued)
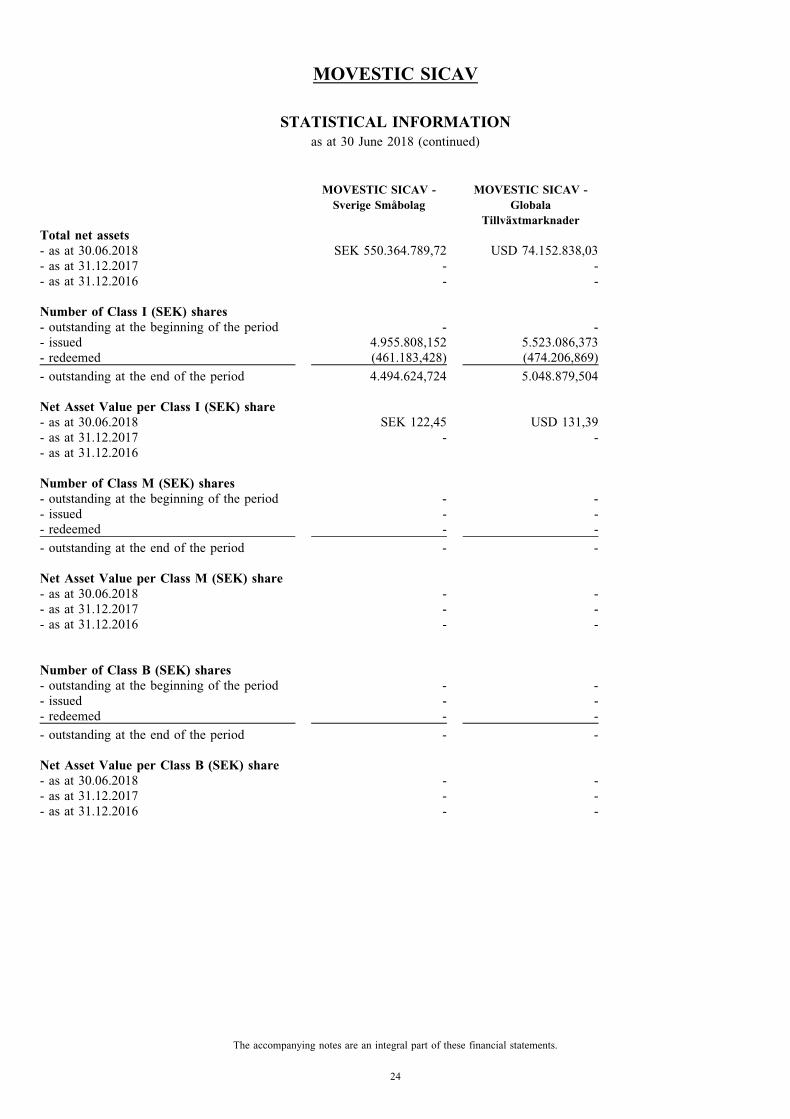
MOVESTIC SICAV -
Sverige Smabolag
MOVESTIC SICAV -
Globala
Tillvaxtmarknader
Total net assets
- as at 30.06.2018 SEK 550.364.789,72 USD 74.152.838,03- as at 31.12.2017 - -- as at 31.12.2016 - -
Number of Class I (SEK) shares
- outstanding at the beginning of the period - -- issued 4.955.808,152 5.523.086,373- redeemed (461.183,428) (474.206,869)
- outstanding at the end of the period 4.494.624,724 5.048.879,504
Net Asset Value per Class I (SEK) share
- as at 30.06.2018 SEK 122,45 USD 131,39- as at 31.12.2017 - -- as at 31.12.2016
Number of Class M (SEK) shares
- outstanding at the beginning of the period - -- issued - -- redeemed - -
- outstanding at the end of the period - -
Net Asset Value per Class M (SEK) share
- as at 30.06.2018 - -- as at 31.12.2017 - -- as at 31.12.2016 - -
Number of Class B (SEK) shares
- outstanding at the beginning of the period - -- issued - -- redeemed - -
- outstanding at the end of the period - -
Net Asset Value per Class B (SEK) share
- as at 30.06.2018 - -- as at 31.12.2017 - -- as at 31.12.2016 - -
MOVESTIC SICAV
The accompanying notes are an integral part of these financial statements.
24
STATISTICAL INFORMATION
as at 30 June 2018 (continued)

MOVESTIC SICAV - Balanserad
STATEMENT OF INVESTMENTS AND OTHER NET ASSETS
as at 30 June 2018
(in SEK)
Currency Quantity Security Cost MarketValue
% of the netassets
INVESTMENT FUNDSUSD 8.874 Agif St Alp Us Eq 250-Wusd-Dis 79.234.299,00 85.555.646,35 4,40SEK 399.880 Alf Br For Hall -C- Sek /Cap 40.000.000,00 40.027.991,50 2,06EUR 722 Am Is Egmsasb-Ie-Cap 79.999.944,00 91.541.737,43 4,71SEK 18.065 Didner & Gerge Aktiefond 50.000.000,00 50.306.198,69 2,59SEK 74.072 Dnb-Tmt Absolute Return-Sek 95.000.430,00 96.717.225,48 4,98EUR 4.889 E&P Trend Index Ucits - A 50.000.000,00 48.240.391,13 2,48SEK 35.818 Evli Eurpn Hi Yld-B Sek Hedg 50.000.214,00 56.012.764,68 2,88SEK 45.114 Evli Short Corp Bond-B -Sek- H 49.121.637,00 51.236.811,13 2,64EUR 54.568 Fl Eqty Risk Ma -A- Eur /Cap 60.000.000,00 61.190.882,27 3,15SEK 369.425 Hbf Msci Em M I -A- Cap 55.000.000,00 55.997.447,56 2,88SEK 8.241 Ipm Systematic Mac-Bsek 84.998.633,00 92.826.829,15 4,78SEK 40.650 Jpmif Inc Opp -A (Perf) (Acc) (Hed) 55.000.430,00 56.393.855,96 2,90USD 38.227 Jpmif Inc Opp -A- Usd /Cap 50.045.698,00 65.614.502,16 3,38SEK 347.983 Macquarie Asia New Stars-C S 48.378.110,00 66.777.092,95 3,44SEK 811.347 Man-Man Ahl Ms Altern-Inh Sek 80.000.645,00 80.769.589,17 4,15SEK 485.077 Mov Eu Smabolag -M (Sek) -Cap 48.559.239,00 69.626.157,80 3,58SEK 850.025 Mov Kor Raen Pl -M- Sek /Cap 85.653.287,00 87.356.344,22 4,49SEK 940.502 Mov Sverige -M- Sek /Cap 89.351.458,00 114.528.579,94 5,89SEK 312.216 Movestic -Healthcare- Ms 31.746.555,00 36.695.142,61 1,89SEK 335.794 Movestic Europa-M Sek 36.290.439,00 48.225.870,41 2,48EUR 776.000 Mul L Lc Mw E Usd /Cap 62.504.344,00 70.029.187,06 3,60SEK 776.045 Muzin Americayield-Hedsekacr 77.604.666,00 83.122.165,28 4,28SEK 285.000 Opm Listed Private Equity 51.730.357,00 84.743.179,02 4,36SEK 864.386 Seb 3-Asst Sel Opp-H Sek C 107.680.887,00 115.591.750,23 5,95SEK 398.418 Sef Entropic Cat Bond-A 40.383.797,00 39.132.617,73 2,01SEK 6.585.374 Standard Life Tr Crd-D Sk Hg 70.000.430,00 70.065.086,90 3,60SEK 743.121 Vaneck Emerg Mrkts Eqy-Sekb 78.214.198,00 103.806.402,21 5,34TOTAL INVESTMENT FUNDS 1.706.499.697,00 1.922.131.449,02 98,89
TOTAL INVESTMENTS IN SECURITIES 1.706.499.697,00 1.922.131.449,02 98,89
CASH AT BANKS 81.024.648,01 4,17
OTHER NET (LIABILITIES) (59.461.245,93) (3,06)
TOTAL 1.943.694.851,10 100,00
MOVESTIC SICAV
25
The accompanying notes are an integral part of these financial statements.
The rounding down of the percentages in the calculation can result in marginal rounding differences.
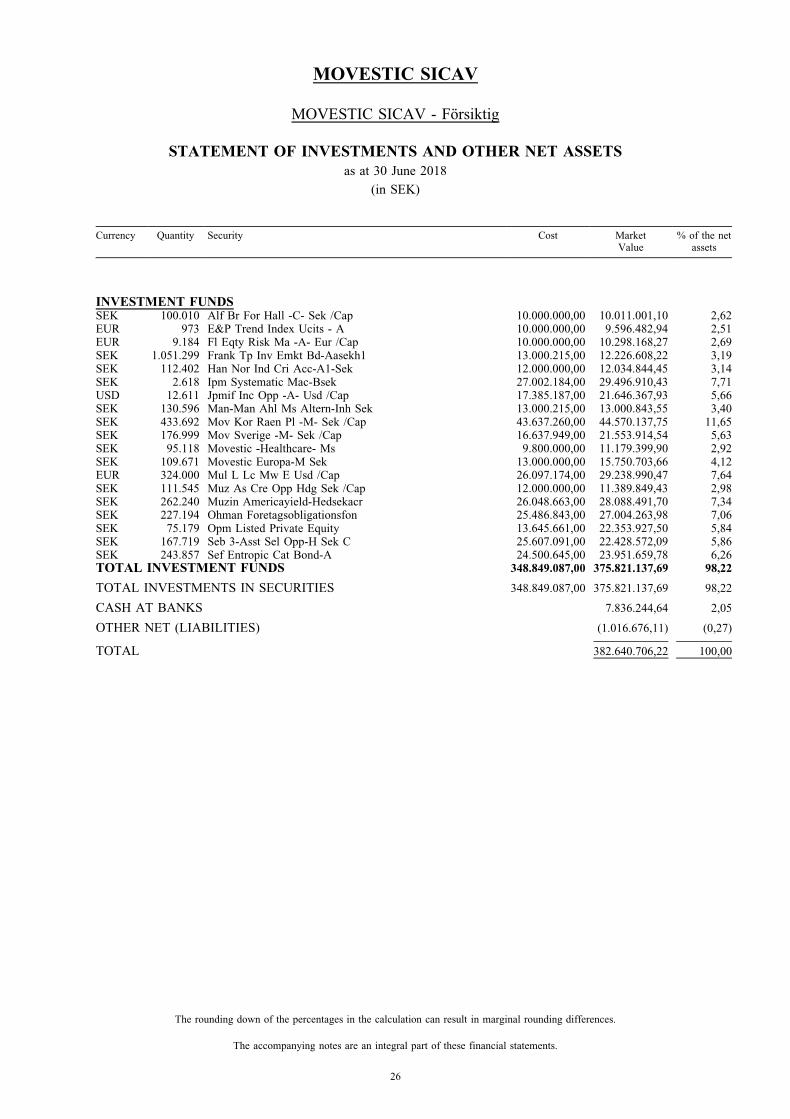
MOVESTIC SICAV - Forsiktig
STATEMENT OF INVESTMENTS AND OTHER NET ASSETS
as at 30 June 2018
(in SEK)
Currency Quantity Security Cost MarketValue
% of the netassets
INVESTMENT FUNDSSEK 100.010 Alf Br For Hall -C- Sek /Cap 10.000.000,00 10.011.001,10 2,62EUR 973 E&P Trend Index Ucits - A 10.000.000,00 9.596.482,94 2,51EUR 9.184 Fl Eqty Risk Ma -A- Eur /Cap 10.000.000,00 10.298.168,27 2,69SEK 1.051.299 Frank Tp Inv Emkt Bd-Aasekh1 13.000.215,00 12.226.608,22 3,19SEK 112.402 Han Nor Ind Cri Acc-A1-Sek 12.000.000,00 12.034.844,45 3,14SEK 2.618 Ipm Systematic Mac-Bsek 27.002.184,00 29.496.910,43 7,71USD 12.611 Jpmif Inc Opp -A- Usd /Cap 17.385.187,00 21.646.367,93 5,66SEK 130.596 Man-Man Ahl Ms Altern-Inh Sek 13.000.215,00 13.000.843,55 3,40SEK 433.692 Mov Kor Raen Pl -M- Sek /Cap 43.637.260,00 44.570.137,75 11,65SEK 176.999 Mov Sverige -M- Sek /Cap 16.637.949,00 21.553.914,54 5,63SEK 95.118 Movestic -Healthcare- Ms 9.800.000,00 11.179.399,90 2,92SEK 109.671 Movestic Europa-M Sek 13.000.000,00 15.750.703,66 4,12EUR 324.000 Mul L Lc Mw E Usd /Cap 26.097.174,00 29.238.990,47 7,64SEK 111.545 Muz As Cre Opp Hdg Sek /Cap 12.000.000,00 11.389.849,43 2,98SEK 262.240 Muzin Americayield-Hedsekacr 26.048.663,00 28.088.491,70 7,34SEK 227.194 Ohman Foretagsobligationsfon 25.486.843,00 27.004.263,98 7,06SEK 75.179 Opm Listed Private Equity 13.645.661,00 22.353.927,50 5,84SEK 167.719 Seb 3-Asst Sel Opp-H Sek C 25.607.091,00 22.428.572,09 5,86SEK 243.857 Sef Entropic Cat Bond-A 24.500.645,00 23.951.659,78 6,26TOTAL INVESTMENT FUNDS 348.849.087,00 375.821.137,69 98,22
TOTAL INVESTMENTS IN SECURITIES 348.849.087,00 375.821.137,69 98,22
CASH AT BANKS 7.836.244,64 2,05
OTHER NET (LIABILITIES) (1.016.676,11) (0,27)
TOTAL 382.640.706,22 100,00
MOVESTIC SICAV
26
The accompanying notes are an integral part of these financial statements.
The rounding down of the percentages in the calculation can result in marginal rounding differences.
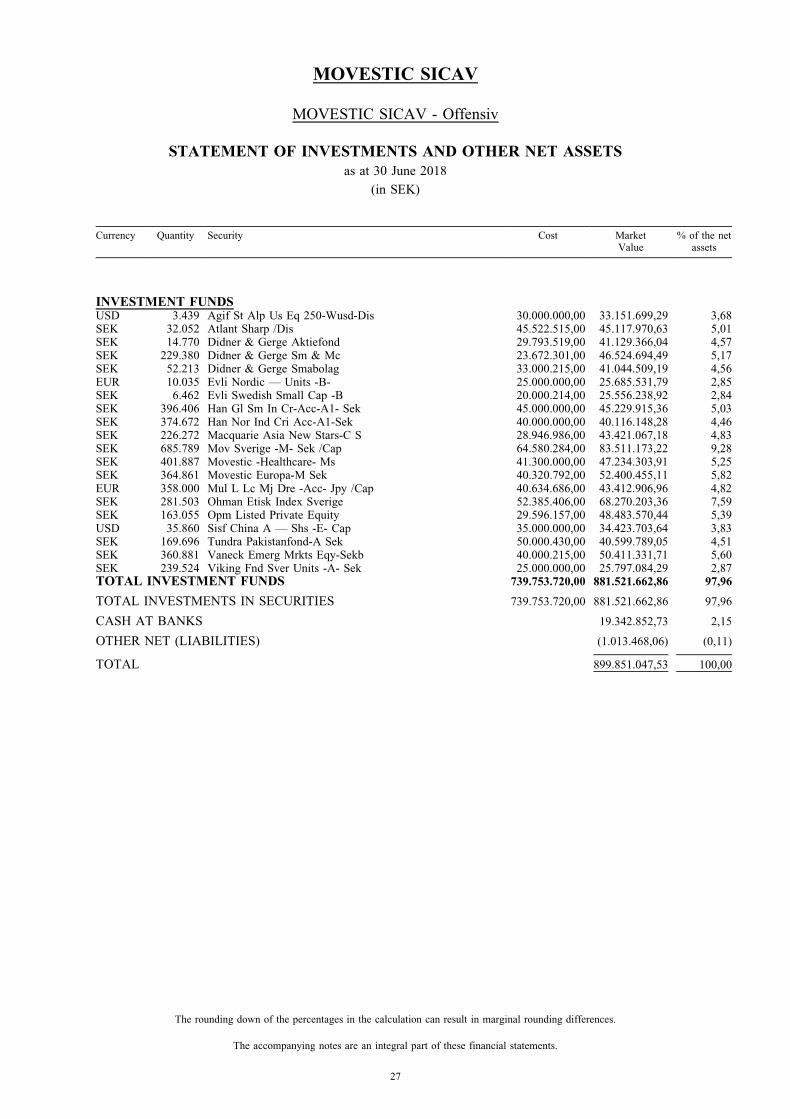
MOVESTIC SICAV - Offensiv
STATEMENT OF INVESTMENTS AND OTHER NET ASSETS
as at 30 June 2018
(in SEK)
Currency Quantity Security Cost MarketValue
% of the netassets
INVESTMENT FUNDSUSD 3.439 Agif St Alp Us Eq 250-Wusd-Dis 30.000.000,00 33.151.699,29 3,68SEK 32.052 Atlant Sharp /Dis 45.522.515,00 45.117.970,63 5,01SEK 14.770 Didner & Gerge Aktiefond 29.793.519,00 41.129.366,04 4,57SEK 229.380 Didner & Gerge Sm & Mc 23.672.301,00 46.524.694,49 5,17SEK 52.213 Didner & Gerge Smabolag 33.000.215,00 41.044.509,19 4,56EUR 10.035 Evli Nordic — Units -B- 25.000.000,00 25.685.531,79 2,85SEK 6.462 Evli Swedish Small Cap -B 20.000.214,00 25.556.238,92 2,84SEK 396.406 Han Gl Sm In Cr-Acc-A1- Sek 45.000.000,00 45.229.915,36 5,03SEK 374.672 Han Nor Ind Cri Acc-A1-Sek 40.000.000,00 40.116.148,28 4,46SEK 226.272 Macquarie Asia New Stars-C S 28.946.986,00 43.421.067,18 4,83SEK 685.789 Mov Sverige -M- Sek /Cap 64.580.284,00 83.511.173,22 9,28SEK 401.887 Movestic -Healthcare- Ms 41.300.000,00 47.234.303,91 5,25SEK 364.861 Movestic Europa-M Sek 40.320.792,00 52.400.455,11 5,82EUR 358.000 Mul L Lc Mj Dre -Acc- Jpy /Cap 40.634.686,00 43.412.906,96 4,82SEK 281.503 Ohman Etisk Index Sverige 52.385.406,00 68.270.203,36 7,59SEK 163.055 Opm Listed Private Equity 29.596.157,00 48.483.570,44 5,39USD 35.860 Sisf China A — Shs -E- Cap 35.000.000,00 34.423.703,64 3,83SEK 169.696 Tundra Pakistanfond-A Sek 50.000.430,00 40.599.789,05 4,51SEK 360.881 Vaneck Emerg Mrkts Eqy-Sekb 40.000.215,00 50.411.331,71 5,60SEK 239.524 Viking Fnd Sver Units -A- Sek 25.000.000,00 25.797.084,29 2,87TOTAL INVESTMENT FUNDS 739.753.720,00 881.521.662,86 97,96
TOTAL INVESTMENTS IN SECURITIES 739.753.720,00 881.521.662,86 97,96
CASH AT BANKS 19.342.852,73 2,15
OTHER NET (LIABILITIES) (1.013.468,06) (0,11)
TOTAL 899.851.047,53 100,00
MOVESTIC SICAV
27
The accompanying notes are an integral part of these financial statements.
The rounding down of the percentages in the calculation can result in marginal rounding differences.

MOVESTIC SICAV - Movestic Bevara
STATEMENT OF INVESTMENTS AND OTHER NET ASSETS
as at 30 June 2018
(in SEK)
Currency Quantity Security Cost MarketValue
% of the netassets
INVESTMENT FUNDSSEK 342.380 Aktie-Ansvar Avkastning-A 38.884.637,00 39.182.012,29 7,96SEK 299.880 Alf Br For Hall -C- Sek /Cap 30.000.000,00 30.018.007,72 6,10SEK 30.582 Atlant Sharp /Dis 46.585.979,00 43.048.244,49 8,74USD 95.041 Bmo Gl Low Vol Alph Eq-Ausda 15.000.000,00 16.188.464,42 3,29EUR 13.862 Fl Eqty Risk Ma -A- Eur /Cap 15.000.000,00 15.544.710,58 3,16SEK 2.016.071 Frank Tp Inv Emkt Bd-Aasekh1 25.000.430,00 23.446.906,29 4,76SEK 77.540 Hbf Gl Ind Crit - Shs-A- 20.000.000,00 20.180.667,63 4,10SEK 20.046 Jpmif Inc Opp -A (Perf) (Acc) (Hed) 26.788.523,00 27.809.740,20 5,65SEK 282.062 Man-Man Ahl Ms Altern-Inh Sek 28.000.430,00 28.079.299,08 5,70SEK 256.457 Mov Global -M- Sek /Cap 25.645.683,00 33.238.471,75 6,75SEK 479.755 Mov Kor Raen Pl -M- Sek /Cap 48.222.430,00 49.304.047,72 10,02SEK 228.065 Ohman Foretagsobligationsfon 25.450.434,00 27.107.766,56 5,51SEK 192.774 Ohman Realrante -A- Sek /Dis 23.000.215,00 23.659.107,00 4,81SEK 118.845 Seb 3-Asst Sel Opp-H Sek C 14.905.058,00 15.892.783,04 3,23SEK 301.871 Seb Fund 1 - Seb Ass Se-C Sek 48.109.643,00 50.151.289,41 10,19SEK 307.437 Sef Entropic Cat Bond-A 30.970.878,00 30.196.501,04 6,13SEK 920.234 Standard Life Tr Crd-D Sk Hg 10.000.000,00 9.790.830,79 1,99TOTAL INVESTMENT FUNDS 471.564.340,00 482.838.850,01 98,09
TOTAL INVESTMENTS IN SECURITIES 471.564.340,00 482.838.850,01 98,09
CASH AT BANKS 10.971.915,79 2,23
OTHER NET (LIABILITIES) (1.589.235,88) (0,32)
TOTAL 492.221.529,92 100,00
MOVESTIC SICAV
28
The accompanying notes are an integral part of these financial statements.
The rounding down of the percentages in the calculation can result in marginal rounding differences.

MOVESTIC SICAV - Movestic Bygga
STATEMENT OF INVESTMENTS AND OTHER NET ASSETS
as at 30 June 2018
(in SEK)
Currency Quantity Security Cost MarketValue
% of the netassets
INVESTMENT FUNDSSEK 17.842 Atlant Sharp /Dis 29.585.241,00 25.115.837,12 5,30SEK 12.782 Didner & Gerge Aktiefond 24.343.745,00 35.594.834,24 7,52SEK 18.100 Dnb-Tmt Absolute Return-Sek 22.965.147,00 23.634.199,67 4,99EUR 10.883 Fl Eqty Risk Ma -A- Eur /Cap 12.000.000,00 12.204.351,45 2,58SEK 176.180 Han Gl Sm In Cr-Acc-A1- Sek 20.000.000,00 20.102.184,55 4,24SEK 133.932 Hbf Msci Em M I -A- Cap 20.000.000,00 20.301.345,86 4,29SEK 98.881 Macquarie Asia New Stars-F S 14.437.422,00 19.516.218,28 4,12SEK 210.243 Mov Global -M- Sek /Cap 21.100.738,00 27.248.862,10 5,75SEK 267.558 Mov Sverige -M- Sek /Cap 26.874.345,00 32.581.636,06 6,88SEK 265.342 Movestic -Healthcare- Ms 27.500.000,00 31.185.939,20 6,59SEK 234.065 Movestic Europa-M Sek 27.746.496,00 33.615.760,63 7,10SEK 177.398 Muz As Cre Opp Hdg Sek /Cap 19.000.000,00 18.114.129,59 3,83USD 12.013 Muzin-Americayield-H Usd A R 22.671.054,00 27.040.560,20 5,71SEK 176.775 Ohman Etisk Index Japan 19.000.000,00 20.415.704,56 4,31SEK 93.061 Opm Listed Private Equity 16.620.240,00 27.671.188,05 5,84SEK 401.279 Seb 3-Asst Sel Opp-H Sek C 61.968.744,00 53.661.848,07 11,33USD 10.246 Sisf China A — Shs -E- Cap 10.000.000,00 9.835.341,11 2,08SEK 215.379 Vaneck Emerg Mrkts Eqy-Sekb 18.265.785,00 30.086.237,56 6,35TOTAL INVESTMENT FUNDS 414.078.957,00 467.926.178,30 98,81
TOTAL INVESTMENTS IN SECURITIES 414.078.957,00 467.926.178,30 98,81
CASH AT BANKS 7.717.362,99 1,63
OTHER NET (LIABILITIES) (2.062.505,17) (0,44)
TOTAL 473.581.036,12 100,00
MOVESTIC SICAV
29
The accompanying notes are an integral part of these financial statements.
The rounding down of the percentages in the calculation can result in marginal rounding differences.
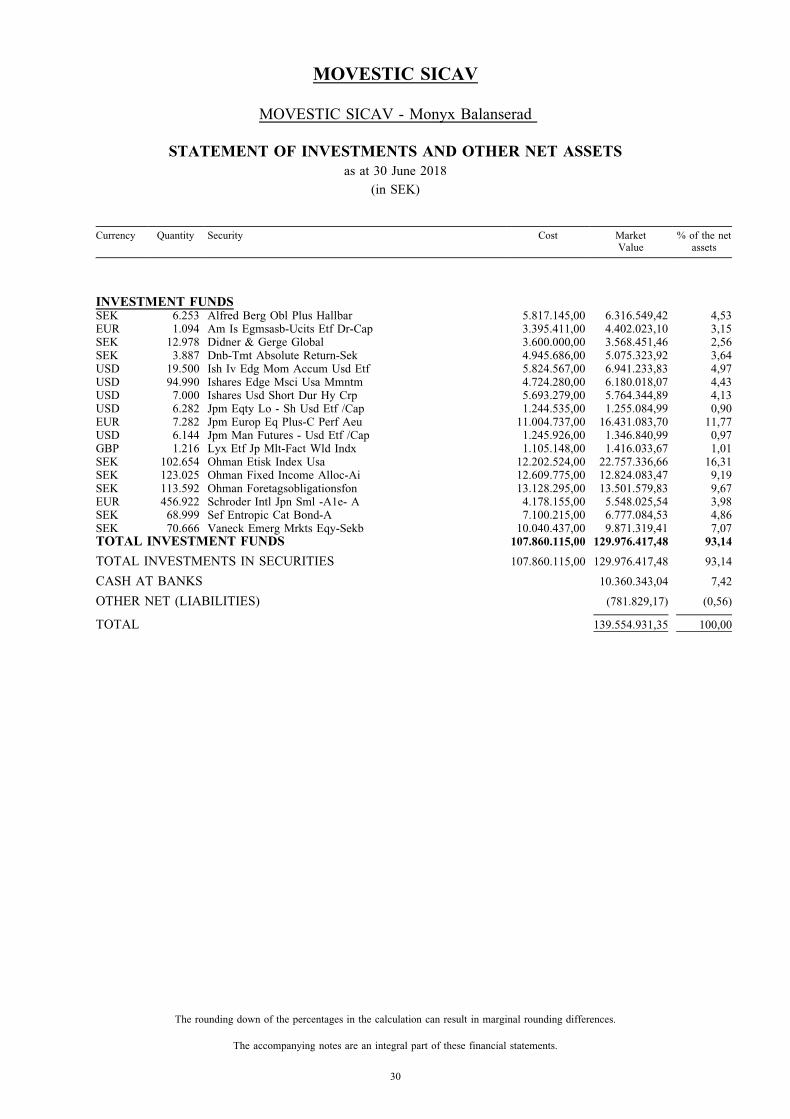
MOVESTIC SICAV - Monyx Balanserad
STATEMENT OF INVESTMENTS AND OTHER NET ASSETS
as at 30 June 2018
(in SEK)
Currency Quantity Security Cost MarketValue
% of the netassets
INVESTMENT FUNDSSEK 6.253 Alfred Berg Obl Plus Hallbar 5.817.145,00 6.316.549,42 4,53EUR 1.094 Am Is Egmsasb-Ucits Etf Dr-Cap 3.395.411,00 4.402.023,10 3,15SEK 12.978 Didner & Gerge Global 3.600.000,00 3.568.451,46 2,56SEK 3.887 Dnb-Tmt Absolute Return-Sek 4.945.686,00 5.075.323,92 3,64USD 19.500 Ish Iv Edg Mom Accum Usd Etf 5.824.567,00 6.941.233,83 4,97USD 94.990 Ishares Edge Msci Usa Mmntm 4.724.280,00 6.180.018,07 4,43USD 7.000 Ishares Usd Short Dur Hy Crp 5.693.279,00 5.764.344,89 4,13USD 6.282 Jpm Eqty Lo - Sh Usd Etf /Cap 1.244.535,00 1.255.084,99 0,90EUR 7.282 Jpm Europ Eq Plus-C Perf Aeu 11.004.737,00 16.431.083,70 11,77USD 6.144 Jpm Man Futures - Usd Etf /Cap 1.245.926,00 1.346.840,99 0,97GBP 1.216 Lyx Etf Jp Mlt-Fact Wld Indx 1.105.148,00 1.416.033,67 1,01SEK 102.654 Ohman Etisk Index Usa 12.202.524,00 22.757.336,66 16,31SEK 123.025 Ohman Fixed Income Alloc-Ai 12.609.775,00 12.824.083,47 9,19SEK 113.592 Ohman Foretagsobligationsfon 13.128.295,00 13.501.579,83 9,67EUR 456.922 Schroder Intl Jpn Sml -A1e- A 4.178.155,00 5.548.025,54 3,98SEK 68.999 Sef Entropic Cat Bond-A 7.100.215,00 6.777.084,53 4,86SEK 70.666 Vaneck Emerg Mrkts Eqy-Sekb 10.040.437,00 9.871.319,41 7,07TOTAL INVESTMENT FUNDS 107.860.115,00 129.976.417,48 93,14
TOTAL INVESTMENTS IN SECURITIES 107.860.115,00 129.976.417,48 93,14
CASH AT BANKS 10.360.343,04 7,42
OTHER NET (LIABILITIES) (781.829,17) (0,56)
TOTAL 139.554.931,35 100,00
MOVESTIC SICAV
30
The accompanying notes are an integral part of these financial statements.
The rounding down of the percentages in the calculation can result in marginal rounding differences.

MOVESTIC SICAV - Monyx Sverige/Varlden
STATEMENT OF INVESTMENTS AND OTHER NET ASSETS
as at 30 June 2018
(in SEK)
Currency Quantity Security Cost MarketValue
% of the netassets
INVESTMENT FUNDSSEK 62.024 Aktie Ansvar Sverige -A- Acc 24.459.910,00 34.099.378,79 11,06EUR 5.726 Am Is Egmsasb-Ucits Etf Dr-Cap 18.556.547,00 23.040.205,00 7,47SEK 20.650 Didner & Gerge Aktiefond 41.459.765,00 57.502.729,09 18,66SEK 66.326 Didner & Gerge Global 14.000.215,00 18.237.592,71 5,92SEK 24.781 Didner & Gerge Smabolag 18.600.214,00 19.480.545,12 6,32SEK 20.221 Dnb-Tmt Absolute Return-Sek 25.839.444,00 26.402.952,74 8,57USD 16.485 Jpm Eqty Lo - Sh Usd Etf /Cap 3.265.863,00 3.293.549,14 1,07USD 16.122 Jpm Man Futures - Usd Etf /Cap 3.269.340,00 3.534.142,26 1,15GBP 12.014 Lyx Etf Jp Mlt-Fact Wld Indx 10.916.874,00 13.990.319,32 4,54SEK 57.893 Monyx Sv Akt — Shs -Bc- Cap 21.550.000,00 21.790.255,18 7,07SEK 76.382 Ohman Fixed Income Alloc-Ai 7.729.800,00 7.962.063,85 2,58SEK 209.181 Ohman Foretagsobligationsfon 23.815.522,00 24.863.303,70 8,07SEK 35.957 Sef Entropic Cat Bond-A 3.700.215,00 3.531.720,11 1,14SEK 321.059 Vaneck Emerg Mrkts Eqy-Sekb 45.617.026,00 44.848.667,50 14,55TOTAL INVESTMENT FUNDS 262.780.735,00 302.577.424,51 98,17
TOTAL INVESTMENTS IN SECURITIES 262.780.735,00 302.577.424,51 98,17
CASH AT BANKS 28.227.359,74 9,16
OTHER NET (LIABILITIES) (22.580.273,79) (7,33)
TOTAL 308.224.510,46 100,00
MOVESTIC SICAV
31
The accompanying notes are an integral part of these financial statements.
The rounding down of the percentages in the calculation can result in marginal rounding differences.
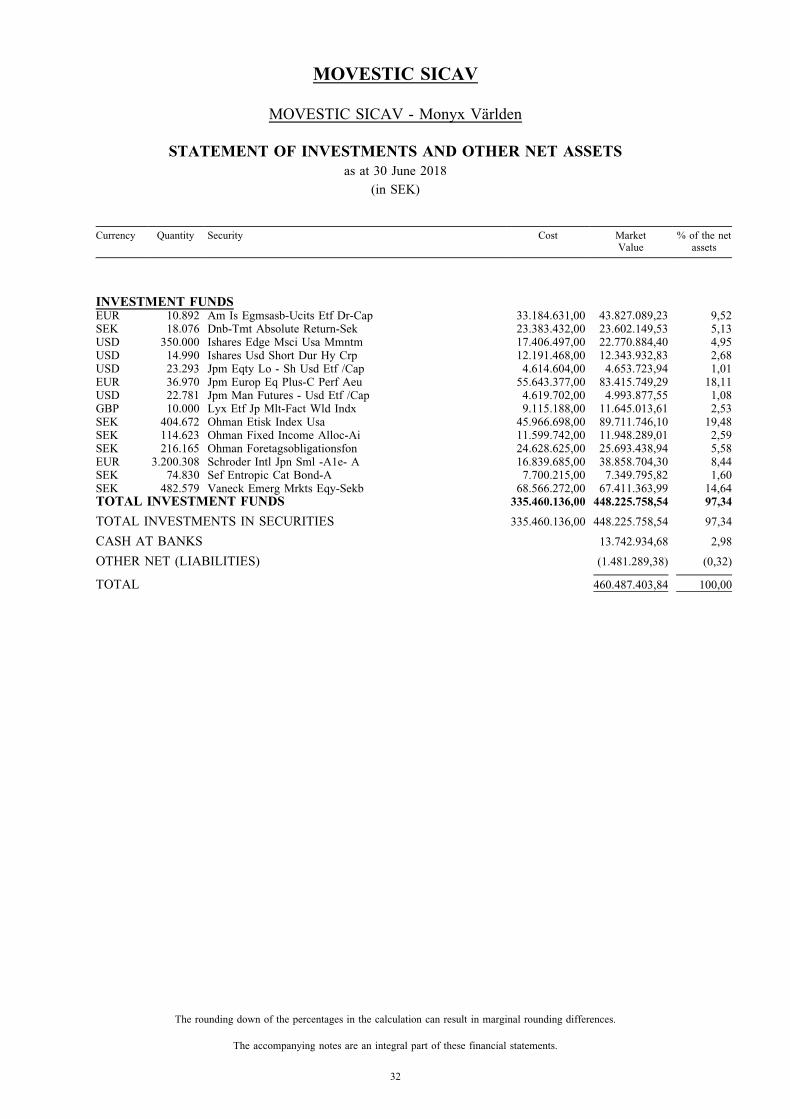
MOVESTIC SICAV - Monyx Varlden
STATEMENT OF INVESTMENTS AND OTHER NET ASSETS
as at 30 June 2018
(in SEK)
Currency Quantity Security Cost MarketValue
% of the netassets
INVESTMENT FUNDSEUR 10.892 Am Is Egmsasb-Ucits Etf Dr-Cap 33.184.631,00 43.827.089,23 9,52SEK 18.076 Dnb-Tmt Absolute Return-Sek 23.383.432,00 23.602.149,53 5,13USD 350.000 Ishares Edge Msci Usa Mmntm 17.406.497,00 22.770.884,40 4,95USD 14.990 Ishares Usd Short Dur Hy Crp 12.191.468,00 12.343.932,83 2,68USD 23.293 Jpm Eqty Lo - Sh Usd Etf /Cap 4.614.604,00 4.653.723,94 1,01EUR 36.970 Jpm Europ Eq Plus-C Perf Aeu 55.643.377,00 83.415.749,29 18,11USD 22.781 Jpm Man Futures - Usd Etf /Cap 4.619.702,00 4.993.877,55 1,08GBP 10.000 Lyx Etf Jp Mlt-Fact Wld Indx 9.115.188,00 11.645.013,61 2,53SEK 404.672 Ohman Etisk Index Usa 45.966.698,00 89.711.746,10 19,48SEK 114.623 Ohman Fixed Income Alloc-Ai 11.599.742,00 11.948.289,01 2,59SEK 216.165 Ohman Foretagsobligationsfon 24.628.625,00 25.693.438,94 5,58EUR 3.200.308 Schroder Intl Jpn Sml -A1e- A 16.839.685,00 38.858.704,30 8,44SEK 74.830 Sef Entropic Cat Bond-A 7.700.215,00 7.349.795,82 1,60SEK 482.579 Vaneck Emerg Mrkts Eqy-Sekb 68.566.272,00 67.411.363,99 14,64TOTAL INVESTMENT FUNDS 335.460.136,00 448.225.758,54 97,34
TOTAL INVESTMENTS IN SECURITIES 335.460.136,00 448.225.758,54 97,34
CASH AT BANKS 13.742.934,68 2,98
OTHER NET (LIABILITIES) (1.481.289,38) (0,32)
TOTAL 460.487.403,84 100,00
MOVESTIC SICAV
32
The accompanying notes are an integral part of these financial statements.
The rounding down of the percentages in the calculation can result in marginal rounding differences.
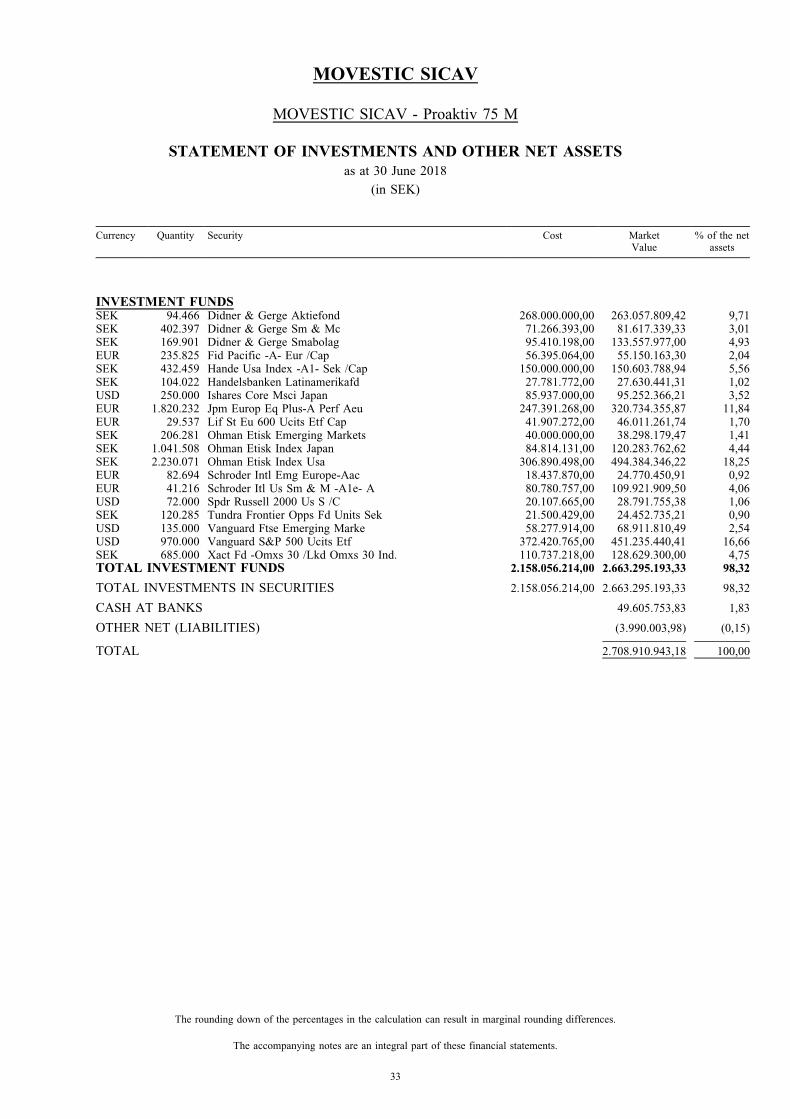
MOVESTIC SICAV - Proaktiv 75 M
STATEMENT OF INVESTMENTS AND OTHER NET ASSETS
as at 30 June 2018
(in SEK)
Currency Quantity Security Cost MarketValue
% of the netassets
INVESTMENT FUNDSSEK 94.466 Didner & Gerge Aktiefond 268.000.000,00 263.057.809,42 9,71SEK 402.397 Didner & Gerge Sm & Mc 71.266.393,00 81.617.339,33 3,01SEK 169.901 Didner & Gerge Smabolag 95.410.198,00 133.557.977,00 4,93EUR 235.825 Fid Pacific -A- Eur /Cap 56.395.064,00 55.150.163,30 2,04SEK 432.459 Hande Usa Index -A1- Sek /Cap 150.000.000,00 150.603.788,94 5,56SEK 104.022 Handelsbanken Latinamerikafd 27.781.772,00 27.630.441,31 1,02USD 250.000 Ishares Core Msci Japan 85.937.000,00 95.252.366,21 3,52EUR 1.820.232 Jpm Europ Eq Plus-A Perf Aeu 247.391.268,00 320.734.355,87 11,84EUR 29.537 Lif St Eu 600 Ucits Etf Cap 41.907.272,00 46.011.261,74 1,70SEK 206.281 Ohman Etisk Emerging Markets 40.000.000,00 38.298.179,47 1,41SEK 1.041.508 Ohman Etisk Index Japan 84.814.131,00 120.283.762,62 4,44SEK 2.230.071 Ohman Etisk Index Usa 306.890.498,00 494.384.346,22 18,25EUR 82.694 Schroder Intl Emg Europe-Aac 18.437.870,00 24.770.450,91 0,92EUR 41.216 Schroder Itl Us Sm & M -A1e- A 80.780.757,00 109.921.909,50 4,06USD 72.000 Spdr Russell 2000 Us S /C 20.107.665,00 28.791.755,38 1,06SEK 120.285 Tundra Frontier Opps Fd Units Sek 21.500.429,00 24.452.735,21 0,90USD 135.000 Vanguard Ftse Emerging Marke 58.277.914,00 68.911.810,49 2,54USD 970.000 Vanguard S&P 500 Ucits Etf 372.420.765,00 451.235.440,41 16,66SEK 685.000 Xact Fd -Omxs 30 /Lkd Omxs 30 Ind. 110.737.218,00 128.629.300,00 4,75TOTAL INVESTMENT FUNDS 2.158.056.214,00 2.663.295.193,33 98,32
TOTAL INVESTMENTS IN SECURITIES 2.158.056.214,00 2.663.295.193,33 98,32
CASH AT BANKS 49.605.753,83 1,83
OTHER NET (LIABILITIES) (3.990.003,98) (0,15)
TOTAL 2.708.910.943,18 100,00
MOVESTIC SICAV
33
The accompanying notes are an integral part of these financial statements.
The rounding down of the percentages in the calculation can result in marginal rounding differences.

MOVESTIC SICAV - Proaktiv 80 M
STATEMENT OF INVESTMENTS AND OTHER NET ASSETS
as at 30 June 2018
(in SEK)
Currency Quantity Security Cost MarketValue
% of the netassets
INVESTMENT FUNDSSEK 458.114 Aktie-Ansvar Avkastning-A 51.933.380,00 52.426.544,19 3,20SEK 45.728 Didner & Gerge Aktiefond 129.999.998,00 127.339.259,73 7,76SEK 201.701 Didner & Gerge Sm & Mc 35.738.301,00 40.910.583,99 2,49SEK 76.557 Didner & Gerge Smabolag 43.259.233,00 60.180.794,49 3,67EUR 118.386 Fid Pacific -A- Eur /Cap 28.310.161,00 27.685.902,55 1,69SEK 118.896 Hande Usa Index -A1- Sek /Cap 40.000.000,00 41.405.344,29 2,52SEK 83.883 Handelsbanken Latinamerikafd 22.422.464,00 22.280.955,98 1,36SEK 247.226 Handelsbnkn Kortranta Critr 25.813.423,00 25.798.061,90 1,57USD 130.000 Ishares Core Msci Japan 44.052.961,00 49.531.230,43 3,02EUR 838.693 Jpm Europ Eq Plus-A Perf Aeu 112.686.291,00 147.782.056,67 9,00SEK 450.162 Lannebo Likviditetsfond 51.062.099,00 51.755.137,56 3,15EUR 21.832 Lif St Eu 600 Ucits Etf Cap 30.975.372,00 34.008.797,99 2,07SEK 215.938 Ohman Etisk Emerging Markets 42.000.000,00 40.091.105,33 2,44SEK 588.655 Ohman Etisk Index Japan 46.632.248,00 67.983.800,48 4,14SEK 1.232.074 Ohman Etisk Index Usa 179.089.356,00 273.138.384,86 16,64SEK 691.764 Ohman Penningmarknadsfond 67.418.966,00 66.644.552,14 4,06EUR 43.230 Schroder Intl Emg Europe-Aac 9.416.439,00 12.949.033,03 0,79EUR 16.935 Schroder Itl Us Sm & M -A1e- A 34.144.995,00 45.164.904,65 2,75USD 68.000 Spdr Russell 2000 Us S /C 18.883.078,00 27.192.213,42 1,66SEK 69.641 Tundra Frontier Opps Fd Units Sek 12.500.214,00 14.157.340,64 0,86USD 75.000 Vanguard Ftse Emerging Marke 31.938.993,00 38.284.339,16 2,33USD 477.500 Vanguard S&P 500 Ucits Etf 186.239.949,00 222.128.786,39 13,53SEK 440.000 Xact Fd -Omxs 30 /Lkd Omxs 30 Ind. 75.447.557,00 82.623.200,00 5,03TOTAL INVESTMENT FUNDS 1.319.965.478,00 1.571.462.329,87 95,73
TOTAL INVESTMENTS IN SECURITIES 1.319.965.478,00 1.571.462.329,87 95,73
CASH AT BANKS 73.321.998,29 4,47
OTHER NET (LIABILITIES) (3.266.732,36) (0,20)
TOTAL 1.641.517.595,80 100,00
MOVESTIC SICAV
34
The accompanying notes are an integral part of these financial statements.
The rounding down of the percentages in the calculation can result in marginal rounding differences.

MOVESTIC SICAV - Proaktiv 85 M
STATEMENT OF INVESTMENTS AND OTHER NET ASSETS
as at 30 June 2018
(in SEK)
Currency Quantity Security Cost MarketValue
% of the netassets
INVESTMENT FUNDSSEK 485.441 Aktie-Ansvar Avkastning-A 55.226.223,00 55.553.831,76 9,83SEK 19.765 Alfred Berg Pennmrkfnd Hallb 19.717.958,00 19.533.014,24 3,45SEK 15.752 Didner & Gerge Aktiefond 45.000.000,00 43.865.184,47 7,76SEK 44.659 Didner & Gerge Sm & Mc 7.912.889,00 9.058.159,13 1,60SEK 21.984 Didner & Gerge Smabolag 12.547.956,00 17.281.822,11 3,06EUR 47.353 Fid Pacific -A- Eur /Cap 11.309.644,00 11.073.914,81 1,96SEK 18.480 Handelsbanken Latinamerikafd 4.926.609,00 4.908.560,12 0,87SEK 314.630 Handelsbnkn Kortranta Critr 32.853.563,00 32.831.650,20 5,81USD 34.000 Ishares Core Msci Japan 11.672.625,00 12.954.321,80 2,29EUR 231.356 Jpm Europ Eq Plus-A Perf Aeu 33.394.932,00 40.766.045,51 7,21SEK 294.163 Lannebo Likviditetsfond 33.416.609,00 33.819.888,38 5,98EUR 5.137 Lif St Eu 600 Ucits Etf Cap 7.288.406,00 8.002.161,75 1,42SEK 66.838 Ohman Etisk Emerging Markets 13.000.000,00 12.409.151,62 2,19SEK 143.512 Ohman Etisk Index Japan 11.712.797,00 16.574.242,92 2,93SEK 323.768 Ohman Etisk Index Usa 44.690.848,00 71.776.088,24 12,70SEK 362.999 Ohman Penningmarknadsfond 35.765.701,00 34.971.309,50 6,19EUR 9.434 Schroder Intl Emg Europe-Aac 2.054.948,00 2.825.865,66 0,50EUR 4.738 Schroder Itl Us Sm & M -A1e- A 9.411.808,00 12.636.743,85 2,24USD 15.000 Spdr Russell 2000 Us S /C 4.131.770,00 5.998.282,37 1,06SEK 16.714 Tundra Frontier Opps Fd Units Sek 3.000.215,00 3.397.761,82 0,60USD 18.800 Vanguard Ftse Emerging Marke 8.123.602,00 9.596.607,68 1,70USD 120.000 Vanguard S&P 500 Ucits Etf 47.076.580,00 55.822.941,08 9,87SEK 85.000 Xact Fd -Omxs 30 /Lkd Omxs 30 Ind. 14.272.495,00 15.961.300,00 2,82TOTAL INVESTMENT FUNDS 468.508.178,00 531.618.849,02 94,04
TOTAL INVESTMENTS IN SECURITIES 468.508.178,00 531.618.849,02 94,04
CASH AT BANKS 34.563.797,03 6,11
OTHER NET (LIABILITIES) (895.226,31) (0,16)
TOTAL 565.287.419,74 100,00
MOVESTIC SICAV
35
The accompanying notes are an integral part of these financial statements.
The rounding down of the percentages in the calculation can result in marginal rounding differences.
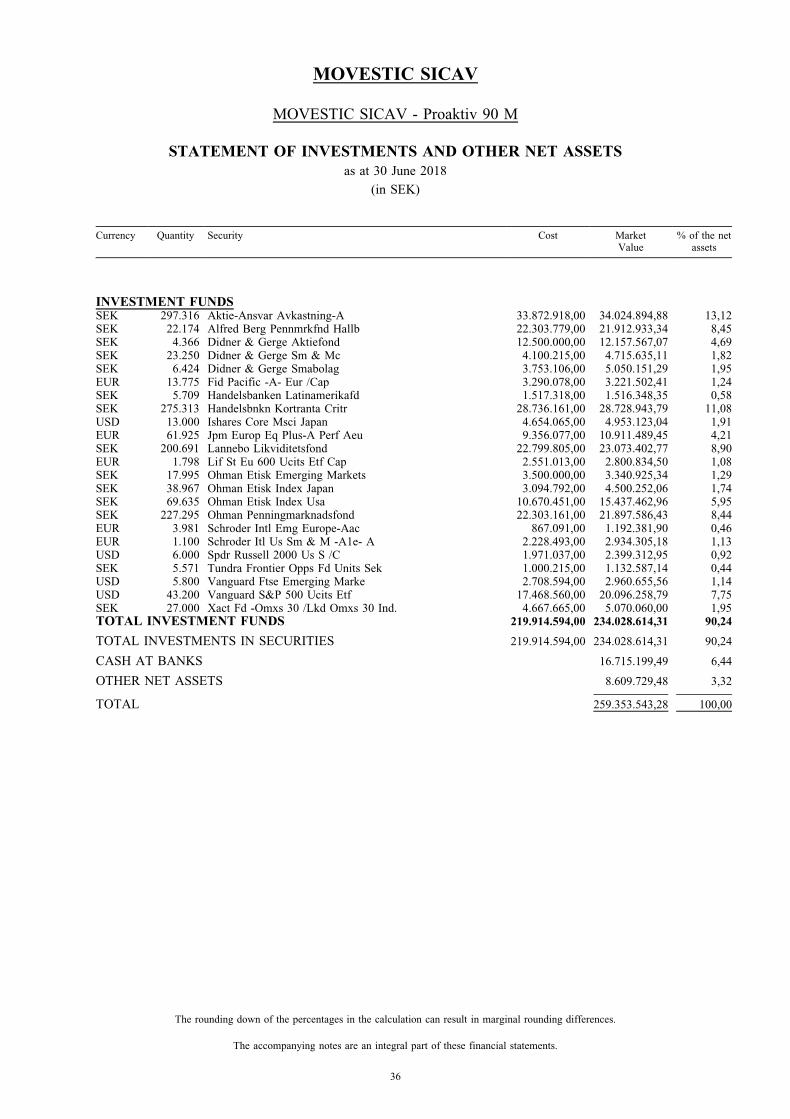
MOVESTIC SICAV - Proaktiv 90 M
STATEMENT OF INVESTMENTS AND OTHER NET ASSETS
as at 30 June 2018
(in SEK)
Currency Quantity Security Cost MarketValue
% of the netassets
INVESTMENT FUNDSSEK 297.316 Aktie-Ansvar Avkastning-A 33.872.918,00 34.024.894,88 13,12SEK 22.174 Alfred Berg Pennmrkfnd Hallb 22.303.779,00 21.912.933,34 8,45SEK 4.366 Didner & Gerge Aktiefond 12.500.000,00 12.157.567,07 4,69SEK 23.250 Didner & Gerge Sm & Mc 4.100.215,00 4.715.635,11 1,82SEK 6.424 Didner & Gerge Smabolag 3.753.106,00 5.050.151,29 1,95EUR 13.775 Fid Pacific -A- Eur /Cap 3.290.078,00 3.221.502,41 1,24SEK 5.709 Handelsbanken Latinamerikafd 1.517.318,00 1.516.348,35 0,58SEK 275.313 Handelsbnkn Kortranta Critr 28.736.161,00 28.728.943,79 11,08USD 13.000 Ishares Core Msci Japan 4.654.065,00 4.953.123,04 1,91EUR 61.925 Jpm Europ Eq Plus-A Perf Aeu 9.356.077,00 10.911.489,45 4,21SEK 200.691 Lannebo Likviditetsfond 22.799.805,00 23.073.402,77 8,90EUR 1.798 Lif St Eu 600 Ucits Etf Cap 2.551.013,00 2.800.834,50 1,08SEK 17.995 Ohman Etisk Emerging Markets 3.500.000,00 3.340.925,34 1,29SEK 38.967 Ohman Etisk Index Japan 3.094.792,00 4.500.252,06 1,74SEK 69.635 Ohman Etisk Index Usa 10.670.451,00 15.437.462,96 5,95SEK 227.295 Ohman Penningmarknadsfond 22.303.161,00 21.897.586,43 8,44EUR 3.981 Schroder Intl Emg Europe-Aac 867.091,00 1.192.381,90 0,46EUR 1.100 Schroder Itl Us Sm & M -A1e- A 2.228.493,00 2.934.305,18 1,13USD 6.000 Spdr Russell 2000 Us S /C 1.971.037,00 2.399.312,95 0,92SEK 5.571 Tundra Frontier Opps Fd Units Sek 1.000.215,00 1.132.587,14 0,44USD 5.800 Vanguard Ftse Emerging Marke 2.708.594,00 2.960.655,56 1,14USD 43.200 Vanguard S&P 500 Ucits Etf 17.468.560,00 20.096.258,79 7,75SEK 27.000 Xact Fd -Omxs 30 /Lkd Omxs 30 Ind. 4.667.665,00 5.070.060,00 1,95TOTAL INVESTMENT FUNDS 219.914.594,00 234.028.614,31 90,24
TOTAL INVESTMENTS IN SECURITIES 219.914.594,00 234.028.614,31 90,24
CASH AT BANKS 16.715.199,49 6,44
OTHER NET ASSETS 8.609.729,48 3,32
TOTAL 259.353.543,28 100,00
MOVESTIC SICAV
36
The accompanying notes are an integral part of these financial statements.
The rounding down of the percentages in the calculation can result in marginal rounding differences.
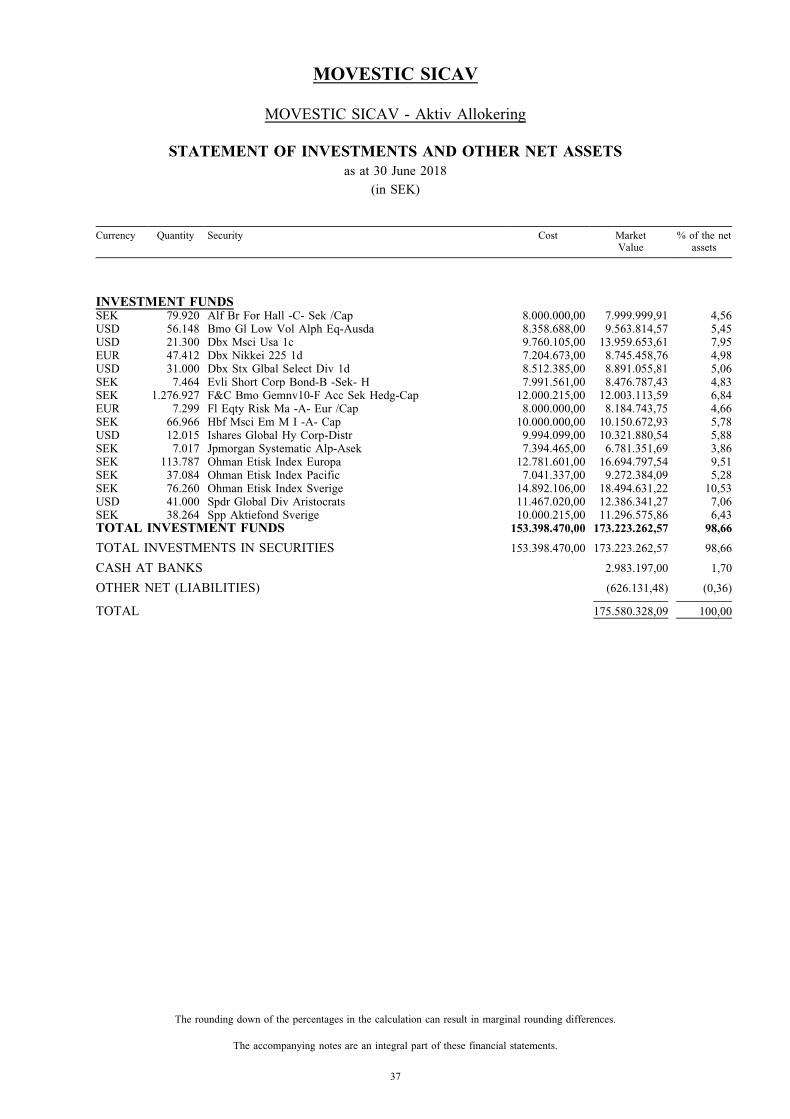
MOVESTIC SICAV - Aktiv Allokering
STATEMENT OF INVESTMENTS AND OTHER NET ASSETS
as at 30 June 2018
(in SEK)
Currency Quantity Security Cost MarketValue
% of the netassets
INVESTMENT FUNDSSEK 79.920 Alf Br For Hall -C- Sek /Cap 8.000.000,00 7.999.999,91 4,56USD 56.148 Bmo Gl Low Vol Alph Eq-Ausda 8.358.688,00 9.563.814,57 5,45USD 21.300 Dbx Msci Usa 1c 9.760.105,00 13.959.653,61 7,95EUR 47.412 Dbx Nikkei 225 1d 7.204.673,00 8.745.458,76 4,98USD 31.000 Dbx Stx Glbal Select Div 1d 8.512.385,00 8.891.055,81 5,06SEK 7.464 Evli Short Corp Bond-B -Sek- H 7.991.561,00 8.476.787,43 4,83SEK 1.276.927 F&C Bmo Gemnv10-F Acc Sek Hedg-Cap 12.000.215,00 12.003.113,59 6,84EUR 7.299 Fl Eqty Risk Ma -A- Eur /Cap 8.000.000,00 8.184.743,75 4,66SEK 66.966 Hbf Msci Em M I -A- Cap 10.000.000,00 10.150.672,93 5,78USD 12.015 Ishares Global Hy Corp-Distr 9.994.099,00 10.321.880,54 5,88SEK 7.017 Jpmorgan Systematic Alp-Asek 7.394.465,00 6.781.351,69 3,86SEK 113.787 Ohman Etisk Index Europa 12.781.601,00 16.694.797,54 9,51SEK 37.084 Ohman Etisk Index Pacific 7.041.337,00 9.272.384,09 5,28SEK 76.260 Ohman Etisk Index Sverige 14.892.106,00 18.494.631,22 10,53USD 41.000 Spdr Global Div Aristocrats 11.467.020,00 12.386.341,27 7,06SEK 38.264 Spp Aktiefond Sverige 10.000.215,00 11.296.575,86 6,43TOTAL INVESTMENT FUNDS 153.398.470,00 173.223.262,57 98,66
TOTAL INVESTMENTS IN SECURITIES 153.398.470,00 173.223.262,57 98,66
CASH AT BANKS 2.983.197,00 1,70
OTHER NET (LIABILITIES) (626.131,48) (0,36)
TOTAL 175.580.328,09 100,00
MOVESTIC SICAV
37
The accompanying notes are an integral part of these financial statements.
The rounding down of the percentages in the calculation can result in marginal rounding differences.
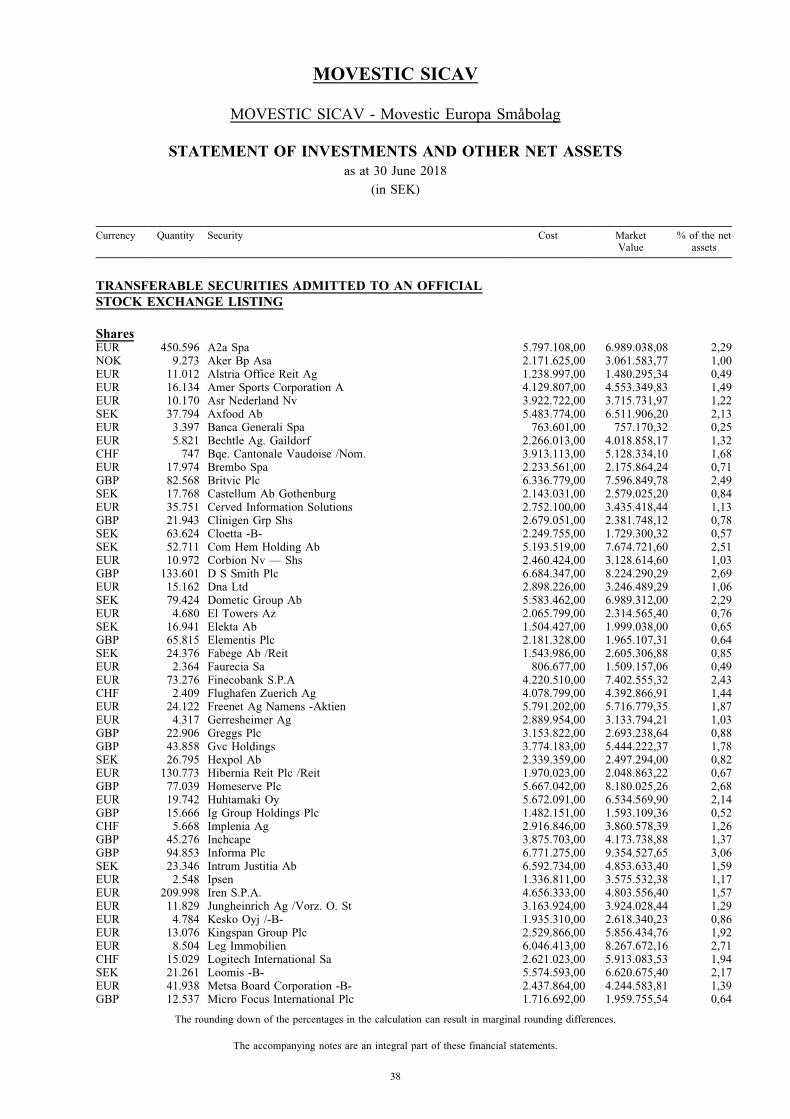
MOVESTIC SICAV - Movestic Europa Smabolag
STATEMENT OF INVESTMENTS AND OTHER NET ASSETS
as at 30 June 2018
(in SEK)
Currency Quantity Security Cost MarketValue
% of the netassets
TRANSFERABLE SECURITIES ADMITTED TO AN OFFICIAL
STOCK EXCHANGE LISTING
SharesEUR 450.596 A2a Spa 5.797.108,00 6.989.038,08 2,29NOK 9.273 Aker Bp Asa 2.171.625,00 3.061.583,77 1,00EUR 11.012 Alstria Office Reit Ag 1.238.997,00 1.480.295,34 0,49EUR 16.134 Amer Sports Corporation A 4.129.807,00 4.553.349,83 1,49EUR 10.170 Asr Nederland Nv 3.922.722,00 3.715.731,97 1,22SEK 37.794 Axfood Ab 5.483.774,00 6.511.906,20 2,13EUR 3.397 Banca Generali Spa 763.601,00 757.170,32 0,25EUR 5.821 Bechtle Ag. Gaildorf 2.266.013,00 4.018.858,17 1,32CHF 747 Bqe. Cantonale Vaudoise /Nom. 3.913.113,00 5.128.334,10 1,68EUR 17.974 Brembo Spa 2.233.561,00 2.175.864,24 0,71GBP 82.568 Britvic Plc 6.336.779,00 7.596.849,78 2,49SEK 17.768 Castellum Ab Gothenburg 2.143.031,00 2.579.025,20 0,84EUR 35.751 Cerved Information Solutions 2.752.100,00 3.435.418,44 1,13GBP 21.943 Clinigen Grp Shs 2.679.051,00 2.381.748,12 0,78SEK 63.624 Cloetta -B- 2.249.755,00 1.729.300,32 0,57SEK 52.711 Com Hem Holding Ab 5.193.519,00 7.674.721,60 2,51EUR 10.972 Corbion Nv — Shs 2.460.424,00 3.128.614,60 1,03GBP 133.601 D S Smith Plc 6.684.347,00 8.224.290,29 2,69EUR 15.162 Dna Ltd 2.898.226,00 3.246.489,29 1,06SEK 79.424 Dometic Group Ab 5.583.462,00 6.989.312,00 2,29EUR 4.680 El Towers Az 2.065.799,00 2.314.565,40 0,76SEK 16.941 Elekta Ab 1.504.427,00 1.999.038,00 0,65GBP 65.815 Elementis Plc 2.181.328,00 1.965.107,31 0,64SEK 24.376 Fabege Ab /Reit 1.543.986,00 2.605.306,88 0,85EUR 2.364 Faurecia Sa 806.677,00 1.509.157,06 0,49EUR 73.276 Finecobank S.P.A 4.220.510,00 7.402.555,32 2,43CHF 2.409 Flughafen Zuerich Ag 4.078.799,00 4.392.866,91 1,44EUR 24.122 Freenet Ag Namens -Aktien 5.791.202,00 5.716.779,35 1,87EUR 4.317 Gerresheimer Ag 2.889.954,00 3.133.794,21 1,03GBP 22.906 Greggs Plc 3.153.822,00 2.693.238,64 0,88GBP 43.858 Gvc Holdings 3.774.183,00 5.444.222,37 1,78SEK 26.795 Hexpol Ab 2.339.359,00 2.497.294,00 0,82EUR 130.773 Hibernia Reit Plc /Reit 1.970.023,00 2.048.863,22 0,67GBP 77.039 Homeserve Plc 5.667.042,00 8.180.025,26 2,68EUR 19.742 Huhtamaki Oy 5.672.091,00 6.534.569,90 2,14GBP 15.666 Ig Group Holdings Plc 1.482.151,00 1.593.109,36 0,52CHF 5.668 Implenia Ag 2.916.846,00 3.860.578,39 1,26GBP 45.276 Inchcape 3.875.703,00 4.173.738,88 1,37GBP 94.853 Informa Plc 6.771.275,00 9.354.527,65 3,06SEK 23.346 Intrum Justitia Ab 6.592.734,00 4.853.633,40 1,59EUR 2.548 Ipsen 1.336.811,00 3.575.532,38 1,17EUR 209.998 Iren S.P.A. 4.656.333,00 4.803.556,40 1,57EUR 11.829 Jungheinrich Ag /Vorz. O. St 3.163.924,00 3.924.028,44 1,29EUR 4.784 Kesko Oyj /-B- 1.935.310,00 2.618.340,23 0,86EUR 13.076 Kingspan Group Plc 2.529.866,00 5.856.434,76 1,92EUR 8.504 Leg Immobilien 6.046.413,00 8.267.672,16 2,71CHF 15.029 Logitech International Sa 2.621.023,00 5.913.083,53 1,94SEK 21.261 Loomis -B- 5.574.593,00 6.620.675,40 2,17EUR 41.938 Metsa Board Corporation -B- 2.437.864,00 4.244.583,81 1,39GBP 12.537 Micro Focus International Plc 1.716.692,00 1.959.755,54 0,64
MOVESTIC SICAV
38
The accompanying notes are an integral part of these financial statements.
The rounding down of the percentages in the calculation can result in marginal rounding differences.
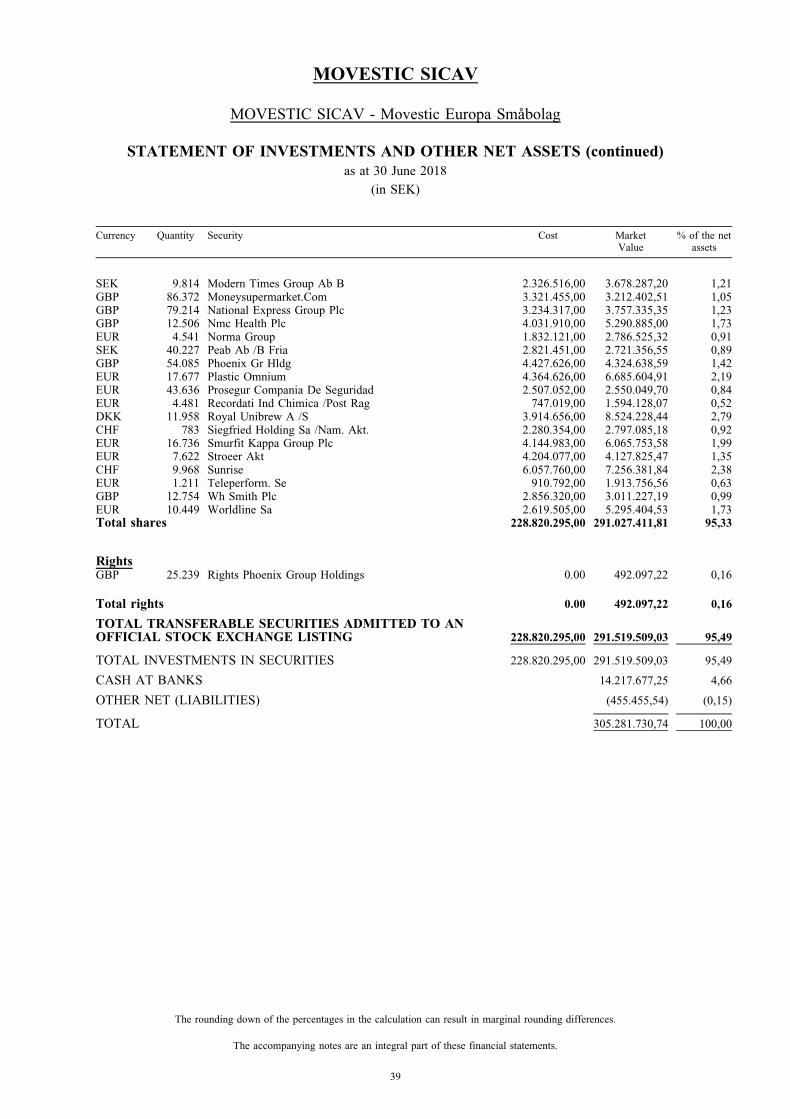
Currency Quantity Security Cost MarketValue
% of the netassets
SEK 9.814 Modern Times Group Ab B 2.326.516,00 3.678.287,20 1,21GBP 86.372 Moneysupermarket.Com 3.321.455,00 3.212.402,51 1,05GBP 79.214 National Express Group Plc 3.234.317,00 3.757.335,35 1,23GBP 12.506 Nmc Health Plc 4.031.910,00 5.290.885,00 1,73EUR 4.541 Norma Group 1.832.121,00 2.786.525,32 0,91SEK 40.227 Peab Ab /B Fria 2.821.451,00 2.721.356,55 0,89GBP 54.085 Phoenix Gr Hldg 4.427.626,00 4.324.638,59 1,42EUR 17.677 Plastic Omnium 4.364.626,00 6.685.604,91 2,19EUR 43.636 Prosegur Compania De Seguridad 2.507.052,00 2.550.049,70 0,84EUR 4.481 Recordati Ind Chimica /Post Rag 747.019,00 1.594.128,07 0,52DKK 11.958 Royal Unibrew A /S 3.914.656,00 8.524.228,44 2,79CHF 783 Siegfried Holding Sa /Nam. Akt. 2.280.354,00 2.797.085,18 0,92EUR 16.736 Smurfit Kappa Group Plc 4.144.983,00 6.065.753,58 1,99EUR 7.622 Stroeer Akt 4.204.077,00 4.127.825,47 1,35CHF 9.968 Sunrise 6.057.760,00 7.256.381,84 2,38EUR 1.211 Teleperform. Se 910.792,00 1.913.756,56 0,63GBP 12.754 Wh Smith Plc 2.856.320,00 3.011.227,19 0,99EUR 10.449 Worldline Sa 2.619.505,00 5.295.404,53 1,73Total shares 228.820.295,00 291.027.411,81 95,33
RightsGBP 25.239 Rights Phoenix Group Holdings 0.00 492.097,22 0,16
Total rights 0.00 492.097,22 0,16
TOTAL TRANSFERABLE SECURITIES ADMITTED TO ANOFFICIAL STOCK EXCHANGE LISTING 228.820.295,00 291.519.509,03 95,49
TOTAL INVESTMENTS IN SECURITIES 228.820.295,00 291.519.509,03 95,49
CASH AT BANKS 14.217.677,25 4,66
OTHER NET (LIABILITIES) (455.455,54) (0,15)
TOTAL 305.281.730,74 100,00
MOVESTIC SICAV
39
The accompanying notes are an integral part of these financial statements.
The rounding down of the percentages in the calculation can result in marginal rounding differences.
MOVESTIC SICAV - Movestic Europa Smabolag
STATEMENT OF INVESTMENTS AND OTHER NET ASSETS (continued)
as at 30 June 2018
(in SEK)
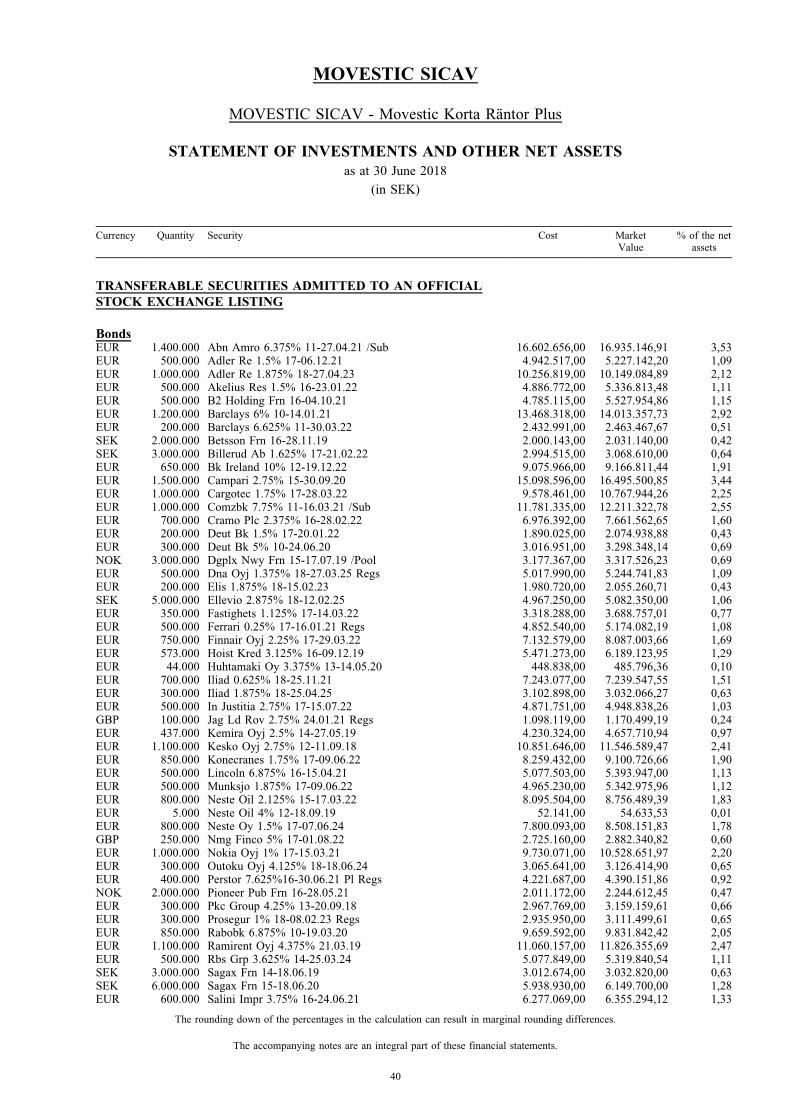
MOVESTIC SICAV - Movestic Korta Rantor Plus
STATEMENT OF INVESTMENTS AND OTHER NET ASSETS
as at 30 June 2018
(in SEK)
Currency Quantity Security Cost MarketValue
% of the netassets
TRANSFERABLE SECURITIES ADMITTED TO AN OFFICIAL
STOCK EXCHANGE LISTING
BondsEUR 1.400.000 Abn Amro 6.375% 11-27.04.21 /Sub 16.602.656,00 16.935.146,91 3,53EUR 500.000 Adler Re 1.5% 17-06.12.21 4.942.517,00 5.227.142,20 1,09EUR 1.000.000 Adler Re 1.875% 18-27.04.23 10.256.819,00 10.149.084,89 2,12EUR 500.000 Akelius Res 1.5% 16-23.01.22 4.886.772,00 5.336.813,48 1,11EUR 500.000 B2 Holding Frn 16-04.10.21 4.785.115,00 5.527.954,86 1,15EUR 1.200.000 Barclays 6% 10-14.01.21 13.468.318,00 14.013.357,73 2,92EUR 200.000 Barclays 6.625% 11-30.03.22 2.432.991,00 2.463.467,67 0,51SEK 2.000.000 Betsson Frn 16-28.11.19 2.000.143,00 2.031.140,00 0,42SEK 3.000.000 Billerud Ab 1.625% 17-21.02.22 2.994.515,00 3.068.610,00 0,64EUR 650.000 Bk Ireland 10% 12-19.12.22 9.075.966,00 9.166.811,44 1,91EUR 1.500.000 Campari 2.75% 15-30.09.20 15.098.596,00 16.495.500,85 3,44EUR 1.000.000 Cargotec 1.75% 17-28.03.22 9.578.461,00 10.767.944,26 2,25EUR 1.000.000 Comzbk 7.75% 11-16.03.21 /Sub 11.781.335,00 12.211.322,78 2,55EUR 700.000 Cramo Plc 2.375% 16-28.02.22 6.976.392,00 7.661.562,65 1,60EUR 200.000 Deut Bk 1.5% 17-20.01.22 1.890.025,00 2.074.938,88 0,43EUR 300.000 Deut Bk 5% 10-24.06.20 3.016.951,00 3.298.348,14 0,69NOK 3.000.000 Dgplx Nwy Frn 15-17.07.19 /Pool 3.177.367,00 3.317.526,23 0,69EUR 500.000 Dna Oyj 1.375% 18-27.03.25 Regs 5.017.990,00 5.244.741,83 1,09EUR 200.000 Elis 1.875% 18-15.02.23 1.980.720,00 2.055.260,71 0,43SEK 5.000.000 Ellevio 2.875% 18-12.02.25 4.967.250,00 5.082.350,00 1,06EUR 350.000 Fastighets 1.125% 17-14.03.22 3.318.288,00 3.688.757,01 0,77EUR 500.000 Ferrari 0.25% 17-16.01.21 Regs 4.852.540,00 5.174.082,19 1,08EUR 750.000 Finnair Oyj 2.25% 17-29.03.22 7.132.579,00 8.087.003,66 1,69EUR 573.000 Hoist Kred 3.125% 16-09.12.19 5.471.273,00 6.189.123,95 1,29EUR 44.000 Huhtamaki Oy 3.375% 13-14.05.20 448.838,00 485.796,36 0,10EUR 700.000 Iliad 0.625% 18-25.11.21 7.243.077,00 7.239.547,55 1,51EUR 300.000 Iliad 1.875% 18-25.04.25 3.102.898,00 3.032.066,27 0,63EUR 500.000 In Justitia 2.75% 17-15.07.22 4.871.751,00 4.948.838,26 1,03GBP 100.000 Jag Ld Rov 2.75% 24.01.21 Regs 1.098.119,00 1.170.499,19 0,24EUR 437.000 Kemira Oyj 2.5% 14-27.05.19 4.230.324,00 4.657.710,94 0,97EUR 1.100.000 Kesko Oyj 2.75% 12-11.09.18 10.851.646,00 11.546.589,47 2,41EUR 850.000 Konecranes 1.75% 17-09.06.22 8.259.432,00 9.100.726,66 1,90EUR 500.000 Lincoln 6.875% 16-15.04.21 5.077.503,00 5.393.947,00 1,13EUR 500.000 Munksjo 1.875% 17-09.06.22 4.965.230,00 5.342.975,96 1,12EUR 800.000 Neste Oil 2.125% 15-17.03.22 8.095.504,00 8.756.489,39 1,83EUR 5.000 Neste Oil 4% 12-18.09.19 52.141,00 54.633,53 0,01EUR 800.000 Neste Oy 1.5% 17-07.06.24 7.800.093,00 8.508.151,83 1,78GBP 250.000 Nmg Finco 5% 17-01.08.22 2.725.160,00 2.882.340,82 0,60EUR 1.000.000 Nokia Oyj 1% 17-15.03.21 9.730.071,00 10.528.651,97 2,20EUR 300.000 Outoku Oyj 4.125% 18-18.06.24 3.065.641,00 3.126.414,90 0,65EUR 400.000 Perstor 7.625%16-30.06.21 Pl Regs 4.221.687,00 4.390.151,86 0,92NOK 2.000.000 Pioneer Pub Frn 16-28.05.21 2.011.172,00 2.244.612,45 0,47EUR 300.000 Pkc Group 4.25% 13-20.09.18 2.967.769,00 3.159.159,61 0,66EUR 300.000 Prosegur 1% 18-08.02.23 Regs 2.935.950,00 3.111.499,61 0,65EUR 850.000 Rabobk 6.875% 10-19.03.20 9.659.592,00 9.831.842,42 2,05EUR 1.100.000 Ramirent Oyj 4.375% 21.03.19 11.060.157,00 11.826.355,69 2,47EUR 500.000 Rbs Grp 3.625% 14-25.03.24 5.077.849,00 5.319.840,54 1,11SEK 3.000.000 Sagax Frn 14-18.06.19 3.012.674,00 3.032.820,00 0,63SEK 6.000.000 Sagax Frn 15-18.06.20 5.938.930,00 6.149.700,00 1,28EUR 600.000 Salini Impr 3.75% 16-24.06.21 6.277.069,00 6.355.294,12 1,33
MOVESTIC SICAV
40
The accompanying notes are an integral part of these financial statements.
The rounding down of the percentages in the calculation can result in marginal rounding differences.

Currency Quantity Security Cost MarketValue
% of the netassets
EUR 500.000 Sanoma 3.5% 16-27.11.19 4.685.665,00 5.465.285,55 1,14EUR 700.000 Sato 3.375% 12-16.04.19 6.981.658,00 7.488.135,79 1,56EUR 500.000 Sixt Leas 1.125% 17-03.02.21 Regs 4.677.192,00 5.262.445,91 1,10EUR 475.000 Sponda 3.375% 13-09.10.18 4.681.364,00 4.996.446,04 1,04EUR 250.000 Suominen 2.5% 17-03.10.22 2.383.195,00 2.627.541,13 0,55EUR 500.000 Tdc 3.75% 12-02.03.22 5.450.313,00 5.480.117,29 1,14EUR 585.000 Technopolis 3.75% 15-28.05.20 5.748.958,00 6.217.186,64 1,30EUR 350.000 Telecom It 3.25% 15-16.01.23 3.918.595,00 3.871.103,80 0,81GBP 350.000 Telecom Italia 6.375% 04-24.06.19 4.274.713,00 4.308.481,82 0,90EUR 500.000 Teva Pharm 0.375% 16-25.07.20 4.690.704,00 5.087.598,55 1,06EUR 500.000 Tornator Fin 3.125% 12-19.12.19 4.914.789,00 5.434.838,72 1,13EUR 600.000 Tvo Power 2% 18-08.05.24 6.210.978,00 6.264.862,31 1,31EUR 300.000 Tvo Power 2.625% 16-13.01.23 2.942.483,00 3.279.672,69 0,68SEK 3.000.000 Tvo Power 5.3% 09-30.10.19 3.292.715,00 3.188.850,00 0,67EUR 200.000 Ubisoft Ent 1.289% 18-30.01.23 1.964.599,00 2.093.447,21 0,44EUR 500.000 Vestas Wind 2.75% 15-11.03.22 5.313.109,00 5.527.119,27 1,15EUR 500.000 Volvo Car A 3.25% 16-18.05.21 4.871.348,00 5.531.715,02 1,15EUR 500.000 Wind Tre Sp 2.625% 17-20.01.23 4.930.693,00 4.380.323,23 0,91Total bonds 372.418.927,00 393.969.819,69 82,18
TOTAL TRANSFERABLE SECURITIES ADMITTED TO ANOFFICIAL STOCK EXCHANGE LISTING 372.418.927,00 393.969.819,69 82,18
TRANSFERABLE SECURITIES DEALT IN ON ANOTHER REGULATED MARKET
BondsEUR 700.000 B2 Holding Frn 17-14.11.22 7.084.440,00 7.185.881,74 1,50EUR 300.000 B2 Holding Frn 18-23.05.23 3.097.129,00 3.091.320,09 0,64EUR 300.000 Dkt Finance 7% 18-17.06.23 Regs 3.102.287,00 3.167.431,96 0,66EUR 750.000 Hkscan Corp 2.625% 17-21.09.22 7.150.328,00 7.508.174,30 1,57EUR 400.000 Marine Harv Frn 18-12.06.23 4.123.715,00 4.190.153,22 0,87SEK 7.000.000 Norcell Swe 3.5% 16-25.02.22 7.305.000,00 7.236.110,00 1,51SEK 5.000.000 Sas 5.375% 17-24.11.22 5.125.000,00 5.108.350,00 1,07EUR 900.000 Sponda 2.375% 15-20.05.20 8.851.029,00 9.559.346,89 1,99EUR 600.000 Vvo-Yhtyma 3.25% 13-29.05.20 6.366.995,00 6.625.774,83 1,38Total bonds 52.205.923,00 53.672.543,03 11,19
TOTAL TRANSFERABLE SECURITIES DEALT IN ON ANOTHERREGULATED MARKET 52.205.923,00 53.672.543,03 11,19
OTHER TRANSFERABLE SECURITIES
BondsNOK 3.000.000 Aker Soluti Frn 18-25.07.22 3.043.170,00 3.322.663,04 0,69NOK 3.000.000 Aker Asa Frn 18-31.01.23 3.064.470,00 3.268.133,78 0,68SEK 2.000.000 Samhallsbyg Frn 18-29.01.21 2.000.000,00 2.012.500,00 0,42EUR 100.000 Cibus Nord Frn 18-26.05.21 1.004.648,00 1.049.710,84 0,22EUR 200.000 Catena Frn 18-02.03.21 1.982.045,00 2.075.398,45 0,43EUR 500.000 Yit Oyj 3.15% 18-11.06.21 5.123.870,00 5.246.621,91 1,10SEK 1.000.000 Ica Gruppen 0.465% 18-15.01.21 1.000.000,00 1.001.120,00 0,21
MOVESTIC SICAV
41
The accompanying notes are an integral part of these financial statements.
The rounding down of the percentages in the calculation can result in marginal rounding differences.
MOVESTIC SICAV - Movestic Korta Rantor Plus
STATEMENT OF INVESTMENTS AND OTHER NET ASSETS (continued)
as at 30 June 2018
(in SEK)

Currency Quantity Security Cost MarketValue
% of the netassets
SEK 4.000.000 Norldia Hc Frn 16-20.12.21 4.000.215,00 3.826.680,00 0,80NOK 3.000.000 Laeringsver Frn 17-01.06.22 3.127.021,00 3.301.062,08 0,69SEK 3.000.000 La Hedin Frn 17-05.10.22 3.000.000,00 2.989.530,00 0,62Total bonds 27.345.439,00 28.093.420,10 5,86
TOTAL OTHER TRANSFERABLE SECURITIES 27.345.439,00 28.093.420,10 5,86
TOTAL INVESTMENTS IN SECURITIES 451.970.289,00 475.735.782,82 99,23
CASH AT BANKS 10.796.115,17 2,25
OTHER NET ASSETS (7.116.249,75) (1,48)
TOTAL 479.415.648,24 100,00
FORWARD FOREIGN EXCHANGE CONTRACTS
As at 30 June 2018, the sub-fund MOVESTIC SICAV - Movestic Korta Rantor Plus has the following forward foreignexchange contracts outstanding:
Currency purchased Purchase Currency sold Sale Maturity Unrealised
appreciation/
(depreciation)
(in SEK)
EUR 2.000.000,00 SEK 20.422.150,00 07/09/2018 466.110,00
SEK 15.052.100,00 NOK 14.000.000,00 07/09/2018 (275.185,79)
SEK 441.173.817,00 EUR 43.050.000,00 07/09/2018 (8.446.589,27)
SEK 8.881.930,00 GBP 760.000,00 07/09/2018 (74.181,65)
(8.329.846,71)
MOVESTIC SICAV
42
The accompanying notes are an integral part of these financial statements.
The rounding down of the percentages in the calculation can result in marginal rounding differences.
MOVESTIC SICAV - Movestic Korta Rantor Plus
STATEMENT OF INVESTMENTS AND OTHER NET ASSETS (continued)
as at 30 June 2018
(in SEK)

MOVESTIC SICAV - Movestic Sverige
STATEMENT OF INVESTMENTS AND OTHER NET ASSETS
as at 30 June 2018
(in SEK)
Currency Quantity Security Cost MarketValue
% of the netassets
TRANSFERABLE SECURITIES ADMITTED TO AN OFFICIAL
STOCK EXCHANGE LISTING
SharesSEK 94.000 Abb Ltd Zuerich /Namen. 19.086.499,00 18.395.800,00 3,92SEK 35.000 Astrazeneca Plc 18.756.939,00 22.043.000,00 4,69SEK 10.000 Atlas Copco Ab 2.367.209,00 2.346.500,00 0,50SEK 21.700 Autoliv Inc /Swedish Dept. Recpt 16.596.566,00 20.003.060,00 4,26SEK 96.000 Electrolux Ab B 22.147.045,00 19.584.000,00 4,17SEK 150.000 Epiroc Aktiebolag 12.317.921,00 12.300.000,00 2,62SEK 260.000 Ericsson Tel. B 15.533.858,00 18.007.600,00 3,83SEK 222.500 Hennes & Mauritz Ab 47.210.623,00 29.703.750,00 6,32SEK 17.000 Ica Gruppen Ab 4.629.213,00 4.669.900,00 0,99SEK 96.000 Investor Ab B 36.537.332,00 35.030.400,00 7,46SEK 1.650.000 Net Insight Ab B 9.313.836,00 6.930.000,00 1,48SEK 188.415 Nobia Ab 15.009.635,00 12.991.214,25 2,77EUR 370.000 Nokia Oy 15.830.374,00 19.092.000,00 4,06SEK 255.000 Nordea Bank Ab 23.585.008,00 22.001.400,00 4,68SEK 55.000 Saab Ab B 15.955.701,00 20.460.000,00 4,36SEK 30.000 Sandvik Ab 4.537.224,00 4.770.000,00 1,02SEK 150.000 Securitas Ab B 21.385.015,00 22.117.500,00 4,71SEK 260.000 Skandinav. Ensk. Banken A 23.531.616,00 22.141.600,00 4,71SEK 132.000 Skanska B 24.670.639,00 21.489.600,00 4,58SEK 70.000 Skf Ab B 12.005.906,00 11.669.000,00 2,48SEK 137.000 Swedbank Ab -A- 27.358.392,00 26.276.600,00 5,59SEK 18.000 Swedish Orphan Biovitrum Ab 1.866.008,00 3.518.100,00 0,75SEK 39.500 Tele2 Ak B 3.707.325,00 4.159.350,00 0,89SEK 780.000 Teliasonera Ab 29.658.881,00 31.948.800,00 6,80SEK 20.500 Veoneer Inc/ Swdh Dep Rec 5.702.031,00 6.492.350,00 1,38SEK 236.000 Volvo B 27.898.261,00 33.795.200,00 7,19Total shares 457.199.057,00 451.936.724,25 96,21
TOTAL TRANSFERABLE SECURITIES ADMITTED TO ANOFFICIAL STOCK EXCHANGE LISTING 457.199.057,00 451.936.724,25 96,21
TOTAL INVESTMENTS IN SECURITIES 457.199.057,00 451.936.724,25 96,21
CASH AT BANKS 24.518.217,42 5,22
OTHER NET (LIABILITIES) (6.691.896,37) (1,42)
TOTAL 469.763.045,30 100,00
MOVESTIC SICAV
43
The accompanying notes are an integral part of these financial statements.
The rounding down of the percentages in the calculation can result in marginal rounding differences.

CONTRACTS FOR DIFFERENCES
As at 30 June 2018, the sub-fund MOVESTIC SICAV - Movestic Sverige has the following contracts for difference contracts
outstanding:
Quantity Description Currency
Commitment
(in currency)
Net unrealised
appreciation/
(depreciation)
(in SEK)
(28.000,00) ASSA ABLOY AB SEK 2.919.600,00 (36.400,00)
(40.000,00) AXFOOD AB SEK 6.892.000,00 (354.000,00)
(30.000,00) SVENSKA CELLUL.-B- SEK 5.345.200,00 10.800,00
(379.600,00)
MOVESTIC SICAV
44
The accompanying notes are an integral part of these financial statements.
The rounding down of the percentages in the calculation can result in marginal rounding differences.
MOVESTIC SICAV - Movestic Sverige
STATEMENT OF INVESTMENTS AND OTHER NET ASSETS (continued)
as at 30 June 2018
(in SEK)

MOVESTIC SICAV - Ascensus Trend Movestic
STATEMENT OF INVESTMENTS AND OTHER NET ASSETS
as at 30 June 2018
(in SEK)
Currency Quantity Security Cost MarketValue
% of the netassets
INVESTMENT FUNDSSEK 93.036 Han Eur Index -Ackumulerande- 11.100.000,00 11.058.260,74 7,63SEK 64.222 Hande Usa Index -A1- Sek /Cap 20.900.000,00 22.365.437,91 15,42SEK 51.079 Ohman Etisk Emerging Markets 8.043.103,00 9.483.324,36 6,54SEK 119.540 Ohman Etisk Index Europa 15.903.648,00 17.538.941,08 12,09SEK 75.630 Ohman Etisk Index Sverige 18.721.179,00 18.341.721,39 12,65SEK 86.406 Ohman Etisk Index Usa 15.534.650,00 19.155.437,03 13,21SEK 56.496 Ohman Foretagsobligationsfon 6.607.411,00 6.715.065,35 4,63EUR 2.093 Schroder Itl Us Sm & M -A1e- A 4.561.750,00 5.581.348,58 3,85SEK 144.547 Seb Ps Nc St R -Sek- I (Acc)- Cap 15.000.000,00 15.044.465,29 10,37SEK 49.930 Seb Ps Nc Tr Bd -Sek-I (Acc)- Cap 5.000.000,00 4.990.513,20 3,44USD 9.854 Spdr Russell 2000 Us S /C 3.350.489,00 3.940.471,63 2,72TOTAL INVESTMENT FUNDS 124.722.230,00 134.214.986,56 92,55
TOTAL INVESTMENTS IN SECURITIES 124.722.230,00 134.214.986,56 92,55
CASH AT BANKS 11.497.436,61 7,93
OTHER NET (LIABILITIES) (687.292,94) (0,47)
TOTAL 145.025.130,23 100,00
MOVESTIC SICAV
45
The accompanying notes are an integral part of these financial statements.
The rounding down of the percentages in the calculation can result in marginal rounding differences.

MOVESTIC SICAV - Ascensus Offensiv Movestic
STATEMENT OF INVESTMENTS AND OTHER NET ASSETS
as at 30 June 2018
(in SEK)
Currency Quantity Security Cost MarketValue
% of the netassets
INVESTMENT FUNDSSEK 8.094 Didner & Gerge Aktiefond 19.149.945,00 22.540.439,26 10,55SEK 0.00 Didner & Gerge Smabolag 1,00 0,79 0.00SEK 133.869 Han Eur Index -Ackumulerande- 16.000.000,00 15.911.630,47 7,45SEK 95.080 Hande Usa Index -A1- Sek /Cap 31.000.000,00 33.111.774,37 15,51SEK 66.784 Ohman Etisk Emerging Markets 9.207.548,00 12.399.192,08 5,81SEK 235.184 Ohman Etisk Index Europa 31.035.891,00 34.506.154,66 16,16SEK 42.952 Ohman Etisk Index Japan 5.000.000,00 4.960.484,44 2,32SEK 97.726 Ohman Etisk Index Sverige 23.672.008,00 23.700.412,75 11,10SEK 167.713 Ohman Etisk Index Usa 26.785.418,00 37.180.196,98 17,41EUR 4.908 Schroder Itl Us Sm & M -A1e- A 10.711.489,00 13.090.879,36 6,13SEK 48.766 Seb Ps Nc St R -Sek- I (Acc)- Cap 5.000.000,00 5.075.587,55 2,38USD 11.985 Spdr Russell 2000 Us S /C 4.075.010,00 4.792.627,61 2,24TOTAL INVESTMENT FUNDS 181.637.310,00 207.269.380,32 97,06
TOTAL INVESTMENTS IN SECURITIES 181.637.310,00 207.269.380,32 97,06
CASH AT BANKS 7.449.053,73 3,49
OTHER NET (LIABILITIES) (1.179.922,98) (0,55)
TOTAL 213.538.511,07 100,00
MOVESTIC SICAV
46
The accompanying notes are an integral part of these financial statements.
The rounding down of the percentages in the calculation can result in marginal rounding differences.
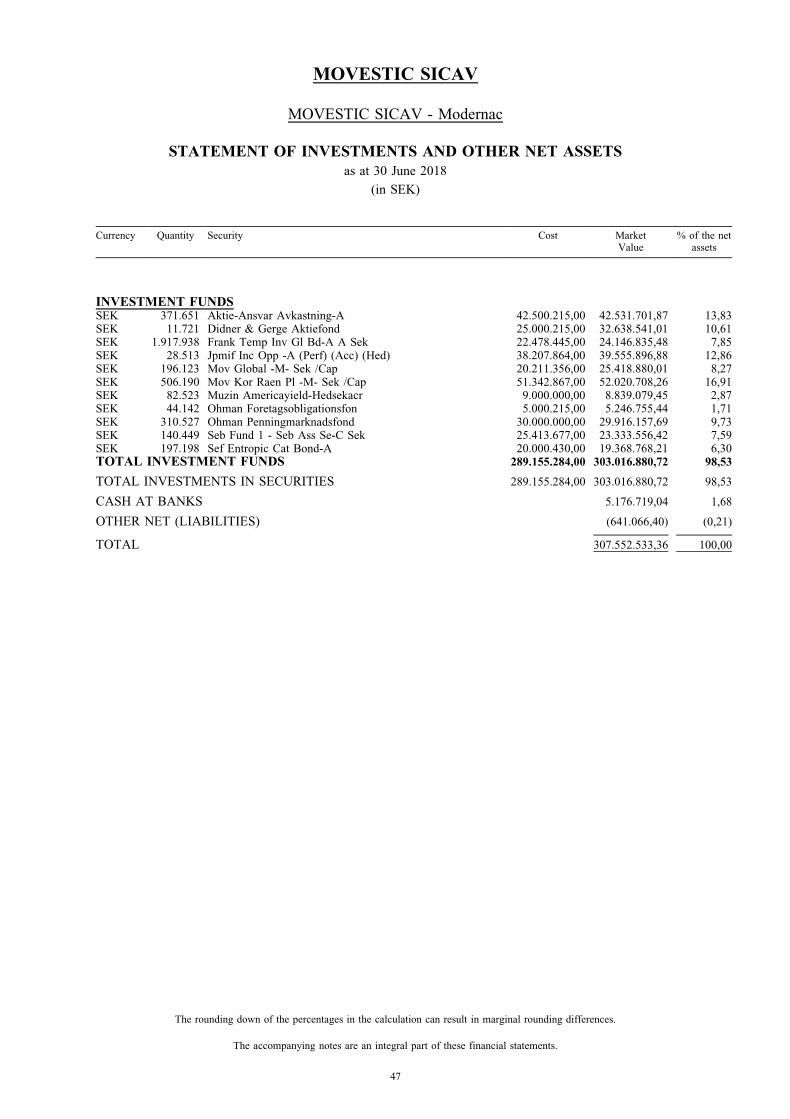
MOVESTIC SICAV - Modernac
STATEMENT OF INVESTMENTS AND OTHER NET ASSETS
as at 30 June 2018
(in SEK)
Currency Quantity Security Cost MarketValue
% of the netassets
INVESTMENT FUNDSSEK 371.651 Aktie-Ansvar Avkastning-A 42.500.215,00 42.531.701,87 13,83SEK 11.721 Didner & Gerge Aktiefond 25.000.215,00 32.638.541,01 10,61SEK 1.917.938 Frank Temp Inv Gl Bd-A A Sek 22.478.445,00 24.146.835,48 7,85SEK 28.513 Jpmif Inc Opp -A (Perf) (Acc) (Hed) 38.207.864,00 39.555.896,88 12,86SEK 196.123 Mov Global -M- Sek /Cap 20.211.356,00 25.418.880,01 8,27SEK 506.190 Mov Kor Raen Pl -M- Sek /Cap 51.342.867,00 52.020.708,26 16,91SEK 82.523 Muzin Americayield-Hedsekacr 9.000.000,00 8.839.079,45 2,87SEK 44.142 Ohman Foretagsobligationsfon 5.000.215,00 5.246.755,44 1,71SEK 310.527 Ohman Penningmarknadsfond 30.000.000,00 29.916.157,69 9,73SEK 140.449 Seb Fund 1 - Seb Ass Se-C Sek 25.413.677,00 23.333.556,42 7,59SEK 197.198 Sef Entropic Cat Bond-A 20.000.430,00 19.368.768,21 6,30TOTAL INVESTMENT FUNDS 289.155.284,00 303.016.880,72 98,53
TOTAL INVESTMENTS IN SECURITIES 289.155.284,00 303.016.880,72 98,53
CASH AT BANKS 5.176.719,04 1,68
OTHER NET (LIABILITIES) (641.066,40) (0,21)
TOTAL 307.552.533,36 100,00
MOVESTIC SICAV
47
The accompanying notes are an integral part of these financial statements.
The rounding down of the percentages in the calculation can result in marginal rounding differences.
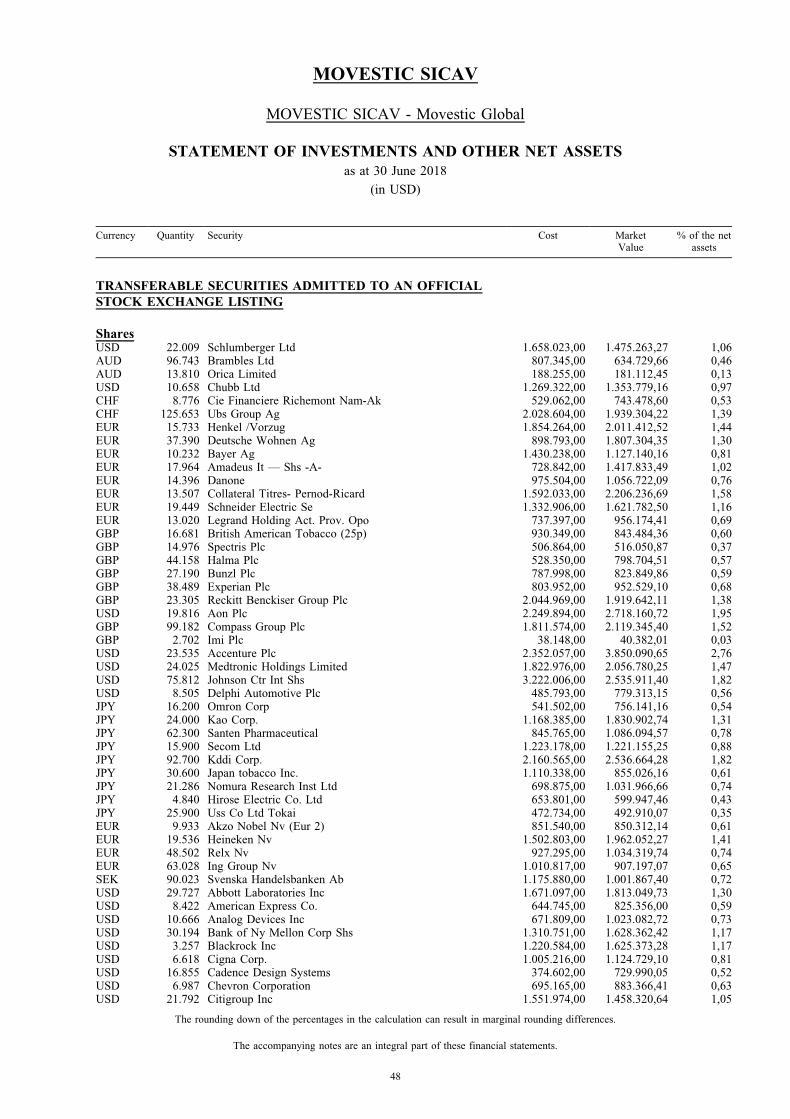
MOVESTIC SICAV - Movestic Global
STATEMENT OF INVESTMENTS AND OTHER NET ASSETS
as at 30 June 2018
(in USD)
Currency Quantity Security Cost MarketValue
% of the netassets
TRANSFERABLE SECURITIES ADMITTED TO AN OFFICIAL
STOCK EXCHANGE LISTING
SharesUSD 22.009 Schlumberger Ltd 1.658.023,00 1.475.263,27 1,06AUD 96.743 Brambles Ltd 807.345,00 634.729,66 0,46AUD 13.810 Orica Limited 188.255,00 181.112,45 0,13USD 10.658 Chubb Ltd 1.269.322,00 1.353.779,16 0,97CHF 8.776 Cie Financiere Richemont Nam-Ak 529.062,00 743.478,60 0,53CHF 125.653 Ubs Group Ag 2.028.604,00 1.939.304,22 1,39EUR 15.733 Henkel /Vorzug 1.854.264,00 2.011.412,52 1,44EUR 37.390 Deutsche Wohnen Ag 898.793,00 1.807.304,35 1,30EUR 10.232 Bayer Ag 1.430.238,00 1.127.140,16 0,81EUR 17.964 Amadeus It — Shs -A- 728.842,00 1.417.833,49 1,02EUR 14.396 Danone 975.504,00 1.056.722,09 0,76EUR 13.507 Collateral Titres- Pernod-Ricard 1.592.033,00 2.206.236,69 1,58EUR 19.449 Schneider Electric Se 1.332.906,00 1.621.782,50 1,16EUR 13.020 Legrand Holding Act. Prov. Opo 737.397,00 956.174,41 0,69GBP 16.681 British American Tobacco (25p) 930.349,00 843.484,36 0,60GBP 14.976 Spectris Plc 506.864,00 516.050,87 0,37GBP 44.158 Halma Plc 528.350,00 798.704,51 0,57GBP 27.190 Bunzl Plc 787.998,00 823.849,86 0,59GBP 38.489 Experian Plc 803.952,00 952.529,10 0,68GBP 23.305 Reckitt Benckiser Group Plc 2.044.969,00 1.919.642,11 1,38USD 19.816 Aon Plc 2.249.894,00 2.718.160,72 1,95GBP 99.182 Compass Group Plc 1.811.574,00 2.119.345,40 1,52GBP 2.702 Imi Plc 38.148,00 40.382,01 0,03USD 23.535 Accenture Plc 2.352.057,00 3.850.090,65 2,76USD 24.025 Medtronic Holdings Limited 1.822.976,00 2.056.780,25 1,47USD 75.812 Johnson Ctr Int Shs 3.222.006,00 2.535.911,40 1,82USD 8.505 Delphi Automotive Plc 485.793,00 779.313,15 0,56JPY 16.200 Omron Corp 541.502,00 756.141,16 0,54JPY 24.000 Kao Corp. 1.168.385,00 1.830.902,74 1,31JPY 62.300 Santen Pharmaceutical 845.765,00 1.086.094,57 0,78JPY 15.900 Secom Ltd 1.223.178,00 1.221.155,25 0,88JPY 92.700 Kddi Corp. 2.160.565,00 2.536.664,28 1,82JPY 30.600 Japan tobacco Inc. 1.110.338,00 855.026,16 0,61JPY 21.286 Nomura Research Inst Ltd 698.875,00 1.031.966,66 0,74JPY 4.840 Hirose Electric Co. Ltd 653.801,00 599.947,46 0,43JPY 25.900 Uss Co Ltd Tokai 472.734,00 492.910,07 0,35EUR 9.933 Akzo Nobel Nv (Eur 2) 851.540,00 850.312,14 0,61EUR 19.536 Heineken Nv 1.502.803,00 1.962.052,27 1,41EUR 48.502 Relx Nv 927.295,00 1.034.319,74 0,74EUR 63.028 Ing Group Nv 1.010.817,00 907.197,07 0,65SEK 90.023 Svenska Handelsbanken Ab 1.175.880,00 1.001.867,40 0,72USD 29.727 Abbott Laboratories Inc 1.671.097,00 1.813.049,73 1,30USD 8.422 American Express Co. 644.745,00 825.356,00 0,59USD 10.666 Analog Devices Inc 671.809,00 1.023.082,72 0,73USD 30.194 Bank of Ny Mellon Corp Shs 1.310.751,00 1.628.362,42 1,17USD 3.257 Blackrock Inc 1.220.584,00 1.625.373,28 1,17USD 6.618 Cigna Corp. 1.005.216,00 1.124.729,10 0,81USD 16.855 Cadence Design Systems 374.602,00 729.990,05 0,52USD 6.987 Chevron Corporation 695.165,00 883.366,41 0,63USD 21.792 Citigroup Inc 1.551.974,00 1.458.320,64 1,05
MOVESTIC SICAV
48
The accompanying notes are an integral part of these financial statements.
The rounding down of the percentages in the calculation can result in marginal rounding differences.

Currency Quantity Security Cost MarketValue
% of the netassets
USD 76.767 Comcast Corp /-A- 2.391.816,00 2.518.725,27 1,81USD 20.777 Coty Inc-Cl A 477.451,00 292.955,70 0,21USD 12.320 Danaher Corp 796.779,00 1.215.737,60 0,87USD 3.981 Equifax Inc 460.971,00 498.062,91 0,36USD 14.611 Exxon Mobil Corp 1.231.121,00 1.208.768,03 0,87USD 8.759 Fidelity Natl Inform Serv 611.678,00 928.716,77 0,67USD 28.332 General Mills Inc 1.536.755,00 1.253.974,32 0,90USD 5.611 Goldman Sachs Group Inc. 1.219.075,00 1.237.618,27 0,89USD 6.939 Illinois Tool Works 628.462,00 961.329,06 0,69USD 37.136 Jpmorgan Chase & Co 2.582.455,00 3.869.571,20 2,77USD 27.453 Johnson & Johnson 2.770.093,00 3.331.147,02 2,39USD 22.714 Metlife Inc 1.143.554,00 990.330,40 0,71USD 8.131 Moody S Corp 789.512,00 1.386.823,36 0,99USD 9.382 Occidental Petroleum Corp 723.392,00 785.085,76 0,56USD 22.036 Omnicom Group Inc. 1.601.102,00 1.680.685,72 1,21USD 6.834 Pnc Financial Services Gp 725.271,00 923.273,40 0,66USD 19.924 Ppg Industries Inc. 2.172.132,00 2.066.716,52 1,48USD 52.619 Pfizer Inc. 1.791.918,00 1.909.017,32 1,37USD 29.497 Philip Morris Int. 2.533.069,00 2.381.587,78 1,71USD 1.657 Public Storage 340.036,00 375.907,02 0,27USD 3.022 Sherwin-Williams Co 813.235,00 1.231.676,54 0,88USD 4.349 Jm Smucker Co 595.642,00 467.430,52 0,34USD 4.996 Stanley Black & Decker Inc 612.517,00 663.518,76 0,48USD 13.662 State Street Corp 1.087.810,00 1.271.795,58 0,91USD 58.182 Taiwan Semiconduct. Manuf /Sadr 1.399.214,00 2.127.133,92 1,53USD 25.005 Texas Instruments Inc 1.356.649,00 2.756.801,25 1,98USD 3.422 Thermo Fisher Scientific Inc 524.375,00 708.833,08 0,51USD 16.915 3M Co 2.919.989,00 3.327.518,80 2,39USD 16.127 Travelers Companies Inc *Opr* 1.626.741,00 1.972.977,18 1,41USD 34.943 Us Bancorp 1.574.825,00 1.747.848,86 1,25USD 3.840 Union Pacific Corp. 363.778,00 544.051,20 0,39USD 7.658 Utd Parcel Service Inc B 780.475,00 813.509,34 0,58USD 14.695 Verizon Communications Inc 695.335,00 739.305,45 0,53USD 50.530 Wells Fargo & Co 2.885.580,00 2.801.383,20 2,01USD 19.751 Thomson-Reuters Corp 902.943,00 796.360,32 0,57GBP 54.940 Wpp Plc Shs 981.052,00 865.337,00 0,62EUR 11.576 Kbc Groupe Sa 1.033.865,00 893.648,75 0,64CAD 9.943 Cgi Group Inc. /Sub. Vot. A 550.508,00 629.709,37 0,45CAD 9.005 Tmx Group Ltd 500.450,00 589.950,79 0,42JPY 12.000 Hoya Corp 604.075,00 682.417,53 0,49JPY 103.600 Mitsubishi Ufj Financial Group 768.881,00 590.276,18 0,42EUR 19.277 Grand City Properties 437.486,00 500.552,60 0,36USD 16.629 Duke Energy 1.420.496,00 1.315.021,32 0,94USD 11.495 Fiserv Inc. 726.729,00 851.664,55 0,61AUD 25.101 Amcor Ltd 280.812,00 267.246,04 0,19AUD 25.428 Sonic Healthcare 470.980,00 460.856,83 0,33CHF 4.684 Dufry Ag Basel 731.937,00 596.261,21 0,43USD 4.599 Eaton Corporation Public Ltd 370.393,00 343.729,26 0,25JPY 8.500 Kyocera Corp 492.143,00 479.388,66 0,34USD 10.875 Altria Group 750.190,00 617.591,25 0,44USD 6.585 Cognizant Technology Sol A 502.355,00 520.149,15 0,37USD 11.431 Colgate-palmolive co. 736.994,00 740.843,11 0,53CHF 248 Sgs Sa /Nom. 464.350,00 659.868,03 0,47CHF 756 Givaudan Sa /Reg. 1.363.753,00 1.714.599,84 1,23CHF 5.065 Roche Holding Ag /Genussschein 1.393.980,00 1.125.017,06 0,81
MOVESTIC SICAV
49
The accompanying notes are an integral part of these financial statements.
The rounding down of the percentages in the calculation can result in marginal rounding differences.
MOVESTIC SICAV - Movestic Global
STATEMENT OF INVESTMENTS AND OTHER NET ASSETS (continued)
as at 30 June 2018
(in USD)
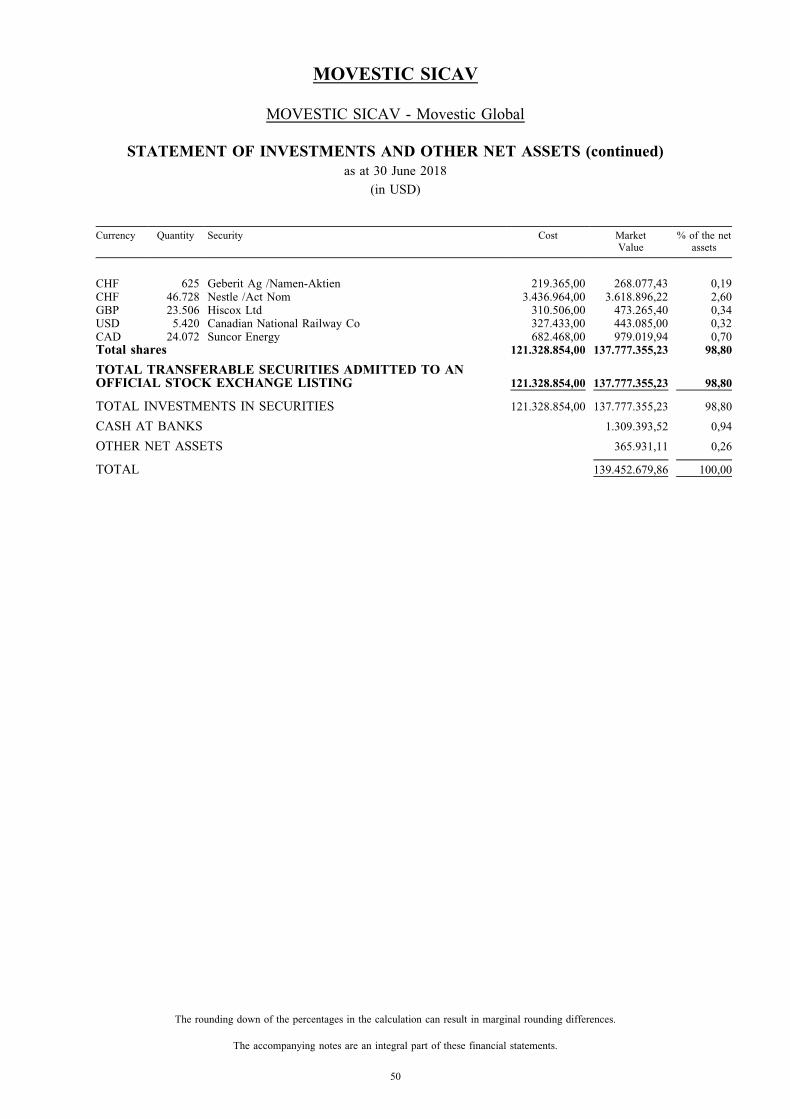
Currency Quantity Security Cost MarketValue
% of the netassets
CHF 625 Geberit Ag /Namen-Aktien 219.365,00 268.077,43 0,19CHF 46.728 Nestle /Act Nom 3.436.964,00 3.618.896,22 2,60GBP 23.506 Hiscox Ltd 310.506,00 473.265,40 0,34USD 5.420 Canadian National Railway Co 327.433,00 443.085,00 0,32CAD 24.072 Suncor Energy 682.468,00 979.019,94 0,70Total shares 121.328.854,00 137.777.355,23 98,80
TOTAL TRANSFERABLE SECURITIES ADMITTED TO ANOFFICIAL STOCK EXCHANGE LISTING 121.328.854,00 137.777.355,23 98,80
TOTAL INVESTMENTS IN SECURITIES 121.328.854,00 137.777.355,23 98,80
CASH AT BANKS 1.309.393,52 0,94
OTHER NET ASSETS 365.931,11 0,26
TOTAL 139.452.679,86 100,00
MOVESTIC SICAV
50
The accompanying notes are an integral part of these financial statements.
The rounding down of the percentages in the calculation can result in marginal rounding differences.
MOVESTIC SICAV - Movestic Global
STATEMENT OF INVESTMENTS AND OTHER NET ASSETS (continued)
as at 30 June 2018
(in USD)
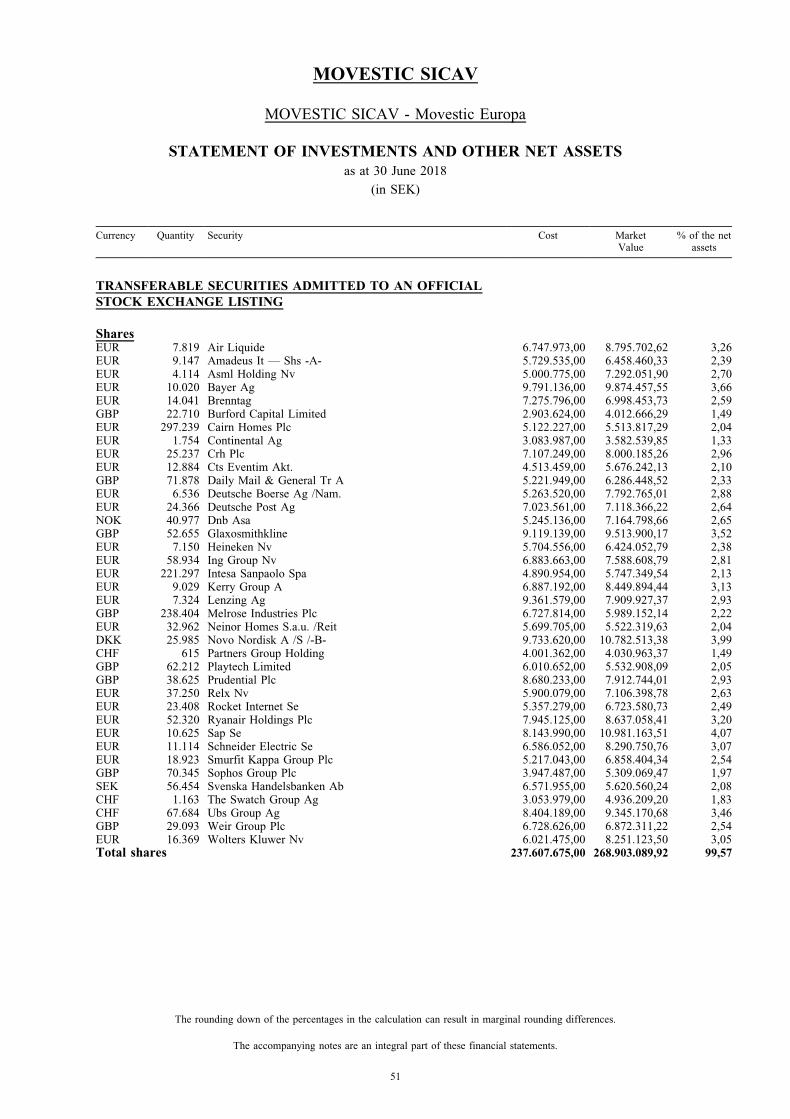
MOVESTIC SICAV - Movestic Europa
STATEMENT OF INVESTMENTS AND OTHER NET ASSETS
as at 30 June 2018
(in SEK)
Currency Quantity Security Cost MarketValue
% of the netassets
TRANSFERABLE SECURITIES ADMITTED TO AN OFFICIAL
STOCK EXCHANGE LISTING
SharesEUR 7.819 Air Liquide 6.747.973,00 8.795.702,62 3,26EUR 9.147 Amadeus It — Shs -A- 5.729.535,00 6.458.460,33 2,39EUR 4.114 Asml Holding Nv 5.000.775,00 7.292.051,90 2,70EUR 10.020 Bayer Ag 9.791.136,00 9.874.457,55 3,66EUR 14.041 Brenntag 7.275.796,00 6.998.453,73 2,59GBP 22.710 Burford Capital Limited 2.903.624,00 4.012.666,29 1,49EUR 297.239 Cairn Homes Plc 5.122.227,00 5.513.817,29 2,04EUR 1.754 Continental Ag 3.083.987,00 3.582.539,85 1,33EUR 25.237 Crh Plc 7.107.249,00 8.000.185,26 2,96EUR 12.884 Cts Eventim Akt. 4.513.459,00 5.676.242,13 2,10GBP 71.878 Daily Mail & General Tr A 5.221.949,00 6.286.448,52 2,33EUR 6.536 Deutsche Boerse Ag /Nam. 5.263.520,00 7.792.765,01 2,88EUR 24.366 Deutsche Post Ag 7.023.561,00 7.118.366,22 2,64NOK 40.977 Dnb Asa 5.245.136,00 7.164.798,66 2,65GBP 52.655 Glaxosmithkline 9.119.139,00 9.513.900,17 3,52EUR 7.150 Heineken Nv 5.704.556,00 6.424.052,79 2,38EUR 58.934 Ing Group Nv 6.883.663,00 7.588.608,79 2,81EUR 221.297 Intesa Sanpaolo Spa 4.890.954,00 5.747.349,54 2,13EUR 9.029 Kerry Group A 6.887.192,00 8.449.894,44 3,13EUR 7.324 Lenzing Ag 9.361.579,00 7.909.927,37 2,93GBP 238.404 Melrose Industries Plc 6.727.814,00 5.989.152,14 2,22EUR 32.962 Neinor Homes S.a.u. /Reit 5.699.705,00 5.522.319,63 2,04DKK 25.985 Novo Nordisk A /S /-B- 9.733.620,00 10.782.513,38 3,99CHF 615 Partners Group Holding 4.001.362,00 4.030.963,37 1,49GBP 62.212 Playtech Limited 6.010.652,00 5.532.908,09 2,05GBP 38.625 Prudential Plc 8.680.233,00 7.912.744,01 2,93EUR 37.250 Relx Nv 5.900.079,00 7.106.398,78 2,63EUR 23.408 Rocket Internet Se 5.357.279,00 6.723.580,73 2,49EUR 52.320 Ryanair Holdings Plc 7.945.125,00 8.637.058,41 3,20EUR 10.625 Sap Se 8.143.990,00 10.981.163,51 4,07EUR 11.114 Schneider Electric Se 6.586.052,00 8.290.750,76 3,07EUR 18.923 Smurfit Kappa Group Plc 5.217.043,00 6.858.404,34 2,54GBP 70.345 Sophos Group Plc 3.947.487,00 5.309.069,47 1,97SEK 56.454 Svenska Handelsbanken Ab 6.571.955,00 5.620.560,24 2,08CHF 1.163 The Swatch Group Ag 3.053.979,00 4.936.209,20 1,83CHF 67.684 Ubs Group Ag 8.404.189,00 9.345.170,68 3,46GBP 29.093 Weir Group Plc 6.728.626,00 6.872.311,22 2,54EUR 16.369 Wolters Kluwer Nv 6.021.475,00 8.251.123,50 3,05Total shares 237.607.675,00 268.903.089,92 99,57
MOVESTIC SICAV
51
The accompanying notes are an integral part of these financial statements.
The rounding down of the percentages in the calculation can result in marginal rounding differences.
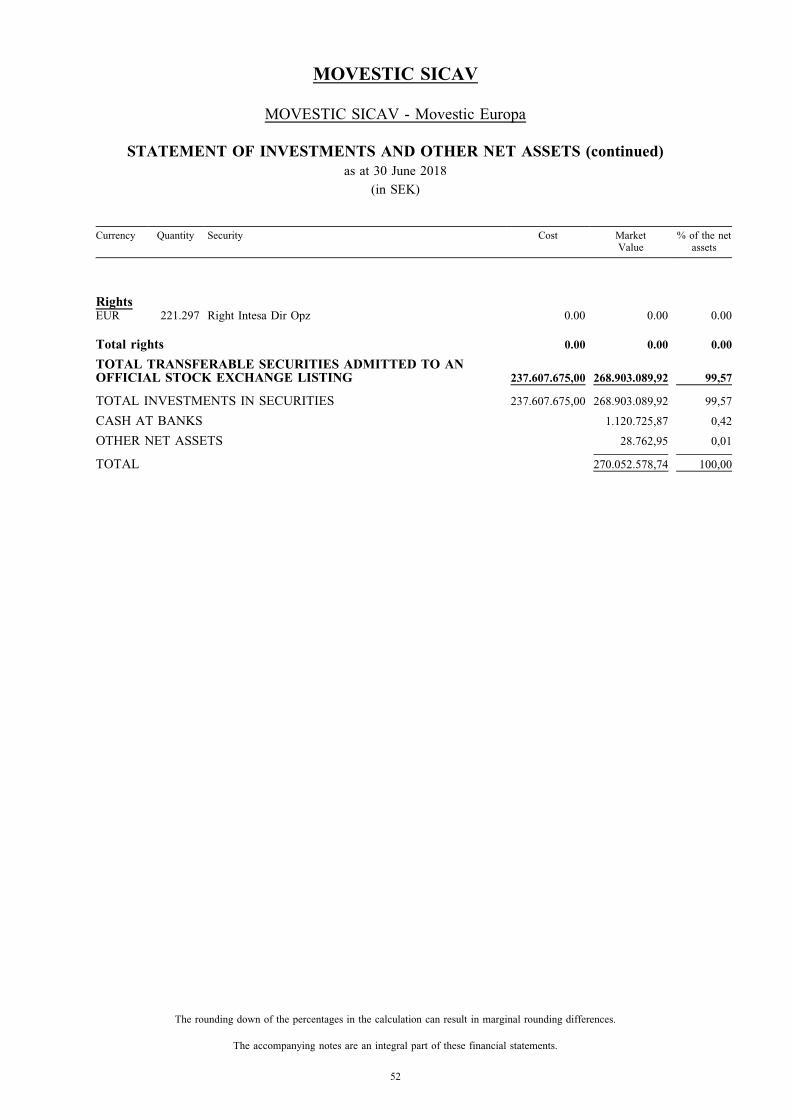
Currency Quantity Security Cost MarketValue
% of the netassets
RightsEUR 221.297 Right Intesa Dir Opz 0.00 0.00 0.00
Total rights 0.00 0.00 0.00
TOTAL TRANSFERABLE SECURITIES ADMITTED TO ANOFFICIAL STOCK EXCHANGE LISTING 237.607.675,00 268.903.089,92 99,57
TOTAL INVESTMENTS IN SECURITIES 237.607.675,00 268.903.089,92 99,57
CASH AT BANKS 1.120.725,87 0,42
OTHER NET ASSETS 28.762,95 0,01
TOTAL 270.052.578,74 100,00
MOVESTIC SICAV
52
The accompanying notes are an integral part of these financial statements.
The rounding down of the percentages in the calculation can result in marginal rounding differences.
MOVESTIC SICAV - Movestic Europa
STATEMENT OF INVESTMENTS AND OTHER NET ASSETS (continued)
as at 30 June 2018
(in SEK)
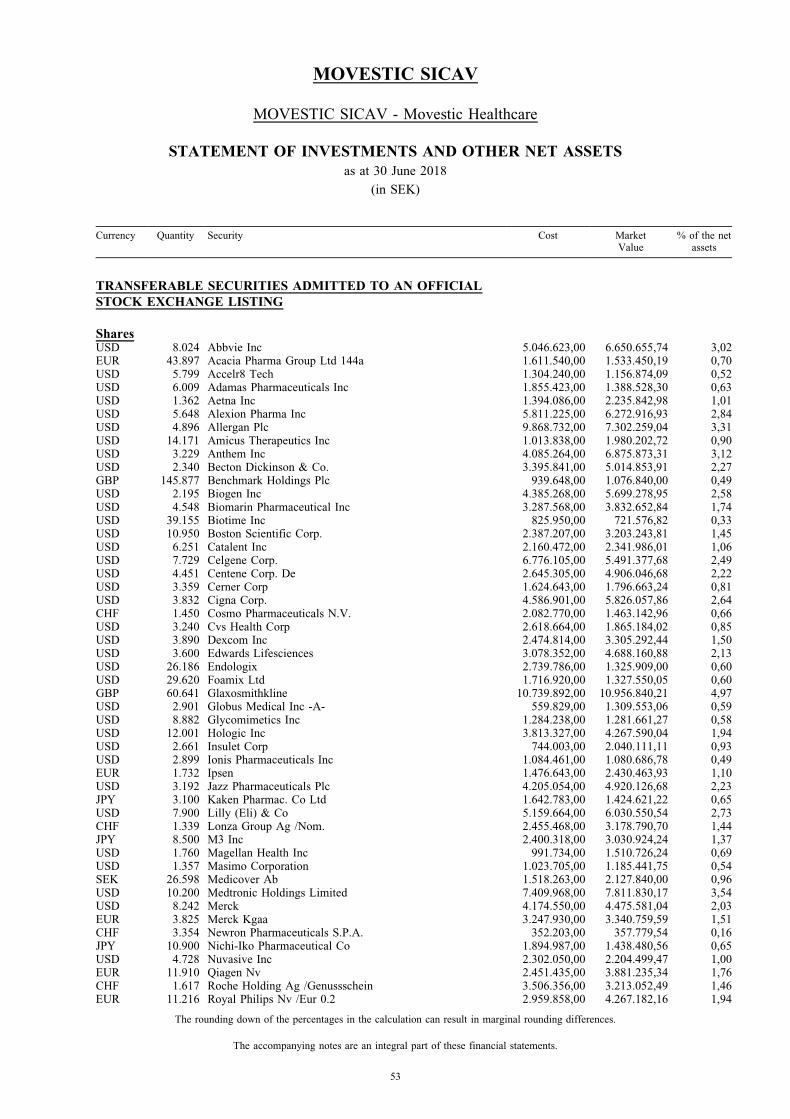
MOVESTIC SICAV - Movestic Healthcare
STATEMENT OF INVESTMENTS AND OTHER NET ASSETS
as at 30 June 2018
(in SEK)
Currency Quantity Security Cost MarketValue
% of the netassets
TRANSFERABLE SECURITIES ADMITTED TO AN OFFICIAL
STOCK EXCHANGE LISTING
SharesUSD 8.024 Abbvie Inc 5.046.623,00 6.650.655,74 3,02EUR 43.897 Acacia Pharma Group Ltd 144a 1.611.540,00 1.533.450,19 0,70USD 5.799 Accelr8 Tech 1.304.240,00 1.156.874,09 0,52USD 6.009 Adamas Pharmaceuticals Inc 1.855.423,00 1.388.528,30 0,63USD 1.362 Aetna Inc 1.394.086,00 2.235.842,98 1,01USD 5.648 Alexion Pharma Inc 5.811.225,00 6.272.916,93 2,84USD 4.896 Allergan Plc 9.868.732,00 7.302.259,04 3,31USD 14.171 Amicus Therapeutics Inc 1.013.838,00 1.980.202,72 0,90USD 3.229 Anthem Inc 4.085.264,00 6.875.873,31 3,12USD 2.340 Becton Dickinson & Co. 3.395.841,00 5.014.853,91 2,27GBP 145.877 Benchmark Holdings Plc 939.648,00 1.076.840,00 0,49USD 2.195 Biogen Inc 4.385.268,00 5.699.278,95 2,58USD 4.548 Biomarin Pharmaceutical Inc 3.287.568,00 3.832.652,84 1,74USD 39.155 Biotime Inc 825.950,00 721.576,82 0,33USD 10.950 Boston Scientific Corp. 2.387.207,00 3.203.243,81 1,45USD 6.251 Catalent Inc 2.160.472,00 2.341.986,01 1,06USD 7.729 Celgene Corp. 6.776.105,00 5.491.377,68 2,49USD 4.451 Centene Corp. De 2.645.305,00 4.906.046,68 2,22USD 3.359 Cerner Corp 1.624.643,00 1.796.663,24 0,81USD 3.832 Cigna Corp. 4.586.901,00 5.826.057,86 2,64CHF 1.450 Cosmo Pharmaceuticals N.V. 2.082.770,00 1.463.142,96 0,66USD 3.240 Cvs Health Corp 2.618.664,00 1.865.184,02 0,85USD 3.890 Dexcom Inc 2.474.814,00 3.305.292,44 1,50USD 3.600 Edwards Lifesciences 3.078.352,00 4.688.160,88 2,13USD 26.186 Endologix 2.739.786,00 1.325.909,00 0,60USD 29.620 Foamix Ltd 1.716.920,00 1.327.550,05 0,60GBP 60.641 Glaxosmithkline 10.739.892,00 10.956.840,21 4,97USD 2.901 Globus Medical Inc -A- 559.829,00 1.309.553,06 0,59USD 8.882 Glycomimetics Inc 1.284.238,00 1.281.661,27 0,58USD 12.001 Hologic Inc 3.813.327,00 4.267.590,04 1,94USD 2.661 Insulet Corp 744.003,00 2.040.111,11 0,93USD 2.899 Ionis Pharmaceuticals Inc 1.084.461,00 1.080.686,78 0,49EUR 1.732 Ipsen 1.476.643,00 2.430.463,93 1,10USD 3.192 Jazz Pharmaceuticals Plc 4.205.054,00 4.920.126,68 2,23JPY 3.100 Kaken Pharmac. Co Ltd 1.642.783,00 1.424.621,22 0,65USD 7.900 Lilly (Eli) & Co 5.159.664,00 6.030.550,54 2,73CHF 1.339 Lonza Group Ag /Nom. 2.455.468,00 3.178.790,70 1,44JPY 8.500 M3 Inc 2.400.318,00 3.030.924,24 1,37USD 1.760 Magellan Health Inc 991.734,00 1.510.726,24 0,69USD 1.357 Masimo Corporation 1.023.705,00 1.185.441,75 0,54SEK 26.598 Medicover Ab 1.518.263,00 2.127.840,00 0,96USD 10.200 Medtronic Holdings Limited 7.409.968,00 7.811.830,17 3,54USD 8.242 Merck 4.174.550,00 4.475.581,04 2,03EUR 3.825 Merck Kgaa 3.247.930,00 3.340.759,59 1,51CHF 3.354 Newron Pharmaceuticals S.P.A. 352.203,00 357.779,54 0,16JPY 10.900 Nichi-Iko Pharmaceutical Co 1.894.987,00 1.438.480,56 0,65USD 4.728 Nuvasive Inc 2.302.050,00 2.204.499,47 1,00EUR 11.910 Qiagen Nv 2.451.435,00 3.881.235,34 1,76CHF 1.617 Roche Holding Ag /Genussschein 3.506.356,00 3.213.052,49 1,46EUR 11.216 Royal Philips Nv /Eur 0.2 2.959.858,00 4.267.182,16 1,94
MOVESTIC SICAV
53
The accompanying notes are an integral part of these financial statements.
The rounding down of the percentages in the calculation can result in marginal rounding differences.

Currency Quantity Security Cost MarketValue
% of the netassets
GBP 6.851 Shire Plc 3.508.863,00 3.451.098,22 1,57USD 4.542 Supernus Ph Shs 1.129.238,00 2.431.864,70 1,10JPY 9.700 Takeda Pharmaceutical Co Ltd 4.412.050,00 3.664.860,08 1,66USD 34.165 Therapeuticsmd Inc 1.701.987,00 1.905.662,63 0,86USD 3.895 Thermo Fisher Scientific Inc 5.004.348,00 7.217.712,15 3,27EUR 5.777 Ucb 3.696.237,00 4.063.301,99 1,84USD 2.298 Ultragenyx Pharmaceutical Inc 1.111.407,00 1.580.283,59 0,72USD 5.846 Unitedhealth Group Inc 7.004.822,00 12.830.846,11 5,82USD 2.157 Univ. Health Serv. Inc B 2.447.779,00 2.150.400,60 0,98GBP 125.893 Vectura Group Plc 1.826.176,00 1.160.536,55 0,53USD 14.412 Wright Medical Group N.V. 2.649.973,00 3.347.010,43 1,52USD 2.753 Zimmer Biomet Hldgs Shs 2.835.667,00 2.744.577,12 1,24Total shares 184.444.451,00 213.596.902,75 96,84
TOTAL TRANSFERABLE SECURITIES ADMITTED TO ANOFFICIAL STOCK EXCHANGE LISTING 184.444.451,00 213.596.902,75 96,84
TOTAL INVESTMENTS IN SECURITIES 184.444.451,00 213.596.902,75 96,84
CASH AT BANKS 5.785.910,06 2,62
OTHER NET ASSETS 1.177.522,25 0,53
TOTAL 220.560.335,06 100,00
MOVESTIC SICAV
54
The accompanying notes are an integral part of these financial statements.
The rounding down of the percentages in the calculation can result in marginal rounding differences.
MOVESTIC SICAV - Movestic Healthcare
STATEMENT OF INVESTMENTS AND OTHER NET ASSETS (continued)
as at 30 June 2018
(in SEK)

MOVESTIC SICAV - Movestic Index
STATEMENT OF INVESTMENTS AND OTHER NET ASSETS
as at 30 June 2018
(in SEK)
Currency Quantity Security Cost MarketValue
% of the netassets
INVESTMENT FUNDSSEK 1.222.614 Ohm Sve Mar Hal Accum Units -A- Sek 120.000.000,00 119.828.362,07 16,09SEK 385.634 Ohman Etisk Emerging Markets 52.647.044,00 71.596.806,58 9,62SEK 893.984 Ohman Etisk Index Europa 106.003.544,00 131.165.304,31 17,61SEK 659.574 Ohman Etisk Index Japan 60.201.290,00 76.174.233,02 10,23SEK 307.819 Ohman Etisk Index Pacific 63.001.290,00 76.967.013,25 10,34SEK 523.250 Ohman Etisk Index Sverige 109.556.491,00 126.898.647,72 17,04SEK 612.248 Ohman Etisk Index Usa 104.572.149,00 135.729.309,22 18,23TOTAL INVESTMENT FUNDS 615.981.808,00 738.359.676,17 99,16
TOTAL INVESTMENTS IN SECURITIES 615.981.808,00 738.359.676,17 99,16
CASH AT BANKS 7.195.388,83 0,97
OTHER NET (LIABILITIES) (906.855,52) (0,12)
TOTAL 744.648.209,48 100,00
MOVESTIC SICAV
55
The accompanying notes are an integral part of these financial statements.
The rounding down of the percentages in the calculation can result in marginal rounding differences.

MOVESTIC SICAV - Fastigheter
STATEMENT OF INVESTMENTS AND OTHER NET ASSETS
as at 30 June 2018
(in SEK)
Currency Quantity Security Cost MarketValue
% of the netassets
TRANSFERABLE SECURITIES ADMITTED TO AN OFFICIAL
STOCK EXCHANGE LISTING
SharesSEK 171.812 Ab Sagax - B 16.840.763,00 19.071.132,00 9,27SEK 67.454 Atrium Ljungb Shs -B- 9.026.928,00 9.753.848,40 4,74SEK 43.068 Castellum Ab Gothenburg 6.035.980,00 6.251.320,20 3,04SEK 23.589 Catena Ab 3.882.750,00 4.123.357,20 2,00SEK 12.344 Corem Prop Gr /Pfd 3.789.608,00 4.047.597,60 1,97SEK 180.952 Dios Fastigheter 10.386.456,00 9.726.170,00 4,73NOK 10.084 Eiendomsspar As /Reit 3.599.588,00 4.095.270,72 1,99NOK 79.945 Entra Asa /Reit 9.751.397,00 9.757.625,58 4,74SEK 92.270 Fabege Ab /Reit 8.229.971,00 9.861.817,60 4,79SEK 79.252 Fastighets Balder Ab B 17.749.946,00 18.529.117,60 9,01SEK 200.559 Fastpartner Rg Shs 9.808.361,00 9.726.108,71 4,73SEK 50.354 Head Com Sw 3.546.694,00 4.330.444,00 2,11SEK 36.728 Heba Fastighets -B- 4.076.808,00 4.021.716,00 1,96SEK 90.845 Hemfosa Fastigheter Ab /Reit 10.108.030,00 9.520.556,00 4,63SEK 75.050 Hufvudstaden Ab A 9.989.226,00 9.628.915,00 4,68SEK 43.500 J.M.AB 7.725.691,00 6.960.000,00 3,38SEK 28.973 Klovern /Pref 8.991.576,00 9.474.171,00 4,61SEK 73.083 Np3 Fastigheter Ab /Reit 3.983.358,00 4.099.956,30 1,99NOK 59.770 Olav Thon Eiendomsselkap 9.899.004,00 9.801.259,97 4,77SEK 65.055 Pandox Ab /Reit 10.208.875,00 9.901.371,00 4,81SEK 119.762 Wallenstam Ab /Reit 9.371.153,00 9.646.829,10 4,69SEK 178.954 Wihlborgs Fastigheter Ab /Reit 17.621.715,00 18.546.792,56 9,02Total shares 194.623.878,00 200.875.376,54 97,66
TOTAL TRANSFERABLE SECURITIES ADMITTED TO ANOFFICIAL STOCK EXCHANGE LISTING 194.623.878,00 200.875.376,54 97,66
TOTAL INVESTMENTS IN SECURITIES 194.623.878,00 200.875.376,54 97,66
CASH AT BANKS 5.037.748,92 2,45
OTHER NET (LIABILITIES) (231.978,13) (0,11)
TOTAL 205.681.147,33 100,00
MOVESTIC SICAV
56
The accompanying notes are an integral part of these financial statements.
The rounding down of the percentages in the calculation can result in marginal rounding differences.
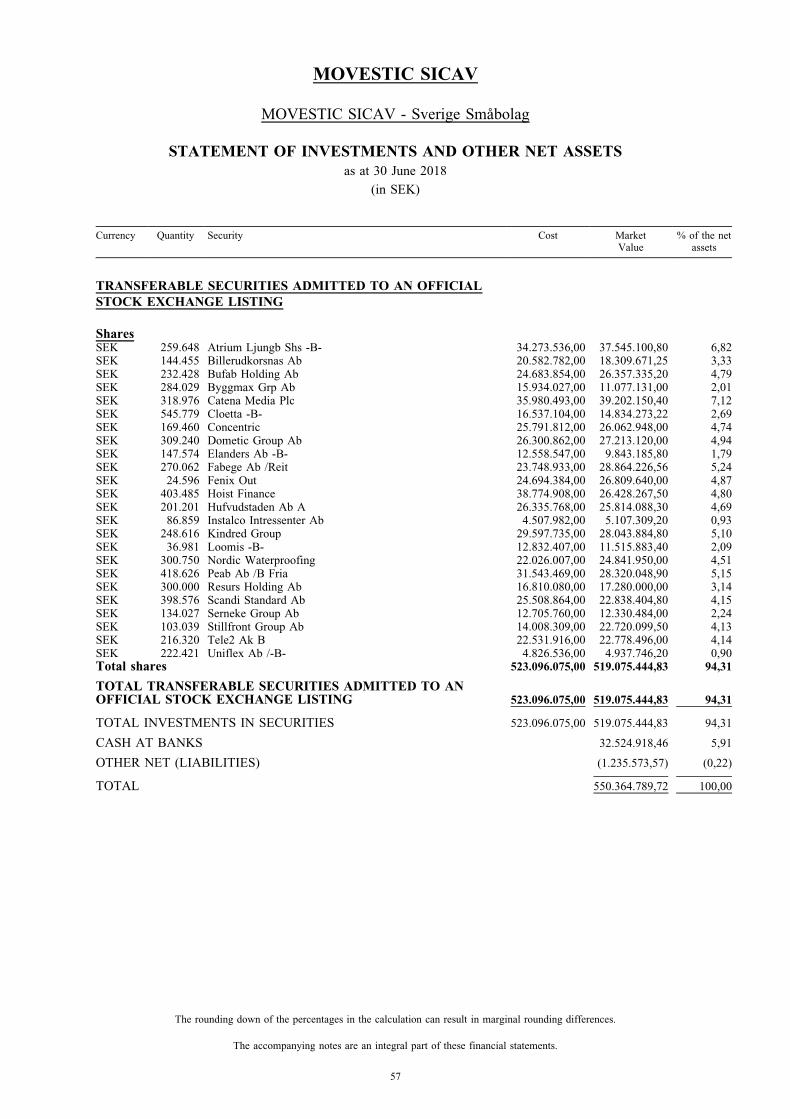
MOVESTIC SICAV - Sverige Smabolag
STATEMENT OF INVESTMENTS AND OTHER NET ASSETS
as at 30 June 2018
(in SEK)
Currency Quantity Security Cost MarketValue
% of the netassets
TRANSFERABLE SECURITIES ADMITTED TO AN OFFICIAL
STOCK EXCHANGE LISTING
SharesSEK 259.648 Atrium Ljungb Shs -B- 34.273.536,00 37.545.100,80 6,82SEK 144.455 Billerudkorsnas Ab 20.582.782,00 18.309.671,25 3,33SEK 232.428 Bufab Holding Ab 24.683.854,00 26.357.335,20 4,79SEK 284.029 Byggmax Grp Ab 15.934.027,00 11.077.131,00 2,01SEK 318.976 Catena Media Plc 35.980.493,00 39.202.150,40 7,12SEK 545.779 Cloetta -B- 16.537.104,00 14.834.273,22 2,69SEK 169.460 Concentric 25.791.812,00 26.062.948,00 4,74SEK 309.240 Dometic Group Ab 26.300.862,00 27.213.120,00 4,94SEK 147.574 Elanders Ab -B- 12.558.547,00 9.843.185,80 1,79SEK 270.062 Fabege Ab /Reit 23.748.933,00 28.864.226,56 5,24SEK 24.596 Fenix Out 24.694.384,00 26.809.640,00 4,87SEK 403.485 Hoist Finance 38.774.908,00 26.428.267,50 4,80SEK 201.201 Hufvudstaden Ab A 26.335.768,00 25.814.088,30 4,69SEK 86.859 Instalco Intressenter Ab 4.507.982,00 5.107.309,20 0,93SEK 248.616 Kindred Group 29.597.735,00 28.043.884,80 5,10SEK 36.981 Loomis -B- 12.832.407,00 11.515.883,40 2,09SEK 300.750 Nordic Waterproofing 22.026.007,00 24.841.950,00 4,51SEK 418.626 Peab Ab /B Fria 31.543.469,00 28.320.048,90 5,15SEK 300.000 Resurs Holding Ab 16.810.080,00 17.280.000,00 3,14SEK 398.576 Scandi Standard Ab 25.508.864,00 22.838.404,80 4,15SEK 134.027 Serneke Group Ab 12.705.760,00 12.330.484,00 2,24SEK 103.039 Stillfront Group Ab 14.008.309,00 22.720.099,50 4,13SEK 216.320 Tele2 Ak B 22.531.916,00 22.778.496,00 4,14SEK 222.421 Uniflex Ab /-B- 4.826.536,00 4.937.746,20 0,90Total shares 523.096.075,00 519.075.444,83 94,31
TOTAL TRANSFERABLE SECURITIES ADMITTED TO ANOFFICIAL STOCK EXCHANGE LISTING 523.096.075,00 519.075.444,83 94,31
TOTAL INVESTMENTS IN SECURITIES 523.096.075,00 519.075.444,83 94,31
CASH AT BANKS 32.524.918,46 5,91
OTHER NET (LIABILITIES) (1.235.573,57) (0,22)
TOTAL 550.364.789,72 100,00
MOVESTIC SICAV
57
The accompanying notes are an integral part of these financial statements.
The rounding down of the percentages in the calculation can result in marginal rounding differences.
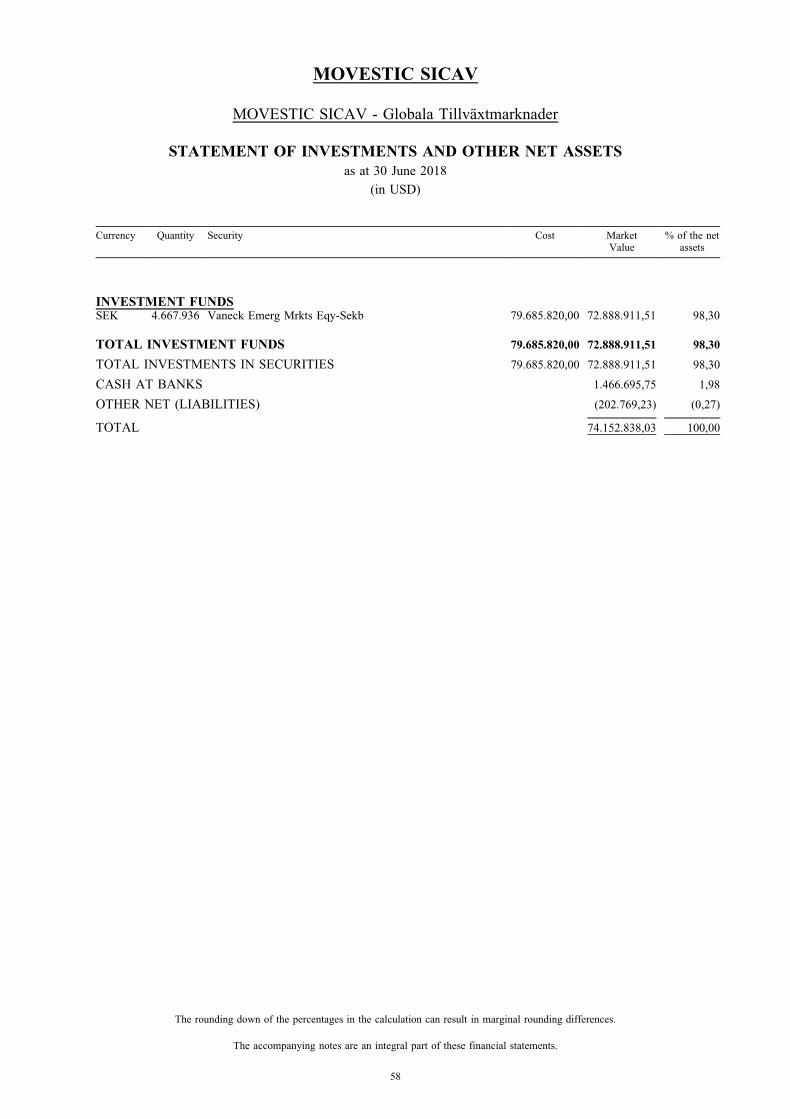
MOVESTIC SICAV - Globala Tillvaxtmarknader
STATEMENT OF INVESTMENTS AND OTHER NET ASSETS
as at 30 June 2018
(in USD)
Currency Quantity Security Cost MarketValue
% of the netassets
INVESTMENT FUNDSSEK 4.667.936 Vaneck Emerg Mrkts Eqy-Sekb 79.685.820,00 72.888.911,51 98,30
TOTAL INVESTMENT FUNDS 79.685.820,00 72.888.911,51 98,30
TOTAL INVESTMENTS IN SECURITIES 79.685.820,00 72.888.911,51 98,30
CASH AT BANKS 1.466.695,75 1,98
OTHER NET (LIABILITIES) (202.769,23) (0,27)
TOTAL 74.152.838,03 100,00
MOVESTIC SICAV
58
The accompanying notes are an integral part of these financial statements.
The rounding down of the percentages in the calculation can result in marginal rounding differences.
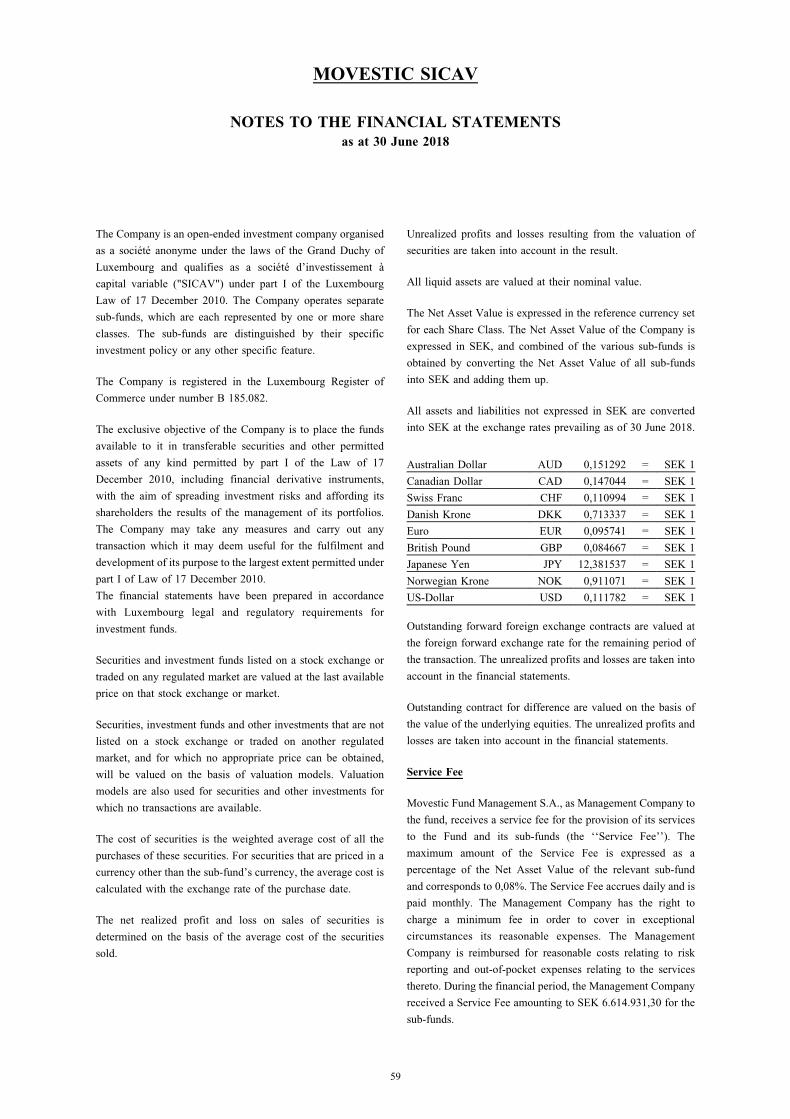
NOTES TO THE FINANCIAL STATEMENTS
as at 30 June 2018
The Company is an open-ended investment company organised
as a societe anonyme under the laws of the Grand Duchy of
Luxembourg and qualifies as a societe d’investissement a
capital variable ("SICAV") under part I of the Luxembourg
Law of 17 December 2010. The Company operates separate
sub-funds, which are each represented by one or more share
classes. The sub-funds are distinguished by their specific
investment policy or any other specific feature.
The Company is registered in the Luxembourg Register of
Commerce under number B 185.082.
The exclusive objective of the Company is to place the funds
available to it in transferable securities and other permitted
assets of any kind permitted by part I of the Law of 17
December 2010, including financial derivative instruments,
with the aim of spreading investment risks and affording its
shareholders the results of the management of its portfolios.
The Company may take any measures and carry out any
transaction which it may deem useful for the fulfilment and
development of its purpose to the largest extent permitted under
part I of Law of 17 December 2010.
The financial statements have been prepared in accordance
with Luxembourg legal and regulatory requirements for
investment funds.
Securities and investment funds listed on a stock exchange or
traded on any regulated market are valued at the last available
price on that stock exchange or market.
Securities, investment funds and other investments that are not
listed on a stock exchange or traded on another regulated
market, and for which no appropriate price can be obtained,
will be valued on the basis of valuation models. Valuation
models are also used for securities and other investments for
which no transactions are available.
The cost of securities is the weighted average cost of all the
purchases of these securities. For securities that are priced in a
currency other than the sub-fund’s currency, the average cost is
calculated with the exchange rate of the purchase date.
The net realized profit and loss on sales of securities is
determined on the basis of the average cost of the securities
sold.
Unrealized profits and losses resulting from the valuation of
securities are taken into account in the result.
All liquid assets are valued at their nominal value.
The Net Asset Value is expressed in the reference currency set
for each Share Class. The Net Asset Value of the Company is
expressed in SEK, and combined of the various sub-funds is
obtained by converting the Net Asset Value of all sub-funds
into SEK and adding them up.
All assets and liabilities not expressed in SEK are converted
into SEK at the exchange rates prevailing as of 30 June 2018.
Australian Dollar AUD 0,151292 = SEK 1
Canadian Dollar CAD 0,147044 = SEK 1
Swiss Franc CHF 0,110994 = SEK 1
Danish Krone DKK 0,713337 = SEK 1
Euro EUR 0,095741 = SEK 1
British Pound GBP 0,084667 = SEK 1
Japanese Yen JPY 12,381537 = SEK 1
Norwegian Krone NOK 0,911071 = SEK 1
US-Dollar USD 0,111782 = SEK 1
Outstanding forward foreign exchange contracts are valued at
the foreign forward exchange rate for the remaining period of
the transaction. The unrealized profits and losses are taken into
account in the financial statements.
Outstanding contract for difference are valued on the basis of
the value of the underlying equities. The unrealized profits and
losses are taken into account in the financial statements.
Service Fee
Movestic Fund Management S.A., as Management Company to
the fund, receives a service fee for the provision of its services
to the Fund and its sub-funds (the ‘‘Service Fee’’). The
maximum amount of the Service Fee is expressed as a
percentage of the Net Asset Value of the relevant sub-fund
and corresponds to 0,08%. The Service Fee accrues daily and is
paid monthly. The Management Company has the right to
charge a minimum fee in order to cover in exceptional
circumstances its reasonable expenses. The Management
Company is reimbursed for reasonable costs relating to risk
reporting and out-of-pocket expenses relating to the services
thereto. During the financial period, the Management Company
received a Service Fee amounting to SEK 6.614.931,30 for the
sub-funds.
MOVESTIC SICAV
59

Management Fee
The different sub-funds and Classes will incur an annual
Management Fee payable to the investment manager, which
reflects all expenses related to the investment management of
the sub-funds and Classes (the ‘‘Management Fee’’). The
Management Fee, which is payable out of the net assets of the
relevant sub-fund is expressed as a percentage of the Net Asset
Value and is accrued daily and payable monthly in arrears.
Naventi Fonder AB is no longer a Sub-Investment Manager as
sub-funds Naventi Offensiv Strategi and Naventi Balanserad
Strategie are liquidated as at 4 April 2018. There was no other
change to the Investment Manager or Sub-Investment
Managers during the financial period under review.
For the financial period under review, the management fees
were as follows:
MOVESTIC SICAV - Management Fee p.a. (in %)
01/01-30/04/18 01/05-30/06/18
Balanserad 1,75 1,75
Forsiktig 1,75 1,75
Offensiv 1,75 1,75
Movestic Bevara 1,20 1,20
Movestic Bygga 1,50 1,50
Monyx Balanserad 1,60 1,60
Monyx Sverige/Varlden 2,00 2,00
Monyx Varlden 2,25 2,25
Proaktiv 75 M
Class I (SEK) 1,50 1,50
Class B (SEK) N/A 1,35
Proaktiv 80 M
Class I (SEK) 1,50 1,50
Class B (SEK) N/A 1,30
Proaktiv 85 M
Class I (SEK) 1,50 1,50
Class B (SEK) N/A 1,25
Proaktiv 90 M
Class I (SEK) 1,50 1,50
Class B (SEK) N/A 1,20
Naventi OffensivStrategi* 2,25 N/A
Naventi BalanseradStrategi* 2,25 N/A
Aktiv Allokering
Class I (SEK) 1,35 1,35
Movestic EuropaSmabolag
Class I (SEK) 1,75 1,50
Class M (SEK) 0,70 0,70
Movestic Korta RantorPlus
Class I (SEK) 0,95 0,90
Class M (SEK) 0,40 0,40
Movestic Sverige
Class I (SEK) 1,75 1,40
Class M (SEK) 0,70 0,70
Ascensus TrendMovestic 2,20 2,20
Ascensus OffensivMovestic 2,20 2,20
Modernac 0,70 0,70
Movestic Global
Class I (SEK) 1,75 1,50
Class M (SEK) 0,70 0,70
Movestic Europa
Class I (SEK) 1,75 1,30
Class M (SEK) 0,70 0,70
Movestic Bioteknik**
Class I (SEK) 1,75 N/A
Class M (SEK) 0,70 N/A
Movestic Healthcare
Class I (SEK) 1,75 1,60
Class M (SEK) 0,70 0,70
Movestic Index 0,85 0,60
Fastigheter
Class I (SEK) 1,75 1,60
Class M (SEK) 0,70 0,70
Sverige Smabolag
Class I (SEK) 1,75 1,50
Class M (SEK) 0,70 0,70
GlobalaTillvaxtmarknader
Class I (SEK) 1,75 1,60
During the financial period the Investment Managers received a
Management Fee amounting to SEK 127.450.673,91 for the
sub-funds.
Depositary Fee
The Company pays to the Depositary an annual fee varying
from 0,0075% to 0,25%. Each sub-fund pay a monthly fix
monitoring fee of EUR 250. In addition, the cost for
safekeeping is paid depending on the market invested in.
Sub-Investment Management Fee
The Sub-Investment Manager, if any, is entitled to receive a
Sub-Investment Management Fee for the performance of its
services (the ‘‘Sub-Investment Management Fee’’). The Sub-
MOVESTIC SICAV
60
NOTES TO THE FINANCIAL STATEMENTS (continued)
as at 30 June 2018
* Liquidated as at 4 April 2018** Liquidated as at 20 February 2018

Investment Management Fee is payable to the relevant Sub-
Investment Manager out of the Management Fee which the
Investment Manager receives for the relevant sub-fund.
Registrar and Transfer Agent Fee
RBC Investor Services Bank S.A. was appointed as Central
Administration Agent and Registrar and Transfer Agent.
In its capacity as Administrative Agent, RBC Investor Services
Bank S.A. is responsible for the general administrative
functions required by law, is in charge of the calculation of
the Net Asset Value of each sub-fund and the maintenance of
accounting records.
In its capacity as Registrar and Transfer Agent, RBC Investor
Services Bank S.A. is responsible for processing the issue,
redemption, conversion and transfer of Shares on behalf of the
fund, as well as for maintaining the fund’s register of
shareholders.
The fund pays to the Central Administration Agent and the
Registrar and Transfer Agent annual fees which vary from
0,0075% of the Net Asset Value to 0,25% of the Net Asset
Value per sub-fund subject to a monthly minimum fee per sub-
fund of EUR 1.250. These fees are payable on a quarterly basis
and do not include any maintenance, reporting or transaction
related fees.
Performance Fee
The Investment Manager may, in addition to the Management
Fee, be entitled to receive a Performance Fee. If an index used
as Benchmark for Performance Fee calculation purposes is
denominated in a currency other than the Reference Currency,
the index value is converted into the Reference Currency by
taking into account the respective exchange rate. The
Performance Fee is calculated daily. If due to an
outperformance of the NAV compared to the Benchmark the
Investment Manager is entitled to receive a Performance Fee,
this Performance Fee amount is accrued. Such Performance Fee
accruals are being paid following each calendar quarter. A
Performance Fee may be payable even if the performance and
the outperformance of the Net Asset Value per share are
negative at the end of one Accounting Period. Further details of
such a Performance Fee are set out as follows for each sub-
fund, if applicable:
MOVESTIC SICAV - Balanserad
The Performance Fee (if any) amounts to 10% of the amount by
which the performance in the Net Asset Value per Share
exceeds the performance of the Benchmark during one
financial year ("Accounting Period"). The Benchmark for the
purpose of calculation of the Performance Fee is considered as
follows: 50% MSCI All Country World Index (Bloomberg
Code ‘‘NDUEACWF Index’’) + 25% OMRX T-Bond Index
(Bloomberg Code ‘‘OMRX Index’’) + 25% OMRX T-Bill
Index (Bloomberg Code ‘‘RXVX Index’’). The performance of
previous Accounting Periods is not taken into consideration.
MOVESTIC SICAV - Forsiktig
The Performance Fee (if any) amounts to 10% the fund pays of
the amount by which the performance in the Net Asset Value
per Share exceeds the performance of the Benchmark during
one financial year (‘‘Accounting Period’’). The Benchmark for
the purpose of calculation of the Performance Fee is considered
as follows: 30% MSCI All Country World Index (Bloomberg
Code ‘‘NDUEACWF Index’’) + 35% OMRX T-Bond Index
(Bloomberg Code ‘‘OMRX Index’’) + 35% OMRX T-Bill
Index (Bloomberg Code ‘‘RXVX Index’’). The performance of
previous Accounting Periods is not taken into consideration.
MOVESTIC SICAV - Offensiv
The Performance Fee (if any) amounts to 10% of the amount by
which the performance in the Net Asset Value per Share
exceeds the performance of the Benchmark during one
financial year ("Accounting Period"). The Benchmark for the
purpose of calculation of the Performance Fee is considered as
follows: 50% MSCI All Country World Index (Bloomberg
Code ‘‘NDUEACWF Index) and 50% SIX Indices Portfolio
Return Index (Bloomberg Code SIX PRX Index). The
performance of previous Accounting Periods is not taken into
consideration.
MOVESTIC SICAV - Movestic Bevara
The Performance Fee (if any) amounts up to 20% of the amount
by which the performance in the Net Asset Value per Share
exceeds the performance of the Benchmark during one
financial year ("Accounting Period"). The Benchmark for the
purpose of calculation of the Performance Fee is considered as
follows: OMRX T-Bill Index (Bloomberg Code ‘‘RXVX
Index’’). The performance of previous Accounting Periods is
not taken into consideration.
MOVESTIC SICAV - Movestic Bygga
The Performance Fee (if any) amounts up to 20% of the amount
by which the performance in the Net Asset Value per Share
exceeds the performance of the Benchmark during one
financial year ("Accounting Period"). The Benchmark for the
purpose of calculation of the Performance Fee is considered as
MOVESTIC SICAV
61
NOTES TO THE FINANCIAL STATEMENTS (continued)
as at 30 June 2018
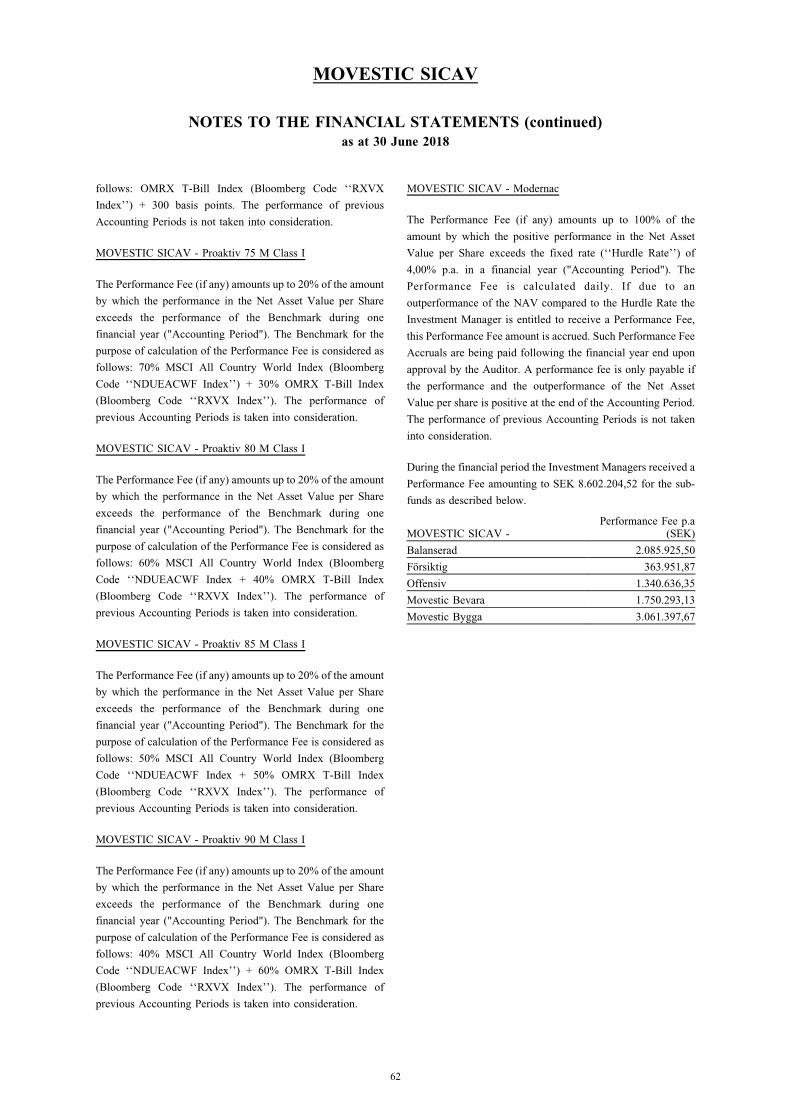
follows: OMRX T-Bill Index (Bloomberg Code ‘‘RXVX
Index’’) + 300 basis points. The performance of previous
Accounting Periods is not taken into consideration.
MOVESTIC SICAV - Proaktiv 75 M Class I
The Performance Fee (if any) amounts up to 20% of the amount
by which the performance in the Net Asset Value per Share
exceeds the performance of the Benchmark during one
financial year ("Accounting Period"). The Benchmark for the
purpose of calculation of the Performance Fee is considered as
follows: 70% MSCI All Country World Index (Bloomberg
Code ‘‘NDUEACWF Index’’) + 30% OMRX T-Bill Index
(Bloomberg Code ‘‘RXVX Index’’). The performance of
previous Accounting Periods is taken into consideration.
MOVESTIC SICAV - Proaktiv 80 M Class I
The Performance Fee (if any) amounts up to 20% of the amount
by which the performance in the Net Asset Value per Share
exceeds the performance of the Benchmark during one
financial year ("Accounting Period"). The Benchmark for the
purpose of calculation of the Performance Fee is considered as
follows: 60% MSCI All Country World Index (Bloomberg
Code ‘‘NDUEACWF Index + 40% OMRX T-Bill Index
(Bloomberg Code ‘‘RXVX Index’’). The performance of
previous Accounting Periods is taken into consideration.
MOVESTIC SICAV - Proaktiv 85 M Class I
The Performance Fee (if any) amounts up to 20% of the amount
by which the performance in the Net Asset Value per Share
exceeds the performance of the Benchmark during one
financial year ("Accounting Period"). The Benchmark for the
purpose of calculation of the Performance Fee is considered as
follows: 50% MSCI All Country World Index (Bloomberg
Code ‘‘NDUEACWF Index + 50% OMRX T-Bill Index
(Bloomberg Code ‘‘RXVX Index’’). The performance of
previous Accounting Periods is taken into consideration.
MOVESTIC SICAV - Proaktiv 90 M Class I
The Performance Fee (if any) amounts up to 20% of the amount
by which the performance in the Net Asset Value per Share
exceeds the performance of the Benchmark during one
financial year ("Accounting Period"). The Benchmark for the
purpose of calculation of the Performance Fee is considered as
follows: 40% MSCI All Country World Index (Bloomberg
Code ‘‘NDUEACWF Index’’) + 60% OMRX T-Bill Index
(Bloomberg Code ‘‘RXVX Index’’). The performance of
previous Accounting Periods is taken into consideration.
MOVESTIC SICAV - Modernac
The Performance Fee (if any) amounts up to 100% of the
amount by which the positive performance in the Net Asset
Value per Share exceeds the fixed rate (‘‘Hurdle Rate’’) of
4,00% p.a. in a financial year ("Accounting Period"). The
Performance Fee is calculated daily. If due to an
outperformance of the NAV compared to the Hurdle Rate the
Investment Manager is entitled to receive a Performance Fee,
this Performance Fee amount is accrued. Such Performance Fee
Accruals are being paid following the financial year end upon
approval by the Auditor. A performance fee is only payable if
the performance and the outperformance of the Net Asset
Value per share is positive at the end of the Accounting Period.
The performance of previous Accounting Periods is not taken
into consideration.
During the financial period the Investment Managers received a
Performance Fee amounting to SEK 8.602.204,52 for the sub-
funds as described below.
MOVESTIC SICAV -Performance Fee p.a
(SEK)
Balanserad 2.085.925,50
Forsiktig 363.951,87
Offensiv 1.340.636,35
Movestic Bevara 1.750.293,13
Movestic Bygga 3.061.397,67
MOVESTIC SICAV
62
NOTES TO THE FINANCIAL STATEMENTS (continued)
as at 30 June 2018

As per the current prospectus, the following sub-funds / fund-
classes are not subject to any performance fees:
MOVESTIC SICAV -
. Monyx Balanserad
. Monyx Sverige/Varlden
. Monyx Varlden
. Proaktiv 75 M - Class B
. Proaktiv 80 M - Class B
. Proaktiv 85 M - Class B
. Proaktiv 90 M - Class B
. Naventi Offensiv Strategi*
. Naventi Balanserad Strategi*
. Aktiv Allokering
. Movestic Europa Smabolag
. Movestic Korta Rantor Plus
. Movestic Sverige
. Ascensus Trend Movestic
. Ascensus Offensiv Movestic
. Movestic Global
. Movestic Bioteknik**
. Movestic Healthcare
. Movestic Europa
. Movestic Index
. Fastigheter
. Sverige Smabolag
. Globala Tillvaxtmarknader
MOVESTIC SICAV
63
NOTES TO THE FINANCIAL STATEMENTS (continued)
as at 30 June 2018
* Liquidated as at 4 April 2018** Liquidated as at 20 February 2018
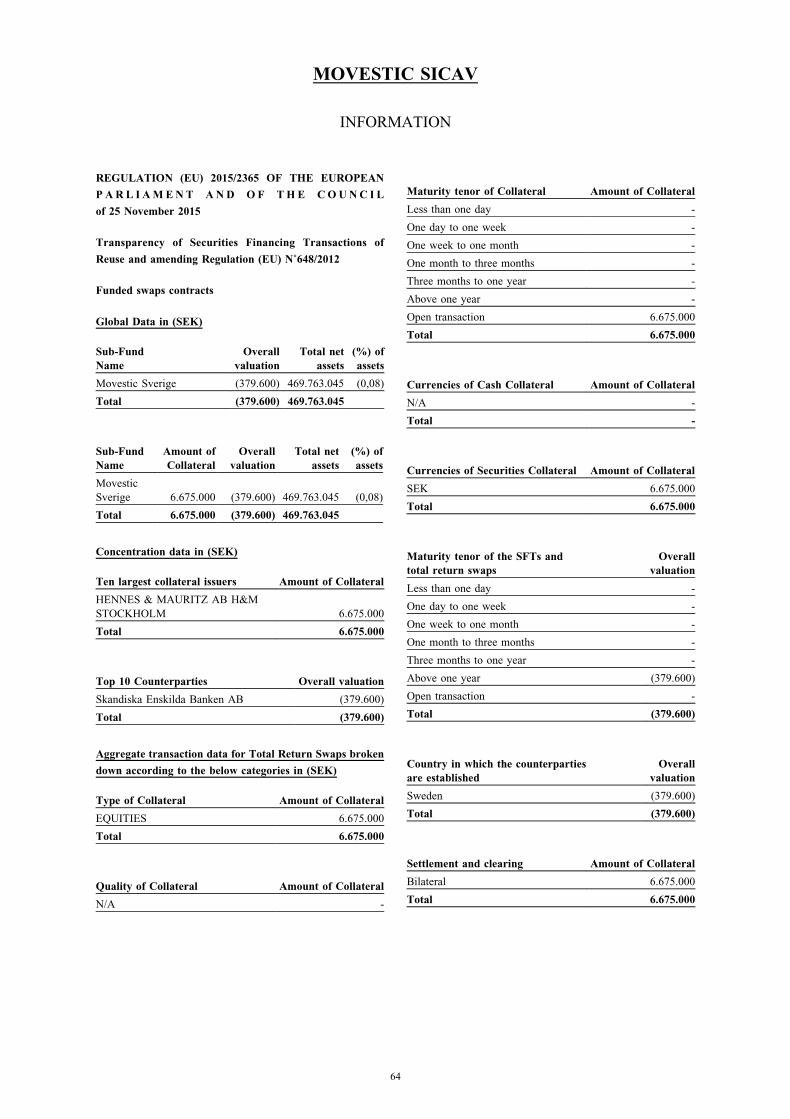
INFORMATION
REGULATION (EU) 2015/2365 OF THE EUROPEAN
PARL I AMENT AND OF THE COUNC I L
of 25 November 2015
Transparency of Securities Financing Transactions of
Reuse and amending Regulation (EU) N˚648/2012
Funded swaps contracts
Global Data in (SEK)
Sub-Fund
Name
Overall
valuation
Total net
assets
(%) of
assets
Movestic Sverige (379.600) 469.763.045 (0,08)
Total (379.600) 469.763.045
Sub-Fund
Name
Amount of
Collateral
Overall
valuation
Total net
assets
(%) of
assets
Movestic
Sverige 6.675.000 (379.600) 469.763.045 (0,08)
Total 6.675.000 (379.600) 469.763.045
Concentration data in (SEK)
Ten largest collateral issuers Amount of Collateral
HENNES & MAURITZ AB H&M
STOCKHOLM 6.675.000
Total 6.675.000
Top 10 Counterparties Overall valuation
Skandiska Enskilda Banken AB (379.600)
Total (379.600)
Aggregate transaction data for Total Return Swaps broken
down according to the below categories in (SEK)
Type of Collateral Amount of Collateral
EQUITIES 6.675.000
Total 6.675.000
Quality of Collateral Amount of Collateral
N/A -
Maturity tenor of Collateral Amount of Collateral
Less than one day -
One day to one week -
One week to one month -
One month to three months -
Three months to one year -
Above one year -
Open transaction 6.675.000
Total 6.675.000
Currencies of Cash Collateral Amount of Collateral
N/A -
Total -
Currencies of Securities Collateral Amount of Collateral
SEK 6.675.000
Total 6.675.000
Maturity tenor of the SFTs and
total return swaps
Overall
valuation
Less than one day -
One day to one week -
One week to one month -
One month to three months -
Three months to one year -
Above one year (379.600)
Open transaction -
Total (379.600)
Country in which the counterparties
are established
Overall
valuation
Sweden (379.600)
Total (379.600)
Settlement and clearing Amount of Collateral
Bilateral 6.675.000
Total 6.675.000
MOVESTIC SICAV
64

Data on reuse of Collateral:
Reuse of Collateral Amount of Collateral
Share of collateral received that is
reused None
Cash collateral reivestment returns to
the collective investment undertaking None
Safe Keeping of collateral received by the collective
investment undertaking as part of SFTs and Total Return
Swaps in (SEK)
Names of the
custodians
Amount of collateral asset
safe-kept
RBC INVESTOR SERVICES
BANK S.A 6.675.000
Safe Keeping of collateral granted by the collective
investment undertaking as part of Total Return Swaps in
(SEK)
Type of accounts
Segregated accounts
Data return and cost for TRS in (SEK)
Sub-Fund Name Revenue
Movestic Sverige (1.085.048)
Total (1.085.048)
Additional information
The above disclosure of Total Return Swaps (TRS) collateral
data shows the complete collateral situation for all OTC for any
counterparty for the SICAV. As a global market practice,
collateralization process is done against the net exposure of
OTC.
MOVESTIC SICAV
65
INFORMATION (continued)

MOVESTIC SICAV12, rue Gabriel Lippmann, L-5365 Munsbach,
Luxembourg