movement of labor and capital between countries 1 movement of labor between countries 2 movement of...
TRANSCRIPT

MOVEMENT OF LABOR AND CAPITAL BETWEEN
COUNTRIES
1 Movement of Labor Between Countries
2Movement of
Capital between Countries
3Gains from Labor and Capital Flows
4Conclusions
5
© 2008 Worth Publishers ▪ International Economics ▪ Feenstra/Taylor 2 of 114
Introduction
• From May to September 1980, boatloads of refugees from Cuba arrived in Miami.
• This would lead you to believe that these less-skilled workers would drive down wages.
• However, this immigration does not appear to have pulled down the wages of other less-skilled workers in Miami.
• Explaining this effect is one goal of this chapter.
© 2008 Worth Publishers ▪ International Economics ▪ Feenstra/Taylor 3 of 114
Introduction
• A similar situation occurred with the 1989 emigration of Russian Jews to Israel. The immigrants were more highly skilled than the
existing Israeli population. However, the relative wages of high-skilled workers in
Israel actually rose during the 1990s. In other large scale immigrations, the wages of
domestic workers did fall.
• Compare the predictions of short-run (specific factors) and long-run (Heckscher-Ohlin) models.
© 2008 Worth Publishers ▪ International Economics ▪ Feenstra/Taylor 4 of 114
Introduction
• Then we will consider the effects of movement of capital.
• Foreign Direct Investment (FDI) occurs when a company from one country owns a company in another country.
• Finally, we will discuss the gains to the host and destination countries, and to the world, from the movement of labor and capital.
© 2008 Worth Publishers ▪ International Economics ▪ Feenstra/Taylor 5 of 114
Movement of Labor Between Countries
• Migration is the movement of labor from the Foreign country to the Home country.
• The wages paid to labor and the rentals paid to capital and land are determined by the prices of goods purchased.
• Prices of goods are determined by the world market for those goods.
• If prices of goods are fixed, how do the Home wage and rentals paid change as labor moves between countries?
© 2008 Worth Publishers ▪ International Economics ▪ Feenstra/Taylor 6 of 114
Movement of Labor Between Countries
• Effects of immigration in the Short Run Specific-Factors Model: In the short run, only labor is mobile across industries. Remember the resource equation: L = LM + LA
• Determining the Wage Assume the Foreign equilibrium wage, W*, is lower
than Home equilibrium wage, W. Workers will migrate from Foreign to Home.
© 2008 Worth Publishers ▪ International Economics ▪ Feenstra/Taylor 7 of 114
Movement of Labor Between Countries
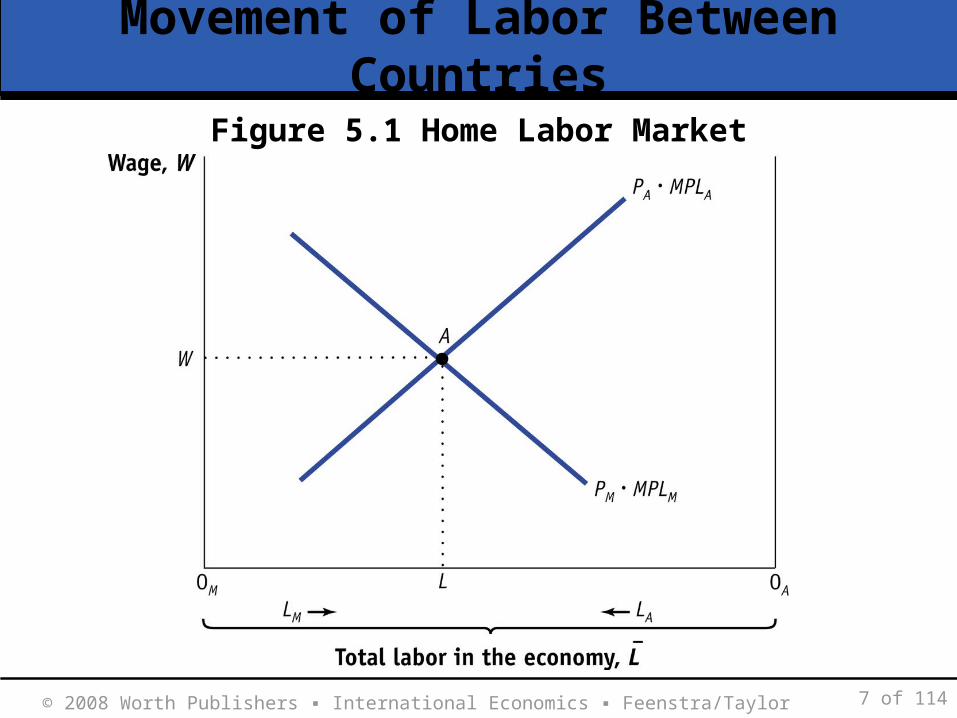
Figure 5.1 Home Labor Market
© 2008 Worth Publishers ▪ International Economics ▪ Feenstra/Taylor 8 of 114
Movement of Labor Between Countries
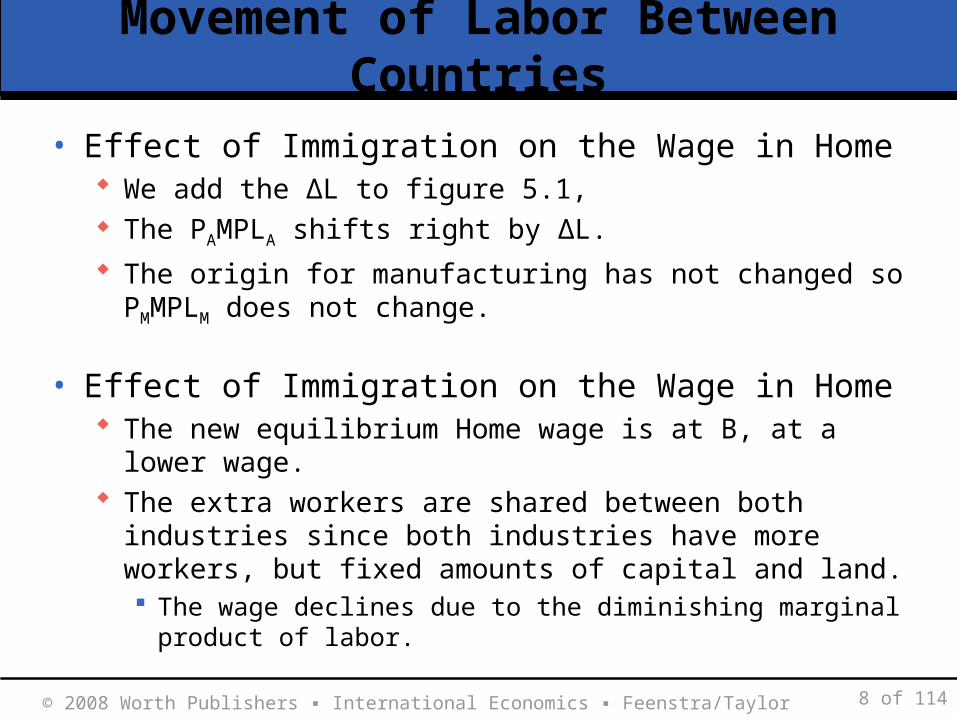
• Effect of Immigration on the Wage in Home We add the ΔL to figure 5.1, The PAMPLA shifts right by ΔL.
The origin for manufacturing has not changed so PMMPLM does not change.
• Effect of Immigration on the Wage in Home The new equilibrium Home wage is at B, at a lower wage. The extra workers are shared between both industries since
both industries have more workers, but fixed amounts of capital and land. The wage declines due to the diminishing marginal product of
labor.
© 2008 Worth Publishers ▪ International Economics ▪ Feenstra/Taylor 9 of 114
Movement of Labor Between Countries
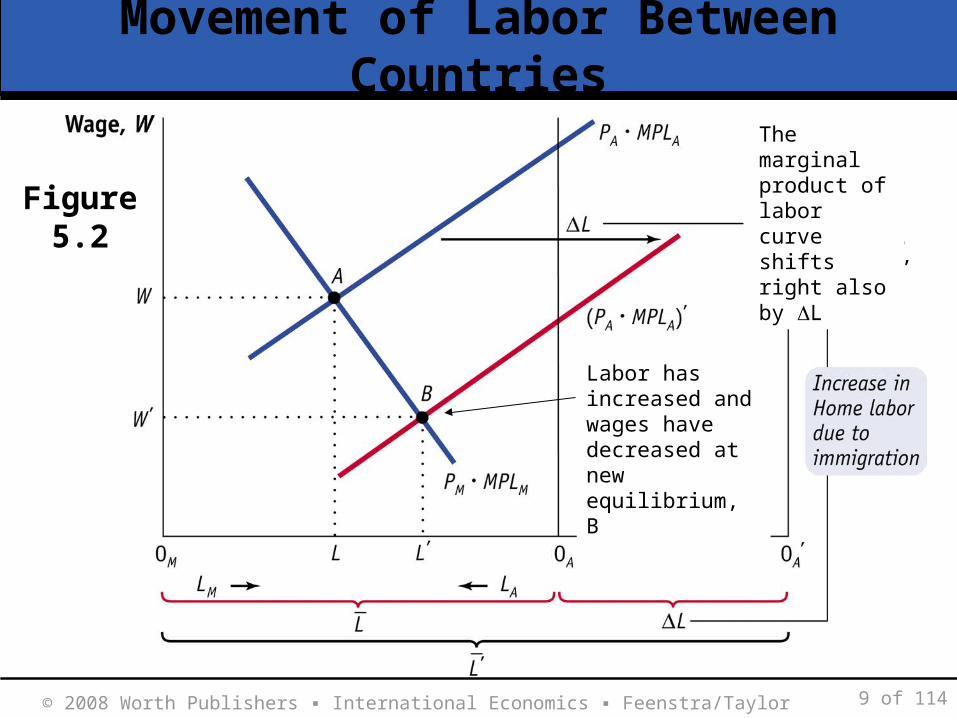
Immigration increases total labor by L, shifting the origin to 0A’
The marginal product of labor curve shifts right also by L
Labor has increased and wages have decreased at new equilibrium, B
Figure 5.2
APPLICATION
© 2008 Worth Publishers ▪ International Economics ▪ Feenstra/Taylor 10 of 114
Immigration to the New World
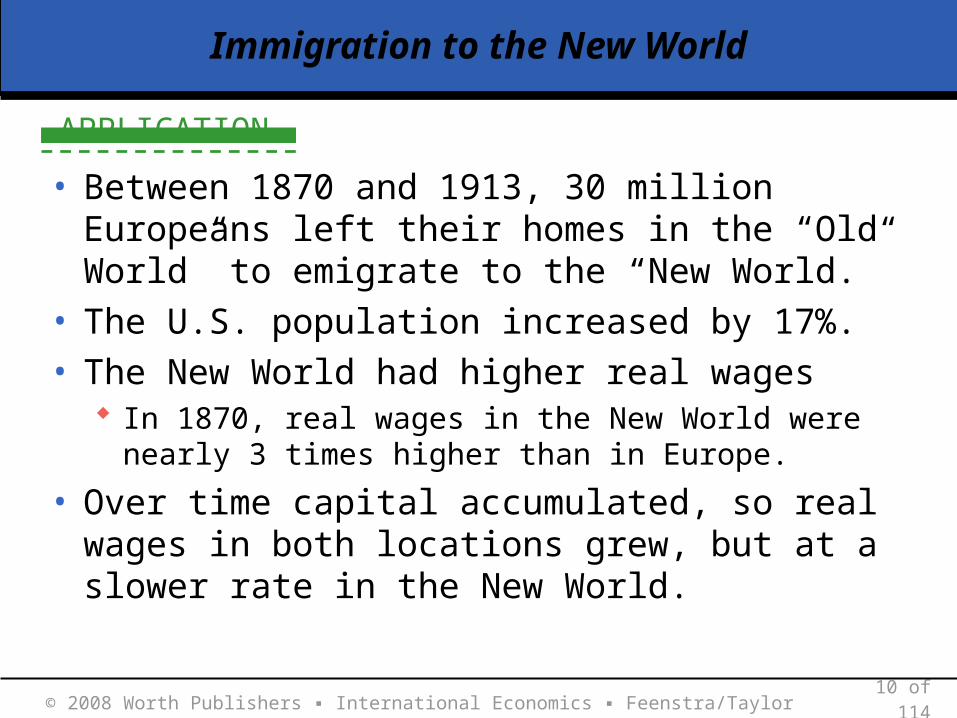
• Between 1870 and 1913, 30 million Europeans left their homes in the “Old World” to emigrate to the “New World.”
• The U.S. population increased by 17%.• The New World had higher real wages
In 1870, real wages in the New World were nearly 3 times higher than in Europe.
• Over time capital accumulated, so real wages in both locations grew, but at a slower rate in the New World.

APPLICATION
© 2008 Worth Publishers ▪ International Economics ▪ Feenstra/Taylor 11 of 114
Immigration to the New World
Figure 5.3

APPLICATION
© 2008 Worth Publishers ▪ International Economics ▪ Feenstra/Taylor 12 of 114
Immigration to the US and Europe Today
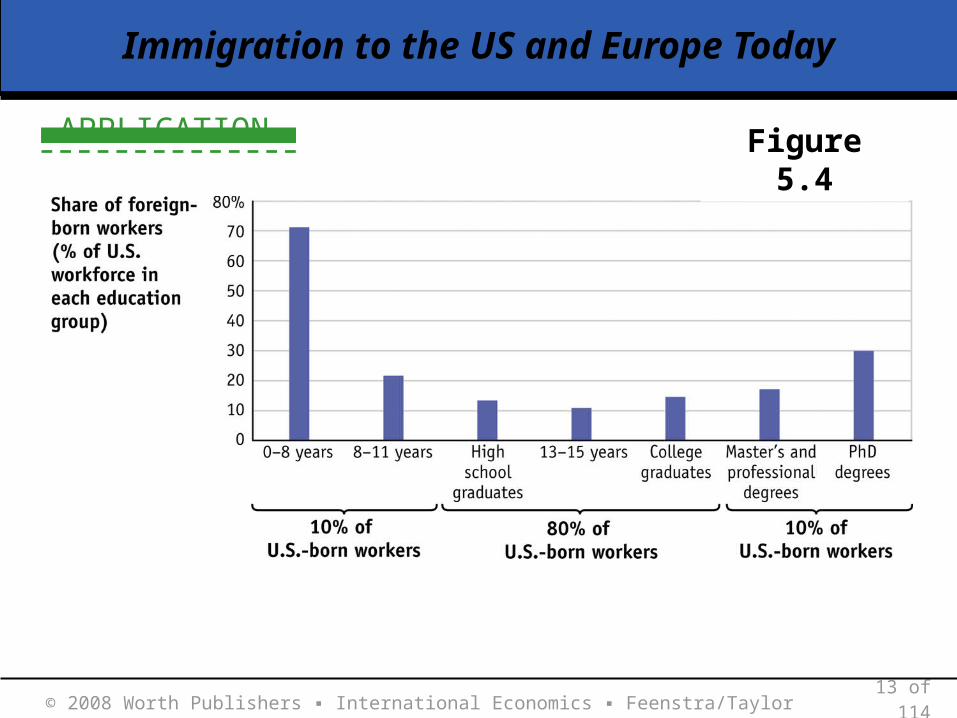
• These days, we see migration from developing countries to wealthier ones. In many cases, the immigration includes a mix of low-skilled
workers and high-skilled workers.
• In the U.S. much of the recent debate focused on the issue of illegal immigration. There are about 12 million illegal immigrants in the U.S. This often obscures the fact that the majority of immigrants are
legal.
• The combination of legal and illegal immigrants in the U.S. creates a U-shaped pattern between the number of immigrants and their educational level.
APPLICATION
© 2008 Worth Publishers ▪ International Economics ▪ Feenstra/Taylor 13 of 114
Immigration to the US and Europe Today
Figure 5.4

APPLICATION
© 2008 Worth Publishers ▪ International Economics ▪ Feenstra/Taylor 14 of 114
Immigration to the US and Europe Today
• Illegal immigrants into the U.S. compete primarily with the lowest-educated workers.
• Legal immigrants compete with workers at the highest educational levels.
• Under the specific factors model, the greatest impact on labor will be for the lowest and highest educated U.S. workers. This is supported by the data.
• The negative impact of immigration on wages is fairly modest for most workers and is offset with capital moves between industries as discussed later.

HEADLINES
© 2008 Worth Publishers ▪ International Economics ▪ Feenstra/Taylor 15 of 114
EU’s New Tack on Immigration
• A new EU-wide “green card” would allow skilled workers already in the 25-nation bloc to change countries without extra paperwork.
• Europe's work force is expected to shrink by 20 million between now and 2040.
• Businesses complain regularly about a shortage of highly skilled personnel.
• EU commissioner Franco Frattini has a vision: A North African engineer could go to work in Europe, earn good
money, and return regularly to his hometown to start and maintain a business.
Mr. Frattini uses the term “brain circulation” instead of the accusatory term “brain drain.”
© 2008 Worth Publishers ▪ International Economics ▪ Feenstra/Taylor 16 of 114
Movement of Labor Between Countries
• Other Effects of Immigration in the Short Run
U.S. and Europe have both welcomed foreign workers in specific industries: agriculture and high-tech.
Why do they do so if those foreign workers compete with domestic workers in those industries.
Answer: Immigration increases rental rates on capital and land.
• Rentals on Capital and Land
Given this, it should not be surprising that owners of capital and land often support more open borders.
© 2008 Worth Publishers ▪ International Economics ▪ Feenstra/Taylor 17 of 114
Movement of Labor Between Countries
• Need to consider the political economy of immigration: lobby groups.
• Effect of Immigration on Industry Output We showed before that immigration led to an increased
labor force in each industry. With more workers and the same amount of capital and
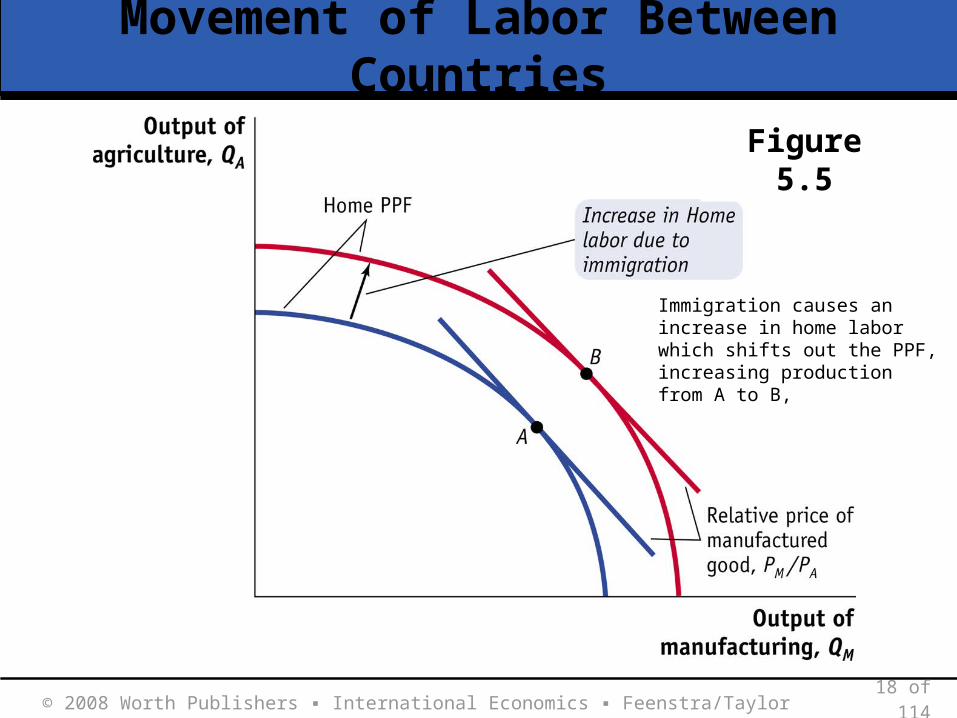
land, output rises in both industries. Immigration leads to an outward shift in the PPF. This result depends on the short-run nature of the
specific factors model. If land and capital are not fixed, as in the long run, one
industry's output will rise while the other will fall.
© 2008 Worth Publishers ▪ International Economics ▪ Feenstra/Taylor 18 of 114
Movement of Labor Between Countries
Immigration causes an increase in home labor which shifts out the PPF, increasing production from A to B,
Figure 5.5
© 2008 Worth Publishers ▪ International Economics ▪ Feenstra/Taylor 19 of 114
Effects of Immigration in the Long Run
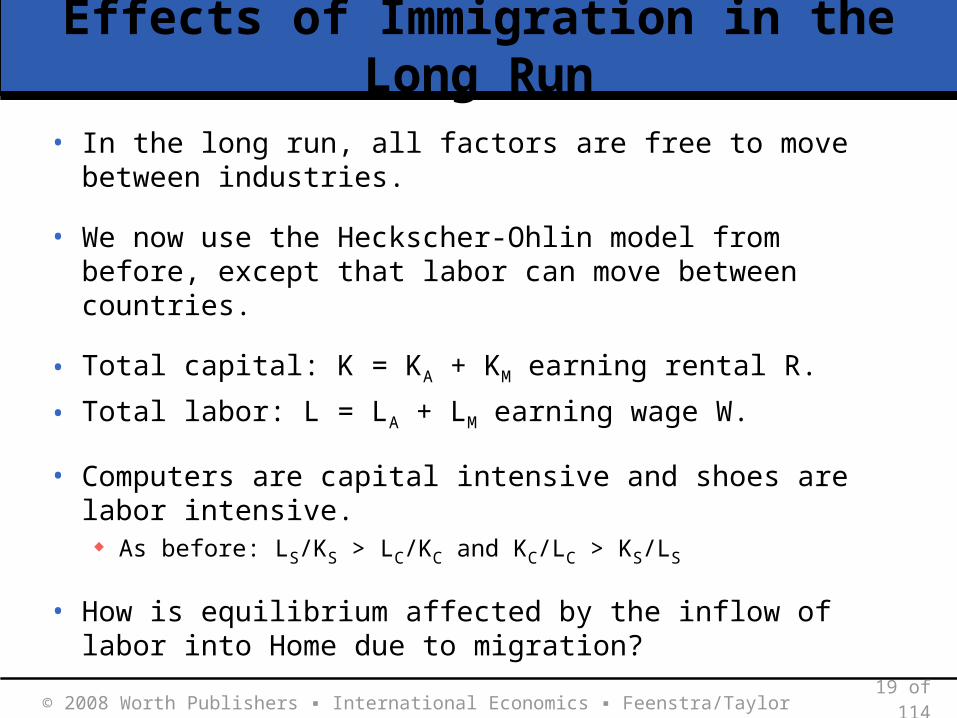
• In the long run, all factors are free to move between industries.
• We now use the Heckscher-Ohlin model from before, except that labor can move between countries.
• Total capital: K = KA + KM earning rental R.
• Total labor: L = LA + LM earning wage W.
• Computers are capital intensive and shoes are labor intensive. As before: LS/KS > LC/KC and KC/LC > KS/LS
• How is equilibrium affected by the inflow of labor into Home due to migration?
© 2008 Worth Publishers ▪ International Economics ▪ Feenstra/Taylor 20 of 114
Effects of Immigration in the Long Run
Figure 5.6
© 2008 Worth Publishers ▪ International Economics ▪ Feenstra/Taylor 21 of 114
Effects of Immigration in the Long Run
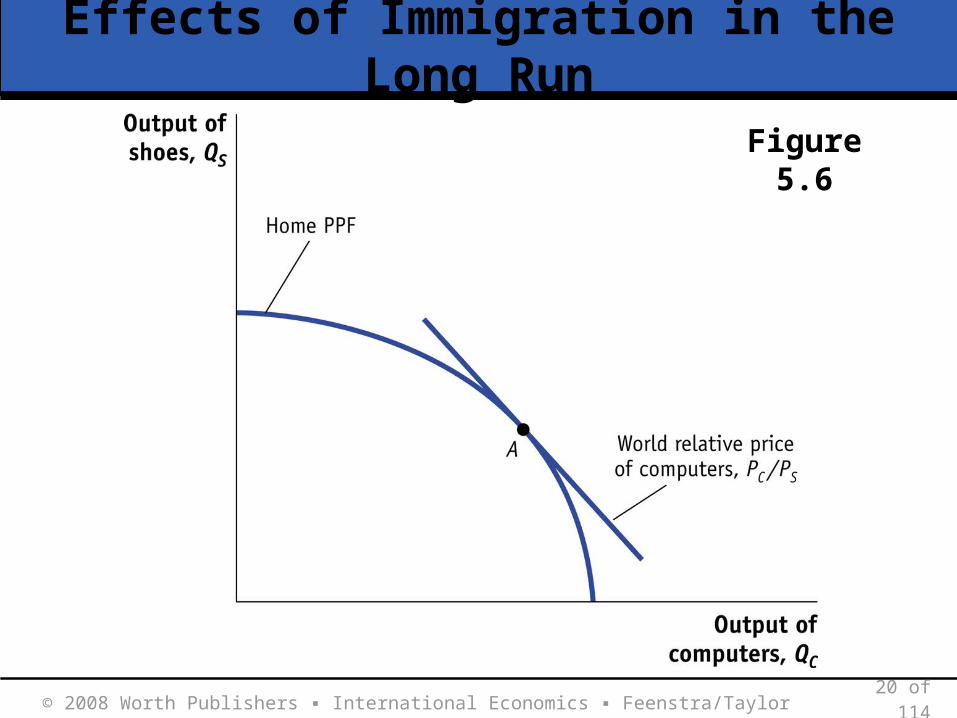
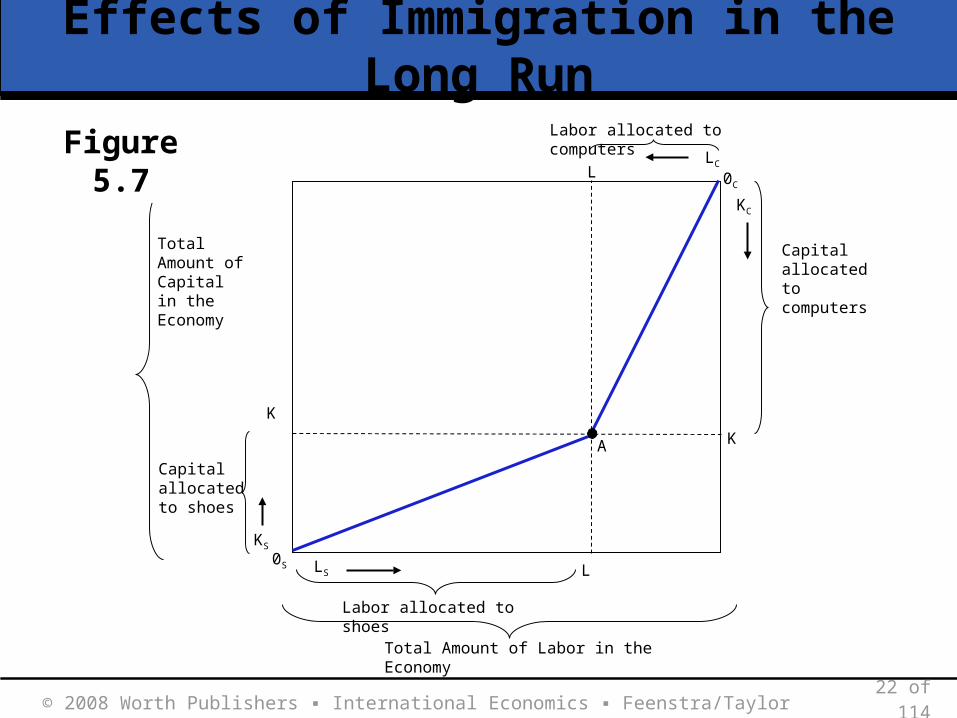
• Box Diagram Figure 5.7 shows a new box diagram to help us answer
our question. Length is total amount of labor at Home, L. The vertical axes measure the total amount of capital,
K, at home, in each industry. OSA shows the amount of labor and capital used in
shoes and OCA in computers.
The capital-labor ratio in each industry is the slope of the respective industry line. OSA is flatter, so capital-labor ratio in shoes is less than in
computers.
© 2008 Worth Publishers ▪ International Economics ▪ Feenstra/Taylor 22 of 114
Effects of Immigration in the Long Run
L
K
K
L
LS
LC
KC
KS
0S
0C
Labor allocated to computers
Capital allocated to shoes
Capital allocated to computers
Labor allocated to shoes
Total Amount of Capital in the Economy
Total Amount of Labor in the Economy
A
Figure 5.7
© 2008 Worth Publishers ▪ International Economics ▪ Feenstra/Taylor 23 of 114
Effects of Immigration in the Long Run
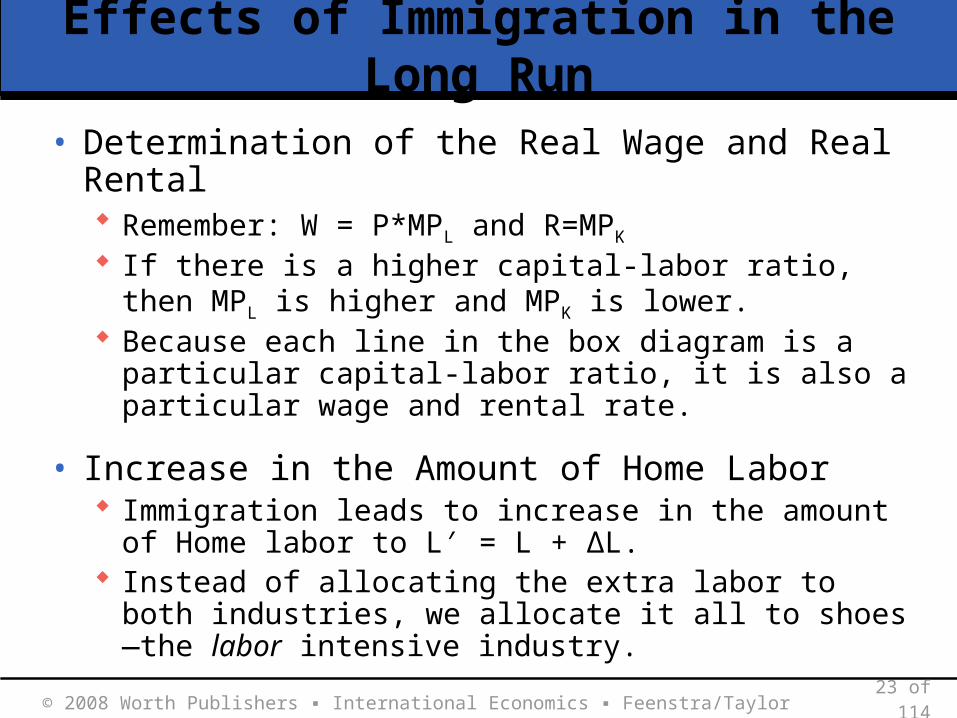
• Determination of the Real Wage and Real Rental Remember: W = P*MPL and R=MPK
If there is a higher capital-labor ratio, then MPL is higher and MPK is lower.
Because each line in the box diagram is a particular capital-labor ratio, it is also a particular wage and rental rate.
• Increase in the Amount of Home Labor Immigration leads to increase in the amount of Home
labor to L′ = L + ΔL. Instead of allocating the extra labor to both industries,
we allocate it all to shoes—the labor intensive industry.

© 2008 Worth Publishers ▪ International Economics ▪ Feenstra/Taylor 24 of 114
Effects of Immigration in the Long Run
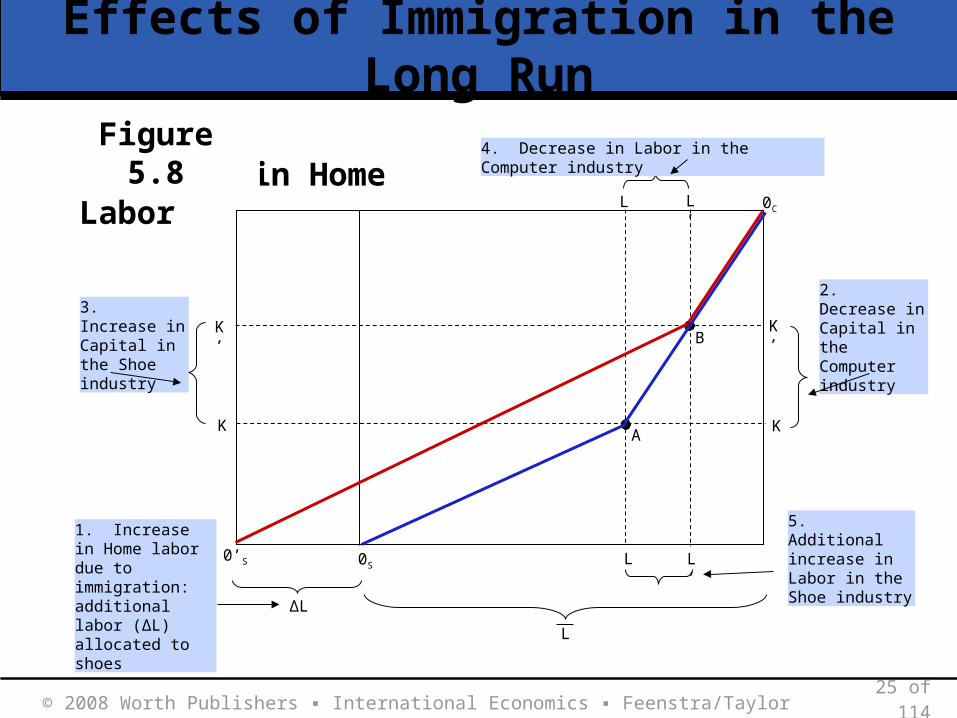
• Increase in the Amount of Home Labor Because both labor and capital increase in shoes, the
capital-labor ratio is unchanged. Notice the slopes of the lines have not changed.
Since the capital-labor ratios are unchanged, so are the marginal products.
Therefore the wages and rentals are unchanged.
When capital can move freely between industries, immigration in the long run has no impact on the wage and rental rates.
© 2008 Worth Publishers ▪ International Economics ▪ Feenstra/Taylor 25 of 114
Effects of Immigration in the Long Run
A
L
L L’
L’
BK’
K
K’
K
0S0’S
0C
L
ΔL
1. Increase in Home labor due to immigration: additional labor (ΔL) allocated to shoes
2. Decrease in Capital in the Computer industry
3. Increase in Capital in the Shoe industry
4. Decrease in Labor in the Computer industry
5. Additional increase in Labor in the Shoe industry
Increase in Home LaborFigure 5.8
© 2008 Worth Publishers ▪ International Economics ▪ Feenstra/Taylor 26 of 114
Effects of Immigration in the Long Run
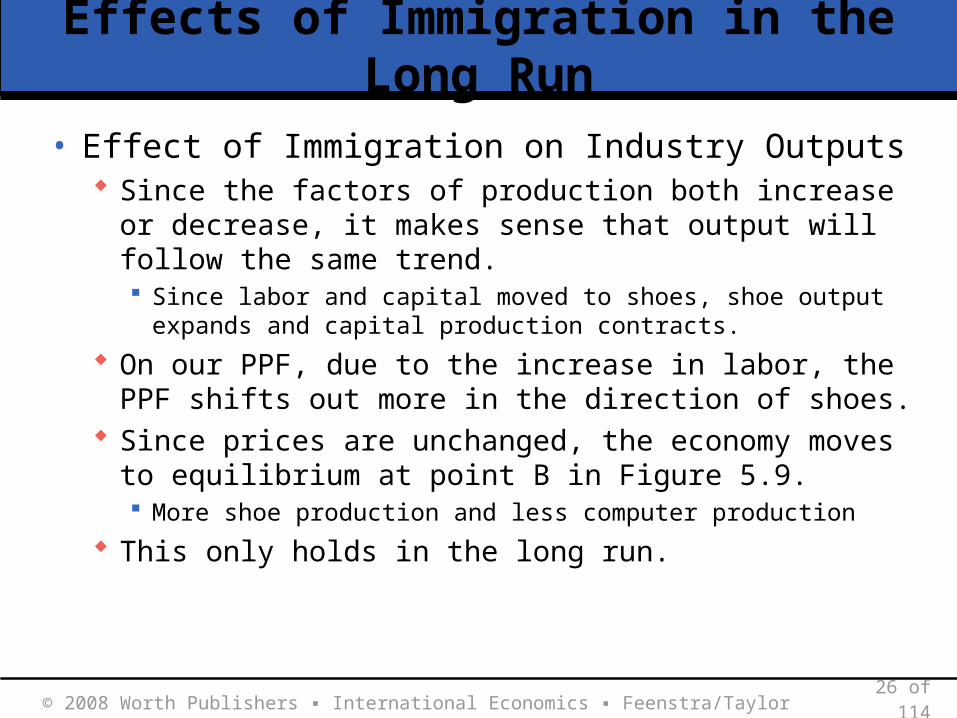
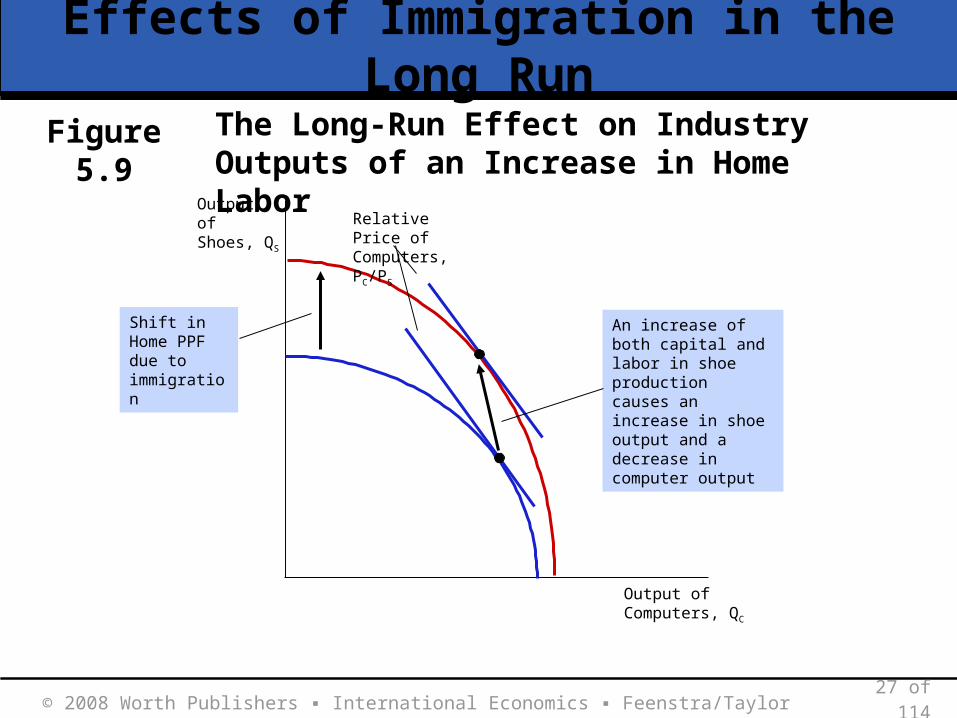
• Effect of Immigration on Industry Outputs Since the factors of production both increase or
decrease, it makes sense that output will follow the same trend. Since labor and capital moved to shoes, shoe output expands
and capital production contracts.
On our PPF, due to the increase in labor, the PPF shifts out more in the direction of shoes.
Since prices are unchanged, the economy moves to equilibrium at point B in Figure 5.9. More shoe production and less computer production
This only holds in the long run.
© 2008 Worth Publishers ▪ International Economics ▪ Feenstra/Taylor 27 of 114
Effects of Immigration in the Long Run
Output of Computers, QC
Output of Shoes, QS
Relative Price of Computers, PC/PS
Shift in Home PPF due to immigration
An increase of both capital and labor in shoe production causes an increase in shoe output and a decrease in computer output
The Long-Run Effect on Industry Outputs of an Increase in Home Labor
Figure 5.9
© 2008 Worth Publishers ▪ International Economics ▪ Feenstra/Taylor 28 of 114
Effects of Immigration in the Long Run
• Rybczynski Theorem:In the Heckscher-Ohlin model with two goods andtwo factors, an increase in the amount of a factorfound in an economy will increase the output ofthe industry using that factor intensively anddecrease the output of the other industry.
• Factor Price Insensitivity:In the Heckscher-Ohlin model with two goods and two factors, an increase in the amount of a factor found in an economy can be absorbed by changing the outputs of the industries, without any change in the factor prices.
APPLICATION
© 2008 Worth Publishers ▪ International Economics ▪ Feenstra/Taylor 29 of 114
The Effects of the Mariel Boat Lift on Industry Output in Miami
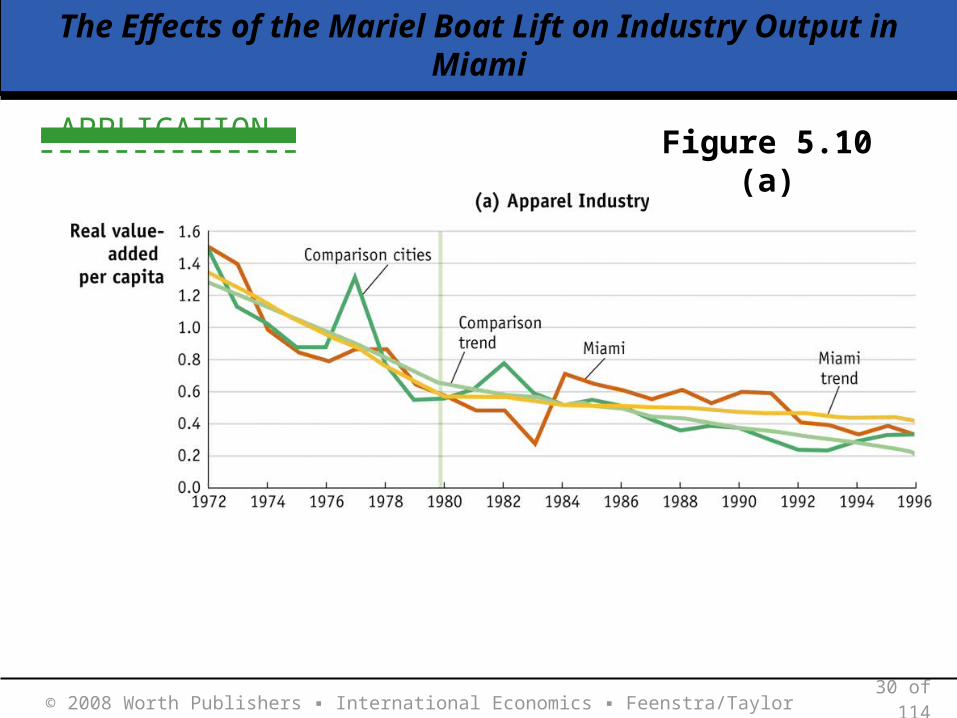
• Figure 5.10 panel (a) shows real value added in the apparel industry for Miami and the average of comparison cities. Adjust for city size by looking at value added per capita. The industry decline in Miami is slightly slower than in
comparison cities after 1980.
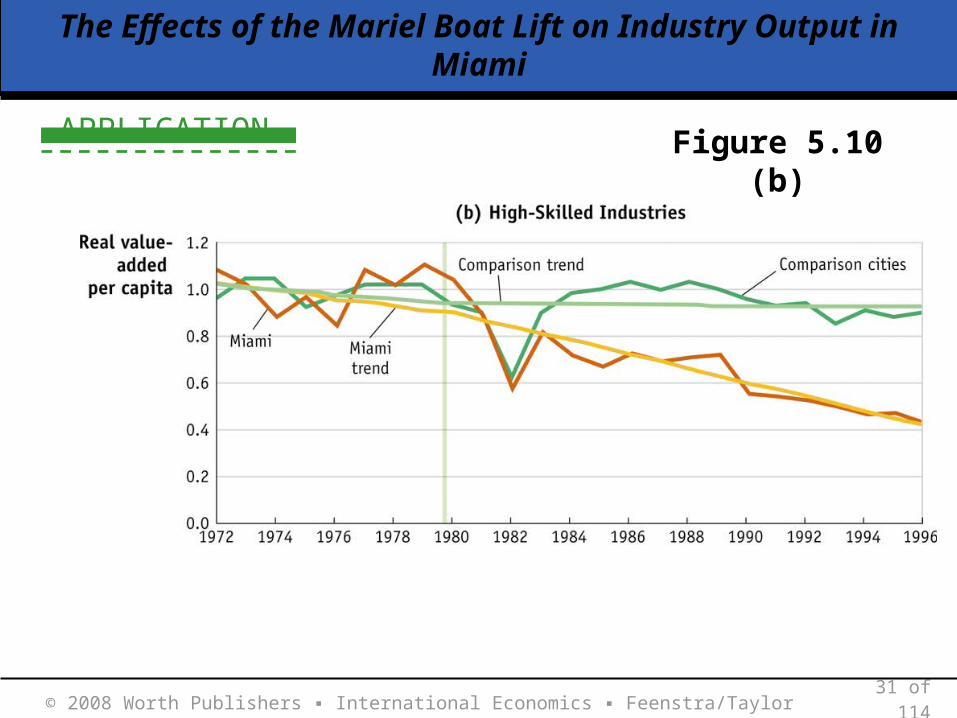
• Panel (b) shows the output of a group of skill-intensive industries. These industries fell more rapidly in Miami after 1980.
• These results support the Rybczynski Theorem
APPLICATION
© 2008 Worth Publishers ▪ International Economics ▪ Feenstra/Taylor 30 of 114
The Effects of the Mariel Boat Lift on Industry Output in Miami
Figure 5.10 (a)
APPLICATION
© 2008 Worth Publishers ▪ International Economics ▪ Feenstra/Taylor 31 of 114
The Effects of the Mariel Boat Lift on Industry Output in Miami
Figure 5.10 (b)

APPLICATION
© 2008 Worth Publishers ▪ International Economics ▪ Feenstra/Taylor 32 of 114
The Effects of the Mariel Boat Lift on Industry Output in Miami
• Wages did not really change during this time.• Is this also from the Rybczynski Theorem?• During this time, computer use in manufacturing was
increasing significantly.• This increase was much slower in Miami than in similar
cities.• One explanation is that firms employed the Mariel
refugees and other low-skilled workers rather than switching to computer technologies.
• This is just another example of how the refugees could be absorbed across many industries.
APPLICATION
© 2008 Worth Publishers ▪ International Economics ▪ Feenstra/Taylor 33 of 114
Immigration and US Wages, 1990 - 2004
• There has been slightly more than a doubling of foreign-born persons in the U.S. in 25 years.
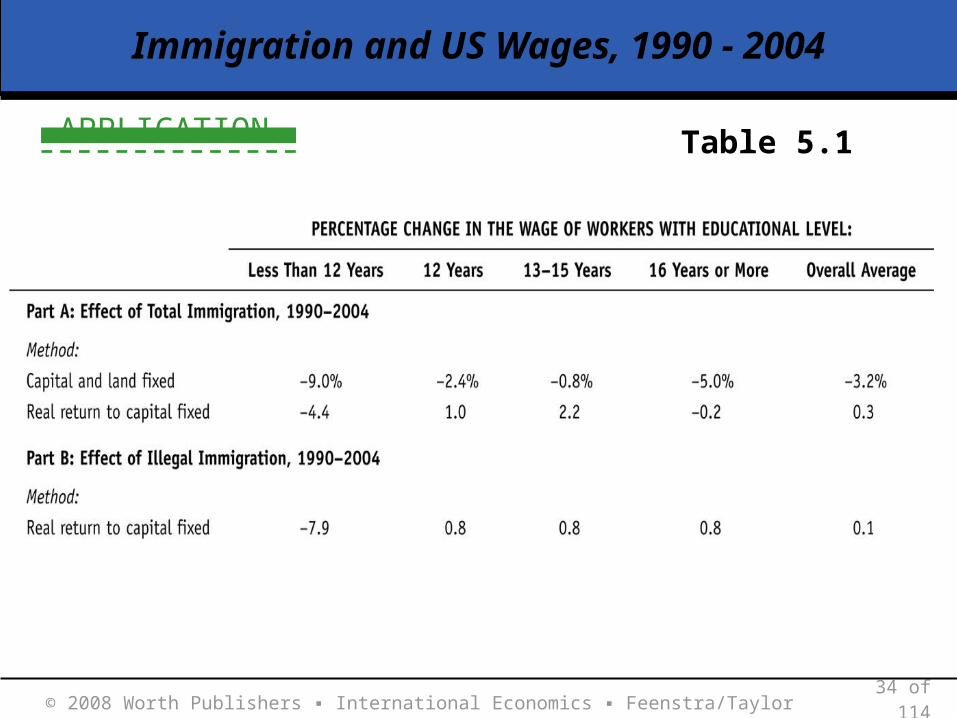
• Table 5.1 reports the estimated impact of immigration over 1990-2004 on wages of various workers, distinguished by education level.
• When we allow capital to grow in each industry to accommodate the inflow of immigrants (second approach), total U.S. immigration has a negative impact on only the lowest and highest-educated workers.
APPLICATION
© 2008 Worth Publishers ▪ International Economics ▪ Feenstra/Taylor 34 of 114
Immigration and US Wages, 1990 - 2004
Table 5.1
© 2008 Worth Publishers ▪ International Economics ▪ Feenstra/Taylor 35 of 114
Movement of Capital between Countries: Foreign Direct Investment
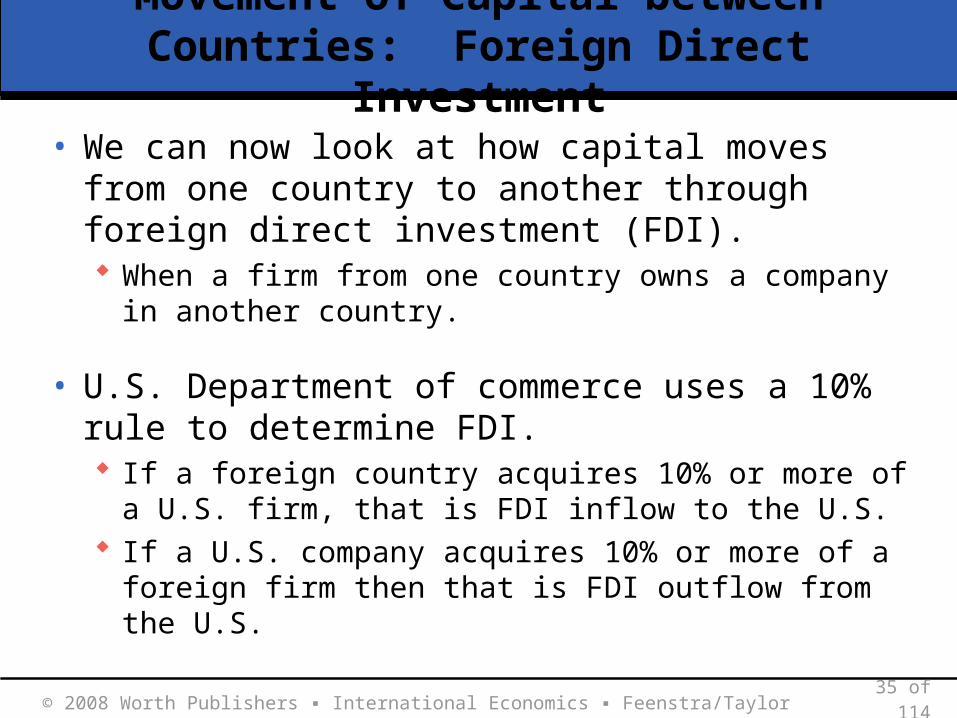
• We can now look at how capital moves from one country to another through foreign direct investment (FDI). When a firm from one country owns a company in
another country.
• U.S. Department of commerce uses a 10% rule to determine FDI. If a foreign country acquires 10% or more of a U.S.
firm, that is FDI inflow to the U.S. If a U.S. company acquires 10% or more of a foreign
firm then that is FDI outflow from the U.S.

© 2008 Worth Publishers ▪ International Economics ▪ Feenstra/Taylor 36 of 114
Movement of Capital between Countries: Foreign Direct Investment
• Greenfield FDI—when a company builds a plant in a foreign country.
• Acquisition FDI (or brownfield FDI)— when a firm buys an existing foreign plant.
• Our focus here will be on Greenfield investment
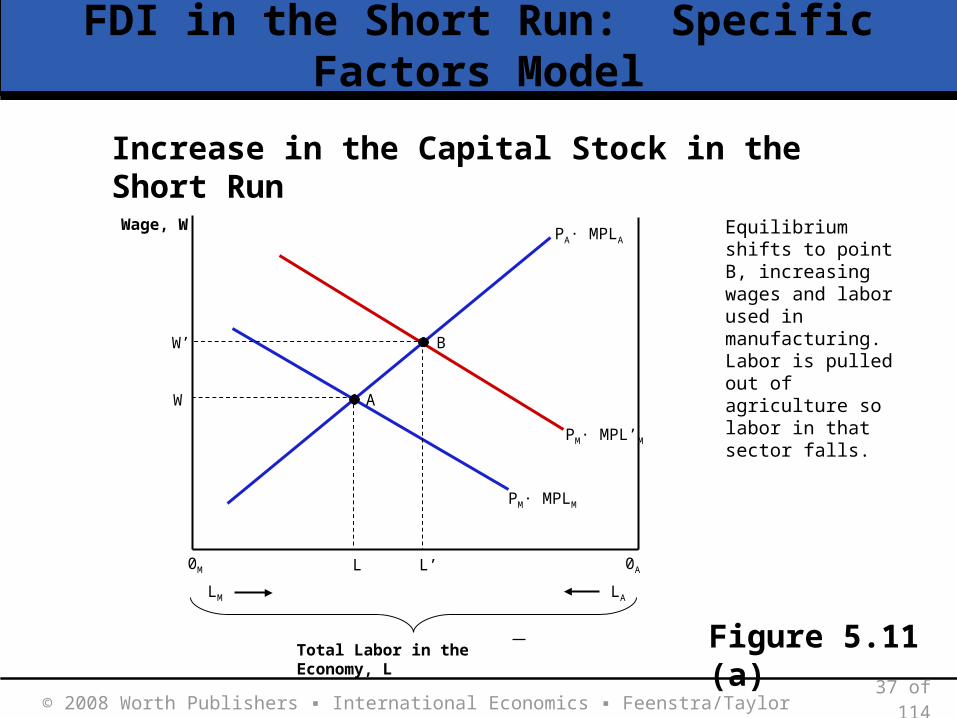
• FDI in the Short Run: Specific Factors Model Manufacturing uses capital and labor. Agriculture uses land and labor. As capital moves into the economy, it will be used in
manufacturing, raising the marginal product of labor. Therefore it will shift out the curve PMMPLM
© 2008 Worth Publishers ▪ International Economics ▪ Feenstra/Taylor 37 of 114
FDI in the Short Run: Specific Factors Model
0A0M
W
L
W’
L’
A
PA· MPLA
LA
Wage, W
LM
Total Labor in the Economy, L
B
PM· MPL’M
PM· MPLM
An inflow of capital into the manufacturing sector shifts out the marginal product of labor curve in that sector
Equilibrium shifts to point B, increasing wages and labor used in manufacturing. Labor is pulled out of agriculture so labor in that sector falls.
Increase in the Capital Stock in the Short Run
Figure 5.11 (a)
© 2008 Worth Publishers ▪ International Economics ▪ Feenstra/Taylor 38 of 114
FDI in the Short Run: Specific Factors Model
• Effect of FDI on the Wage The equilibrium wage increases to W′ More workers are drawn in to manufacturing,
decreasing labor in the agricultural sector.
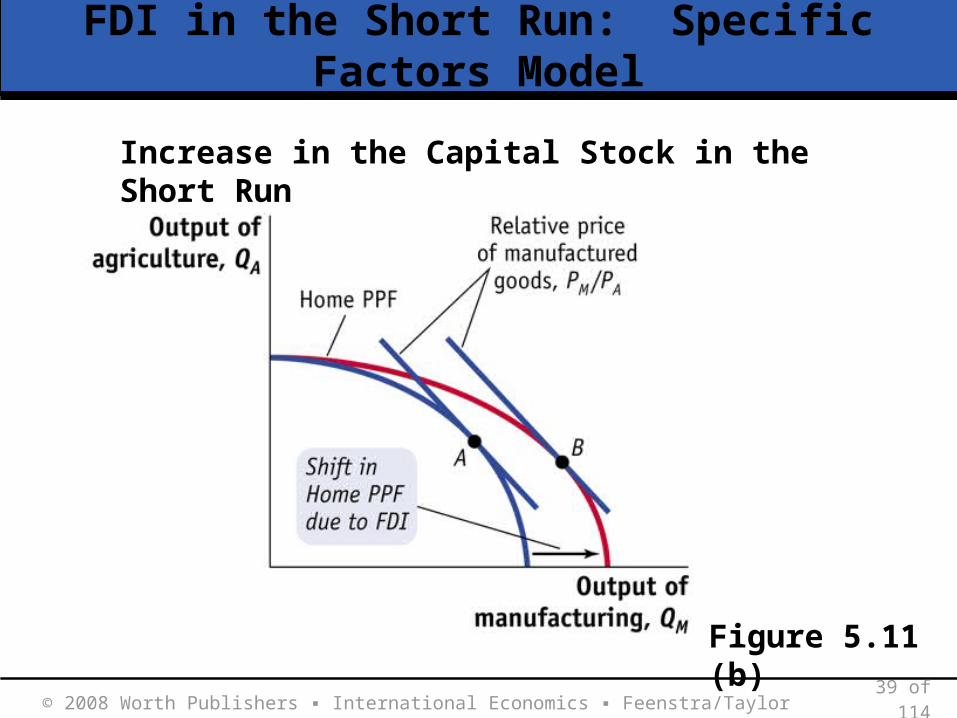
• Effect of FDI on the Industry Outputs Since land has not changed, output of agriculture falls. Since labor and capital increase in manufacturing,
output must increase. No change in prices of goods. As PPF increases, equilibrium shifts to B.
© 2008 Worth Publishers ▪ International Economics ▪ Feenstra/Taylor 39 of 114
FDI in the Short Run: Specific Factors Model
Figure 5.11 (b)
Increase in the Capital Stock in the Short Run
© 2008 Worth Publishers ▪ International Economics ▪ Feenstra/Taylor 40 of 114
FDI in the Short Run: Specific Factors Model
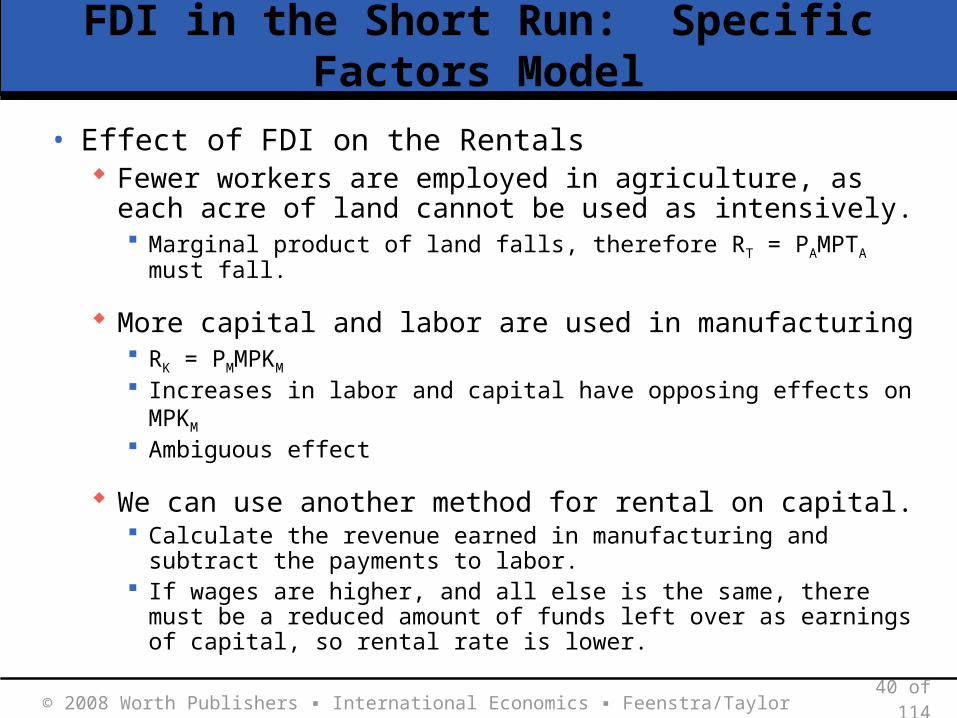
• Effect of FDI on the Rentals Fewer workers are employed in agriculture, as each
acre of land cannot be used as intensively. Marginal product of land falls, therefore RT = PAMPTA must fall.
More capital and labor are used in manufacturing RK = PMMPKM
Increases in labor and capital have opposing effects on MPKM
Ambiguous effect
We can use another method for rental on capital. Calculate the revenue earned in manufacturing and subtract
the payments to labor. If wages are higher, and all else is the same, there must be a
reduced amount of funds left over as earnings of capital, so rental rate is lower.
© 2008 Worth Publishers ▪ International Economics ▪ Feenstra/Taylor 41 of 114
FDI in the Short Run: Specific Factors Model
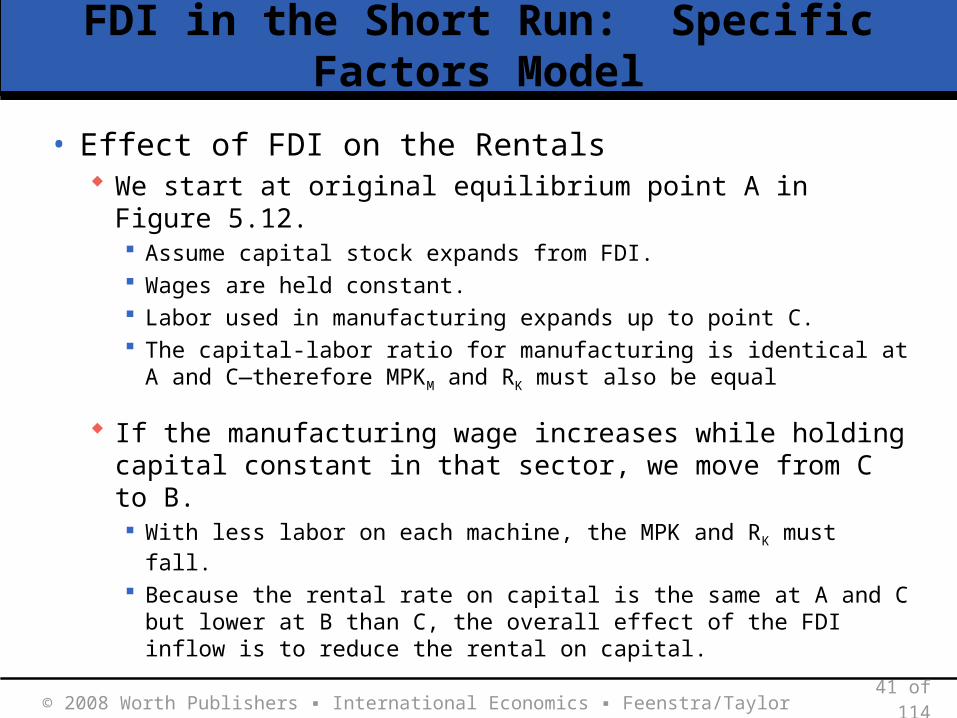
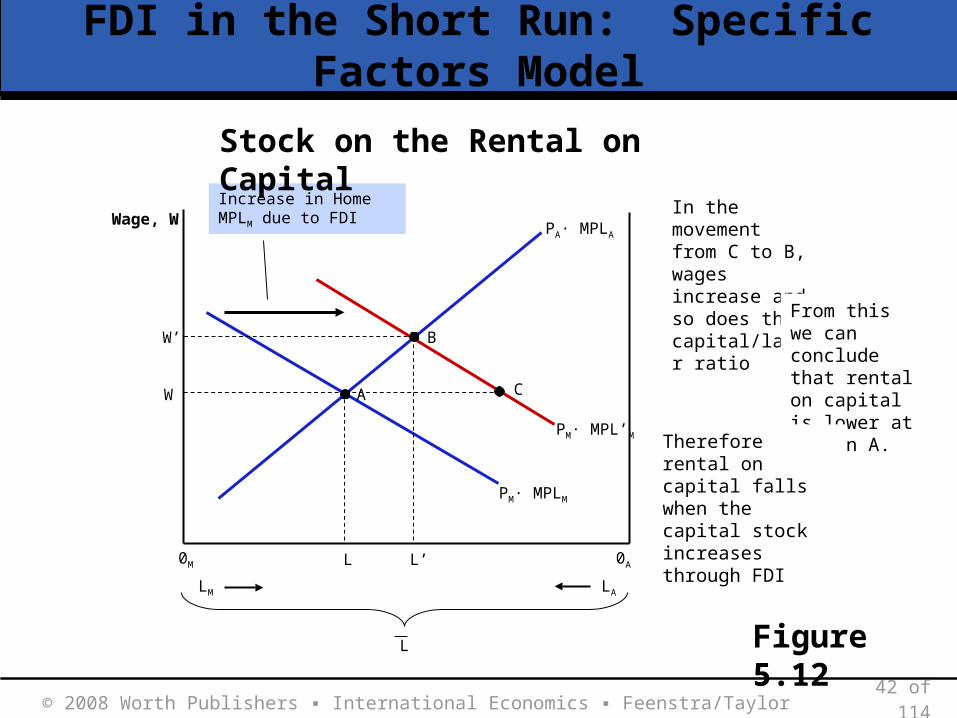
• Effect of FDI on the Rentals We start at original equilibrium point A in Figure 5.12.
Assume capital stock expands from FDI. Wages are held constant. Labor used in manufacturing expands up to point C. The capital-labor ratio for manufacturing is identical at A and C
—therefore MPKM and RK must also be equal
If the manufacturing wage increases while holding capital constant in that sector, we move from C to B. With less labor on each machine, the MPK and RK must fall.
Because the rental rate on capital is the same at A and C but lower at B than C, the overall effect of the FDI inflow is to reduce the rental on capital.
© 2008 Worth Publishers ▪ International Economics ▪ Feenstra/Taylor 42 of 114
FDI in the Short Run: Specific Factors Model
0A0M
W
L
A
PA· MPLA
LA
Wage, W
LM
W’
L’
B
PM· MPL’M
PM· MPLM
Increase in Home MPLM due to FDI
C
Moving from A to C, wages and hence the capital/labor ratio do not change
In the movement from C to B, wages increase and so does the capital/labor ratio From this we
can conclude that rental on capital is lower at B than A.
Therefore rental on capital falls when the capital stock increases through FDI
L
Stock on the Rental on Capital
Figure 5.12
© 2008 Worth Publishers ▪ International Economics ▪ Feenstra/Taylor 43 of 114
FDI in the Long Run
• We continue with the same assumptions as before. Computers (shoes) are capital (labor) intensive.
• Effect of FDI on Outputs and Factor Prices Capital increase due to FDI. Box panel sides expand with new origin at O’C OSB is shorter than OSA so less labor and less capital
are used in the production of shoes and output falls. OCB is longer than OCA so more labor and more capital
are used and the output of computers rises.
© 2008 Worth Publishers ▪ International Economics ▪ Feenstra/Taylor 44 of 114
FDI in the Long Run
• Effect of FDI on Outputs and Factor Prices Change in output is from point A to B in panel (b). As the Rybczynski Theorem states, the increase in
capital through FDI has increased the output of the capital-intensive industry and reduced the output of the labor-intensive industry.
Because capital-labor ratios are unchanged, the wage and the rental on capital are also unchanged.
In the long run model, an inflow of either factor of production will leave factor prices unchanged.
For immigration, we found actual cases where wages were reduced (short run) and where wages were constant (long run).
There are fewer studies for FDI.
APPLICATION
© 2008 Worth Publishers ▪ International Economics ▪ Feenstra/Taylor 45 of 114
The Effect of FDI on Rentals and Wages in Singapore
• Singapore has encouraged foreign firms to establish subsidiaries within its borders, especially in the electronics industry.
• Singapore has the fourth-largest amount of FDI in the world.
• What has happened to the rental rate and the wage?
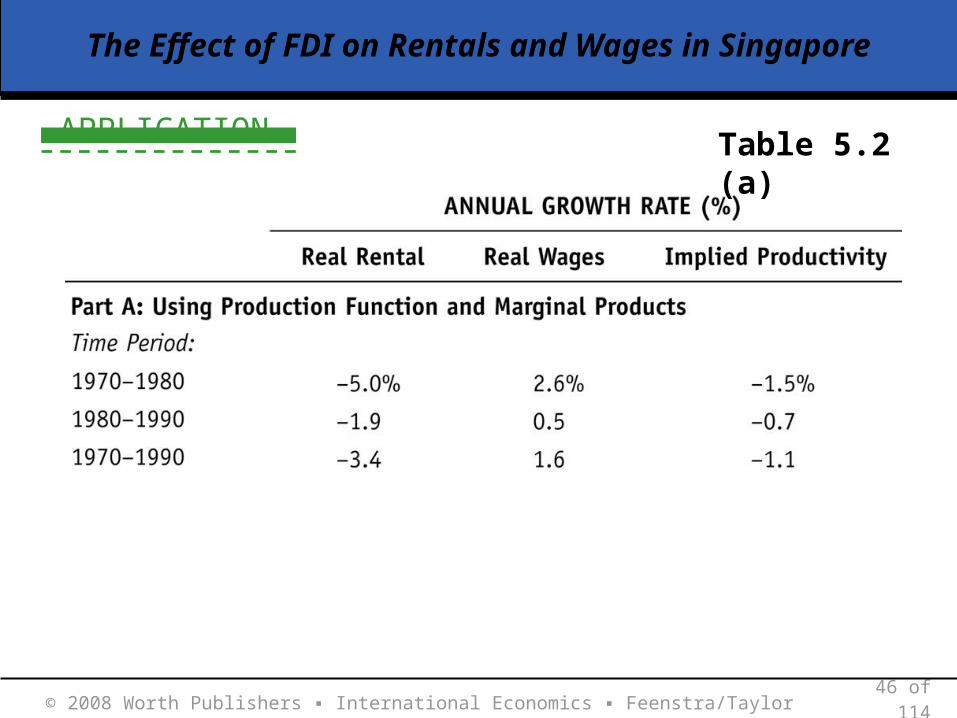
• Table 5.2, part A, shows much of this. MPK has fallen due to diminishing returns. Each worker has more capital, so MPL increases. These are consistent with specific factors model.
APPLICATION
© 2008 Worth Publishers ▪ International Economics ▪ Feenstra/Taylor 46 of 114
The Effect of FDI on Rentals and Wages in Singapore
Table 5.2 (a)

APPLICATION
© 2008 Worth Publishers ▪ International Economics ▪ Feenstra/Taylor 47 of 114
The Effect of FDI on Rentals and Wages in Singapore
• Second approach to calculating the rental on capital. If capital was rented instead of purchased, what would the
rental be? If it invests PK at interest rate i, could expect PKi
We must also consider depreciation on capital. Real rental is:
• Table 5.2 part B shows the growth rate in the real rental computed from this formula. Real wages grow over time. This is not expected from our long run model.
)( diP
P
P
R K

APPLICATION
© 2008 Worth Publishers ▪ International Economics ▪ Feenstra/Taylor 48 of 114
The Effect of FDI on Rentals and Wages in Singapore
Table 5.2 (b)
• This is an indication of productivity growth This leads to an increase in the MPL and in the real
wage.
APPLICATION
© 2008 Worth Publishers ▪ International Economics ▪ Feenstra/Taylor 49 of 114
The Effect of FDI on Rentals and Wages in Singapore
• In part B productivity growth is positive, but in part A it is negative.
• The idea that Singapore might have no productivity growth contradicts what many believe about its economy and that of other fast-growing Asian countries.
• If there was no productivity growth then all growth is due to capital accumulation. FDI has no spillover benefits.
• Most economists believe that productivity increased but that belief is challenged by part A.
© 2008 Worth Publishers ▪ International Economics ▪ Feenstra/Taylor 50 of 114
Gains from Labor and Capital Flows
• Foreign investment and immigration are both controversial policy issues.
• Most countries have at some point controlled FDI but later became open to foreign investment.
• However, almost all countries impose limits on immigration.
• U.S. immigration controls were established by the Quota Law of 1921. Allows a limited number of persons arriving annually from
each country of origin See text for more of immigration law history.
© 2008 Worth Publishers ▪ International Economics ▪ Feenstra/Taylor 51 of 114
Gains from Labor and Capital Flows
• Why is immigration so controversial? Some groups oppose the spending of public funds on
immigration. Other groups fear the competition for jobs created by
an inflow of workers.
• Immigration benefits the host country in the specific factors model.
• If immigrant earnings with Foreign income are included then emigration benefits the Foreign country, too.
© 2008 Worth Publishers ▪ International Economics ▪ Feenstra/Taylor 52 of 114
Gains from Immigration
• To measure gains from immigration we will use the specific-factors model.
• We look at the total world labor with the Home and Foreign labor together: L + L*.
• Home workers are measured from the left and Foreign workers are measured from the right—on the horizontal axis.
• We can see how many workers are located in each country.
© 2008 Worth Publishers ▪ International Economics ▪ Feenstra/Taylor 53 of 114
Gains from Immigration
• Gains for the Home Country Even though all workers are paid the same wage. W’, the
first worker had an MPL equal to W
Thus, MPL*P>W’; immigrants raise the value of output more than they are paid in wages.
• Gains for the Foreign Country We need to include the wages received by the migrants who
left when calculating Foreign income. These wages are often returned to their families.
The difference between the wage earned by the migrants and their Foreign marginal products is the gain to Foreign.
© 2008 Worth Publishers ▪ International Economics ▪ Feenstra/Taylor 54 of 114
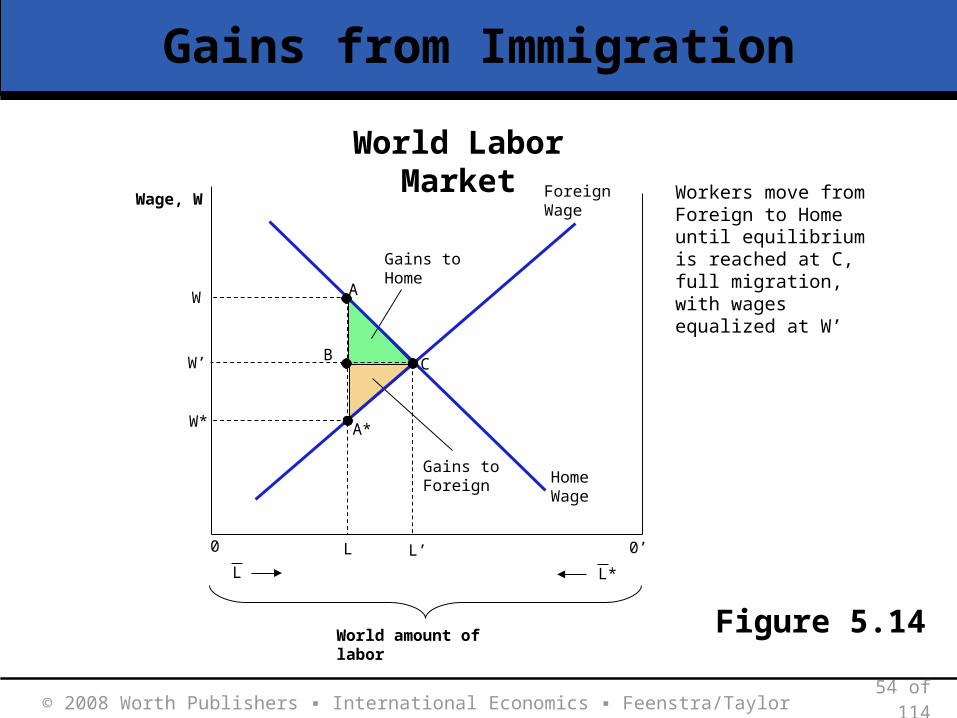
Gains to Foreign
Gains to Home
Gains from Immigration
0 0’
Wage, W
L L*
World amount of labor
A
A*
W
W*
L
BW’ C
L’
Home Wage
Foreign Wage The Home wage, W
determined by A, is higher than the Foreign Wage W* at A*
The gains to Home and Foreign from migration can be shown.
Workers move from Foreign to Home until equilibrium is reached at C, full migration, with wages equalized at W’
World Labor Market
Figure 5.14

SIDE BAR
© 2008 Worth Publishers ▪ International Economics ▪ Feenstra/Taylor 55 of 114
Immigrants and Their Remittances
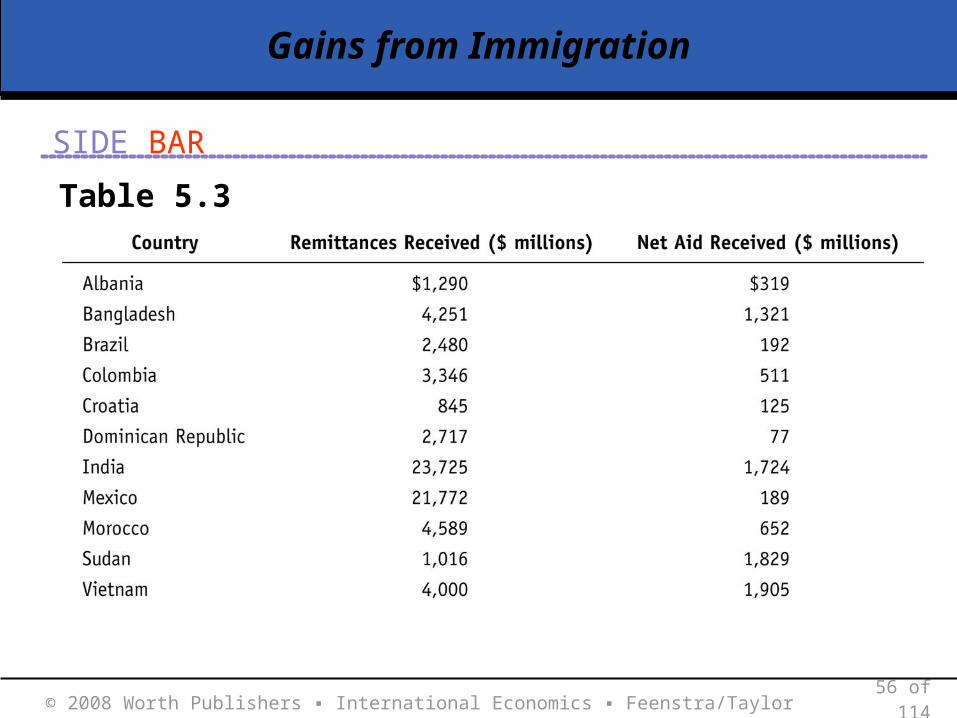
• Immigrants often send a substantial portion of their earnings back home—remittances.
• The International Monetary Fund (IMF) estimates that remittances were $126 billion in 2004, up from $72.3 million in 2001.
• The income sent home by immigrants is a larger source of income than is official aid (Table 5.3).
SIDE BAR
© 2008 Worth Publishers ▪ International Economics ▪ Feenstra/Taylor 56 of 114
Gains from Immigration
Table 5.3

SIDE BAR
© 2008 Worth Publishers ▪ International Economics ▪ Feenstra/Taylor 57 of 114
Immigrants and Their Remittances
• The fact that immigrants return some of their income back home may not be enough to compensate their home countries for the loss of their labor.
• To calculate the gains, we need to include all the earnings of the immigrants in their home countries’ income. In the case of highly-educated migrants, unless these migrants
return most of their earnings back home those countries lose from the outflow of these workers.
• Jagdish Bhagwati, an economist, has proposed that countries impose a “brain drain” tax on the outflow of educated workers.
© 2008 Worth Publishers ▪ International Economics ▪ Feenstra/Taylor 58 of 114
Gains from Immigration
• World Gains from Migration Combining the gains to the Home and Foreign
countries we obtain the triangular region ABA*, the world gains due to immigration.
One way to think about world gains from migration is that it equals the increase in world GDP due to immigration.
In practice, however, there are other costs that immigrants bear Moving costs, payments to traffickers of illegal immigrants.
These costs must be subtracted from the increase in GDP in order to obtain the net gains.

SIDE BAR
© 2008 Worth Publishers ▪ International Economics ▪ Feenstra/Taylor 59 of 114
How Large are Moving Costs?
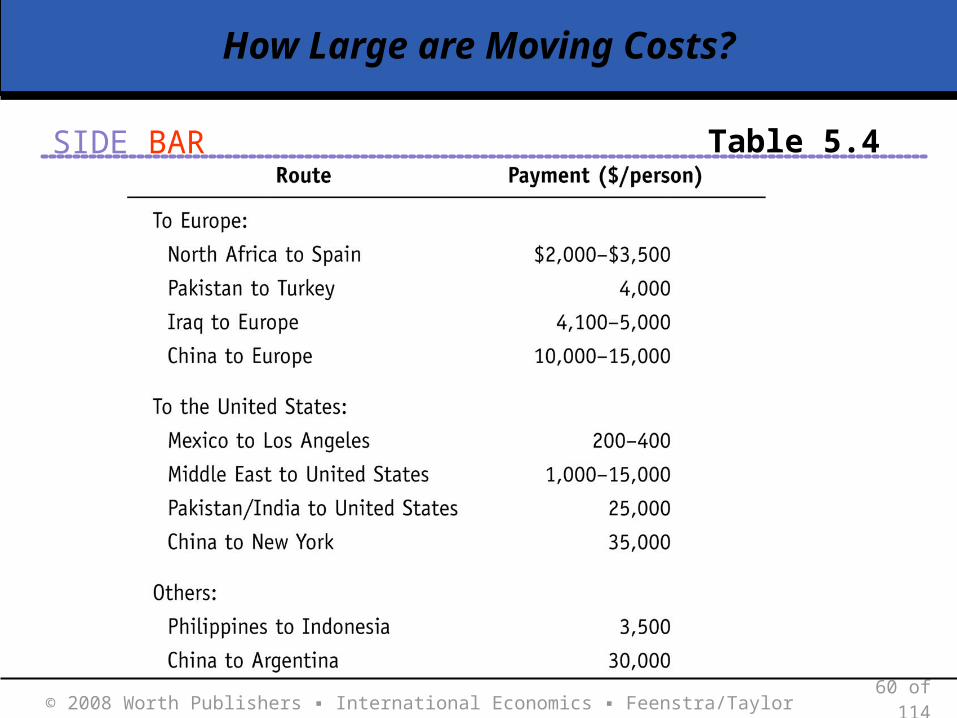
• Illegal immigrants are often willing to make high payments to traffickers to move from one country to another. Payments to traffickers are in Table 5.4.
• Even legal immigrants face some costs of migration, paying for transportation, legal expenses, wage discrimination, prejudice, etc.
• So moving costs are a lower-limit on the extra income they expect to receive, added up over the years they will be away.
SIDE BAR
© 2008 Worth Publishers ▪ International Economics ▪ Feenstra/Taylor 60 of 114
How Large are Moving Costs?
Table 5.4
SIDE BAR
© 2008 Worth Publishers ▪ International Economics ▪ Feenstra/Taylor 61 of 114
How Large are Moving Costs?
• When the costs of moving are high, then immigrants need to work abroad for enough years to more than cover these costs.
• In order to both have the income needed to pay costs and have enough working years left to make immigration worthwhile we expect immigrants to be middle-aged. This supports evidence that immigrants are often in
their 30s or 40s.
APPLICATION
© 2008 Worth Publishers ▪ International Economics ▪ Feenstra/Taylor 62 of 114
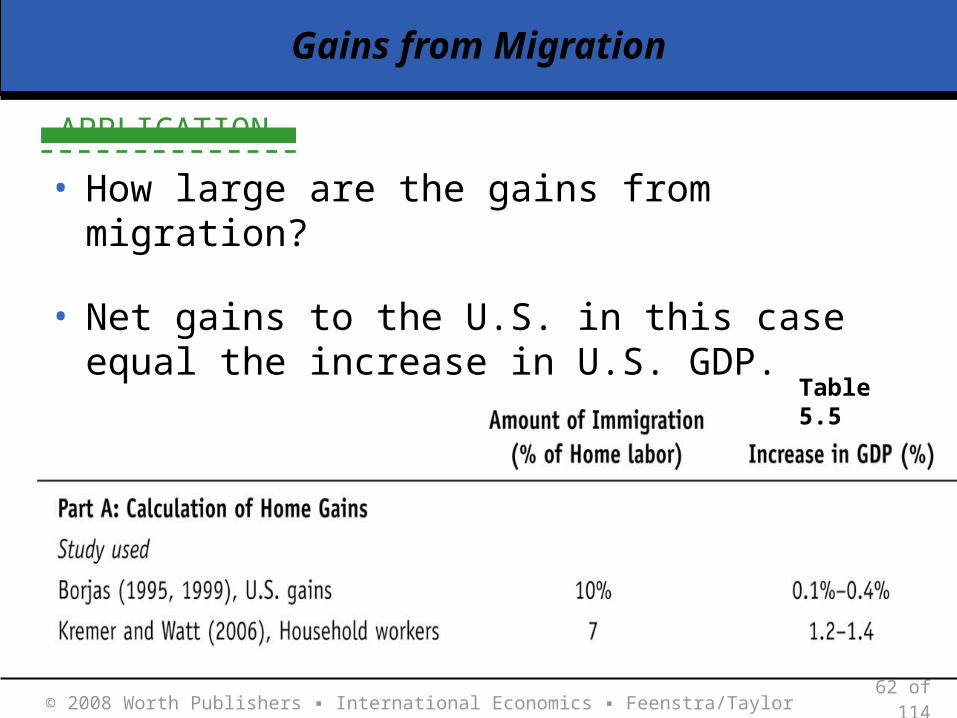
Gains from Migration
Table 5.5
• How large are the gains from migration?
• Net gains to the U.S. in this case equal the increase in U.S. GDP.
APPLICATION
© 2008 Worth Publishers ▪ International Economics ▪ Feenstra/Taylor 63 of 114
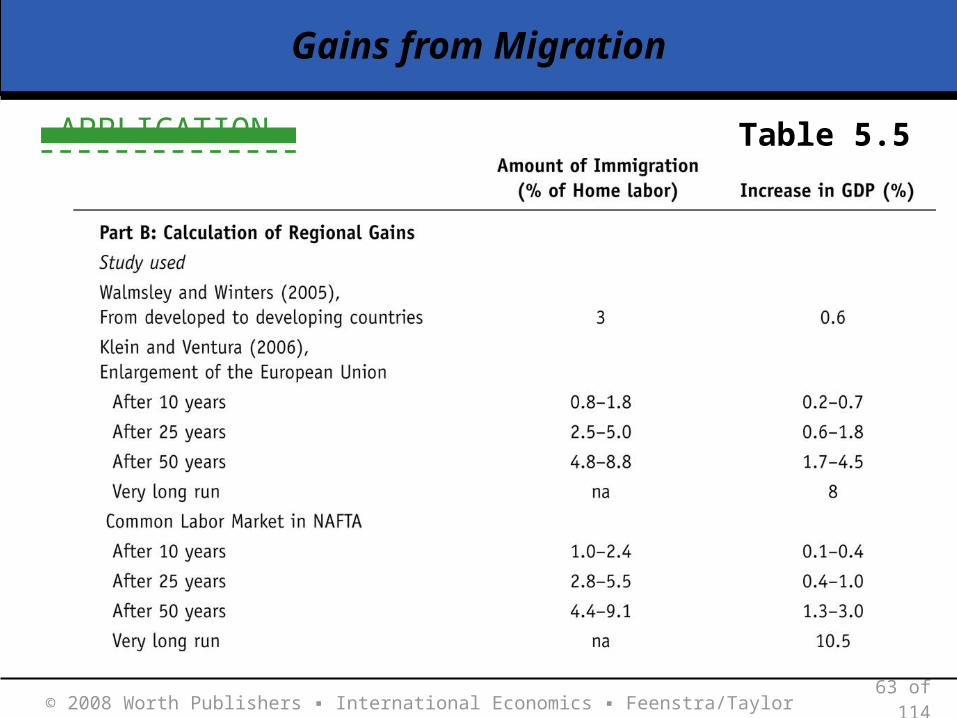
Gains from Migration
Table 5.5
© 2008 Worth Publishers ▪ International Economics ▪ Feenstra/Taylor 64 of 114
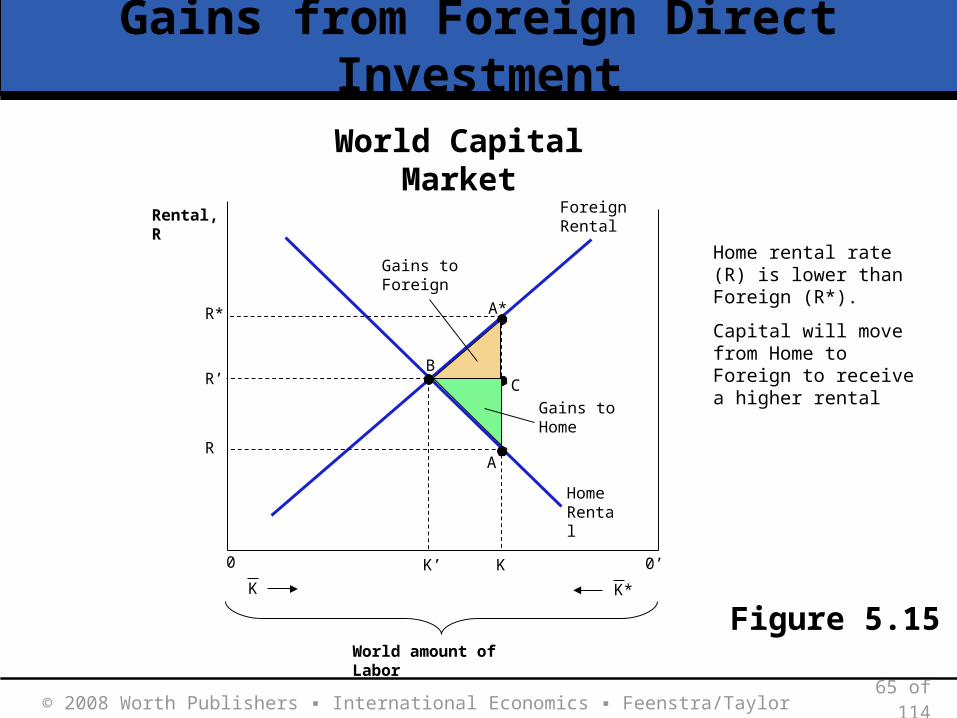
Gains from Labor and Capital Flows
• Gains from Foreign Direct Investment Figure 5.15 shows the world amount of capital on the
horizontal axis: K + K*. Foreign rental is higher than Home so capital will flow from
Home to Foreign.
• As capital enters Foreign, the marginal product of capital will fall as will its rental.
• As capital leaves Home, the marginal product will rise as will the rental.
• World gains are A* BA.
© 2008 Worth Publishers ▪ International Economics ▪ Feenstra/Taylor 65 of 114
Gains from Foreign Direct Investment
0 0’
Rental, R
K K*
World amount of Labor
K’
CR’B
A
A*R*
R
K
Home Rental
Foreign Rental
Gains to Foreign
Gains to Home
Equilibrium with full capital flow is at B with rents equalized at R’
Gains to Foreign and Home can be shown
Home rental rate (R) is lower than Foreign (R*).
Capital will move from Home to Foreign to receive a higher rental
World Capital Market
Figure 5.15