movement of an exploited coral reef teleost across multiple temporal and … · 2015-11-13 ·...
TRANSCRIPT

This file is part of the following reference:
Currey, Leanne Margaret (2015) Movement of an
exploited coral reef teleost across multiple temporal and
spatial scales. PhD thesis, James Cook University.
Access to this file is available from:
http://researchonline.jcu.edu.au/41290/
The author has certified to JCU that they have made a reasonable effort to gain
permission and acknowledge the owner of any third party copyright material
included in this document. If you believe that this is not the case, please contact
[email protected] and quote
http://researchonline.jcu.edu.au/41290/
ResearchOnline@JCU

Movement of an exploited coral reef teleost across multiple temporal
and spatial scales
Thesis submitted by
Leanne Margaret Currey
BSc (Hons) James Cook University
For the degree of
Doctor of Philosophy
Centre of Sustainable Tropical Fisheries and Aquaculture
College of Marine and Environmental Sciences
James Cook University
12 January 2015

i
Contribution of others to this thesis
Supervision
Michelle Heupel – Australian Institute of Marine Science, Centre for Sustainable
Tropical Fisheries and Aquaculture & College of Marine and Environmental Sciences,
James Cook University, Townsville, Australia
Colin Simpfendorfer – Centre for Sustainable Tropical Fisheries and Aquaculture &
College of Marine and Environmental Sciences, James Cook University, Townsville,
Australia
Ashley Williams – Oceanic Fisheries Programme, Secretariat of the Pacific
Community, Noumea, New Caledonia
Stephen Sutton – Centre for Sustainable Tropical Fisheries and Aquaculture & College
of Marine and Environmental Sciences, James Cook University, Townsville, Australia
Financial support
Project funding, scholarship and stipend
Australian Institute of Marine Science
Australian Research Council (to Michelle Heupel)
AIMS@JCU Postgraduate Research Scholarship and stipend
Graduate Research School, James Cook University
School of Earth and Environmental Sciences, James Cook University
Travel funding
Fisheries Society of the British Isles
AIMS@JCU
Australian Society for Fish Biology
School of Earth and Environmental Sciences, James Cook University

ii
Data collection
Michelle Heupel, Colin Simpfendorfer, Ashley Williams, Andy Tobin, Fernanda de
Faria, Danielle Knip, Steve Moore, Mario Espinoza, Amos Mapleston
Australian Animal Tagging and Monitoring System facility of the Integrated Marine
Observing System: Andrew Boomer, Phil McDowall, Andre Steckenreuter
Australian Institute of Marine Science staff: Dave Abdo, Condo (Paul) Costello, Stuart
Kininmonth, Mike Cappo
Bill Sawynok (SUNTAG data), Ross Barker and Seaborn Fresh Seafoods, Gary Grant
Statistical, analytical, editorial support
Michelle Heupel, Colin Simpfendorfer, Ashley Williams, Tim Clark, Elodie Lédée,
Peter Yates, Samantha Munroe, Vinay Udyawer, Mario Espinoza, Chris Wurster,
Costijn Zwart
Elodie Lédée, Commonwealth of Australia’s Great Barrier Reef Marine Park Authority,
GoogleTM
earth and DigitalGlobe, and Rob Beaman for map data and production
Journal editors and anonymous reviewers within which chapters were published
Administrative support
Glen Connolly, Rebecca Steele, Melissa Crawford, Jo Scheffler, Lauren Gregory
Cover image
Dave Abdo © www.daveabdo.com (also used in presentations)
Ethics and approvals
All research activities were conducted under GBRMPA permit numbers G10/33754.1
and G10/33758.1 and Queensland Department of Agriculture, Fisheries and Forestry
permit number 144482
The research presented and reported in this thesis was conducted in compliance with
the National Health and Medical Research Council (NHMRC) Australian Code of
Practice for the Care and Use of Animals for Scientific Purposes, 7th Edition, 2004 and
the Qld Animal Care and Protection Act, 2001. The proposed research study received
animal ethics approval from the JCU Animal Ethics Committee Approval Number
A1566.

iii
Acknowledgements
Firstly, I need to thank my incredible supervisory team – Michelle Heupel, Colin
Simpfendorfer, Ashley Williams and Steve Sutton. Each of you made this journey more
worthwhile. Michelle, thanks for providing me with the opportunity and funding to
work together and experience the most fantastic field site. Your encouragement meant a
great deal and you gave me the push when I needed it! I enjoyed the extra side projects
that have allowed me to work in different fields and broadened my knowledge. Your
support and guidance along the way ensured that I rediscovered the path after a
meander or two, and transformed my way of writing into a cake rather than a recipe. I
feel I am a better scientist because of your involvement in my work. Your views on the
world of science, academia and publishing, shared in our many enjoyable discussions in
the field, have given me a better understanding for my future career. Colin, I really
appreciate your influence on this project and my previous projects. Your scientific
mind, input, support in the field and assistance in R code was invaluable, and you made
me feel better when a simple comma wasn’t the problem. Ash, you enabled me to keep
the fishery importance aspect of my work, provided me with great statistical advice
(and model plots), and your deep knowledge of ‘all things redthroat’. Thanks for the
fast feedback on written work, from across the ocean with a time difference! Steve, you
have provided me with great guidance and encouraged my dedication to my work, with
a life balance!
Tim Clark, thanks for your expertise in physiology and giving me the opportunity to
publish work in your field through collaboration. Your experience with science life has
taught me a lot and for your great attitude that made field work so much fun! Chris
Wurster and Cos Zwart, your guidance and expertise with the laboratory isotope
analysis enabled a tricky thesis chapter to eventuate.
Andy Tobin and Amos Mapleston, sharing your knowledge with me has helped more
than you know. You assisted in catching my fish both in person and as a voice in my
ear. I appreciated your insights and wisdom from spending so much time on top of the
water. Fernanda de Faria, thanks for your passion for both the organisms and the
fieldwork. I appreciated your help in the field (and the experiments I know you loved) –
despite the lack of hot water during a freezing tropical island winter, we still had tim
tam slams.
Ann Penny and Renae Tobin, you have been my best friends and mentors, allowing me
to air frustrations and giving me an informed scientific view as colleagues and friends. I
cherish our discussions on research, life, food and wine!
Samantha Munroe and Peter Yates – we made it! To my officemate Sam, thanks for
your support, our talks have always made us productive, while your assistance with R
and allowing me to float concepts past you has greatly assisted in grasping what it is I
truly want to say. What an experience to share together, thank you! Elodie Lédée, your
friendship, mapping expertise, and R knowledge has been so important, and our

iv
statistical conversations with Pete have helped us with analysis all round. You have
both been there to slog it out with me and have always provided such encouragement
and positivity. Audrey Schlaff, we started this journey together from the same
perspective and it has always been so valuable to chat with you about the issues we face
and to reassure each other we would make it! Andrew Chin, we all aspire to have your
outlook on life and I did appreciate the journey with a balance that includes life and
fun. Cass Rigby and Alex Carter, my two long-time Cairns-based fish-nerds, your
generosity and inspiration held me accountable to my goals and enabled me to achieve
them. I loved discussing reviewer comments, methodologies and venting with you both,
then celebrating the little victories from afar! Danielle Knip, thanks for your assistance
in the field and providing a level of devotion I could aim towards. Mario Espinoza and
Vinay Udyawer, for your patience and assistance early on with R, the interpretation of
telemetry data, field work, and fun, cheers! Thanks Jordan Matley and Merritt Adkins
for discussions, conferences and fun times, and to the rest of the F&F team. And to all
those who assisted in the field: Dave, Stuart, Condo, Phil (for your wonderful and
infectious attitude and singing), Boomer and André, your assistance provided my data!
My statistical knowledge and R was greatly enhanced by Alain Zuur, Murray Logan
and Ben Bolker through courses, books and online forums.
To my university college friends who have taken different paths, I’ve always
appreciated your interest in my career and your understanding of the persistence
required in producing a thesis, because you were there during my honours year!
My family have encouraged me throughout my life. Their positivity and interest my
work (although not fully understanding the thesis process) has continually been
supportive. Thanks Mum and Dad for telling me I can do anything I set my mind to –
here is my huge milestone! Allie and Allan thanks for being there, listening to my
practise presentations, celebrating in my achievements, and having us for dinner when
life was so busy. Your support means everything.
Finally, to Aaron, you have always helped me find perspective the whole way through,
and you are my rock. We tackle everything in life together, and this project has been no
different as you have supported me in so many ways. I appreciate that you listened to
my theories, provided feedback from a non-science perspective, smiled through my
presentations, and distracted me with life and fun when I needed it! You are my world –
thank you for following my dreams with me.

v
Publications arising from this thesis
Chapter 2: Currey LM, Heupel MR, Simpfendorfer CA, Williams AJ (In prep) The
effects of habitat, feeding strategy and reproductive mode on the movement
of adult coral reef fishes. Marine Ecology Progress Series
Chapter 4: Currey LM, Heupel MR, Simpfendorfer CA, Williams AJ (2014) Inferring
movement patterns of a coral reef fish using oxygen and carbon isotopes in
otolith carbonate. Journal of Experimental Marine Biology and Ecology
456:18-25
Chapter 5: Currey LM, Heupel MR, Simpfendorfer CA, Williams AJ (2014)
Sedentary or mobile? Variability in space and depth use of an exploited
coral reef fish. Marine Biology 161(9):2155-2166
Chapter 6: Currey LM, Heupel MR, Simpfendorfer CA, Williams AJ (In Review)
Assessing environmental correlates of fish movement on a coral reef. Coral
Reefs
Chapter 7: Currey LM, Heupel MR, Simpfendorfer CA, Williams AJ (In Press)
Assessing fine-scale diel movement patterns of an exploited coral reef fish.
Animal Biotelemetry
Appendix A: Currey LM, Heupel MR, Simpfendorfer CA, Clark, T D (2013) Blood
lactate loads of redthroat emperor Lethrinus miniatus associated with
angling stress and exhaustive exercise. Journal of Fish Biology 83:1401–
1406

vi
Associated publications published during
candidature
Currey LM, Williams AJ, Mapstone BD, Davies CR, Carlos G, Welch DJ,
Simpfendorfer CA, Ballagh AC, Penny AL, Grandcourt EM, Mapleston A,
Wiebkin AS, Bean K (2013) Comparative biology of Lethrinus species
(Emperors): challenges for multi-species management. Journal of Fish Biology
82:764-788
Tobin AJ, Currey LM, Simpfendorfer CA (2013) Informing the vulnerability of species
to spawning aggregation fishing using commercial catch data. Fisheries
Research 143:47-56
Sweet M, Kirkham N, Bendall M, Currey L, Bythell J, Heupel M (2012) Evidence of
melanoma in wild marine fish populations. PLoS ONE 7:e4198

vii
Conference and seminar presentations during
candidature
Festival of Life Sciences, November 2014, James Cook University, Townsville,
Australia – Poster presentation (Award winner)
North Queensland Festival of Arts and Science, October 2014, Museum of Tropical
Queensland, Townsville Australia – Discussion panel of scientists
Bio-Logging Symposium, September 2014, Strasbourg Convention Centre, Strasbourg,
France – Poster presentations
AIMS@JCU Seminar Day, August 2014, The Pier Restaurant, Townsville, Australia –
Poster presentation
Australian Society for Fish Biology & Australian Society for Limnology Joint
Congress, July 2014, Darwin, Australia – Oral and poster presentation (Award winner)
School of Earth and Environmental Sciences Postgraduate Conference, November
2013, James Cook University, Townsville, Australia – Oral presentation
Townsville Probus Inc., November 2013, Townsville RSL, Townsville, Australia – Oral
presentation
AIMS@JCU Seminar Day, October 2013, ReefHQ, Townsville, Australia – Oral
presentation
2nd
International Conference on Fish Telemetry, July 2013, Rhodes University
Grahamstown, South Africa – Oral presentation
Townsville Central Rotary Club, May 2013, Townsville RSL, Townsville, Australia –
Oral presentation
My Research in 3 Minutes, school, faculty and university rounds, August & September
2012, James Cook University, Townsville, Australia – Oral competition (Award
winner)
AIMS@JCU Seminar Day, June 2012, Australian Institute of Marine Science,
Townsville, Australia – Oral presentation
Milchester State School, May 2012, Charters Towers, Australia – Oral presentation
Australian National Network in Marine Science, December 2011, University of WA,
Perth, Australia – Oral presentation
School of Earth and Environmental Sciences Postgraduate Student Conference,
November 2011, James Cook University, Townsville Australia – Oral presentation
(Award winner)

viii
Table of contents
Contribution of others to this thesis................................................................................. i
Acknowledgements ....................................................................................................... iii
Publications arising from this thesis ............................................................................... v
Associated publications published during candidature ................................................. vi
Conference and seminar presentations during candidature .......................................... vii
Table of contents ......................................................................................................... viii
Tables ................................................................................................................. xi
Figures ................................................................................................................ xv
General abstract .............................................................................................................. 1
General introduction ................................................................................. 6 Chapter 1
The effects of habitat, feeding strategy and reproductive mode on the Chapter 2
movement of adult coral reef fishes ............................................................... 13
2.1 Scales of movement ......................................................................................... 16
2.2 Connectivity of habitat ..................................................................................... 21
2.3 Body size .......................................................................................................... 23
2.4 Feeding strategy ............................................................................................... 26
2.5 Reproductive modes ......................................................................................... 29
2.6 Implications and conclusions ........................................................................... 32
General methodology ............................................................................. 34 Chapter 3
3.1 Study species .................................................................................................... 35
3.2 Study site .......................................................................................................... 37
3.3 Fish sampling and sample collection ............................................................... 38
3.4 Acoustic telemetry ............................................................................................ 40
Inferring broad-scale movement of a coral reef fish using oxygen and Chapter 4
carbon isotopes in otolith carbonate ............................................................... 42
4.1 Introduction ...................................................................................................... 43
4.2 Methods ............................................................................................................ 46
4.2.1 Sample collection and processing ............................................................ 46
4.2.2 Laboratory processing and analysis of isotope ratios ............................... 48
4.2.3 Data analysis ............................................................................................. 49
4.3 Results .............................................................................................................. 51
4.4 Discussion ........................................................................................................ 58

ix
Sedentary or mobile? Variability in space and depth use of an exploited Chapter 5
coral reef fish .................................................................................................. 65
5.1 Introduction ...................................................................................................... 66
5.2 Methods ............................................................................................................ 68
5.2.1 Fish sampling............................................................................................ 68
5.2.2 Data analysis ............................................................................................. 68
5.3 Results .............................................................................................................. 71
5.3.1 Presence, residency and site fidelity ......................................................... 72
5.3.2 Horizontal activity space and recaptures .................................................. 76
5.3.3 Vertical activity space and depth utilisation ............................................. 77
5.4 Discussion ........................................................................................................ 81
Influence of environmental parameters on movement patterns of an Chapter 6
exploited coral reef fish .................................................................................. 90
6.1 Introduction ...................................................................................................... 91
6.2 Methods ............................................................................................................ 94
6.2.1 Fish sampling............................................................................................ 94
6.2.2 Environmental data ................................................................................... 94
6.2.3 Data analysis ............................................................................................. 96
6.3 Results .............................................................................................................. 98
6.3.1 Presence .................................................................................................... 99
6.3.2 Vertical activity space (vKUDs) ............................................................ 101
6.4 Discussion ...................................................................................................... 102
Assessing fine-scale diel movement patterns of an exploited coral reef Chapter 7
fish .............................................................................................................. 109
7.1 Introduction .................................................................................................... 110
7.2 Methods .......................................................................................................... 112
7.2.1 Study site and sampling .......................................................................... 112
7.2.2 Data analysis ........................................................................................... 113
7.3 Results ............................................................................................................ 116
7.3.1 Horizontal space use ............................................................................... 117
7.3.2 Vertical space use ................................................................................... 120
7.3.3 Vertical activity space by period and week ............................................ 121
7.4 Discussion ...................................................................................................... 130
General discussion ................................................................................ 136 Chapter 8

x
8.1 Summary and synthesis of research findings ................................................. 138
8.1.1 Aim One - Movement patterns across multiple scales ........................... 139
8.1.2 Aim Two – Influence of environmental conditions on fish movement
patterns ................................................................................................................ 142
8.1.3 Aim Three - Implications for management of reef fishes ...................... 144
8.2 Future directions ............................................................................................. 146
8.3 Concluding remarks ....................................................................................... 148
References ............................................................................................ 149 Chapter 9
Appendices ........................................................................................... 165 Chapter 10
10.1 Appendix A ................................................................................................ 165

xi
Tables
Table 2.1 Applicability of the various methods used to investigate movement patterns
of reef fishes at various spatial and temporal scales. .............................................. 17
Table 3.1 Number of receivers in the main array located in the Capricorn-Bunker
region. ...................................................................................................................... 41
Table 4.1 Linear regression and GLS models examining the effects of latitude (Lat),
otolith portion (P), whole otolith weight (W) and month (M), on δ18
O and δ13
C. .. 53
Table 4.2 Linear regression models examine the effects of latitude (Lat), whole otolith
weight (W), month (M), on the difference (d) between edge and core δ18
O values
for each individual otolith. ...................................................................................... 56
Table 5.1 Details of acoustically tagged individuals. ..................................................... 75
Table 5.2 Mixed effects models examining the effects of month, hour and fork length
(FL) on mean depth. ................................................................................................ 81
Table 6.1 Top mixed effects sub-models examining the effects of water temperature
(temp), rainfall (log(10)rain), wind speed (wind), moon phase (moon) and fork
length (FL) on presence (PA) of Lethrinus miniatus at Heron Island Reef. ......... 100
Table 6.2 Model averaging results summarising effects of each parameter on Lethrinus
miniatus presence at Heron Island Reef. ............................................................... 100
Table 6.3 Top mixed effects sub-models examining the effects of fork length (FL),
moon phase (moon), rainfall (log(10) rain), wind speed (wind) and water
temperature (temp) on Lethrinus miniatus vertical activity space (50% & 95%
vKUDs) at Heron Island Reef. .............................................................................. 102
Table 7.1 Details of Lethrinus miniatus monitored at Heron Island Reef from 22 March
2014 to 22 June 2014. ............................................................................................ 117
Table 7.2 Mixed effects model results (p values, significant values indicated in bold)
for horizontal and vertical kernel utilisation distributions (KUD), comparing
among time periods (dawn, day, dusk and night) and individual size (FL). ......... 119
Table 7.3 Results of mixed effects models (p values, significant values indicated in
bold) examining vertical activity space use (kernel utilisation distributions, KUD)
of L. miniatus by period and monitoring week. .................................................... 122
xv
Figures
Figure 1.1 Temporal and spatial scales investigated through this thesis. ....................... 10
Figure 2.1 Representation of the temporal and spatial scales covered by the techniques
used to measure adult reef fish movement. ............................................................. 18
Figure 2.2 The relationship between body size and home range area of adult coral reef
fishes. ....................................................................................................................... 26
Figure 3.1 The model study species Lethrinus miniatus ................................................ 36
Figure 3.2 Location of Heron Island, One Tree Island and Sykes Reefs in the
Capricorn-Bunker group of the southern Great Barrier Reef, Australia. ................ 38
Figure 3.3 The acoustic tagging procedure .................................................................... 39
Figure 3.4 Release of a tagged individual ...................................................................... 40
Figure 3.5 Vemco acoustic telemetry components ......................................................... 41
Figure 4.1 Sample collection locations .......................................................................... 47
Figure 4.2 Sectioned L. miniatus otolith under reflected light with user-defined
micromilling paths highlighted as core and edge portions. ..................................... 49
Figure 4.3 Predicted trends in oxygen isotope ratios (δ18
O) for core and edge portions
by latitude and month. ............................................................................................. 54
Figure 4.4 Predicted trends in carbon isotope ratios (δ13
C) for core and edge portions by
latitude. .................................................................................................................... 55
Figure 4.5 Predicted trends in the difference in oxygen isotope ratios between edge and
core portions by individual by latitude and month. ................................................. 57
Figure 4.6 Predicted trends in the difference in carbon isotope ratios between edge and
core portions by individual by latitude and month. ................................................. 58
Figure 5.1 Mean number of detections per hour for L. miniatus before (solid line) and
after standardising (bold solid line) to sentinel tag detections (dashed line). ......... 72
Figure 5.2 Presence plot of L. miniatus at One Tree Island Reef (ID 4018) and Heron
Island Reef (all other individuals) in the Capricorn-Bunker region per day. .......... 73
Figure 5.3 Movement of individual ID 6707 at Heron Island Reef. .............................. 77
Figure 5.4 Depth and space utilisation of L. miniatus at northwest (a) and southwest (b)
Heron Island Reef. ................................................................................................... 79
Figure 5.5 Mean depth (m) use of individuals by fork length (mm). ............................. 80
Figure 5.6 Vertical KUDs of individual 4027 by month (April to October), representing
depth use (m) by reef distance (m). ......................................................................... 80

xvi
Figure 6.1 Weekly environmental measurements for Heron Island Reef from April
2011 to September 2013. ......................................................................................... 95
Figure 6.2 Mean proportion of acoustically tagged Lethrinus miniatus present over
time. ......................................................................................................................... 98
Figure 6.3 Predicted probability (solid line) of Lethrinus miniatus daily presence on the
reef slope with the most influential parameter, mean water temperature, from the
model M1. ............................................................................................................. 101
Figure 7.1 Location of the study site on the north of Heron Island Reef, Australia. ... 113
Figure 7.2 Examples of activity space illustrating horizontal and vertical kernel
utilisation distributions (KUD) by time period for two individuals: 10155 (a, c) and
10154 (b, d). .......................................................................................................... 118
Figure 7.3 Results from mixed effects models illustrating 50% (a) and 95% (b)
horizontal kernel utilisation distribution (KUD) area and 50% (c) and 95% (d)
vertical KUD area by time period (dawn, day, dusk and night). ........................... 120
Figure 7.4 Mean 50% (a) and 95% (b) vertical kernel utilisation distributions (vKUD)
by period and week. ............................................................................................... 123
Figure 7.5 Results from mixed effects models illustrating the significant factors that
influenced 50% (a) and 95% (b and c) vertical kernel utilisation distributions
(vKUD). ................................................................................................................. 124
Figure 7.6 Mean percent weekly overlap in 50% (a) and 95% (b) vertical kernel
utilisation distributions (vKUD) by period and week. .......................................... 126
Figure 7.7 Results from mixed effects models illustrating the significant factors that
influenced 50% (a) and 95% (b) vertical kernel utilisation distributions (vKUD)
overlap by week. .................................................................................................... 126
Figure 7.8 Mean cumulative 50% (a) and 95% (b) vertical kernel utilisation
distributions (vKUD) by period and week. ........................................................... 128
Figure 7.9 Results from mixed effects models illustrating the significant factors that
influenced the 50% and 95% vertical kernel utilisation distribution (vKUD)
cumulative area, (a, b) period, and (c) week. ........................................................ 129
Figure 8.1 The chapters comprising this thesis provided a more complete view of the
movement patterns of an important reef fish species by investigation across
multiple temporal (x axis) and spatial (y axis) scales. .......................................... 138

1
General abstract 1
Ensuring the sustainability of teleost populations is essential to the nutrition and 2
livelihoods of many people supported by coral reef fisheries worldwide. The 3
distribution and abundance of fish populations is defined by the movement of 4
individuals, which occur on a range of spatial and temporal scales. Species-specific 5
biological and ecological knowledge of reef fish movement is useful for parameterising 6
species assessments and designing effective management strategies for exploited fish 7
populations. For example, understanding whether target species are sedentary or mobile 8
as adults can indicate the likelihood of management approaches such as spatial closures 9
(e.g. marine protected areas; MPAs) or temporal closures (during spawning seasons) as 10
successful management tools. Since ecological information is fundamental to the 11
effective management of coral reef fisheries, a model species Lethrinus miniatus, was 12
selected for investigation of movement patterns at multiple spatial and temporal scales. 13
Limited and contradictory ecological evidence is available despite the exploitation of 14
this species in reef fisheries worldwide, therefore this research aimed to gain a better 15
understanding of L. miniatus spatial ecology for future sustainability of populations. 16
17
Understanding the scales at which movements of adult fishes occur and the factors that 18
influence movement patterns is essential for the knowledge of species-specific spatial 19
ecology. Literature analysis suggested that while body size was a poor predictor of 20
space use, fishes characterised by a mobile predatory feeding strategy that use spatially 21
separate habitats for feeding are more likely to have large activity spaces and move 22
greater distances. Likewise, broad-scale movement was observed for fishes with a 23
broadcast spawning mode that migrate to reproduce, and larger home ranges (extent of 24
activity space) were facilitated by contiguous habitat. In combination, habitat 25

Abstract
2
connectivity, feeding strategy and reproductive mode were important for predicting 26
movement patterns of fish across the mosaic of reef habitats, and provides a context 27
within which research can focus efforts to assist with the design and implementation of 28
effective management strategies. 29
30
Ratios of oxygen and carbon isotopes (δ18
O and δ13
C) in L. miniatus otolith carbonate 31
were analysed to elucidate the probability of broad-scale movement on the Great 32
Barrier Reef (GBR). Otolith core and edge portions were compared between and within 33
120 individuals from the same cohort to determine whether isotopically different 34
environments were inhabited by juveniles and adults from different latitudes. 35
Comparisons between and within individuals revealed that ratios of δ18
O and δ13
C 36
increased with latitude and were generally higher in edge than in core portions. No 37
difference in δ18
O between core and edge portions for some individuals potentially 38
signify self-recruitment to the area, or occupation of areas of similar chemistry. The 39
majority of individuals from 19-22°S and almost half of individuals from 18°S 40
displayed juvenile δ18
O signatures characteristic of a warmer environment, suggesting 41
movement to cooler environments or potential southerly migration of early life stages 42
to adult habitat. In contrast, almost half of adult individuals in the most northern 43
latitude (18°S) appeared to originate from cooler environments, suggesting movement 44
to warmer environments or potential northward migration with ontogeny. These results 45
infer movement of individuals occurred across different isotopic environments with life 46
stage and were related to latitude, which will be important for delineating management 47
units for this commercially important species. 48

Abstract
3
Reef-scale presence, horizontal and vertical activity space use and movement patterns 49
of 26 L. miniatus were identified using an array of acoustic receivers in the southern 50
GBR. Half of the individuals were recorded only in proximity of one receiver, half 51
were detected at multiple receivers and used horizontal areas of approximately 4 km2, 52
and one individual was recaptured ~160 km from the release location. Periods of non-53
detection and lower detection frequency at night indicated individuals may move away 54
from the monitored reef edge to adjacent sandy habitat, but most movements outside 55
the array remain unknown. Variation in movement among adult L. miniatus indicates 56
that while some individuals undergo broader-scale movement, spatial closures that 57
cover individual reefs (> 4 km2) could provide protection from fishing for the 58
proportion of the population that displayed high site fidelity and moderate-sized activity 59
spaces (over a period of up to 12 months). 60
61
Variation in dispersal and movement patterns of coral reef fishes are likely linked to 62
changes in environmental conditions. Monitoring in situ environmental parameters in 63
conjunction with the movements of the acoustically adult tagged L. miniatus revealed 64
their daily presence on the reef slope was influenced by water temperature. Individuals 65
occurred more often on the reef slope during cooler temperatures suggesting a thermal 66
tolerance threshold may exist. Results indicate that individuals responded to elevated 67
temperatures by moving away from the reef slope to deeper adjacent habitats, thus 68
shifting their position in the water column to remain at a preferred temperature. With 69
elevation of ocean temperature, L. miniatus will need to adapt to warmer waters or 70
disperse into cooler habitats, by either shifting their distribution deeper or towards 71
higher latitudes. Identifying key environmental drivers that affect the distribution of 72

Abstract
4
reef fishes is important, and may allow managers to predict the effect of these changes 73
on exploited species. 74
75
Reef-scale movements of L. miniatus suggested that adult individuals may use reef 76
slope habitat during the day, shifting to adjacent deeper sandy habitat a night. Using a 77
closely-positioned acoustic telemetry system, movements of 11 L. miniatus were 78
monitored among habitats from the reef crest, to reef slope and deeper adjacent sandy 79
habitat over three months. Fine-scale movement patterns among these habitats were 80
compared among day: dawn, day, dusk and night periods. Larger vertical core and 81
space use extent were used during dawn, dusk and night compared to during the day. 82
Area of activity space extent within the water column and proportional overlap among 83
areas used during different periods of the day varied among weeks, and displayed a 84
pattern consistent with full moon periods. Increased luminosity during these periods 85
may cause L. miniatus to utilise a larger search area for foraging, yet further research is 86
required to confirm this finding. This fine-scale approach identified patterns in 87
nocturnal activity that can be examined in other important reef teleosts, and knowledge 88
of these temporal and spatial differences in L. miniatus behaviour and movement are 89
important to understanding how this species coexists within ecological niches. 90
91
The components of this thesis provide insight into the movement patterns of an 92
exploited coral reef fish, for which little spatial ecology information was available. 93
Using multiple methods, movement patterns were investigated at a variety of spatial 94
and temporal scales, revealing individual variability within the sampled population. 95
This highlights that no single management strategy (e.g. MPAs) can provide complete 96
protection from fishing for L. miniatus throughout life, nor against the potential effects 97

Abstract
5
of a changing climate. Methods used in this research can be applied to other coral reef 98
teleosts of fishery importance, to assist management in designing strategies to exploit 99
populations sustainably.100

6
General introduction Chapter 1
Gaining ecological data for important reef fishery species (e.g. Lethrinus miniatus) can
assist in designing effective management strategies
(Photo credit: M. Heupel)

Chapter 1: Introduction
7
Coral reef environments contain a very high diversity of teleosts, many of which are 101
important to fisheries, with more than 8000 species known to inhabit tropical habitats 102
(Bellwood and Wainwright 2006; Bellwood et al. 2012). Reef fish diversity is an 103
evolutionary outcome of a variety of biological characteristics (life-histories, body sizes 104
and trophic groups), which has facilitated ecological differences in fish species. Global 105
net benefits of coral reefs are estimated at US$29.8 billion (Cesar et al. 2003), which is 106
largely from the exploitation of coral reef fish. On average, six million metric tonnes of 107
reef fish per year are sourced from tropical reefs worldwide (Munro 1996). Although 108
this constitutes only 2-5% of the total global catch, reef fish are a significant source of 109
protein and livelihood for many people in developing nations (Russ 1991; Sadovy 110
2005). With high dependence on these resources, an estimated 55% of coral reef 111
fisheries are overexploited, which is closely linked to the increasing global human 112
population (Newton et al. 2007). High effort, stable or declining yield, and other 113
anthropogenic factors influence fishes and their habitat, and represent a continual threat 114
to their associated fisheries (Roberts 1995; Pauly et al. 2002). 115
116
An improved understanding of species biology and ecology is essential for designing 117
effective management strategies for sustainable fisheries. The goal of sustaining fish 118
populations is achieved through a multitude of management strategies designed to 119
restrict the harvest of populations, and include catch limits, limited entry, closed 120
seasons, and closed areas known as marine protected areas; MPAs (Guénette et al. 121
1998; Squires et al. 1998; Hilborn et al. 2004; Sadovy and Domeier 2005; Botsford et 122
al. 2009; Cadrin and Secor 2009; Tobin et al. 2013). Since MPAs are becoming 123
increasingly important for managing fisheries, it is particularly critical to understand 124
the movement patterns of fishes. Likewise, the ability to predict the effect of future 125

Chapter 1: Introduction
8
environmental scenarios on the distribution and activity space of a species requires an 126
understanding of how environmental conditions influence fish movement. The 127
distribution and abundance of populations are affected by the movement of individuals 128
across multiple spatial and temporal scales (Dingle 1995; Pittman and McAlpine 2001). 129
In the reef fish context, movements can occur over a wide variety of spatial and 130
temporal scales, and include dispersal of larvae, ontogenetic shifts to new habitat, 131
broad-scale yearly spawning migrations of adults, uni-directional migrations or 132
relocations, and movements within a daily home range (Quinn and Brodeur 1991). 133
Since fish movement, connectivity of habitat, and other biological and ecological 134
processes operate at different scales in the coral reef environment (Sale 1998), 135
consideration of scale is required for the investigation of reef fish spatial ecology. 136
Answering important ecological questions requires sampling design of an appropriate 137
scale (i.e. spatial grain or sample unit size, spatial extent of sampling area, time period) 138
because interpretation of results is closely linked to the scale of sampling design (Wiens 139
1992; Sale 1998). Therefore, study of movement patterns of reef fishes at multiple 140
scales can provide a better understanding of their ecology, which can assist in the 141
design of effective management approaches. 142
143
An abundance of teleosts occur in the iconic waters of the Great Barrier Reef (GBR), 144
which supports valuable commercial and recreational fisheries (Reef Line Council Inc 145
2011). The primary target species of the GBR finfish fishery is Plectropomus leopardus 146
(the common coral trout or leopard coralgrouper) which is sold in the live reef finfish 147
trade, while the secondary target species Lethrinus miniatus (redthroat or trumpeter 148
emperor) is sold whole or filleted (Mapstone et al. 2004; Leigh et al. 2006; Fisheries 149
Research and Development Corporation 2012). Much research has focussed on the 150

Chapter 1: Introduction
9
biology of these and other commercially and recreationally important species (e.g. 151
Adams et al. 2000; Williams et al. 2003; Heupel et al. 2009; Currey et al. 2013), yet 152
little is known about their spatial ecology. Conventional tagging experiments have 153
provided information on the release and recapture locations of individuals (Sumpton et 154
al. 2008), but the evolution of more complex tracking techniques (e.g. acoustic 155
telemetry) has allowed greater insight into movements, in particular increasing the 156
temporal resolution of information. Zeller (1997) actively tracked movements of 157
Plectropomus leopardus on the GBR, and with advancements in technology, recent 158
research has utilised passive acoustic telemetry (Matley et al. In press). Similar 159
technology has provided insight into movements of herbivorous siganids (Fox and 160
Bellwood 2011) and scarids (Welsh and Bellwood 2012a, b), yet further information is 161
required for many species to understand how movements of reef fish may be affected 162
by spatial management approaches. 163
164
To ascertain dispersal and movement patterns of important reef fishery species across 165
multiple temporal and spatial scales, Lethrinus miniatus was used a model species. This 166
large-bodied teleost was selected due to the paucity of ecological data available, and 167
because it is an important component of fisheries in Australia, New Caledonia, Tonga 168
and Japan, with the largest fishery located in GBR waters (Carpenter 2001). This 169
research used a variety of technologies to provide a better understanding of the spatial 170
ecology of L. miniatus, and for application to other reef teleosts. 171
172
The overall aims of this research were to: 173
1. Identify the movement patterns of an important reef teleost (L. miniatus) across 174
multiple spatial and temporal scales using multiple methodologies 175

Chapter 1: Introduction
10
2. Determine whether fish movement patterns were influenced by changes in 176
environmental conditions by comparing fish presence and space use with 177
environmental parameters monitored in situ 178
3. Estimate what movement patterns mean for the ecology and management of L. 179
miniatus (e.g. with MPAs and climate change) 180
181
The progression of chapters through the thesis flow from broad-scale to fine-scale 182
(Figure 1.1), and each forms a manuscript that is published (3 papers), in press (1 183
paper), in review (1 manuscript), or in preparation for submission (1 manuscript) to 184
peer-reviewed journals. Therefore, chapters have been modified to minimise 185
superfluous repetition, although some repetition was unavoidable and included to assist 186
readability. 187
188
189
Figure 1.1 Temporal and spatial scales investigated through this thesis. 190
The sequence of data chapters investigated reef fish movement from a broad temporal and 191
spatial scale (multiple years across 100s of km), to a finer scale (hourly positions across 10s of 192
m). 193

Chapter 1: Introduction
11
The factors that are most responsible for shaping the spatial ecology reef fishes were 194
reviewed Chapter two. This literature review highlights the value of using multiple 195
techniques to investigate movement of fishes in coral reef habitats at a variety of spatial 196
and temporal scales. Broad-scale movement of L. miniatus was investigated using 197
stable isotope analysis of otoliths in Chapter four. Since isotope ratios in otoliths 198
reflect the environment inhabited during life stages, this method was used to answer the 199
question: do L. miniatus migrate long distances along the GBR with ontogeny? 200
201
At a smaller-scale, Chapter five explored whether L. miniatus were resident to small 202
reef areas for periods of up to 12 months using passive acoustic telemetry. This method 203
was also used in Chapter six, in combination with simultaneous monitoring of 204
environmental variables to examine whether environmental conditions (e.g. water 205
temperature, wind speed, rainfall) influence the movement patterns (presence and 206
activity space) of this species. Since extreme weather events (e.g. tropical cyclones) 207
have been observed to influence the dispersal of L. miniatus (Tobin et al. 2010), it is 208
important to identify the main drivers of movement patterns and to predict the influence 209
of a changing climate on L. miniatus behaviour and ecology. 210
211
At a finer scale, Chapter seven utilised an acoustic telemetry array with closely-212
positioned acoustic receivers to investigate very fine scale movements over a relatively 213
short time scale. This approach was used to ascertain whether L. miniatus displayed diel 214
changes in space use. Activity space during dawn, day, dusk and night was estimated 215
and tested to identify whether the same areas and habitat types were used consistently 216
over multiple months. 217

Chapter 1: Introduction
12
Finally, the general discussion (Chapter eight) is a synthesis of the overall results, and 218
concludes what the findings mean for L. miniatus and other fishery important reef 219
species, in ecological and management terms.220
221
13
The effects of habitat, feeding Chapter 2
strategy and reproductive mode on the
movement of adult coral reef fishes
Multiple factors influence the movements of coral reef fish at a variety of scales

Chapter 2: Literature review
14
Movement is an important process that defines the distribution and abundance of coral 222
reef fishes. Understanding movement patterns of any marine organisms allows us to 223
consider how best to conserve a species or sustain a fishery. For reef teleosts, 224
ecological studies have investigated movement during the larval, recruitment and 225
settlement phases relative to currents and flow dynamics (Leis 1991; Camilo and Sale 226
2002), with ontogeny from juvenile to adult stages (Eggleston 1995; Russell and 227
McDougall 2005) and for adults of some species. Traditionally, adult reef fishes are 228
thought to be sedentary (i.e. with low mobility), except during periods of spawning 229
(Sale 1991; Zeller 1997; Sadovy and Eklund 1999). This conventional view can be 230
biased by the focal species, research techniques used and scales of study, and assumes 231
that adults remain in a small, well-defined area. While much of the early literature on 232
reef fish movement supports this perception, growing evidence indicates that some 233
species move more than originally thought (Chateau and Wantiez 2009; Grüss et al. 234
2011). 235
236
Movement pathways of populations and individuals throughout life reflect both 237
ecological and evolutionary responses to a wide variety of environments (Pittman and 238
McAlpine 2001) and occur over a range of spatial and temporal scales. Fish movement 239
is often related to resources (Dingle and Drake 2007) and can be broadly classified as 240
migration (coordinated directional movement), dispersal (undirected movement from a 241
home range by a subset of the population or continual roaming) and within a home 242
range (defined area of routine activity) (Quinn and Brodeur 1991). Movement within 243
these scales can be measured by a number of techniques, yet it is the combination of 244
multiple techniques that provides the best overall understanding of a species in time and 245
space. 246

Chapter 2: Literature review
15
Species-specific movement patterns are constrained by many factors, including the 247
connectivity of habitat, body size, feeding strategy and reproductive mode. Species that 248
are strongly associated with reef substrate may be more likely to move along connected 249
habitat, than reef habitat fragmented by vast sand channels (Grober-Dunsmore et al. 250
2009). Space use may be shaped by the size of an individual, but evidence for this 251
relationship is inconsistent (Pittman and McAlpine 2001). Although not clearly 252
identified in the literature, feeding strategy (diet, method of food acquisition and 253
behaviour) can affect space use (Sale 1977). Finally, movement may be related to the 254
variety of reproductive modes (i.e. act of reproduction) exhibited by reef fish species 255
including long-distance spawning migrations, dispersal from a small home range or 256
care of progeny at a nesting site (Johannes and Squire 1988). Information on factors 257
such as connectivity of habitat, body size, feeding strategy and reproductive mode can 258
be used to predict space use and dispersal distances of coral reef teleosts. 259
260
The diversity of movement patterns among species highlights the importance of 261
understanding spatial ecology across multiple scales for effective ecological research 262
and design of conservation and resource management strategies (Pittman and McAlpine 263
2001). While some research indicates that larval dispersal is solely responsible for 264
population connectivity (Bode et al. 2012), the largest recorded movement of a marked 265
reef fish larvae was 35 km (Planes et al. 2009). Knowledge of adult movement patterns 266
is also crucial, since adults sustain the production of these larvae. Long-distance 267
movements or the removal of adults has a direct effect on larval dispersal, and it is 268
important to understand the temporal and spatial scales of adult movements (i.e. using 269
multiple methods e.g. tracking and tagging). Management strategies should be directly 270

Chapter 2: Literature review
16
related to movement scales, so that marine protected areas (MPAs) for example can be 271
adequately designed to sustain adult reef fish which are the source of the larvae. 272
273
For adult fishes that inhabit coral reef environments, it is vital to understand the scales 274
at which movements occur and what factors influence movement patterns. This review 275
investigates the degree to which habitat connectivity, body size, feeding strategy and 276
reproductive mode affect the space use and distance travelled by reef fishes. Evidence 277
from the literature was used to determine whether these factors can be used to predict 278
the spatial ecology of adult reef fishes. 279
280
2.1 Scales of movement 281
A variety of movement patterns for adult reef fish have been revealed through 282
exploration of multiple spatial and temporal scales. A number of techniques (e.g. 283
conventional mark-recapture studies, active and passive acoustic telemetry, otolith 284
microchemistry and genetics: Table 2.1) now available to measure movement across 285
various scales have enabled a more complete understanding of spatial ecology for a 286
number of species. While the maintenance of small home ranges throughout adult years 287
is common (Holland et al. 1985; Zeller 1997; Claisse et al. 2011), it appears that many 288
reef fishes move within and among adjacent reefs over a range of spatial (e.g. m to 100 289
of kms) and temporal scales (e.g. hourly to yearly: Kaunda-Arara and Rose 2004b; 290
Chateau and Wantiez 2009; Meyer et al. 2010; Hazen et al. 2012 ). Furthermore, 291
individual variation in movement patterns within the same species is common, termed 292
‘behavioural polymorphism’ (Grüss et al. 2011). Partial migration, where a proportion 293
of the population remains sedentary while the remainder move more broadly, has been 294
observed in an increasing number of studies (Kaunda-Arara and Rose 2004a; Marshell 295

Chapter 2: Literature review
17
et al. 2011; O'Toole et al. 2011; Chapman et al. 2012). This highlights the importance 296
of scale when assessing patterns (Sale 1998), and that the overall spatial ecology of a 297
reef fish is best evaluated using a combination of scales. 298
299
Table 2.1 Applicability of the various methods used to investigate movement patterns of 300
reef fishes at various spatial and temporal scales. 301
Method Applicability
Conventional
mark-recapture
Provides short and long term data (days to decades) on the distance travelled
by individuals from site of release to point of recapture across a broad
temporal scale (m to 100s km). Represents a low cost approach with the
ability to easily tag large numbers of individuals quickly, most useful in
instances where high recaptures rates can be achieved (e.g. high
commercial/recreational fishing pressure)
Active acoustic
telemetry
Provides detailed information on the movements and daily behaviour of one
individual for short time periods (typically 24 h) over a small spatial scale
(few km)
Passive acoustic
telemetry
Movements of a large number of individuals can be obtained autonomously
for long time periods (months to years), determined by positioning of
underwater receivers (m to 100s km). Large datasets including physiological
and depth information can be collected
Otolith
microchemistry
Mixing of fish stocks and ontogenetic/spawning migrations are detected
over long-distances (across oceans, or reef complexes > 100 km) at a broad
temporal scale (months to years). Since otolith carbonate chemistry reflects
the chemical composition of the environment through phases of life,
movement of individuals is inferred using a number of techniques (trace
elements and stable isotope analysis using mass spectrometry of samples
that are in solution, laser ablated or micromilled)
Genetics Mixing of stocks and migration information is obtained on a generational
time scale, across spatial scales of 1000s of km
302
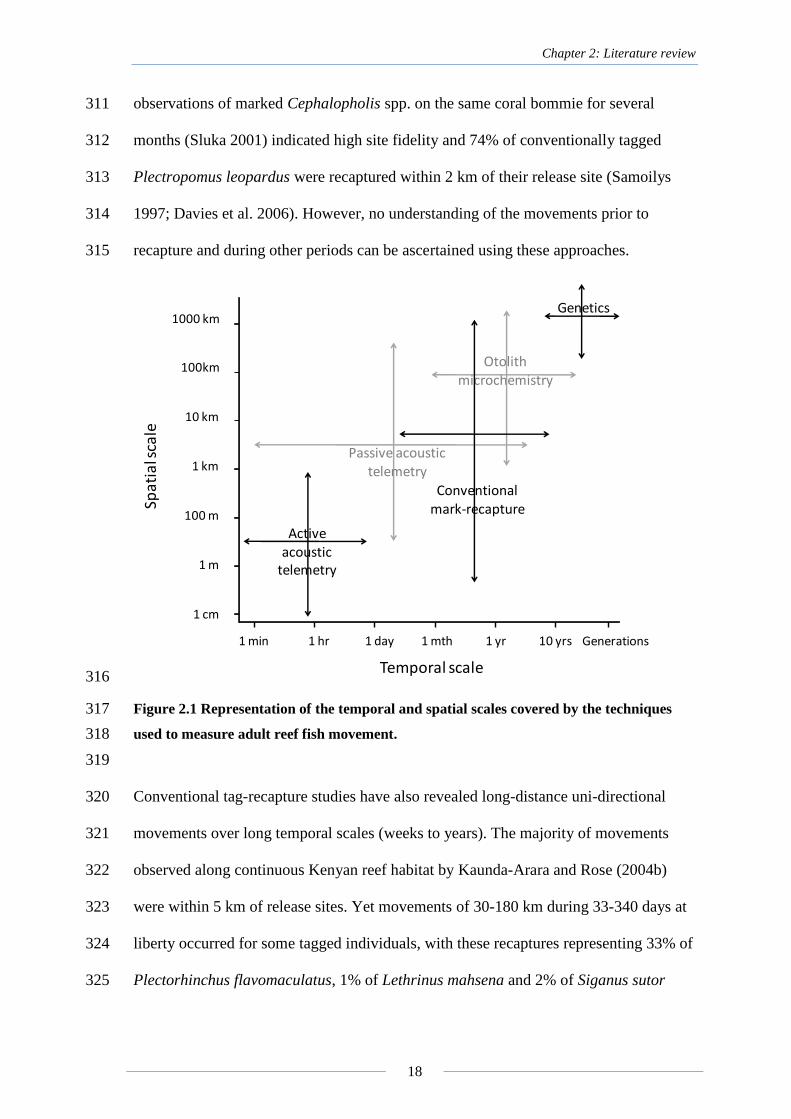
Small-scale and large-scale movement patterns have been observed for reef fishes and 303
these movements often reflect the sampling methodologies used (Table 2.1). Different 304
scales are examined by the variety of techniques (Figure 2.1) used to study movement 305
(e.g. conventional mark-recapture, active and passive acoustic telemetry, otolith 306
microchemistry and genetics; reviewed extensively elsewhere, e.g. Begg and Waldman 307
1999; Arnold and Dewar 2001; Metcalfe et al. 2009; Hazen et al. 2012 ). For example, 308
conventional mark-recapture and observations identifying small-scale movements (i.e. 309
less than a few km2) are commonly reported across families. For example, repeated 310
Chapter 2: Literature review
18
observations of marked Cephalopholis spp. on the same coral bommie for several 311
months (Sluka 2001) indicated high site fidelity and 74% of conventionally tagged 312
Plectropomus leopardus were recaptured within 2 km of their release site (Samoilys 313
1997; Davies et al. 2006). However, no understanding of the movements prior to 314
recapture and during other periods can be ascertained using these approaches. 315
316
Figure 2.1 Representation of the temporal and spatial scales covered by the techniques 317
used to measure adult reef fish movement. 318
319
Conventional tag-recapture studies have also revealed long-distance uni-directional 320
movements over long temporal scales (weeks to years). The majority of movements 321
observed along continuous Kenyan reef habitat by Kaunda-Arara and Rose (2004b) 322
were within 5 km of release sites. Yet movements of 30-180 km during 33-340 days at 323
liberty occurred for some tagged individuals, with these recaptures representing 33% of 324
Plectorhinchus flavomaculatus, 1% of Lethrinus mahsena and 2% of Siganus sutor 325
Spa
tia
l sca
le
1 cm
1 m
100 m
1 km
10 km
100km
1000 km
1 min 1 hr 1 day 1 mth 1 yr 10 yrs
Temporal scale
Generations
Active acoustic
telemetry
Conventional mark-recapture
Otolith microchemistry
Genetics
Passive acoustic telemetry

Chapter 2: Literature review
19
(Kaunda-Arara and Rose 2004b). On the Great Barrier Reef (GBR) recaptures of two 326
Lethrinus miniatus (8.3% of the tagged population) were recaptured 220 km away after 327
12 months, suggesting directional movement between reefs (Williams et al. 2010). 328
Similarly, despite high residency of juvenile and adult Caranx melanpygus (76% 329
recaptured within 500 m of release location), one individual was recaptured 72 km from 330
the release point after 57 days (Holland et al. 1996). Long-distance movements are 331
important because they may assist in maintaining reproductive connectivity and 332
successful continuation of populations throughout a species range (Kaunda-Arara and 333
Rose 2004b). Directional movements across large spatial and temporal scales may be 334
related to more favourable areas of prey (Kramer and Chapman 1999) or relocation 335
after environmental disturbance (Tobin et al. 2010) because advantages may be gained 336
from site-specific conditions. Long-distance movements were once considered rare for 337
reef fishes (Sale 1971), but it is uncertain whether this is true, or whether ‘rarity’ is a 338
reflection of low recapture rates and low fishing effort. For example, Holland et al.’s 339
(1996) results for C. melanpygus were based on a 20% recapture rate, but it is uncertain 340
whether the remaining 80% of individuals emigrated from the study area or simply 341
remained uncaptured. Thus, longer-term approaches such as acoustic telemetry spread 342
across a wider spatial scale would be more beneficial in ascertaining better estimates of 343
broad-scale movement than tag-recapture (e.g. Meyer et al. 2007a; Meyer et al. 2007b). 344
Otolith chemistry can also be used to infer movement among regions, e.g. sub-adult 345
Epinephelus striatus were observed to move within the scale of 50-150 km, but not 346
between regions 2000 km apart (Patterson et al. 1999). Thus methodology selection 347
requires consideration of the scale of the ecological question. 348
349

Chapter 2: Literature review
20
Investigating reef fish movement at only a limited spatial or temporal scale may not 350
provide a result representative of the population (Sale 1998). For example, studies that 351
focus on a single location for a short period of time provide a snapshot of knowledge 352
about movement patterns and the result may be site-specific or represent only a portion 353
of the area of activity. Therefore, using a combination of techniques provides a better 354
understanding of species movement in its entirety. For example, Eklund and Schull 355
(2001) used a step-wise approach in which additional methodologies were utilised to 356
provide a greater understanding of movement patterns and habitat use for the 357
overexploited Epinephelus itajara. First, conventional mark-recapture revealed 358
movement between spawning aggregations (87-120 km over 9-12 months), among 359
aggregations (16 km in 20 days, 22 km in 4 months) and lack of definable movement 360
(one individual was recaptured at the same site after 8 months). The outcomes of this 361
approach were limited by issues with tag retention, difficulties with visual identification 362
of tags underwater, limited fishing pressure and low recapture rates (6%). Based on 363
these limitations, active telemetry was employed to supplement the results. Although 364
only one individual was relocated, it was detected the day after release at a spawning 365
aggregation 6.6 km away. Finally, passive telemetry was utilised to determine whether 366
seasonal patterns of presence were apparent. Although the authors hypothesised 367
seasonal movements were occurring, high residency was observed (Eklund and Schull 368
2001). Each method was applied to define specific aspects of E. itajara movement, and 369
despite the limitations of each method, the synthesis of data from the three approaches 370
provided a more comprehensive view of overall movement patterns within the 371
population. Thus using multiple methods that encompass movements across different 372
spatial and temporal scales can contribute to a better understanding and effective 373
management of reef fish populations. 374

Chapter 2: Literature review
21
2.2 Connectivity of habitat 375
Fish movement is often affected by the connectivity of habitats and the ability to move 376
among these habitats. On coral reefs, physical habitat connectivity varies substantially 377
by location. Reef systems comprise a mosaic of continuous reef structure, lagoon 378
systems, rubble patches, and smaller patch reefs surrounded by low complexity 379
substrata of sand and seagrass, potentially connected via corridors (Grober-Dunsmore 380
et al. 2009). Greater ability to move is often observed across continuous habitat, such as 381
connected fringing reefs along a coastline (Eristhee and Oxenford 2001; Kaunda-Arara 382
and Rose 2004b; Turgeon et al. 2010). Fishes vary in their capacity to move across 383
physical barriers such as deep channels between reefs and vast expanses of sand, which 384
is often linked to the need to seek alternate food sources or residence, while risking 385
predation (Turgeon et al. 2010). Thus, the degree to which the physical habitat impedes 386
or assists the movement of individuals among patches (functional connectivity) in the 387
coral reef environment is variable (Taylor et al. 1993). 388
389
Fragmentation of habitat influences some species more than others. Movement across 390
different habitats has been linked to whether the intermediate habitat is favourable (e.g. 391
for feeding) or acts as a physical barrier (Chapman and Kramer 2000; Chateau and 392
Wantiez 2009). Movement between dispersed patchy reef habitats or discrete reef 393
platforms may be more typical for mobile reef fishes (e.g. Aprion virescens: Meyer et 394
al. 2007a) which display frequent travelling behaviour, patrolling areas of sand, reef 395
and seagrass (Grober-Dunsmore et al. 2007). It would also be expected that stretches of 396
sand habitat between reef patches are incorporated within the home range of species 397
that roam or utilise different spatially separate habitats and forage midwater (e.g. 398
acanthurids: Meyer et al. 2010) or on soft-sediment habitats (e.g. haemulids, lutjanids 399

Chapter 2: Literature review
22
and mullids: Grober-Dunsmore et al. 2007; Hitt et al. 2011). In contrast, species 400
strongly associated with coral reef structure (i.e. feed within coral structure) are less 401
likely to move among habitats that consist of isolated reef patches or seamounts, and 402
across stretches of sand (Lowe et al. 2003; Grober-Dunsmore et al. 2007). Despite 403
observations of extensive within-reef movements, sand or rubble habitat greater than 404
20-50 m wide functioned as a natural barrier for many fishes (Kramer and Chapman 405
1999; Chapman and Kramer 2000). However, inter-reef movements of 510-6000 m 406
have been documented for scarids and serranids across large areas of low-relief soft 407
bottom habitat (Meyer et al. 2010). Clearly, movement is variable among species, 408
individuals and locations. 409
410
Within species, movement patterns and barrier perception can vary depending on 411
habitat, location and sampling. Limited dispersal of carangids and lutjanids from unique 412
Hawaiian bays (Holland et al. 1996; Friedlander et al. 2002) may reflect the isolation of 413
these reefs from any similar habitat nearby (Appeldoorn 1997). Habitat-specific 414
characteristics of perceived boundaries also influence whether fishes move across them 415
(Appeldoorn et al. 2009). Adult haemulids traversed low contrast habitats (i.e. patch 416
reef-seagrass), but high contrast boundaries (i.e. high relief reef versus the adjacent 417
deep mud bottom) impeded movement (Tulevech and Recksiek 1994; Appeldoorn et al. 418
2009). Additionally, Appeldoorn (2009) noted that some acoustically tagged haemulids 419
remained in habitats, based on the availability of optimal resources negating the need to 420
cross adjacent suboptimal habitat. Low sample sizes and few recaptures limit the ability 421
to generalise, often resulting in reports of variability in movement patterns or lack of 422
movement (e.g. acanthurids > 30 cm sampled at different locations: Turgeon et al. 423
2010; Marshell et al. 2011). Individual variability is common, therefore studying fish 424

Chapter 2: Literature review
23
movement across the mosaic of habitat types in different locations allows greater 425
detection of inter-reefal movements (Hammerschlag-Peyer and Layman 2010; Hitt et 426
al. 2011). Since travel between coral reef habitat involves a balance between cost (e.g. 427
predation) and benefit (e.g. resources), individuals must either gain more from habitats 428
as part of their feeding strategy, or prefer contiguous high-relief habitat and move when 429
necessary (Kramer and Chapman 1999; Meyer et al. 2010). 430
431
2.3 Body size 432
Ecological theory based on terrestrial animals indicates that space use increases with 433
increasing body size (Clutton-Brock and Harvey 1978; Jetz et al. 2004). This scaling 434
reflects the need for large animals to use greater space to fulfil energy demands and 435
resource requirements than smaller individuals (Clutton-Brock and Harvey 1978). In 436
the coral reef environment, the relationship between body size and movement patterns 437
or home range area is often investigated for reef fishes. While it is assumed that adults 438
use greater amounts of space and travel further for vital functions than juveniles, no 439
clear relationship is consistent among different sized individuals of the same species, or 440
among species. 441
442
The relationship of body size to space use or distance moved is difficult to compare 443
among studies for reef fishes. Some studies have analysed movement patterns over 444
multiple life stages (e.g. juveniles to adults), while others focussed on a narrow size 445
range of individuals resulting from selectivity of fishing gear (Appeldoorn 1997). 446
Compared to the adult phase, long distance movement is more common for juveniles of 447
some species, particularly for those that undergo ontogenetic shifts in habitat use (Sale 448
1991). For example, Haemulon flavolineatum shift from inshore juvenile habitat to 449

Chapter 2: Literature review
24
adult reef habitat with the onset of maturity, which corresponds to long distance 450
movement with increasing body size (Appeldoorn et al. 2009). Thus, research solely 451
focused in reef environments would only capture the movement patterns of adults of 452
this species. Similarly, assessing any correlation of home range with body size across a 453
limited size range (e.g. Cephalopholis cruentata, 27-33 cm FL: Popple and Hunte 454
2005) may result in weak relationships. Although it is expected that a greater amount of 455
resources are required as an individual grows, resulting in a larger adult home range 456
(Jones 2005), there is limited evidence to support the notion that larger reef fish move 457
greater distances than smaller individuals. For example, increasing home range area 458
with body size was reported for the Naso unicornis (22-28 cm FL: Marshell et al. 2011) 459
and labrid species (< 20 cm TL: Jones 2005), yet conflicting results exist over a similar 460
range of sizes (35-54 and 37-68 cm FL) for Plectropomus leopardus. Zeller (1997) 461
found no home range to body size relationship for P. leopardus, while the relationship 462
was significant in a study by Samoilys (1997), which linked greater movement of male 463
fish during spring with pre-spawning behaviour. Greater home range area was not a 464
function of body size for other species, e.g. Epinephelus guttatus (12-30 cm standard 465
length, SL: Shapiro et al. 1994), Kyphosus sectatrix (26-46 cm fork length, FL: Eristhee 466
and Oxenford 2001), or Pseudocaranx dentex (35-71 cm FL: Afonso et al. 2009). Thus, 467
no reliable relationship of body size with movement can be concluded for individuals 468
within a species. 469
470
Multispecies comparisons of reef fishes in the literature reveal no clear consistent 471
relationship of larger home ranges with larger body size. Kramer and Chapman (1999) 472
and subsequently Botsford et al. (2009) found an increase in home range with body size 473
for 29 reef fish species, yet the species included were typically smaller-sized territorial 474

Chapter 2: Literature review
25
fishes varying from juveniles to adults (Pittman and McAlpine 2001). Likewise, Sale 475
(1978) plotted home range against body weight for ‘representative reef fishes’, with 476
positive relationships observed for mammals and birds categorised by feeding guild. 477
However, only one teleost species > 1 kg mass was included and the sedentary nature 478
of fish movement was discussed, rather than any scaling relationship present (Sale 479
1978). No relationship was observed by Kaunda-Arara and Rose (2004a) among mixed 480
species tracked along Kenyan reefs. Welsh et al. (2013) also demonstrated that while 481
home ranges expanded with ontogeny for a number of scarids, no pattern of body size 482
and space use was observed for adults. Overall, body size does not appear to be a good 483
predictor of movement when average adult home ranges are plotted against body size of 484
a number of reef fish species (Figure 2.2). In support, Pittman and McAlpine (2001) 485
suggest other life-history characteristics such as feeding strategy and reproductive 486
mode may have a greater influence on movement patterns. For example, although long-487
distance spawning migrations are typically conducted by larger-bodied species, the 488
distances moved to spawning sites may not necessarily reflect body size. Claydon 489
(2004) highlighted the importance of scale, suggesting that cumulative distances moved 490
by smaller-sized fishes that are active continuously during the day and frequently 491
spawn close to their home range, may be similar to cross-shelf movements of larger 492
serranids that appear sedentary. Therefore although applicable for mammals and other 493
species (Peters 1983), body scaling theories may not hold for reef fish. 494

Chapter 2: Literature review
26
495
Figure 2.2 The relationship between body size and home range area of adult coral reef 496
fishes. 497
Different feeding guilds sourced from the literature include: herbivore; corallivore; 498
planktivore; consumes mobile benthic invertebrates; piscivore. 499
500
2.4 Feeding strategy 501
Diet, method of food acquisition, and feeding behaviour also influence the distances 502
moved and space use. Coral reef fishes are highly diverse with a range of diets and 503
morphological specialisations for different food sources (Sale 1977). Feeding may be 504
restricted to a small patch on the reef or involve roaming for mobile prey. Similarly, 505
behaviours can involve movements to feeding areas ranging from a few metres to 506
migrations of several kilometres (Hobson 1973; Holland et al. 1996; Meyer et al. 507
2007a). Feeding movements are also often associated with the daily cycle, allowing 508
temporal niche separation between nocturnal and diurnal feeders in reef systems. Thus 509
the preferred dietary source, method of food acquisition and feeding behaviour of a 510
species can be useful predictors of home range area. 511

Chapter 2: Literature review
27
Categorisation of species into ‘sedentary’ or ‘roving’ methods of food acquisition can 512
be useful in predicting space use (Figure 2.2). Fishes with smaller home ranges 513
typically feed on organisms that surround or approach them, with limited movements 514
often observed for planktivores, sessile invertebrate feeders, or herbivores with 515
territorial behaviour (Figure 2.2). For example, pomacentrids are highly territorial to a 516
small reef patch which is defended against congeners and other species (e.g. Sale 1971; 517
Tyler III and Stanton 1995). This strategy of ‘staying put’ in a space-limited 518
environment is successful because Dascyllus aruanus (omnivore) and Abudefduf 519
abdominalis (planktivore) can acquire plankton from the flow of water across the reef, 520
without physically moving far (Sale 1971; Tyler III and Stanton 1995). Likewise, 521
chaetodontids and pomacanthids that feed on coral polyps and sponges often show high 522
specificity to particular coral species, and potentially strong associations can occur in 523
restricted habitat patches with highly diverse coral cover (Reese 1975; Hourigan et al. 524
1989; Righton et al. 1998). Some piscivores such as smaller serranids (e.g. 525
Cephalopholis and Epinephelus spp.) are also benthos-associated, inhabiting small 526
areas and sheltering among coral crevices and overhangs. Limited movement is 527
displayed by these species and carnivorous scorpaenids, since as ambush predators, 528
food is acquired by slowly patrolling or waiting cryptically on the benthos for prey 529
(Fishelson 1975; Jud and Layman 2012; Oufiero et al. 2012). 530
531
In contrast, fishes with food acquisition characterised by mobility often inhabit larger 532
home ranges. Large herbivores such as scarids are strongly linked to the reef habitat, 533
but move more broadly feeding on benthic turf algae compared to sedentary herbivores 534
(Fox and Bellwood 2007). These more mobile fishes rove in schools within small to 535
moderate-sized home ranges, e.g. Chlorurus microrhinos ~0.01 km2 and Scarus 536

Chapter 2: Literature review
28
rivulatus ~0.02 km2 (Welsh and Bellwood 2012a, b). Increased mobility is also 537
required to obtain mobile prey, therefore piscivores have adopted a variety of feeding 538
strategies including mobile ambush, stalking, and chasing to counter prey avoidance 539
(Gerking 1959; Takeuchi 2009). For example, adult P. leopardus ambush prey while 540
swimming and display moderate home ranges outside of the spawning season (0.01-541
0.02 km2; Zeller 1997). The predominantly piscivorous Caranx melampygus is highly 542
mobile and patrols the reef edge during the day, with daily movements of up to 6 km, 543
before shifting to regular locations where fish are less active at sunset (Holland et al. 544
1996). Therefore, not only is greater space use observed for fishes that rely on mobility 545
to obtain food, but also for species that utilise different habitats during periods of 546
activity and rest in coral reef environments (Kramer and Chapman 1999). 547
548
Reef fishes travel further and use larger areas when the locations used for different 549
biological functions (e.g. feeding, resting, reproduction) are widely separated. Many 550
species utilise feeding areas that are spatially and temporally separated from resting 551
areas (Howard et al. 2013), and distinct diel migrations between locations have been 552
documented since the 1970s (Hobson 1973). For successful utilisation of resources in 553
different areas, movements between locations requires travel at an appropriate time and 554
fishes often travel in schools (Mazeroll and Montgomery 1998). Movements between 555
resting and foraging areas typically occur at dawn and dusk, and schooling behaviour is 556
often related to these diel migrations, presumably as a mechanism to avoid predation 557
and increase feeding success (Hobson 1972, 1973). Diel habitat shifts are common 558
across a range of species with different diets, including diurnal herbivores and 559
piscivores as well as nocturnal species that forage in the benthos and prey on 560
invertebrates and fish. Foraging distances travelled by species are variable, with 561
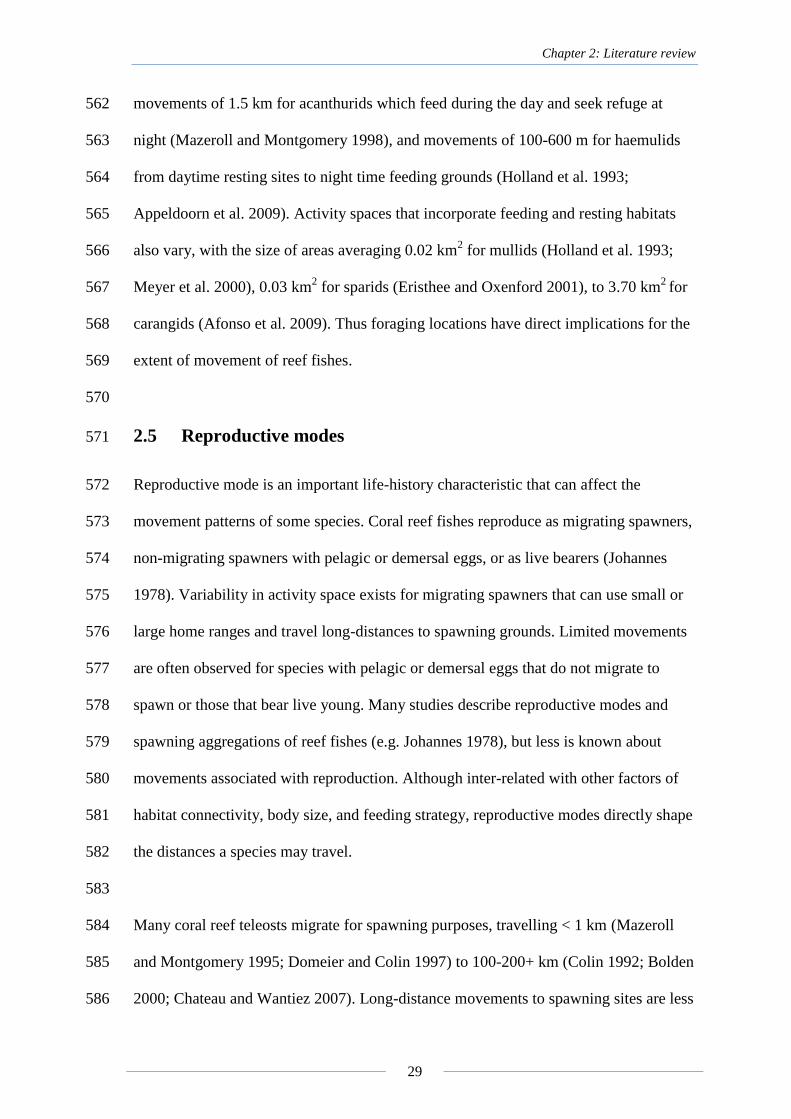
Chapter 2: Literature review
29
movements of 1.5 km for acanthurids which feed during the day and seek refuge at 562
night (Mazeroll and Montgomery 1998), and movements of 100-600 m for haemulids 563
from daytime resting sites to night time feeding grounds (Holland et al. 1993; 564
Appeldoorn et al. 2009). Activity spaces that incorporate feeding and resting habitats 565
also vary, with the size of areas averaging 0.02 km2 for mullids (Holland et al. 1993; 566
Meyer et al. 2000), 0.03 km2 for sparids (Eristhee and Oxenford 2001), to 3.70 km
2 for 567
carangids (Afonso et al. 2009). Thus foraging locations have direct implications for the 568
extent of movement of reef fishes. 569
570
2.5 Reproductive modes 571
Reproductive mode is an important life-history characteristic that can affect the 572
movement patterns of some species. Coral reef fishes reproduce as migrating spawners, 573
non-migrating spawners with pelagic or demersal eggs, or as live bearers (Johannes 574
1978). Variability in activity space exists for migrating spawners that can use small or 575
large home ranges and travel long-distances to spawning grounds. Limited movements 576
are often observed for species with pelagic or demersal eggs that do not migrate to 577
spawn or those that bear live young. Many studies describe reproductive modes and 578
spawning aggregations of reef fishes (e.g. Johannes 1978), but less is known about 579
movements associated with reproduction. Although inter-related with other factors of 580
habitat connectivity, body size, and feeding strategy, reproductive modes directly shape 581
the distances a species may travel. 582
583
Many coral reef teleosts migrate for spawning purposes, travelling < 1 km (Mazeroll 584
and Montgomery 1995; Domeier and Colin 1997) to 100-200+ km (Colin 1992; Bolden 585
2000; Chateau and Wantiez 2007). Long-distance movements to spawning sites are less 586

Chapter 2: Literature review
30
studied than the aggregations themselves (Claydon et al. 2012), with most knowledge 587
gained through studies documenting limited numbers of sites and individuals (e.g. 588
Colin 1992; Zeller 1998; Bolden 2000; Nemeth et al. 2007). Some evidence suggests 589
fishes typically follow regular paths to particular spawning sites at predictable times 590
before returning to their usual home range (Zeller 1998; Bolden 2000). Although 591
spawning movements are not considered part of the home range, they are essential to 592
population connectivity. Spawning aggregations are common for many reef fishes 593
worldwide, including labrids (Colin 2010), acanthurids (Colin 1978; Colin and Clavijo 594
1988), serranids (Samoilys and Squire 1994), lethrinids (Salem 1999) and lutjanids 595
(Carter and Perrine 1994; Salem 1999; Heyman and Kjerfve 2008). The increased 596
density of individuals during these periods provide enhanced mate choice, reduced 597
predation on spawn, assist larval dispersal and act as a social cue for subseqent sex 598
change (Johannes 1978; Doherty et al. 1985; Colin and Clavijo 1988). The size and 599
periodocity of aggregations and distance that fish migrate to a spawning site varies 600
among species. Small ‘resident’ aggregations may form frequently on the same reef, 601
such as for acanthurids (Domeier and Colin 1997; Claydon et al. 2012). Large numbers 602
of individuals (100s to 100,000) may form ‘transient’ aggregations, migrating long-603
distances during a short spawning season (one to several months) to spatially discrete 604
sites (Smith 1972; Colin 1992; Carter and Perrine 1994; Sadovy 1996). Aggregation 605
behaviour is also adaptive and can vary among species within a family, e.g. lutjanids 606
show plasticity in reproductive mode, with Lutjanus synagris spawning in small groups 607
in Florida and large aggregations of Lutjanus jocu in Belize (Carter and Perrine, 1994). 608
Thus, wide variability in reproductive movements makes predicting species-specific 609
movement difficult. While reproductive-related movements are not encapsulated in the 610

Chapter 2: Literature review
31
daily home range of species, it is important to consider in relation to the distances 611
individuals travel. 612
613
In contrast, non-migrating spawners, benthic egg layers and live bearing reproductive 614
modes correspond to a sedentary adult lifestyle. Limited adult movement is 615
characteristic of these reproductive modes which comprise species from a number of 616
families, including Apogonidae, Blennidae, Balistidae, Gobiidae, Siganidae, 617
Sygnathidae and Tetraodontidae (Chambers and Trippel 1997). Reproduction for such 618
species does not require movement away from the home range. For example, pelagic 619
eggs can be spawned from species that do not migrate for reproduction, which are 620
instead dispersed from the home reef in favourable conditions (e.g. Gerreidae, Scaridae; 621
Johannes 1978). In contrast, strategies of benthic egg layers and live bearing species 622
typically involve parental care and territoriality, with individuals protecting their eggs 623
or young from conspecifics and other predators (Johannes 1978; Thresher 1984; 624
Chambers and Trippel 1997). For example small-bodied adult blennies, pomacentrids 625
and chaenopsids display high site attachment and aggressively defend their small 626
territories of ~1 m2 within which eggs are laid (Itzkowitz et al. 1995; Hastings and 627
Galland 2010). Females of the larger-bodied haeremic ballistids lay clutches of benthic 628
eggs which are oxygenated by fanning them, utilising areas < 300 m2 during the 629
spawning season (Kuwamura 1997). Since these sedentary reproductive modes restrict 630
the home ranges and distance adult individuals travel, movement is more common 631
during larval and juvenile phases (or potentially outside of the spawning season) for 632
these species. Therefore, knowledge of reproductive mode and timing can be used in 633
combination with factors of habitat connectivity and feeding strategy to predict the 634
space use of coral reef fishes. 635

Chapter 2: Literature review
32
2.6 Implications and conclusions 636
Variation among and within species and locations greatly influences the efficacy of 637
management strategies for protecting and sustaining reef fishes. Individuals may use 638
small areas within a reef for long time periods, make sporadic or frequent long-distance 639
migrations, or range widely within their environment. Thus, utilising appropriate 640
methods to elucidate these movements at an appropriate scale is essential for capturing 641
the overall movement patterns of a species at a population level. 642
643
Adult fishes are essential for population sustainability through the production of larvae, 644
thus knowledge of their dispersal abilities is important for management and 645
conservation of reef fish populations. Insight into which factors are most responsible 646
for shaping movement patterns is useful to management for the design of MPAs, since 647
effective MPAs should be large enough to adequately encompass the home range of 648
focal species (Grüss et al. 2011). To better predict the space use and travel distance of 649
important reef fishes, an understanding of the habitat under consideration (i.e. 650
connectivity), and the feeding strategy and reproductive mode of target species is 651
required. Evidence suggests that greater space use and movement over larger areas 652
occurs in species: (a) along contiguous habitats; (b) that use spatially separate habitats 653
for different diel biological functions, feature a mobile method of food acquisition, and 654
consume fish prey; and (c) are broadcast spawners that migrate for spawning. It is the 655
combination of these factors and consideration of the scale that can be useful in 656
predicting movement patterns of fish across the mosaic of reef habitats and planning 657
future MPAs. Therefore, effective management strategies could incorporate the 658
positioning of MPA boundaries along natural habitat breaks, consider whether key 659
species utilise multiple habitats on a diel basis, use a mobile feeding strategy, and 660

Chapter 2: Literature review
33
migrate to spawning areas. In addition, the timing of spawning migrations is 661
particularly relevant for temporal closures, in that specific spawning areas or migratory 662
corridors can be integrated into management objectives. Since a unique combination of 663
these factors shape the home ranges and distances moved for each species over specific 664
spatial and temporal scales, research should focus on gaining insight into the spatial 665
ecologies of reef fishes within this context.666
667

34
General methodology Chapter 3
Tagged individual swimming away after release
(Photo credit: M. Heupel)

Chapter 3: Methodology
35
3.1 Study species 668
The redthroat emperor Lethrinus miniatus (Forster 1801, Family Lethrinidae, Figure 669
3.1) is one of the largest emperors, attaining a length in excess of 600 mm fork length 670
(FL) and a weight of over 3 kg (Williams et al. 2003; Williams et al. 2007a). This 671
species reaches > 20 years of age, displays evidence of protogynous hermaphroditism, 672
and has demographic characteristics that vary regionally in GBR waters (Loubens 673
1980; Brown and Sumpton 1998; Bean et al. 2003; Williams et al. 2003; Williams et al. 674
2005, 2006; Williams et al. 2007b). The mating system for L. miniatus is reported as 675
polygynous, in which a single male pair-spawns consecutively with several females, 676
and 50% of females were estimated to be mature by 280 mm fork length and 2.1 years 677
of age on the GBR (Williams et al. 2006). 678
679
Sex change for L. miniatus has been correlated with fish size rather than age, with 680
females typically predominating smaller size classes and a greater proportion of males 681
in larger size classes (e.g. males comprised 50% of samples at 400-450 mm: Sumpton 682
and Brown 2004; Williams et al. 2006). However, a large overlap exists in size 683
distributions among sexes, a lack of transitional individuals have been observed, and a 684
proportion of females do not change sex. Therefore, sex change is thought to be rapid, 685
flexible among regions, and represents only one potential sexual strategy in this species 686
(Bean et al. 2003; Sumpton and Brown 2004; Williams et al. 2006; Currey et al. 2013). 687
Since the sex of individuals was not tested and could not be identified in this project, 688
the influence of sex on movement patterns could not be evaluated. 689
690
Prey of this benthic predator consists of crustaceans, echinoderms, molluscs and small 691
fish, with feeding typically at night in sandy habitats adjacent to coral reefs, and only 692
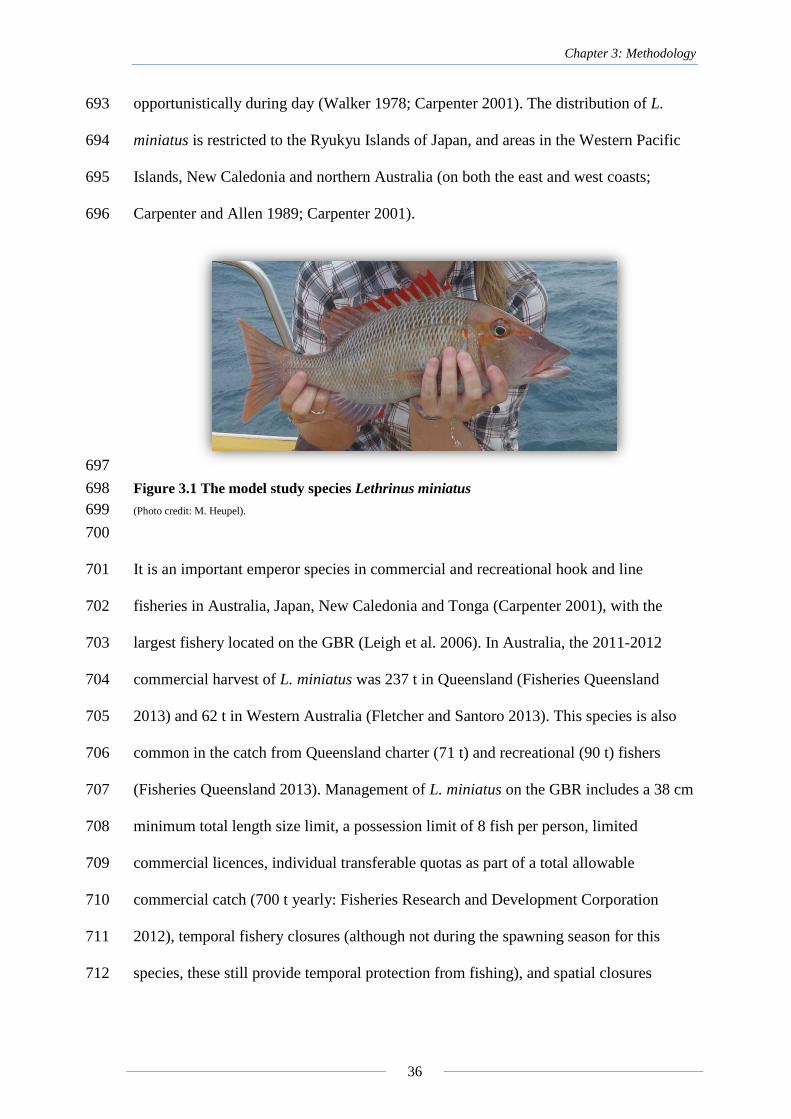
Chapter 3: Methodology
36
opportunistically during day (Walker 1978; Carpenter 2001). The distribution of L. 693
miniatus is restricted to the Ryukyu Islands of Japan, and areas in the Western Pacific 694
Islands, New Caledonia and northern Australia (on both the east and west coasts; 695
Carpenter and Allen 1989; Carpenter 2001). 696
697
Figure 3.1 The model study species Lethrinus miniatus 698
(Photo credit: M. Heupel). 699
700
It is an important emperor species in commercial and recreational hook and line 701
fisheries in Australia, Japan, New Caledonia and Tonga (Carpenter 2001), with the 702
largest fishery located on the GBR (Leigh et al. 2006). In Australia, the 2011-2012 703
commercial harvest of L. miniatus was 237 t in Queensland (Fisheries Queensland 704
2013) and 62 t in Western Australia (Fletcher and Santoro 2013). This species is also 705
common in the catch from Queensland charter (71 t) and recreational (90 t) fishers 706
(Fisheries Queensland 2013). Management of L. miniatus on the GBR includes a 38 cm 707
minimum total length size limit, a possession limit of 8 fish per person, limited 708
commercial licences, individual transferable quotas as part of a total allowable 709
commercial catch (700 t yearly: Fisheries Research and Development Corporation 710
2012), temporal fishery closures (although not during the spawning season for this 711
species, these still provide temporal protection from fishing), and spatial closures 712

Chapter 3: Methodology
37
(MPAs). Despite the importance of this species, little information is available on the 713
movement patterns of L. miniatus. 714
715
3.2 Study site 716
This research was conducted across a number of spatial scales on the Great Barrier 717
Reef (GBR), Queensland Australia. Broad-scale investigation of movement patterns of 718
L. miniatus utilised samples collected from 4° latitude along the GBR, and is detailed in 719
Chapter four. Chapters five, six and seven explored movement of adult individuals in 720
the Capricorn Bunker Region of the southern GBR. Heron (23.4500° S, 151.9167° E), 721
Sykes (23.4302° S, 152.0336° E) and One Tree (23.5083° S, 152.0917° E) Island Reefs 722
(Figure 3.2) are located within this region, approximately 100 km off the coast of 723
Gladstone. Heron Island Reef is approximately 10 km long and 5 km wide and consists 724
of a large lagoon and emergent cay. The reef crest is exposed at the lowest tidal levels 725
(tidal range ~3 m). The reef slope has complex coral cover and coral bommies with 726
sand patches, sloping into sandy habitat that descends into two channels surrounding 727
the reef approximately 40 m in depth. Deep access points into the lagoon are limited 728
(and at > 2.1 m) with the lagoon isolated at low tide. Sandy shoal habitat 729
(approximately 3 km wide) connects the eastern end of Heron Island Reef to Sykes 730
Reef. Sykes Reef is approximately 5 km long and a maximum width of 2 km wide, with 731
reef slope depths of 12 to 16 m. One Tree Island Reef is located southwest of Heron 732
Island and Sykes Reefs and is approximately 5.5 km long and 3.5 km wide, with a 733
lagoon and emergent cay. Access into the lagoon is restricted to tides > 2.2 m. With 734
prevailing wave and wind energy from the southeast, the reef slope along the windward 735
sides of each reef are characterised by channel-and-groove habitat. 736
737

Chapter 3: Methodology
38
738
Figure 3.2 Location of Heron Island, One Tree Island and Sykes Reefs in the Capricorn-739
Bunker group of the southern Great Barrier Reef, Australia. 740
Triangles indicate positions of the omnidirectional acoustic receivers which detected L. 741
miniatus implanted with V13P® transmitters. 742
743
3.3 Fish sampling and sample collection 744
Individual L. miniatus were captured by line fishing along the reef slopes of Heron and 745
One Tree Island Reefs for Chapters five, six and seven. Fish were caught using rod and 746
reel (13.6 kg line and 27.2 kg leader) with barbless 8/0 hooks baited with pilchard 747
Sardinops sagax or squid Loligo spp. On capture, fish were vented to release excess 748
gases from the swim bladder, < 1 ml blood sample withdrawn from the caudal 749
vasculature, and then anaesthetised with Aqui-S. Lactate levels in whole blood samples 750
were measured to assess physiological condition, and confirmed fish were not 751
excessively exhausted by the angling process (see Appendix A). A V13P® transmitter 752
(Vemco Ltd., Canada) surgically implanted into the abdominal cavity via a small 753
incision made longitudinally between the pectoral and ventral fins on the left side. The 754
incision was closed with two simple interrupted stitches using absorbable sutures 755

Chapter 3: Methodology
39
(Figure 3.3). Fork length (FL mm) was recorded and a dart tag (PDS; Hallprint©
) fitted 756
externally by insertion into the dorsal musculature for identification. After recovery in 757
fresh sea water, fish were released at the site of capture, with the tagging and measuring 758
procedure conducted in less than 8 minutes (Figure 3.4). 759
760
761
Figure 3.3 The acoustic tagging procedure 762
The insertion of a V13P® acoustic transmitter into an individual L. miniatus (a), the closing of 763
the insicion using sutures (b, c), and appearance of the healed incision after recapture 132 days 764
post-tagging (d) (Photo credit: M. Heupel). 765

Chapter 3: Methodology
40
766
Figure 3.4 Release of a tagged individual 767
External dart tag (a and b) and closed incision from acoustic transmitter insertion (b) are visible 768
(Photo credits: D. Abdo, M. Heupel). 769
770
3.4 Acoustic telemetry 771
Chapters four, five and six investigated movements of adult L. miniatus using passive 772
acoustic telemetry which consists of two components, the acoustic transmitter and 773
receiver (Figure 3.5). Vemco V13P® transmitters (Vemco Ltd., Canada) fitted to each 774
individual emitted a unique identification code, date, time and depth in the water 775
column (maximum depth 50 m), with a battery life of 364 days. Long-term monitoring 776
of the presence and movements of individuals was facilitated by 52 VR2W®
777
omnidirectional acoustic receivers (Vemco Ltd., Canada) located around three reef 778
platforms (Heron Island, Sykes and One Tree Island Reefs) and downloaded twice per 779
year (Figure 3.2, Table 3.1). 780

Chapter 3: Methodology
41
781
Figure 3.5 Vemco acoustic telemetry components 782
V13P® transmitter (a) and the positioning of a VR2W
® acoustic receiver underwater (b) 783
(Photo credits: Vemco Ltd. Canada, A. Boomer). 784
785
Table 3.1 Number of receivers in the main array located in the Capricorn-Bunker region. 786
Reef platform Reef slope Lagoon
Heron Island Reef 19 6
Sykes Reef 5 -
One Tree Island Reef 11 8
787
This array was designed to track multiple species of mobile predators, with each 788
receiver fastened to a star picket embedded in the substrate at 10-20 m depth along the 789
reef slopes, and in < 10 m in the lagoons. Chapter five utilised data from the entire 790
array to examine intra- and inter-reef movments, while Chapter six used data from 19 791
receivers located on the Heron Island Reef slope only. A separate smaller array 792
deployed on northwestern Heron Island Reef to measure fine-scale movements is 793
detailed in Chapter seven.794

42
Inferring broad-scale movement of a Chapter 4
coral reef fish using oxygen and carbon isotopes
in otolith carbonate
Broad-scale movement of L. miniatus with ontogeny was investigated across 4° of
latitude on the Great Barrier Reef

Chapter 4: Broad-scale movement
43
4.1 Introduction 795
Movement is a fundamental demographic variable affecting the distribution and 796
abundance of populations in time and space (Pittman and McAlpine 2001). Knowledge 797
of movement patterns in fishes is important for understanding population dynamics, 798
delineating stock boundaries and evaluating the potential effects of exploitation 799
(Fromentin and Powers 2005; Cadrin and Secor 2009). Movement patterns of exploited 800
coral reef fishes have not been extensively studied, despite the strong influence of 801
movement on the distribution and abundance of fishes (Pittman and McAlpine 2001). 802
Coral reef fish larvae are typically pelagic and have the potential to disperse widely 803
(Cowen 1990), while after settlement, most are considered sedentary with relatively 804
small home ranges (Sale 1991). This paradigm evolved principally from studies of 805
small-bodied reef fish, and may not apply to some larger-bodied species that have the 806
capacity to move larger distances. Long-distance movements by a proportion of the 807
adult population (Grüss et al. 2011) can assist in connectivity of populations (Kaunda-808
Arara and Rose 2004a). Thus, information on dispersal of both the larval and adult 809
stages is important for a more complete understanding of the population dynamics of 810
mobile species. 811
812
Dispersal can be investigated by analysis of fish otoliths, which are calcified aragonite 813
structures that assist with balance and hearing. Otoliths act as time recorders, 814
incorporating the elemental and isotopic signatures of the environments a fish has 815
inhabited as it grows (Campana 1999, 2005). For a number of exploited species, 816
otoliths have been used to identify migrations and discern stocks in isotopically distinct 817
environments (Edmonds and Fletcher 1997; Bastow et al. 2002; Newman et al. 2009; 818
Newman et al. 2011; Fairclough et al. 2013). Analysis of stock structure typically 819

Chapter 4: Broad-scale movement
44
involves obtaining a combined stable isotopic signature for the whole otolith (e.g. 820
Newman et al. 2010), while timing of migrations are investigated from portions of the 821
otolith corresponding to growth structures (e.g. Steer et al. 2010). Ratios of stable 822
oxygen isotopes (18
O/16
O or δ18
O) are incorporated into otoliths at or near equilibrium 823
with environmental δ18
O, varying as a function of temperature and salinity (Elsdon and 824
Gillanders 2002), where a decrease in δ18
O correlates to an increase in temperature and 825
decreased salinity (Kalish 1991). The ratio of stable carbon isotopes (13
C/12
C or δ13
C) 826
are not incorporated into otoliths at equilibrium and are influenced by metabolic rates 827
and reflect diet and geographic variations in dissolved inorganic carbon (DIC) 828
(Campana 1999; Elsdon et al. 2010). High metabolism as juveniles results in lower 829
δ13
C ratios than for adult fishes whose metabolic rate has slowed (Høie et al. 2004). 830
Investigation of δ18
O and δ13
C at both juvenile and adult life stages can elucidate stock 831
mixing or separation, movement or residency among locations and can allow adults to 832
be linked to nursery areas (Thorrold et al. 1998; Gillanders et al. 2003). 833
834
Although research on isotope analysis of otoliths has concentrated on temperate fishes 835
(but see: Dufour et al. 1998), this technique could be applied to better understand the 836
dispersal of tropical reef fishes such as emperors (family Lethrinidae). Emperors are 837
small to medium-bodied coral reef fishes that are often important components of 838
tropical subsistence, artisanal and commercial fisheries throughout the Indo-West 839
Pacific and West Africa (Carpenter 2001). In comparison to most other reef fish 840
families, emperors are generally assumed to be more mobile (Jones 1991) because they 841
are often encountered away from reefs in sand or rubble areas, and usually do not 842
appear to be territorial (Carpenter 2001; Kaunda-Arara and Rose 2004a, b). However, 843
there is limited empirical movement data available for emperors (but see: Nanami and 844

Chapter 4: Broad-scale movement
45
Yamada 2009; Taylor and Mills 2013), and the majority of tagged individuals have 845
been recaptured within 5 km of release sites, with only a few individuals moving 846
greater distances (Kaunda-Arara and Rose 2004a, b). It remains unclear, therefore, 847
whether emperors are more mobile than other reef fishes and whether regular large-848
scale dispersal is characteristic. 849
850
Despite its importance to fisheries, there is limited empirical evidence of adult 851
movement of L. miniatus, due to low recapture rates from tagging (Brown et al. 1994). 852
For example, only 32 of 1500 externally tagged individual L. miniatus were recaptured 853
over a 20 year period on the GBR (B. Sawynock unpublished results; Williams et al. 854
2010). Biological research has reported significant regional differences in age structure 855
and natural mortality rates of L. miniatus (Williams et al. 2007b) and incorporating 856
movement of L. miniatus among regions in an age-structured population model 857
provided a parsimonious explanation for these observed differences (Williams et al. 858
2010). Williams et al. (2010) hypothesised that net movement of L. miniatus occurs in a 859
northerly direction, away from the centre of the species’ distribution on the GBR, or in 860
a cross-shelf direction. However, there is no empirical evidence to support any 861
hypotheses on movement, and it is unlikely that conventional tagging approaches can 862
provide such evidence. Alternative techniques such as the analysis of isotopic 863
signatures in otoliths provide the potential to gain information on movement patterns of 864
L. miniatus. 865
866
The aim of this chapter was to determine whether L. miniatus undertake broad-scale 867
uni- directional migration with ontogeny by: (1) identifying whether otolith isotopic 868
signatures of L. miniatus vary between life stage (juvenile and adult) with latitude; (2) 869

Chapter 4: Broad-scale movement
46
comparing isotopic signatures by latitude for individual otoliths; and (3) using these 870
findings to speculate on movement of this species. If isotopically different water bodies 871
were inhabited by juveniles and adults, isotopic signatures of the otoliths will reflect 872
these differences. Using this novel approach, detection of variation in isotopic 873
signatures with latitude and life stage may explain regional differences in population 874
demographics. This will therefore provide insight into whether the population 875
undergoes directed long-distance movement with ontogeny, advancing our 876
understanding of movement patterns and providing valuable input for consideration in 877
future stock assessments for L. miniatus. 878
879
4.2 Methods 880
4.2.1 Sample collection and processing 881
Samples of L. miniatus were collected from reefs of the Great Barrier Reef (GBR; 882
Figure 4.1) from research line fishing catch surveys for the Effects of Line Fishing 883
(ELF) experiment (Mapstone et al. 2004) and Fisheries Research and Development 884
Corporation (FRDC) Project No.98/131 (Davies et al. 2006). For each fish, FL was 885
recorded to the nearest mm, and sagittal otoliths were removed, cleaned, dried, weighed 886
and stored in paper envelopes. 887

Chapter 4: Broad-scale movement
47
888
Figure 4.1 Sample collection locations 889
Locations (black circles) where L. miniatus were sampled from the Great Barrier Reef World 890
Heritage Area, Queensland Australia. 891
892
Otoliths were sectioned with a diamond blade isomet saw and mounted on glass slides 893
with clear-casting polyester resin. Pairs of translucent and opaque bands have been 894
previously validated as annuli (Williams et al. 2005) and age estimates of individuals 895
were verified by counts of completely formed opaque bands under reflected light. Four 896
year old individuals were selected for analyses to minimise temporal variability. 897
September 1 was assigned as the birth date of this species, since this represents the 898
middle of the spawning period (July-October; Williams et al. 2006). One hundred and 899
twenty individual four year old fish caught between 01/09/1999-31/08/2000 were 900
selected for analysis across latitudes 18°S to 22°S (Figure 4.1). These individuals 901
ranged in size between 320 and 478 mm FL, and included mature females and males. 902
Bowen
Mackay
Cairns
Townsville
150°145°
17°
18°
19°
20°
21°
22°
23°
0 75 150
km
Austral ia
QUEENSLAND
Coral Sea
0 1,000 2,000
km

Chapter 4: Broad-scale movement
48
4.2.2 Laboratory processing and analysis of isotope ratios 903
Slides of sectioned otoliths were cleaned using methanol and placed on a moveable 904
microscope stage fitted with a digital camera, and positioned beneath a fixed high-905
precision micromilling bit. Two samples from each otolith were selected for 906
micromilling; the core (primordium) portion represented the first ~3 months of life and 907
the edge portion referred to the final 3-6 months of life prior to capture relative to 908
visible otolith growth structures (Figure. 4.2). Sample paths were defined and digitised 909
as three-dimensional coordinates using New Wave Research XPCTM
(ESI Inc., 910
Portland, OR, USA) software (Wurster et al. 1999; Hamer et al. 2003). A 911
predetermined amount of material was selected to obtain 50-120 µm material for each 912
portion, involving three paths at the core and a singular path along the otolith edge 913
(Figure 4.2). Samples were micromilled using the edge of a micro dental drill (0.3 mm) 914
set to a width of 60 µm and depth of 120-140 µm. Resulting sample powder was 915
collected manually using a scalpel tip and stored in small plastic 0.2 ml PCR Eppendorf 916
tubes prior to weighing and analysis. 917

Chapter 4: Broad-scale movement
49
918
Figure 4.2 Sectioned L. miniatus otolith under reflected light with user-defined 919
micromilling paths highlighted as core and edge portions. 920
921
δ18
O and δ13
C values were determined using a Thermofisher Gasbench III coupled to a 922
Delta VPlus
isotope ratio mass spectrometer via a Conflo IV. Sample powders were 923
placed in glass exetainer vials and atmosphere was replaced with helium. Complete 924
digestion of sample powders with 100% anhydrous orthophosphoric acid produced 925
carbon dioxide and water. Isotope ratios were analysed relative to repeat samples of 926
international reference standards (NBS-19 limestone and NBS-18 calcite) to monitor 927
accuracy and precision. Precision of internal standards (standard deviation, SD, of 928
mean values) were < 0.1‰ for both oxygen and carbon isotopes. Samples are reported 929
relative to Vienna Pee Dee Belemnite (VPDB). 930
931
4.2.3 Data analysis 932
Variation in isotopic signatures with latitude indicates differences in environmental 933
chemistry with location, while dissimilarity in δ18
O and δ13
C between life stages 934

Chapter 4: Broad-scale movement
50
suggests individuals inhabited isotopically different environments during the juvenile 935
and adult stages. To determine whether differences in isotopic signature (δ18
O and 936
δ13
C) existed between life stage (otolith portion) and latitude, linear regression (δ18
O) 937
and generalised least squares models (GLS; δ13
C) with an information theoretic model 938
selection process in R version 3.1.0 (R Development Core Team 2014) were used. GLS 939
models are weighted linear regressions, in which heterogeneity of residual variance can 940
be incorporated into the analysis (Zuur et al. 2009; Pinheiro et al. 2013). Residual 941
spread increased with portion for δ13
C, so the varIdent variance structure was used in 942
the nlme package (Pinheiro et al. 2013) to weight the models by portion to achieve 943
homogeneous variances (Zuur et al. 2009). δ18
O and δ13
C were treated as response 944
variables in separate analyses with latitude as a continuous factor and portion modelled 945
as a fixed factor, month (capture date) as a natural spline (with varying degrees of 946
freedom) and whole otolith weight as an offset. Otolith weight is commonly included as 947
a covariate in studies investigating variation in isotope ratios that include individuals 948
comprising multiple age classes (e.g. Bastow et al. 2002; Newman et al. 2010). 949
Although all fish in this study were collected from the same cohort, whole otolith 950
weight was included in the models to minimise variability (between birth and capture 951
date) in the analysis. To determine the best fitting model for both isotope ratios, models 952
were compared using the Akaike Information Criterion corrected for small sample bias 953
(AICc). Twenty-one models were compared for oxygen and carbon isotope ratios. 954
Models were compared using a stepwise approach, from the most complex fully 955
saturated model to the simplest model. Strongly supported models were those with 956
∆AICc values < 2. Where multiple models satisfied this criterion, the best-957
approximating model was considered as the model with the lowest ∆AICc and the 958
fewest terms. 959

Chapter 4: Broad-scale movement
51
To examine the variation in δ18
O and δ13
C between life stages for each individual 960
otolith, the difference (d) between edge and core values for each individual otolith was 961
compared, where d = IE - IC, and E was the edge value and C was the core value for 962
each isotope I. This standardisation allowed changes in isotopic ratios with ontogeny to 963
be illustrated. Plots were produced with C normalised to zero, therefore d > 0 represents 964
an increase and d < 0 represents a decrease in δ18
O and δ13
C with life stage. If no 965
difference in δ18
O and δ13
C existed between life stages (i.e. d = 0), it would be assumed 966
that the environments an individual inhabited as a juvenile and adult were similar in 967
water chemistry, or no movement (among latitudes) occurred with ontogeny. Linear 968
regression models were used to analyse δ18
O and δ13
C (14 models for each isotope) and 969
were fitted with a natural spline of month, otolith weight as an offset, and compared 970
using AICc. 971
972
The visreg package in R (Breheny and Burchett 2013) was used to visualise the 973
regression models, to describe how the isotope ratios vary as a function of the 974
explanatory variables. Conditional plots for each explanatory variable with each isotope 975
ratio were produced while holding all other variables constant (as the median or most 976
common category), for example: δ18
O by latitude for the month of September (Breheny 977
and Burchett 2013). 978
979
4.3 Results 980
Four models for δ18
O were strongly supported by the data (∆AICc < 2, models O1-O4) 981
and included parameters for latitude, otolith portion, the interaction between them, and 982
month (Table 4.1). Each of these models were very similar with the same main effects, 983
however, the best-approximating model (model O1) indicated that δ18
O increased with 984

Chapter 4: Broad-scale movement
52
latitude. This trend was stronger for edge (adult) portions than for the core (juvenile) 985
portions despite some variation observed with latitude (Figure 4.3a). δ18
O varied among 986
months, and was greater in samples collected during May/June and December, and 987
lowest in January and September/October (Figure 4.3b). 988

Chapter 4: Broad-scale movement
53
Table 4.1 Linear regression and GLS models examining the effects of latitude (Lat), 989
otolith portion (P), whole otolith weight (W) and month (M), on δ18
O and δ13
C. 990
Only models with at least 1% support (Akaike weight (w) = 0.01) are shown. The effect of 991
month was modelled as a natural spline (ns) with varying degrees of freedom. Otolith weight 992
was modelled as an offset. All δ13
C GLS models were weighted by portion using the varIdent 993
variance structure. AICc is the small-sample bias-corrected form of Akaike’s information 994
criterion, ∆AICc is the Akaike difference. Models with ∆AICc < 2 (in bold) are the best fitting 995
models. Each model was compared to the null model, with significance given as p. 996
# Model AICc ∆AICc w p
O1 lm(δ18
O ~ Lat * P + ns(M, df=3) + offset(W)) 20.85 0 0.23 <0.001
O2 lm(δ18
O ~ Lat * P + ns(M, df=3)) 21.32 0.47 0.19 <0.001
O3 lm(δ18
O ~ Lat * P + ns(M, df=4) + offset(W)) 21.90 1.05 0.14 <0.001
O4 lm(δ18
O ~ Lat * P + ns(M, df=4)) 22.65 1.81 0.10 <0.001
O5 lm(δ18
O ~ Lat * P + offset(W)) 23.26 2.42 0.07 <0.001
O6 lm(δ18
O ~ Lat * P + ns(M, df=2) + offset(W)) 23.32 2.47 0.07 <0.001
O7 lm(δ18
O ~ Lat * P + ns(M, df=2)) 23.73 2.89 0.06 <0.001
O8 lm(δ18
O ~ Lat * P) 24.40 3.56 0.04 <0.001
O9 lm(δ18
O ~ Lat + P + ns(M, df=3) + offset(W)) 25.07 4.23 0.03 <0.001
O10 lm(δ18
O ~ Lat + P + ns(M, df=3)) 25.42 4.58 0.02 <0.001
O11 lm(δ18
O ~ Lat + P + ns(M, df=4) + offset(W)) 26.15 5.30 0.02 <0.001
O12 lm(δ18
O ~ Lat + P + ns(M, df=4)) 26.77 5.93 0.01 <0.001
O13 lm(δ18
O ~ Lat + P + offset(W)) 27.12 6.27 0.01 <0.001
C1 gls(δ13
C ~ Lat * P + offset(W)) 725.16 0 0.28 <0.001
C2 gls(δ13
C ~ Lat * P) 725.16 0 0.28 <0.001
C3 gls(δ13
C ~ Lat * P + ns(M, df=2) + offset(W)) 727.98 2.82 0.07 <0.001
C4 gls(δ13
C ~ Lat * P + ns(M, df=2)) 727.98 2.82 0.07 <0.001
C5 gls(δ13
C ~ Lat * P + ns(M, df=3) + offset(W)) 728.00 2.84 0.07 <0.001
C6 gls(δ13
C ~ Lat * P + ns(M, df=3)) 728.00 2.84 0.07 <0.001
C7 gls(δ13
C ~ Lat + P + offset(W)) 729.11 3.95 0.04 <0.001
C8 gls(δ13
C ~ Lat + P) 729.11 3.95 0.04 <0.001
C9 gls(δ13
C ~ Lat * P + ns(M, df=4) + offset(W)) 730.55 5.39 0.02 <0.001
C10 gls(δ13
C ~ Lat * P + ns(M, df=4)) 730.55 5.39 0.02 <0.001
997

Chapter 4: Broad-scale movement
54
998
Figure 4.3 Predicted trends in oxygen isotope ratios (δ18
O) for core and edge portions by 999
latitude and month. 1000
Plots indicate (a) the interaction of core (open circles; dashed line) and edge (closed circles; 1001
solid line) portions by latitude for the month of September, and (b) month (1-12; January to 1002
December) at latitude 19.21ºS. Lines indicate the fit of best-approximating model (O1) and 1003
95% confidence intervals (grey shading) are shown. 1004
1005
Two GLS models were unambiguously the best-approximating models for δ13
C 1006
(models C1 and C2, Table 4.1). Both models included parameters for latitude, otolith 1007
portion and the interaction between them. The simplest model (model C2) predicted an 1008
increase in δ13
C with latitude, and higher δ13
C for adult otolith portions than for 1009
juvenile otolith portions (Figure 4.4). 1010

Chapter 4: Broad-scale movement
55
1011
Figure 4.4 Predicted trends in carbon isotope ratios (δ13
C) for core and edge portions by 1012
latitude. 1013
The interaction of core (open circles; dashed line) and edge (closed circles; solid line) portions 1014
are illustrated. Lines indicate the fit of best-approximating model (C2) and 95% confidence 1015
intervals (grey shading) are shown. 1016
1017
For the analysis of life stage differences in isotope ratios within individuals, the best-1018
approximating model for dδ18
O included parameters for latitude and month (model OA, 1019
Table 4.2). There was similar support (∆AICc < 2) for a model with a higher degree 1020
natural spline on month (model OC) and model OB (Table 4.2). dδ18
O increased with 1021
latitude (Figure 4.5a) and decreased in samples collected from January to August 1022
(Figure 4.5b). Individual otoliths with dδ18
O = 0 (dashed line; Figure 4.5a, b) signify no 1023
difference in δ18
O from core to edge, dδ18
O < 0 signify δ18
O decreased from core to 1024
edge, and dδ18
> 0 signify δ18
O increased from core to edge (Figure 4.5a: data points). 1025
No difference in δ18
O was observed for fifteen individuals (10-13.3%, among latitudes). 1026
δ18
O increased with life stage for the majority of individual otoliths overall (74%), 1027
particularly for those collected from 19-22°S (71.1%). Of the individuals collected 1028
between latitudes 18-19°S, however, 43.3% decreased in δ18
O and 43.3% increased in 1029
δ18
O with life stage (Figure 4.5a: data points). 1030

Chapter 4: Broad-scale movement
56
Table 4.2 Linear regression models examine the effects of latitude (Lat), whole otolith 1031
weight (W), month (M), on the difference (d) between edge and core δ18
O values for each 1032
individual otolith. 1033
Only models with at least 1% support (Akaike weight (w) = 0.01) are shown. The effect of 1034
month was modelled as a natural spline (ns) with varying degrees of freedom. Otolith weight 1035
was modelled as an offset. AICc is the small-sample bias-corrected form of Akaike’s 1036
information criterion, ∆AICc is the Akaike difference. Models with ∆AICc < 2 (in bold) are the 1037
best fitting models. Each model was compared to the null model, with significance given as p. 1038
# Model AICc ∆AICc w p
OA lm(dδ18
O ~ Lat + ns(M, df=2)) 48.99 0 0.35 <0.001
OB lm(dδ18
O ~ Lat + ns(M, df=2) + offset(W)) 50.11 1.12 0.20 <0.001
OC lm(dδ18
O ~ Lat + ns(M, df=3)) 50.78 1.79 0.14 <0.001
OD lm(dδ18
O ~ Lat) 51.62 2.63 0.09 <0.001
OE lm(dδ18
O ~ Lat + ns(M, df=3) + offset(W)) 51.91 2.92 0.08 <0.001
OF lm(dδ18
O ~ Lat + offset(W)) 52.49 3.50 0.06 <0.001
OG lm(dδ18
O ~ Lat + ns(M, df=4)) 53.04 4.05 0.05 <0.001
OH lm(dδ18
O ~ Lat + ns(M, df=4) + offset(W)) 54.17 5.18 0.03 <0.001
CA lm(dδ13
C ~ Lat + ns(M, df=2) + offset(W)) 414.23 0 0.27 <0.001
CB lm(dδ13
C ~ Lat + ns(M, df=2)) 414.40 0.17 0.25 <0.001
CC lm(dδ13
C ~ Lat + offset(W)) 416.50 2.27 0.09 <0.001
CD lm(dδ13
C ~ Lat + ns(M, df=3) + offset(W)) 416.56 2.33 0.09 0.002
CE lm(dδ13
C ~ Lat) 416.64 2.41 0.08 <0.001
CF lm(dδ13
C ~ Lat + ns(M, df=3)) 416.73 2.50 0.08 0.002
CG lm(dδ13
C ~ Lat + ns(M, df=4) + offset(W)) 417.34 3.11 0.06 0.002
CH lm(dδ13
C ~ Lat + ns(M, df=4)) 417.46 3.23 0.05 0.002
1039

Chapter 4: Broad-scale movement
57
1040
Figure 4.5 Predicted trends in the difference in oxygen isotope ratios between edge and 1041
core portions by individual by latitude and month. 1042
Plots illustrate the relationship of the best-approximating model (OA; lines) with (a) latitude for 1043
the month of September, and (b) month (1-12; January to December) at latitude 19.21ºS. Points 1044
are dδ18
O values, grey shading indicates 95% confidence intervals and dashed line represents 1045
zero dδ18
O. 1046
1047
Two linear regression models for dδ13
C were strongly supported by the data (∆AICc < 1048
2) and included parameters for latitude and month (models CA and CB, Table 4.2). The 1049
best-approximating model (CA) predicted dδ13
C increased with latitude (Figure 4.6a), 1050
and a greater dδ13
C during the months of June to September (Figure 4.6b). As dδ13
C > 0 1051
for all individuals, δ13
C increased for all individual otoliths from core to edge, and was 1052
greater at higher latitudes. However, greater individual variation in dδ13
C was observed 1053
at higher latitudes, with lower, more consistent values of δ13
C among northern 1054
individuals compared to individuals from the south (Figure 4.6a: data points). 1055

Chapter 4: Broad-scale movement
58
1056
Figure 4.6 Predicted trends in the difference in carbon isotope ratios between edge and 1057
core portions by individual by latitude and month. 1058
Plots illustrate the relationship of the best-approximating model (CA; lines) with (a) latitude for 1059
the month of September, (b) month (1-12; January to December) at latitude 19.21ºS. Points are 1060
dδ13
C values and grey shading indicates 95% confidence intervals. 1061
1062
4.4 Discussion 1063
Results of the isotope analysis for L. miniatus otoliths provided evidence that isotope 1064
ratios of both oxygen (generally related to water temperature) and carbon (which 1065
reflects DIC, diet and metabolism) increased with latitude and life stage. Specifically, 1066
δ18
O and δ13
C increased with latitude for edge (adult) portions, were similar (δ18
O) or 1067
slightly increased (δ13
C) with latitude for core (juvenile) portions, and the difference in 1068
isotope ratios with ontogeny increased with latitude within individuals. These findings 1069
suggest the potential for broad-scale ontogenetic movement of L. miniatus through 1070
areas of different chemistry which may explain regional biological differences. Results 1071
of this chapter indicate that isotope ratios for most individuals varied with ontogeny, 1072
and the increase in isotope ratios with latitude suggests that movement over a period of 1073
years is likely for this species, potentially at a scale of 10s of kilometres. 1074

Chapter 4: Broad-scale movement
59
At the outset, it was important to determine whether isotopically different environments 1075
were present (and detectable) at the latitudes from which samples were collected. Less 1076
variation in water temperature and salinity may exist in tropical regions compared to 1077
temperate systems that can vary > 9⁰C along a salinity gradient (e.g. Edmonds and 1078
Fletcher 1997; Fairclough et al. 2013; Steer et al. 2010). However, a trend for increased 1079
δ18
O and δ13
C for otolith edge portions with latitude indicated different capture 1080
locations despite variability among samples. Variation in depth use could have 1081
potentially confounded the isotope ratios due to environmental variations in 1082
temperature, salinity and DIC. However, the overall effect of depth on δ18
O and δ13
C in 1083
L. miniatus otoliths in the coral reef environment was thought to be minimal, since δ18
O 1084
is similar down to 500 m depth due to vertical mixing (Craig and Gordon 1965). Thus, 1085
this method was sensitive enough to differentiate subtle trends in isotope ratios with 1086
latitude. 1087
1088
Oxygen isotope ratios in otolith portions revealed signatures among adults were 1089
different, but similar among juveniles with latitude. δ18
O generally increased for adult 1090
edge portions with latitude, which reflected the difference in capture location (18-22⁰S) 1091
and was consistent with higher values of δ18
O at cooler water temperatures (Kalish 1092
1991). The juvenile habitat remains unknown and can only be estimated as there is 1093
currently no information available about larval or settlement phases of L. miniatus and 1094
no juveniles (< 20 cm FL) have been observed. The δ18
O signatures in otolith cores 1095
likely incorporated the pelagic larval phase through to settlement and early juvenile 1096
phase. Thus, similarities among core portions with latitude indicated juveniles 1097
originated from a similar location, or occupied locations with similar oceanography 1098
within the first few months of life. Although temporal variation was minimised in this 1099

Chapter 4: Broad-scale movement
60
study (i.e. individuals selected from the same cohort), some influence of month of 1100
capture and otolith weight was observed. The absence of clear patterns in δ18
O with 1101
month of capture and otolith weight was likely due to variation among individuals, 1102
rather than any temporal change in the environment (e.g. seasonal water temperature). 1103
1104
Analysing the difference between the juvenile (core) and adult (edge) δ18
O within 1105
individuals provided a greater understanding of ontogenetic movement of L. miniatus 1106
between different isotopic environments. Although multiple samples across an otolith 1107
transect would provide higher-resolution information with ontogeny, the two samples 1108
per individual obtained in this study provide the first insight into using isotopes to 1109
investigate broad-scale movement for L. miniatus. As core δ18
O values were similar 1110
among latitudes, a change in δ18
O with ontogeny could indicate movement to the adult 1111
location. A small proportion of individuals from each latitude displayed no difference 1112
in δ18
O with ontogeny, implying self-recruitment by a resident proportion of the 1113
population (Grüss et al. 2011), or that these individuals inhabited environments with 1114
similar chemistry as juveniles and adults. Without simultaneous isotopic measurements 1115
from capture locations, we can only infer possible explanations for the overall pattern 1116
of increased δ18
O with latitude from the juvenile to adult stage. Yet, differences with 1117
ontogeny signify movement between water bodies, and individuals captured from 1118
southern latitudes indicated that juveniles inhabited warmer environments compared to 1119
the capture locations of adults (i.e. overall increase in δ18
O with ontogeny). This 1120
suggests adult L. miniatus from cooler waters in the southern GBR may have originated 1121
from warmer waters with potentially higher salinity in the north, or they originated 1122
from juveniles that resided in warmer shallow habitats, or nearby environments with 1123
similar chemistry. The first suggestion is consistent with larval dispersal from north to 1124

Chapter 4: Broad-scale movement
61
south, in the direction of the Eastern Australian Current (Bode et al. 2006). Latitudinal 1125
patterns in δ18
O also partly support Williams et al.’s (2010) hypothesis for migration of 1126
post-recruits away from the middle of the GBR, with southerly movement of 1127
individuals from ~20.5⁰S. It is unlikely that juveniles reside in warmer shallow habitats 1128
because no juveniles (< 20 cm FL) have been observed despite many decades of 1129
research focussed in these depths. Movement of individuals through proximate 1130
locations of distinct water chemistry would also produce different isotopic signatures 1131
with ontogeny, implying movement occurs at a smaller spatial scale. The overall 1132
pattern with latitude, however, suggests that the potential for broader-scale movement 1133
is more likely. 1134
1135
In comparison, almost half of the far north individuals (~latitude 18⁰S) showed a large 1136
decrease in δ18
O with ontogeny, signifying these individuals occupied cooler habitats as 1137
juveniles. Northern migration may be one potential explanation for this finding 1138
(Williams et al. 2010). The concept that northern GBR reefs act as sources of larvae for 1139
dispersal to southern reefs has been described for other taxa (Bode et al. 2006; Doherty 1140
2006), and was suggested for L. miniatus due to a greater proportion of spawning 1141
females occurring in waters north of 20⁰S compared to southern waters (Williams et al. 1142
2006). In contrast, the increase in δ18
O with ontogeny for almost half of the adults 1143
captured at northern latitudes implies two different strategies may be employed, but this 1144
is not entirely surprising. Not all individuals from a population conform to exactly the 1145
same movement pattern; some may be residents, while others may be more wide-1146
ranging individuals (e.g. Moran et al. 2003; Kaunda-Arara and Rose 2004a) which can 1147
be integral to population connectivity. Movement of L. miniatus to latitude 18⁰S from 1148
the north is possible since L. miniatus do occur infrequently to 16⁰S (Williams and 1149

Chapter 4: Broad-scale movement
62
Russ 1994). Adult L. miniatus are also thought to move in response to extreme weather 1150
events. Tobin et al. (2010) suggested increased catch rates in northern latitudes after 1151
cyclones (e.g. tropical cyclone Justin) was due to adults migrating to shallow reefs from 1152
deep shelf and shoal waters, with the advection of deep cold water onto the continental 1153
shelf. Alternatively, if different chemistries were exhibited by nearby habitats which 1154
would result in differences in otolith δ18
O, movement nevertheless occurs with 1155
ontogeny. The trend for lower dδ18
O observed for individuals collected later in the year 1156
(capture month), did not provide any insight into potential movement patterns. Thus, 1157
further sample collection from reefs in the northern region would provide more clarity. 1158
1159
Across all latitudes, carbon isotope ratios were greater for adult edge portions compared 1160
to juvenile core portions, which were significantly lower (and less varied) in δ13
C. 1161
Lower δ13
C in the juvenile stage reflects a different diet and a higher metabolic rate 1162
than for adults (Thorrold et al. 1997; Elsdon and Gillanders 2002; Høie et al. 2003), and 1163
is characteristic of temperate (Schwarcz et al. 1998; Weidman and Millner 2000; 1164
Ayvazian et al. 2004) and tropical fishes, including other species of the genus Lethrinus 1165
(Huxam et al. 2007). While carbon isotopes are not directly influenced by temperature, 1166
cyclic patterns in δ13
C that roughly followed patterns of δ18
O have been attributed to 1167
metabolism (Høie et al. 2004) because seasonal shifts in diet were controlled for (in 1168
contrast to Weidman and Millner 2000). This temperature-induced metabolism may 1169
explain the increased δ13
C with latitude observed for adult edge portions (and 1170
marginally for juvenile core portions). However, spatial variability was incorporated in 1171
this study, and even though a single cohort was analysed, spatial and temporal variation 1172
in DIC or differences in diet may also explain the trends in δ13
C with latitude. 1173

Chapter 4: Broad-scale movement
63
Differences in δ13
C between life stages were investigated within individuals to 1174
determine differences among latitude. If no movement through environments with 1175
different chemistries occurred with ontogeny, dδ13
C values would be similar among 1176
latitudes. Latitude, capture month and otolith weight influenced carbon isotopic 1177
signatures through ontogeny, yet results provided little information to define potential 1178
migration patterns. All individuals were enriched in δ13
C from juvenile to adult stages 1179
with less variation observed among individuals from 18-20⁰S, compared to individuals 1180
from 20-22⁰S. Greater variation in δ13
C in the south may be due to a number of causes, 1181
including the influence of temperature-induced metabolism (Høie et al. 2004), salinity 1182
(Elsdon and Gillanders 2002), occurrence of different oceanographic processes such as 1183
currents and upwelling events that affect DIC (e.g. Patterson et al. 1999; Weeks et al. 1184
2010), and/or reef geography since the continental shelf is wider in the southern GBR. 1185
Simultaneous isotopic analyses of water are required to reveal the reasons for δ13
C 1186
variation and elucidate links with movement patterns of L. miniatus. 1187
1188
To date, evidence for broad-scale movement of L. miniatus exists in the few reports of 1189
long-distance movement (B. Sawynock; L. Currey; unpublished results) and hypotheses 1190
to explain regional differences in population demographics (Williams et al. 2010). The 1191
current chapter provided evidence that different isotopic environments were inhabited 1192
by the majority of individuals through ontogeny, via the analysis of δ18
O and δ13
C in 1193
otoliths of adult individuals from different latitudes. Trends in δ18
O with latitude and 1194
life stage indicated potential for directional migration of individuals, although further 1195
research is required to identify how far individuals move between environments of 1196
differing isotopic signatures. This information demonstrates the potential for this 1197

Chapter 4: Broad-scale movement
64
technique to provide insight into movement at a scale important to the management of 1198
exploited coral reef fishes. 1199
1200

65
Sedentary or mobile? Variability in Chapter 5
space and depth use of an exploited coral reef
fish
Released L. miniatus fitted with acoustic transmitters provided informative data
on reef-scale movements
(Photo credit: M. Heupel)

Chapter 5: Reef-scale movement
66
5.1 Introduction 1201
Movement defines the distribution of species in time and space, and knowledge of 1202
movement patterns is useful for understanding population dynamics and potential 1203
effects of exploitation (Pittman and McAlpine 2001; Cadrin and Secor 2009). For 1204
exploited fish species, knowledge of whether a species is highly resident or mobile is 1205
important for stock assessments and the design of management regimes such as spatial 1206
or temporal fishery closures (e.g. Afonso et al. 2009), and effective placement of fish 1207
aggregation devices (e.g. Holland et al. 1990). Movement patterns occur at a range of 1208
scales, from small-scale habitat use (100s of m) to broad-scale movements (100s of km) 1209
and have been investigated using a variety of methods, including underwater surveys, 1210
tag-recapture, acoustic telemetry and otolith microchemistry (Kramer and Chapman 1211
1999; Chapman and Kramer 2000; Palumbi 2004; Chateau and Wantiez 2009; Claisse 1212
et al. 2011). Movement information obtained using these methods have contributed to 1213
effective population management of exploited populations (Holland et al. 1993). 1214
1215
Passive acoustic telemetry enables the movement of multiple individuals fitted with 1216
transmitters to be monitored by an array of receivers and can provide movement data to 1217
be collected over multiple spatial and temporal scales (Heupel et al. 2006). The 1218
increased use of acoustic telemetry to study reef fish movement has provided 1219
information on a number of exploited species (e.g. Zeller 1997; Appeldoorn et al. 2009; 1220
Chateau and Wantiez 2009; Meyer et al. 2010; Marshell et al. 2011). Results indicate 1221
that some species have more active lifestyles than the sedentary behaviour often 1222
expected for adult reef fishes (Sale 1991), with daily movements including transitions 1223
to different habitats for resting, spawning and foraging (e.g. Holland et al. 1993; 1224
Holland et al. 1996; Appeldoorn et al. 2009; Claydon et al. 2012; Bunt and Kingsford 1225

Chapter 5: Reef-scale movement
67
2014). Space use and trends in movement patterns, however, also vary among species 1226
and individuals (Quinn and Brodeur 1991; Chapman et al. 2012) suggesting that 1227
complex patterns exist and caution should be taken when generalising across and within 1228
species. 1229
1230
Emperors of the family Lethrinidae form an important component of tropical fisheries 1231
worldwide as commercial, recreational, subsistence and artisanal catch (Carpenter 1232
2001). Lethrinids range in size from approximately 200 mm to 800 mm in length and 1233
display a diversity of life histories (Currey et al. 2013). One of the largest emperors, the 1234
redthroat emperor Lethrinus miniatus, is the most important emperor species in the 1235
commercial fisheries of Australia, Tonga, Japan and New Caledonia, and forms a 1236
substantial component of recreational, charter and artisanal catch (e.g. Fisheries 1237
Queensland 2013). Yet due to limited recaptures in conventional tag-recapture 1238
programs (e.g. B. Sawynock unpubl data; Egli et al. 2010), little information is 1239
available on the movement of emperors, and only a few studies have utilised acoustic 1240
telemetry to examine their movement. Nanami and Yamada (2009) investigated space 1241
use of Lethrinus harak by a snorkeler following individuals with a surface-towed hand-1242
held GPS, and Meyer et al. (2010) obtained five days of acoustic telemetry data from 1243
Monotaxis grandoculis as part of a multi-species study. More recently, Taylor and 1244
Mills (2013) reported primarily small activity spaces for Lethrinus harak and Lethrinus 1245
obsoletus in Guam, suggesting small marine reserves may be effective for these 1246
species. Site fidelity and movement to nearby spawning areas has been documented for 1247
lethrinids but movements associated with depth are unknown, only occurrence at depth 1248
has been recorded (Newman and Williams 1996; Fitzpatrick et al. 2012). Since 1249
management of emperor populations requires knowledge of their movements at 1250

Chapter 5: Reef-scale movement
68
different scales, longer-term information is needed. Presence, space use and depth 1251
utilisation of individuals can provide insight in the nature of emperors as sedentary or 1252
mobile, which is an important consideration for management strategies, e.g. if small 1253
spatial closures provide less protection to mobile rather than sedentary individuals. This 1254
chapter aimed to identify whether adult L. miniatus follow a sedentary or mobile 1255
lifestyle by using acoustic telemetry and tag-recapture information. Specifically, 1256
presence, activity space horizontally along the reef edge and vertically by depth, and 1257
depth use patterns of L. miniatus were analysed at three reefs in the southern Great 1258
Barrier Reef (GBR) to better understand the patterns and scale of movement of this 1259
important exploited species. 1260
1261
5.2 Methods 1262
5.2.1 Fish sampling 1263
Adult L. miniatus were caught at Heron and One Tree Island reefs, as outlined in the 1264
general methodology (Chapter three, Figure 3.2). A total of 60 individuals fitted with 1265
transmitters in three deployments: in (1) April 2011 (n = 20); (2) February 2012 (n = 1266
20); and (3) September 2012 (n = 20). 1267
1268
5.2.2 Data analysis 1269
Data from receivers were analysed in the R environment (R Development Core Team 1270
2014). Detection range of receivers was examined through the use of six sentinel tags 1271
deployed at distances between 70 and 270 m from receivers located in different habitats 1272
(e.g. complex coral structure, sand) in the array. To account for variability in 1273
transmitter detection by time of day, hourly detections of sentinel tags over a period of 1274

Chapter 5: Reef-scale movement
69
months to years were analysed. Day was defined as 0600-1759 hr and night as 1800-1275
0559 hr for all analyses, and the number of detections for each period compared using 1276
chi-squared tests. Mean detections of sentinel tags and L. miniatus per hour were 1277
plotted, and individual fish tags were standardised to the sentinel tag detections per 1278
hour according to Payne et al. (2010). Chi-squared tests were used to examine diel 1279
variation in mean number of standardised fish detections. 1280
1281
Individual fish were considered present on a given day when more than two detections 1282
were recorded per day by a given receiver. Detection data were examined to remove 1283
any spurious data that were the result of false detections. Unlikely fish positions were 1284
identified from visual inspection of detections with time and depth (scatterplots) for 1285
each individual and considered positions to be spurious when (i) less than two 1286
detections were made per receiver on any given day, (ii) detections occurred after the 1287
programmed life of the transmitter, (iii) represented fast, erratic movements (i.e. 1288
consistent with fish consumed by predator), or (iv) detections lacked vertical movement 1289
aside from a consistent tidal signature (i.e. individual perished). Residency index was 1290
calculated as the number of days an individual was detected in the array divided by the 1291
period of detection (from deployment release date). Horizontal space use was 1292
calculated as measures of activity space (horizontal kernel utilisation distributions; 1293
hKUD: Heupel et al. 2004) using the adehabitat package in R (Calenge 2006). 1294
Individuals detected for > 5 days by two or more receivers were used in activity space 1295
analyses. Average positions (Simpfendorfer et al. 2002) were calculated for each 1296
individual at 2-hour intervals and the core use areas (50% hKUD) and extent of activity 1297
space (95% hKUD) reported. Linear regressions tested whether days detected, 1298
residency, or activity space were related to fish size (FL). Data were screened for 1299

Chapter 5: Reef-scale movement
70
normality and homogeneity of variances, and variables were log10 transformed when 1300
required. 1301
1302
Vertical activity space was estimated by vertical kernel utilisation distributions (vKUD: 1303
Heupel and Simpfendorfer 2014) for individuals that were detected for > 5 days using 1304
the ks package in R (Duong 2007). Rather than latitude and longitude, average positions 1305
(at 2-hour intervals) were calculated in two-dimensional space of mean depth and 1306
distance along the reef. Receivers located along the reef edge of Heron Island Reef 1307
were represented as a linear system in this analysis (e.g. Simpfendorfer et al. 2008; 1308
Heupel and Simpfendorfer 2014), with linear positions of receivers along the reef edge 1309
calculated as the distance from the northwest point of the Heron Island Reef in a 1310
clockwise direction. Only reef edge receivers were included since L. miniatus rarely 1311
enters the lagoon (deep access points are limited; L. Currey unpubl data) and their 1312
presence was not detected by lagoon receivers. Positions of detections were calculated 1313
by adding the distance between each of the receivers from the receiver on which a 1314
detection occurred to the northwest point (in an anti-clockwise direction around the 1315
reef) (Heupel and Simpfendorfer 2014). Core use areas (50% vKUD) and activity space 1316
extent (95% vKUD) by depth (m) and reef distance (km) were plotted for each 1317
individual. Relationships between activity space and fish size (FL) were tested using 1318
linear regressions. 1319
1320
Mixed effects models (restricted maximum likelihood estimation) were used to 1321
determine whether differences in depth use existed between month, day, hour and FL. 1322
Models were analysed using the nlme package in R (Pinheiro et al. 2013) with an 1323
information theoretic model selection process. Mean depth (m) was calculated for each 1324

Chapter 5: Reef-scale movement
71
individual, for each month (1-12), in each hour (0-23). Mean depth was treated as the 1325
response variable, and month, day, hour and FL were modelled as fixed factors. 1326
Individual was treated as a random effects term to account for the lack of temporal and 1327
spatial independence among individuals and reduce the effect of individuals with more 1328
detections. Models were compared using the Akaike Information Criterion corrected for 1329
small sample bias (AICc) to determine the best fitting model. Fifteen models were 1330
compared using a stepwise approach, from the most complex fully-saturated model to 1331
the simplest model. The best-approximating model was considered as the model with 1332
the lowest ∆AICc and the fewest terms. Each model was compared to the null model to 1333
evaluate the relative strength of fit of each model to the data. 1334
1335
5.3 Results 1336
Detection range of the receivers in the array was estimated as 270-340 m from sentinel 1337
tag detections and the known position of a non-detected recaptured individual (ID 1338
4031). Receivers demonstrated with twice the detection ability during the day (Chi-1339
square test, χ2
1 = 2164.95, p < 0.001). This diel pattern was also reflected in detections 1340
of tagged L. miniatus. Standardising fish detections to sentinel tag detections per hour 1341
controlled for any difference in receiver detection ability and the frequency of 1342
detections recorded remained significantly higher during daytime hours (Chi-square 1343
test, χ2
1 = 342.157, p < 0.001; Figure 5.1). Greatest detections occurred during 1344
crepuscular hours (Figure 5.1). 1345

Chapter 5: Reef-scale movement
72
1346
Figure 5.1 Mean number of detections per hour for L. miniatus before (solid line) and 1347
after standardising (bold solid line) to sentinel tag detections (dashed line). 1348
Hours of night are represented by grey boxes. 1349
1350
5.3.1 Presence, residency and site fidelity 1351
Tagged L. miniatus ranged in size from 323 mm to 493 mm FL and 48 of the 60 fish 1352
(80%) were detected over 1-332 days (Figure 5.2). Two individuals (ID 4026 and ID 1353
4029) displayed active movement post-release but after 6 and 7 days respectively, 1354
movements were consistent with the tidal signature, suggesting these individuals 1355
perished or shed the transmitter. Although transmitter shedding is considered unlikely 1356
in this species it cannot be ruled out as an explanation for movement cessation. 1357
Detections after this period for these individuals, and spurious detections for other 1358
individuals were removed prior to analysis. After removal of these detections, 26 fish 1359
(52%) were detected for 5 days or more (mean ± SE = 86 ± 21 days). A weak positive 1360
relationship was observed between FL and the number of (log10 transformed) days 1361
detected (Linear regression, r2 = 0.13, F1,24 = 4.74, p = 0.040). 1362

Chapter 5: Reef-scale movement
73
1363
Figure 5.2 Presence plot of L. miniatus at One Tree Island Reef (ID 4018) and Heron 1364
Island Reef (all other individuals) in the Capricorn-Bunker region per day. 1365
Each point represents days detected (with > 2 detections). 1366
1367
Residency index varied among individuals from 0.01 to 1 (mean ± SE = 0.31 ± 0.07, n 1368
= 26; Table 5.1) and was not related to FL (Linear regression, r2 = 0.04, F1,24= 1.01, P 1369
= 0.326). Over 77% of individuals were detected for less than 50% of the monitoring 1370
period, demonstrated by a residency index < 0.5 (Table 5.1). Individuals were only 1371
detected on the receivers located around the reef edge, with no detections on lagoon 1372
receivers. The number of receivers visited ranged from 1 to 6 (mean = 2.19) with half 1373
of the individuals (n = 13) detected only at one receiver over an average of 108 days, 1374

Chapter 5: Reef-scale movement
74
indicating high site fidelity. A further four individuals (15%) were detected at two 1375
receivers only. Failure to detect L. miniatus on acoustically monitored reefs nearby (i.e. 1376
Sykes and One Tree Island reefs) indicated a lack of movement between these reefs. 1377

Chapter 5: Reef-scale movement
75
Table 5.1 Details of acoustically tagged individuals. 1378
Individual (ID), fork length (FL mm), dates of release and last detection, days detected, residency index (IR) and number of receivers visited are listed. 1379
The 50% KUD and 95% KUD estimates (km2) in horizontal (hKUD) and vertical (vKUD) space were calculated for individuals where possible. Two 1380
individuals (indicated by *) appeared dead (displayed depth profiles consistent with the tidal signature) after a number of days, thus detections received 1381
after these individuals were deceased were removed from analysis. 1382
ID FL Release date Last detection Days detected IR # Receivers 50% hKUD 95% hKUD 50% vKUD 95% vKUD
4022 381 08/04/2011 13/04/2011 5 0.01 2 0.19 1.08 0.003 0.027
4024 399 08/04/2011 02/05/2011 21 0.06 4 0.32 1.27 0.004 0.036
4026 454 09/04/2011 15/04/2011 7* 1.00 1
4027 369 09/04/2011 30/01/2012 121 0.33 2 0.35 1.51 0.002 0.023
4029 323 10/04/2011 15/04/2011 6* 1.00 1
4032 486 13/04/2011 29/03/2012 57 0.16 1
4034 412 13/04/2011 02/05/2011 13 0.04 3 0.23 2.09 0.002 0.017
6702 436 08/02/2012 14/07/2012 114 0.31 1
6706 474 09/02/2012 20/02/2012 8 0.02 5 0.62 3.72 0.010 0.025
6707 493 09/02/2012 24/01/2013 264 0.72 3 0.18 0.85 0.001 0.013
6710 450 09/02/2012 26/01/2013 20 0.06 4 0.40 - 0.006 0.033
6712 390 10/02/2012 13/02/2013 318 0.87 1
6713 480 10/02/2012 25/01/2013 323 0.89 2 0.17 0.77 0.001 0.007
6714 455 11/02/2012 14/01/2013 332 0.92 1
6721 440 11/02/2012 19/03/2012 37 0.10 4 0.54 2.72 0.006 0.038
7030 415 13/09/2012 12/04/2013 7 0.02 2 0.23 1.35 0.001 0.007
7036 395 14/09/2012 06/07/2013 125 0.34 1
7037 449 14/09/2012 04/07/2013 71 0.20 1
7038 405 14/09/2012 18/01/2013 80 0.22 1
7039 419 14/09/2012 06/07/2013 34 0.09 1
7040 469 14/09/2012 25/01/2013 126 0.35 1
7041 461 15/09/2012 26/01/2013 124 0.34 1
7045 372 15/09/2012 21/09/2012 6 0.02 3 0.30 1.90 0.004 0.019
7046 410 16/09/2012 25/09/2012 9 0.03 4 0.64 2.94 0.004 0.013
7047 391 16/09/2012 13/10/2012 11 0.03 6 0.52 2.99 0.008 0.039
7048 427 16/09/2012 30/09/2012 8 0.02 1

Chapter 5: Reef-scale movement
76
5.3.2 Horizontal activity space and recaptures 1383
Activity space use was calculated for 13 individuals that were detected by two or more 1384
receivers. Both the core use (50% hKUD) and extent of activity space (95% hKUD) 1385
among individuals were small in area, with mean ± SE values of 0.36 ± 0.04 km2 (50% 1386
hKUD) and 1.93 ± 0.27 km2 (95% hKUD; Table 5.1). The maximum amount of 1387
horizontal space used was < 4 km2
(Table 5.1). No relationship was observed between 1388
FL and 50% hKUD (log10 transformed) (Polynomial regression: r2 = 0.16, F2,9 = 0.84, p 1389
= 0.464), or between FL and 95% hKUD (Polynomial regression: r2 = 0.03, F1,10 = 1390
0.35, p = 0.569). 1391
1392
Two individuals were recaptured during the study and provided contrasting results. One 1393
individual (ID 4031) was caught approximately 84 m from the tagging release site after 1394
132 days at liberty but was not detected within the receiver array (approximately 340 m 1395
from nearest receiver). Transmitter malfunction is a possible explanation for non-1396
detection, yet it is also possible that this individual utilised an activity space between 1397
receiver detection ranges resulting in lack of detection. This behaviour would be 1398
consistent with the 17 individuals that showed restricted (e.g., presence at a single 1399
receiver) horizontal movement. The second (and largest overall) individual (ID 6707) 1400
was recaptured by a fisher on Abraham Reef, approximately 160 km (linear distance) 1401
from the release site (Figure 5.3). This individual was at liberty for 495 days and had 1402
moved across the sandy Capricorn Channel (80-120 m in depth). Prior to departure, this 1403
individual was detected on the north side of Heron Island Reef for 264 days (out of 350 1404
days) between three receivers (21, NW, 20) and displayed high residency (Figure 5.3a). 1405
On the last day of detection (25/01/2013), this individual was detected at receiver 21, 1406
then 2h 27 min later to the east at receiver NE (detected for 5 min), and finally 37 mins 1407

Chapter 5: Reef-scale movement
77
later at receiver 22, where it was only detected for 7 min before detections ceased 1408
(Figure 5.3a). Recapture at Abraham Reef (Figure 5.3b) occurred 145 days after 1409
departure. Thus, evidence for both long-distance and limited movement was gained 1410
from recapture data. 1411
1412
Figure 5.3 Movement of individual ID 6707 at Heron Island Reef. 1413
Maps illustrate (a) release point (X), movement over 11 months (solid arrows) between 1414
receivers (triangles; 20, NW, 21) and movement over the last day of detections (dashed arrows 1415
between receivers 21, NE and 22). Long-distance movement of approximately 160 km is 1416
illustrated (b), from Heron Island Reef of the Capricorn-Bunker reefs to the recapture location 1417
at Abrahams Reef of the Swain reefs. 1418
1419
5.3.3 Vertical activity space and depth utilisation 1420
Patterns in vertical activity space (vKUD) were estimated from depth use (m) and linear 1421
movement among receivers (km) for the same 13 individuals assessed for horizontal 1422
activity space (Table 5.1). Individuals used small areas and were detected from 0-30 m 1423
in depth, since bathymetry within detection range of receivers was < 30 m. Despite 1424
location (northwest or southwest Heron Island Reef), vertical core use area (50% 1425
vKUD) varied among individuals, with 23% of individuals using shallow areas (≤ 10 1426
m), 23% > 10 m, and 54% utilising a range of depths (e.g. Figure 5.4a, b). Vertical 1427

Chapter 5: Reef-scale movement
78
activity space extent (95% vKUD) ranged between the surface and approximately 20 m 1428
with areas overlapping for some individuals but not for others (e.g. Figure 5.4a, b). No 1429
clear patterns in depth use were present, as mean depth use varied among individuals 1430
(Figure 5.5). Some individuals displayed relatively consistent depth use with month and 1431
time of day, while others were more variable. Individual ID 4027 displayed an 1432
interesting pattern in depth use by month, moving from shallow to deeper habitat use 1433
between May and October (Figure 5.6). No relationship was observed between FL and 1434
50% vKUD (Linear regression: r2 < 0.01, F1,10 < 0.01, p = 0.980; or polynomial: r
2 = 1435
0.03, F2,9 = 0.15, p = 0.861), or between FL and 95% vKUD (Linear regression: r2 = 1436
0.11, F1,10 = 1.28, p = 0.284; or polynomial: r2 = 0.14, F2,9 = 0.73, p = 0.508). 1437

Chapter 5: Reef-scale movement
79
1438
Figure 5.4 Depth and space utilisation of L. miniatus at northwest (a) and southwest (b) 1439
Heron Island Reef. 1440
Activity space estimates of 50% KUD (solid colour) and 95% KUD (lines) are indicated for 1441
three individuals at each location, a: ID 7045, ID 6710 and ID 6707 (dotted, solid, and dashed 1442
lines respectively); b: ID 6721, ID 4027 and ID 4022 (solid, dashed, and dotted lines 1443
respectively) with reef distance (m) from the northwest point of Heron Island Reef. Location 1444
and depth of receivers are indicated by triangles. 1445

Chapter 5: Reef-scale movement
80
1446
Figure 5.5 Mean depth (m) use of individuals by fork length (mm). 1447
Boxes represent the 25th to 75
th percentiles, the median is represented by lines, and whiskers 1448
indicate 10th and 90
th percentiles. 1449
1450
1451
Figure 5.6 Vertical KUDs of individual 4027 by month (April to October), representing 1452
depth use (m) by reef distance (m). 1453
Core use area (50% vKUDs) are indicated by solid colour within the extent of activity space 1454
(95% vKUDs) represented by circles. Triangles denote location and depth of acoustic receivers. 1455

Chapter 5: Reef-scale movement
81
Mean depth utilisation was best described by one model that included month as the 1456
only parameter (Table 5.2). This model (M1) predicted shallower mean depths were 1457
used in February compared with other months. Although the effect of month appeared 1458
minimal, this model provided a significantly better fit to the data than the null model () 1459
and ∆AICc values were > 2 for all other models. 1460
1461
Table 5.2 Mixed effects models examining the effects of month, hour and fork length (FL) 1462
on mean depth. 1463
The effect of month was modelled as a natural spline (ns) with varying degrees of freedom. FL 1464
was modelled as an offset and all models included a random effect for individual fish. AICc is 1465
the small-sample bias-corrected form of Akaike’s information criterion, ∆AICc is the Akaike 1466
difference, and w is the Akaike weight. Models with ∆AICc < 2 (in bold) are the best fitting 1467
models, and p values indicate level of significance of each model when compared to the null 1468
model. 1469
# Model AICc ∆AICc w p
M1 lme(Depth ~ Month) 81339.61 0 0.97 < 0.001
M2 lme(Depth ~ Month + FL) 81347.29 7.68 0.02 < 0.001
M3 lme(Depth ~ Month + Hour) 81349.38 9.77 0.01 < 0.001
M4 lme(Depth ~ Month + Hour + FL) 81357.05 17.44 < 0.01 < 0.001
M5 lme(Depth ~ Month + Day + FL) 81360.75 21.14 < 0.01 < 0.001
M6 lme(Depth ~ Month + Day + Hour) 81362.86 23.25 < 0.01 < 0.001
M7 lme(Depth ~ Month + Day + Hour + FL) 81370.54 30.93 < 0.01 < 0.001
Null lme(Depth ~ 1) 81509.36 169.75 < 0.01 -
M8 lme(Depth ~ FL) 81516.91 177.30 < 0.01 0.409
M9 lme(Depth ~ Hour) 81519.67 180.06 < 0.01 0.109
M10 lme(Depth ~ Day) 81522.08 182.47 < 0.01 0.315
M11 lme(Depth ~ Hour + FL) 81527.22 187.61 < 0.01 0.197
M12 lme(Depth ~ Day + FL) 81529.63 190.02 < 0.01 0.429
M13 lme(Depth ~ Day + Hour) 81532.42 192.81 < 0.01 0.170
M14 lme(Depth ~ Day + Hour + FL) 81539.97 200.36 < 0.01 0.238
1470
5.4 Discussion 1471
Lethrinids have been portrayed as both sedentary as adults with small home ranges 1472
(Sale 1991; Taylor and Mills 2013) and as mobile predators (Jones 1991; Carpenter 1473
2001) that potentially migrate long distances (Williams et al. 2010; Chapter four), 1474
although limited empirical evidence has been collected to date. Results from this 1475

Chapter 5: Reef-scale movement
82
chapter indicate that individual L. miniatus display variability in presence, residence 1476
and depth utilisation, with an absence of consistent trends based on time (month, day 1477
and time of day) or size of individuals. Intra-specific variability in movement is 1478
common among reef fish (e.g. Kalish 1991; Kaunda-Arara and Rose 2004a, b; Marshell 1479
et al. 2011; O'Toole et al. 2011), with a common pattern involving a proportion of the 1480
population that remains resident while the other proportion moves greater distances 1481
(Grüss et al. 2011; Chapman et al. 2012). This study revealed that the majority of 1482
individuals were detected in a small area (< 4 km2) for periods of up to 12 months. 1483
Despite limited horizontal movement, individuals often utilised the entire water column 1484
(to 30 m in depth). From what movement data exists for lethrinid fishes, the majority of 1485
individuals appear to display variable depth use and high site fidelity, with more 1486
extensive movement by a small contingent of the population. 1487
1488
Within-population dispersal variability may be more widespread among fishes than 1489
originally thought. Residents are individuals that do not make migratory movements, 1490
while migratory individuals disperse more broadly (Chapman et al. 2012). Based on 1491
telemetry data in this chapter, horizontal movement of L. miniatus can be categorised 1492
into movements at small (< 1 km) and medium (few km) scales for residents and at a 1493
larger-scale (10s to 100s km) for migrants. 1494
1495
Small-scale movements along the reef edge were observed for half (13) of the L. 1496
miniatus individuals tracked, which visited a single receiver located adjacent to their 1497
capture and release location over periods of up to 12 months. Although mainly detected 1498
during the day, this result is consistent with other studies where lethrinids have been 1499
located in the same area months after release by acoustic monitoring (Taylor and Mills 1500

Chapter 5: Reef-scale movement
83
2013), underwater surveys (Nanami and Yamada 2009) and recapture data (Kaunda-1501
Arara and Rose 2004a). High site fidelity was displayed by individuals that inhabited 1502
the reef edge at distances of 270-340 m either side of a receiver. Similar mean 1503
minimum activity space size has been reported for other species such as 547 m for 1504
Kyphosus sectatrix (Eristhee and Oxenford 2001) and 223 m for Plectropomus 1505
leopardus (Zeller 1997). Although some L. miniatus were observed to be highly 1506
resident (residency index > 0.7), many individuals had a low residency index (< 0.3). 1507
Spending less than half of their time within the detection range of a receiver, 1508
individuals with a low residency index may have been undetected due to structural 1509
habitat complexity (sites were characterised by dense coral cover or bommies on sand, 1510
e.g. Claisse et al. 2011), residence adjacent to a detection area (and thus not detected), 1511
or moved to areas outside the detection range. Considering the estimated detection 1512
range, individuals further than 270-340 m from a receiver would not be detected. 1513
Although ID 4031 was recaptured close to the release location after four months at 1514
liberty and could indicate site fidelity, movement patterns of other individuals outside 1515
the array detection range are unknown. Use of small areas (< 0.004 and 0.029 km2) for 1516
Lethrinus harak and (0.008 km2) for L. obsoletus have been reported (Nanami and 1517
Yamada 2009; Taylor and Mills 2013). However, individuals were not observed at 1518
night (Nanami and Yamada 2009) or left the monitored area for an average of four days 1519
during spawning season (Taylor and Mills 2013), which indicate the activity space of 1520
these species may be larger than estimated. It is also possible that L. miniatus may 1521
move away from the reef edge at night (and thus beyond detection range) to forage in 1522
nearby sandy habitats (Carpenter 2001), like the congener Lethrinus nebulosus 1523
(Chateau and Wantiez 2008). Standardised individual fish detections were significantly 1524
greater during the day than at night lending support to this hypothesis. A diel pattern of 1525
Chapter 5: Reef-scale movement
84
movement between spatially separate habitats for feeding and resting is common for 1526
many reef fishes, with many species feeding at night in sand adjacent to reef areas (e.g. 1527
Hobson 1973; Holland et al. 1993; Mazeroll and Montgomery 1998; Meyer et al. 1528
2010). Thus, results better reflect day time space use and could be an underestimate of 1529
total activity space. No inter-reef movements between the other monitored reefs were 1530
recorded. Therefore, further research involving receivers deployed away from the reef 1531
edge and enhanced coverage could investigate whether L. miniatus move to nearby 1532
habitats at night or are located close to the reef edge. 1533
1534
Medium-scale movement was exhibited by half (13) of the tagged individuals which 1535
roamed more widely along the reef to a number of receivers. Activity spaces 1536
incorporated the area adjacent to the reef (largely during the day) and 95% hKUDs for 1537
medium-scale movements extended up to 3.7 km2. These estimates are relatively small 1538
in area compared to the daily linear distances mobile predators such as Sphyraea 1539
barracuda travel (e.g. 12 km: O'Toole et al. 2011), but are similar to those for other 1540
lethrinids. Consistent movement outside coastal boundaries of Kenyan marine reserves 1541
(6.3 and 10 km2 in size) by L. mashena and L. miniatus demonstrated travel across 1542
approximately 5 km of continuous reef with the distance moved positively associated 1543
with days at liberty for L. miniatus (like the current study but to a lesser degree: 1544
Kaunda-Arara and Rose 2004a). Similarly, Kaunda-Arara and Rose (2004b) 1545
demonstrated that each of the L. miniatus (29% of the 348 tagged fish) and L. nebulosus 1546
(56% of 93 fish) recaptured inside and outside of marine reserves were within 5 km of 1547
their release site. Thus, these studies support the observations here of site fidelity and 1548
small-moderate activity space for L. miniatus. 1549

Chapter 5: Reef-scale movement
85
Variability in L. miniatus movement patterns also indicated larger-scale movements by 1550
a contingent of the population. Long-distance movements of reef fish have been 1551
recorded in a number of studies, however they are less common occurrences. It is 1552
uncertain whether the paucity of large-scale movement data is a reflection of the rarity 1553
of these occurrences or if it is simply a reflection of fishing effort. Kaunda-Arara and 1554
Rose (2004b) reported movements of 30-180 km by small numbers of three species 1555
(Siganus sutor, Plectorhinchus flavomaculatus and L. mahsena), which represented 1556
0.2% of the individuals tagged. The lethrinid travelled 148 km from the release point in 1557
63 days which fits with long-distance movements of L. miniatus recaptured here (~160 1558
km, current study) and two individuals recaptured in the same region that travelled in 1559
the same direction (180 km and 220 km: B. Sawynock, unpubl data; Williams et al. 1560
2010). Similarly, carangids detected in an acoustic array close to their release location 1561
in Hawaii showed high site fidelity, with 75.5% of individuals recaptured within 0.5 km 1562
of their release site, while one individual was located 72 km from the study site (1.2% 1563
of recaptures). Long-distance movement over longer time periods (multiple years) was 1564
hypothesised to explain the regional differences in L. miniatus population 1565
demographics (Williams et al. 2010), with net migration of individuals among regions. 1566
Further, isotopic signatures (δ18
O and δ13
C) in L. miniatus otoliths suggested potential 1567
directionality of movement with ontogeny, over a scale of 10s of kilometres (Chapter 1568
four). Although some individuals remained in a similar environment through life, 1569
differences in δ18
O and δ13
C with ontogeny indicated the majority of juvenile 1570
individuals inhabited isotopically different environments to adults (Chapter four). 1571
These long-distance movements by a contingent of the population may be important for 1572
the connectivity and replenishment of populations (Kaunda-Arara and Rose 2004b; 1573
Grüss et al. 2011), allowing the mixing of populations necessary for maintaining 1574

Chapter 5: Reef-scale movement
86
genetic diversity. This is a potential explanation for the broad-scale movement of L. 1575
miniatus that occurs across both connected and fragmented habitat. 1576
1577
Depth utilisation has typically been reported for pelagic or deep sea species through use 1578
of archival tags, sonar, catch records and acoustic telemetry (e.g. Brill et al. 1999; Brill 1579
and Lutcavage 2001; Musyl et al. 2003; Cartamil and Lowe 2004; Godo et al. 2004). 1580
However, little research has focused on reef fish movement within the water column. 1581
Studies have concentrated on estimates of reef fish abundance with depth, for example, 1582
larger Lutjanus kasmira were reported to occur on shallow reef slopes while smaller 1583
individuals inhabit deeper slopes and tongue-and-groove habitats (Friedlander et al. 1584
2002). Depth use has also been inferred from acoustically tagged individuals via the 1585
placement of receivers at different depths, e.g. the majority of Zebrasoma flavescens 1586
were found more frequently in shallow areas < 10 m depth (Claisse et al. 2011). 1587
However, directly quantifying vertical position over time allows a better understanding 1588
of depth use patterns of reef fishes at a temporal scale. 1589
1590
Depth use of L. miniatus was not related to time of day or size of fish, and was variable 1591
among individuals. Variation in individual depth use has been reported for other reef 1592
and temperate species, with repeatable movement patterns related to the time of day for 1593
some (Bellquist et al. 2008), while others displayed variation in movement among 1594
individuals (Starr et al. 2002). Although some L. miniatus displayed greater use of the 1595
water column during the night, the pattern was not consistent, and some individuals 1596
may have moved to deeper sandy areas that exist out of the detection range. Some 1597
individuals used consistent depths throughout the day, and others varied among depths 1598
with no apparent pattern. For other species such as trevally Pseudocaranx dentex, 1599

Chapter 5: Reef-scale movement
87
vertical movements of offshore-tagged individuals were more associated with currents 1600
and tides than for the smaller inshore-tagged individuals that mainly remained at depths 1601
of around 10 m (Afonso et al. 2009). Interestingly, like the overlap observed in 1602
horizontal space use for other lethrinids (Nanami and Yamada 2009; Taylor and Mills 1603
2013), L. miniatus utilised vertical and horizontal activity spaces that somewhat 1604
overlapped, further highlighting their non-territoriality (Carpenter 2001). Vertical 1605
movement of L. miniatus was highly variable among individuals and time of day 1606
suggesting no predictable patterns are present. 1607
1608
Patterns in depth use not only occur diurnally, but across a number of temporal scales. 1609
Taylor and Mills (2013) identified diel movement patterns related to tides for some 1610
lethrinid individuals, as well as in relation to lunar phase linked to spawning activity. 1611
Month was the parameter that best explained the variation in mean depth use of L. 1612
miniatus in this study. However, there was no strong trend in mean depth observed with 1613
time of year. Individual ID 4027 was the only example that provided a clear shift in 1614
depth use over a number of months (utilised shallower depths in winter). Differences in 1615
environmental factors such as water temperature which fluctuate in a predictable 1616
manner with seasons throughout the year may be related to movement of individuals. 1617
Thus environmental parameters should be investigated as potential drivers for depth use 1618
over this temporal scale through further research. 1619
1620
It is important to consider the limitations of acoustic telemetry when interpreting and 1621
estimating reef fish movement patterns from presence data. Coral reef environments 1622
can be particularly difficult to operate within because receiver performance (i.e. 1623
detection range) can be low due to structural habitat complexity and environmental 1624

Chapter 5: Reef-scale movement
88
noise (Claisse et al. 2011; Welsh et al. 2012; Cagua et al. 2013). Further, receiver 1625
detection ranges are not static as the detectability of sentinel tags fluctuates with 1626
dynamic nature of the environment. Multiple habitat types including reef crests, reef 1627
slopes, sand and semi-enclosed lagoons may also influence the ability to detect fish 1628
because signal attenuation may differ between habitats. However, each receiver in this 1629
study was placed in a position to minimise barriers to transmitter signal (structurally 1630
complex reef), with an estimated receiver detection range of 270-340 m across sand and 1631
reef habitat. This detection range was within those recently reported for coral reefs: 60 1632
and 90 m for receivers located on the reef base and reef crest respectively (using 1633
smaller, less powerful Vemco V9 transmitters: Welsh et al. 2012) and 120 m (V9) and 1634
530 m (V16) by Cagua et al. (2013) at reefs in the Red Sea. Cagua et al. (2013) also 1635
determined that topography and environmental noise held the greatest influence on 1636
detection distance compared to other environmental factors (e.g. wind, thermocline, 1637
depth). Likewise, Payne et al. (2010) illustrated how a reduction in detection frequency 1638
was caused by factors other than animal movement (e.g. increased environmental noise) 1639
and can provide opposite interpretations of animal movement patterns when corrected 1640
for. Monitoring detections of sentinel tags over time provided frequencies of detection 1641
over a specified time period. After standardising the fish data to sentinel data as 1642
suggested by Payne et al. (2010), fewer L. miniatus detections were observed at night 1643
and greater fish activity was observed during the day. Additionally, the ability to 1644
monitor sentinel detections over a long time period (e.g. months) rather than days (e.g. 1645
Welsh et al. 2012) ensured temporal fluctuations in environmental conditions were 1646
adequately incorporated in this study. 1647

Chapter 5: Reef-scale movement
89
Movement patterns and horizontal and vertical space use of L. miniatus were highly 1648
variable among individuals. Long-distance travel by at least one migratory individual, 1649
periods of non-detection and potential movement away from the reef edge at night 1650
provide potential evidence to support a more mobile lifestyle. Yet, it is uncertain how 1651
common long-distance movements are, and whether undetected individuals travelled 1652
far or remained nearby the array, so further research is required. For the majority of 1653
individuals, presence in the array over a period of up to 12 months indicated a relatively 1654
small area of reef edge space use, where some individuals appeared resident at one 1655
receiver while others moved more broadly along the reef edge. Therefore, the 1656
variability in activity space estimates for individuals for periods of up to 12 months 1657
indicate that spatial management measures that encompass individual reefs (> 4 km2) 1658
could provide protection from fishing for a substantial proportion of the adult L. 1659
miniatus population.1660
1661

90
Influence of environmental Chapter 6
parameters on movement patterns of an
exploited coral reef fish
Variations in environmental conditions (e.g. tropical cyclones) may influence the
movements of L. miniatus

Chapter 6: Environmental drivers
91
6.1 Introduction 1662
Climate change is predicted to negatively impact coral reefs through rising sea surface 1663
temperatures, ocean acidification (elevation in CO2), increased frequency and intensity 1664
of extreme storm events, and rising sea levels (IPCC 2013). Since coral reefs are highly 1665
complex and variable ecosystems, the influence of environmental changes on resident 1666
species may be further exacerbated. Reef fishes experience variation in water 1667
temperature, rainfall, atmospheric pressure and wind speed on a daily basis. Thus, a 1668
better understanding of how fishes could adapt and respond to extreme and subtle 1669
changes in climate will assist management of species for conservation and exploitation. 1670
1671
The capacity of reef fishes to cope with future changes in climate has been investigated 1672
mainly using laboratory experiments involving large differences in measureable 1673
parameters (e.g. temperature, pCO2) that influence physiology. Large increases in water 1674
temperature have been linked to reduced reproductive performance (Donelson et al. 1675
2010), decreased growth potential (Munday et al. 2008a) and increased risk behaviour 1676
in the presence of predators (Lienart et al. 2014). These impacts have been established 1677
for small, relatively sedentary species that are easy to manipulate, with only a few 1678
recent studies beginning to address the knowledge gaps that exist for larger exploited 1679
species (Pratchett et al. 2013; Johansen et al. 2014). 1680
1681
Research on larger fish species has revealed that elevation in water temperature can 1682
cause reductions in swimming speed (Johansen et al. 2014) and modification of 1683
reproductive scope (Potts et al. 2014). Extreme storm events can alter the distribution of 1684
fish populations and severely impact their associated fisheries (Tobin et al. 2010; 1685
Udyawer et al. 2013; Henderson et al. 2014). For example, increased catches of 1686

Chapter 6: Environmental drivers
92
Lethrinus miniatus and decreased catches of Plectropomus leopardus were observed in 1687
response to tropical cyclone Justin, which impacted the Great Barrier Reef (GBR) in 1688
1997 (Tobin et al. 2010). This cyclone was associated with the convection of cold water 1689
up onto the continental shelf into shallow reef areas. Reduced catch rates of P. 1690
leopardus possibly reflected a reduction in metabolism caused by a drop in water 1691
temperature to 2°C cooler than the long-term seasonal average. In contrast, L. miniatus 1692
from deeper shelf and shoal habitat were hypothesised to move into shallow reef areas 1693
with the movement of the colder water (Tobin et al. 2010). Higher catch rates of L. 1694
miniatus and Lutjanus sebae were also reported in the northern GBR (the northern 1695
extremity of L. miniatus species distribution) directly following a number of other 1696
cyclones (L. Currey, unpublished data). Although catch rates suggest movement of 1697
these species during or after extreme storm events, empirical evidence is lacking. 1698
Further research is required to identify which environmental parameters are responsible 1699
for changes in movement patterns, as well as the influence of more subtle changes on 1700
daily activity of individuals. 1701
1702
Subtle changes in the environment may also cause changes in movement patterns of 1703
reef fishes. Since dispersal and activity of reef fishes are highly variable among species 1704
and individuals (Kaunda-Arara and Rose 2004a; O'Toole et al. 2011), a greater 1705
understanding of the link between environmental parameters and movement patterns of 1706
individuals can be gained through in situ monitoring. For example, a two year study in 1707
Japan identified range shifts in the distribution of tropical and subtropical reef fishes 1708
into temperate reef and rocky habitat, via underwater visual census and temperature 1709
loggers (Nakamura et al. 2013). Richards et al. (2012) found that water temperature, 1710
depth and distance to deep water were among the factors important to the distribution 1711

Chapter 6: Environmental drivers
93
of large-bodied reef fish. Similarly, Noble et al. (2014) reported that increased wave 1712
energy on reefs had a disproportionate impact on foraging movements and energy 1713
acquisition of butterflyfishes. These insights, and the identification of important drivers 1714
in the activity and dispersal of fish allow the influence of less-extreme environmental 1715
changes on fish populations to be predicted. This is particularly important for species 1716
inhabiting environments where changes in environmental conditions will become more 1717
prevalent. 1718
1719
With the change in climate becoming an increasingly important issue, understanding 1720
the influence that environmental conditions have on distributions of exploited fish 1721
populations can benefit fisheries management. The family Lethrinidae includes a 1722
number of emperor species that constitute a large proportion of commercial, 1723
recreational, subsistence and artisanal catch in coral reef fisheries throughout the 1724
Western Pacific and Indian Oceans (Carpenter 2001). Only recently has research 1725
investigated the spatial ecology of emperors, and identified movement patterns among 1726
species and individuals that may be related to changes in environmental conditions 1727
(Taylor and Mills 2013; Pillans et al. 2014). The aim of this chapter was to broaden the 1728
understanding of movement patterns of lethrinids by identifying whether environmental 1729
parameters influence the presence of L. miniatus on reef slopes, and their vertical space 1730
use along the reef slope. Acoustic telemetry of tagged individuals paired with in situ 1731
monitoring of environmental variables provided insight into the parameters responsible 1732
for the occurrence and space use of this commercially important reef fish. 1733

Chapter 6: Environmental drivers
94
6.2 Methods 1734
6.2.1 Fish sampling 1735
Adult L. miniatus were caught at Heron and One Tree Island reefs, as outlined in the 1736
general methodology (Chapter three). The same tagged individuals (n = 60) from 1737
Chapter five were examined in this chapter. 1738
1739
Long-term monitoring of the presence and movements of individuals was enabled by 1740
the 19 VR2W® acoustic receivers (Vemco Ltd., Canada) deployed in an array on the 1741
Heron Island Reef slope adjacent to the reef crest (19 receivers, see Chapter three, 1742
Figure 3.2). Range testing was conducted via six permanent sentinel tags deployed at 1743
varying distances from receivers (70 m to 270 m) in representative substrates, and 1744
monitored during the course of the study (Chapter five). Receivers detected transmitters 1745
within 270 m and to 25 m in depth (depth of the substrate away from the reef crest). 1746
1747
6.2.2 Environmental data 1748
Environmental data for the period April 2011 to September 2013 were obtained from in 1749
situ monitoring by the Facility for Automated Intelligent Monitoring of Marine Species 1750
sensor network and Great Barrier Reef Ocean Observing System mooring 1751
(www.imos.org.au, Figure 6.1). Water temperature was measured at a mooring off the 1752
southern side of Heron Island (GBRHIS); atmospheric pressure, wind speed, wind 1753
direction and rainfall were measured from a weather station on Heron Island; and moon 1754
phase was calculated in the phenology package in R version 3.1.0 (R Development 1755
Core Team 2014). Mean daily and weekly values of each parameter were calculated, 1756
because data were recorded at intervals ranging from 5 min (e.g. temperature) to 30 min 1757

Chapter 6: Environmental drivers
95
(e.g. wind speed). Daily environmental parameters were compared to daily detectability 1758
of the sentinel tag positioned closest to a receiver (70 m distance) to ensure 1759
detectability was not linked to environmental conditions. 1760
1761
1762
Figure 6.1 Weekly environmental measurements for Heron Island Reef from April 2011 1763
to September 2013. 1764

Chapter 6: Environmental drivers
96
Environmental factors including water temperature, wind speed, rainfall (log10 1765
transformed), moon phase, and the biological parameter FL were examined as potential 1766
drivers of presence and vertical space use of L. miniatus. Atmospheric pressure and 1767
wind direction were excluded from the analyses because atmospheric pressure was 1768
highly correlated with water temperature (R2 = 0.67) and data for wind direction was 1769
unbalanced since winds typically originate from the southeast. 1770
1771
6.2.3 Data analysis 1772
Data were analysed using R to identify presence on the reef slope and vertical space use 1773
of L. miniatus at Heron Island Reef relative to environmental parameters. Individual 1774
fish were included in analyses when detected for > 5 days, and when more than two 1775
detections were recorded by a given receiver on a given day. Vertical activity space was 1776
estimated by vertical kernel utilisation distributions (vKUD) following methods in 1777
Chapter three and Heupel and Simpfendorfer (2014). In short, average hourly positions 1778
of individuals were calculated in two-dimensional space to estimate mean depth and 1779
distance along the reef. Receivers positioned along the reef slope were represented as a 1780
linear system, calculated as the distance from the northwest point of the Heron Island 1781
Reef crest in a clockwise direction. Individual fish positions were calculated as the 1782
distance (m) from the receiver on which a detection occurred to the northwest point (in 1783
an anti-clockwise direction around the reef: see Chapter five; Heupel and 1784
Simpfendorfer 2014). Weekly vertical activity areas of core use (50% vKUD) and 1785
extent (95% vKUD) were calculated by mean depth (m) and reef distance (m) for each 1786
individual. 1787

Chapter 6: Environmental drivers
97
Mixed effects models (restricted maximum likelihood estimation) were used to 1788
determine whether daily presence was influenced by environmental or biological (i.e. 1789
FL) parameters using a logistic regression approach. Models were analysed using the 1790
lme4 package in R (Bates et al. 2014) with an information theoretic model selection 1791
process and model averaging. Daily presence or absence of each individual on the reef 1792
slope (PA) was coded as a binary variable and analysed using the glmer function for 1793
data with a binomial distribution. PA was treated as the response variable, and water 1794
temperature, wind speed, rainfall, moon phase and FL were modelled as fixed factors. 1795
Individual fish were treated as a random effects term to account for the lack of temporal 1796
and spatial independence among individuals. Since the study period involved three 1797
deployments of acoustically tagged individuals, days since deployment (days) with 1798
deployment number (1-3) was also treated as a random effects term to account for 1799
temporal bias in detections with time on fish presence (Figure 6.2). All fixed effects 1800
were standardized to be comparable on the same scale by centring. First, the dredge 1801
function in the MuMIn package (Barton 2013) allowed computerized selection of the 1802
best fitting models according to the Akaike Information Criterion corrected for small 1803
sample bias (AICc). Second, the model averaging process ranked the sub-models (AICc 1804
< 10) by AICc and weighted parameters with respect to AICc weight using the zero 1805
method (Burnham and Anderson 2002; Grueber et al. 2011). Zero was substituted into 1806
models where the parameter was absent, then parameter estimates (and error) were 1807
averaged over all sub-models, which is a robust process that allows incorporation of 1808
model uncertainty (Burnham and Anderson 2002; Grueber et al. 2011). The most 1809
significant drivers of presence were determined as the factors with the greatest relative 1810
importance across the averaged sub-models. 1811

Chapter 6: Environmental drivers
98
1812
Figure 6.2 Mean proportion of acoustically tagged Lethrinus miniatus present over time. 1813
Plot illustrated the confounding effect of time since deployment on the presence and absence of 1814
tagged individuals. The three deployments and associated monitoring periods (battery life of 1815
transmitters) are represented by dashed, solid and dotted lines. 1816
1817
Effects on weekly vertical activity space were also examined using mixed effects 1818
models using the nlme package in R (Pinheiro et al. 2013) with an information theoretic 1819
model selection process. In these analyses, 50% and 95% vKUD estimates for each 1820
individual per week were log10 transformed (to normalise data) and treated as the 1821
response variables. Fixed factors, the single random effects term (individual) and model 1822
selection followed the PA analysis, calculated by week. Residual spread increased with 1823
FL, so the varExp variance structure was used in the nlme package (Pinheiro et al. 1824
2013) to weight the 95% vKUD models by FL and achieve homogeneous variances 1825
(Zuur et al. 2009). 1826
1827
6.3 Results 1828
The influence of environmental parameters on presence and vertical activity space was 1829
examined for 26 L. miniatus at Heron Island Reef, between April 2011 and September 1830
2013. All other individuals were detected for < 5 days and excluded from analyses. 1831

Chapter 6: Environmental drivers
99
Individuals ranged in size from 372-493 mm FL and were detected from 2 to 52 weeks 1832
on receivers located on the reef slope only (Table 1). Lack of detections on lagoon 1833
receivers indicates individuals were not present in this area. Daily detectability of 1834
transmitters was not influenced by environmental parameters based on detection of a 1835
sentinel tag for 212 consecutive days, during 215 days of the total monitoring period of 1836
222 days (97% detectability, 20 August 2011-28 March 2012). 1837
1838
6.3.1 Presence 1839
Sixteen sub-models (with ∆AICc < 10) were used to analyse the effects on presence of 1840
L. miniatus, from which three models strongly supported the data (∆AICc < 2, Table 1841
6.1). Temperature, rainfall and wind were present in these three sub-models, with only 1842
temperature as a parameter in the best-fitting model (M1). Model averaging results 1843
summarising relative effects of each parameter on PA indicated that water temperature 1844
was the most important and significant predictor, with increased probability of fish 1845
presence associated with lower water temperature (Table 6.2, Figure 6.3). Predictions 1846
from model M1 indicate that a 50% chance of individuals being present occurs at a 1847
daily mean water temperature of approximately 24°C (Figure 6.3). During days warmer 1848
than 24°C, individuals were less likely to be detected on the reef slope, compared to 1849
days below 24°C. Although water temperature followed a seasonal trend, presence of 1850
individuals was not limited to cooler months (June-September). All other parameters 1851
had less than a third of the importance relative to temperature, highlighting the 1852
relevance of water temperature to occurrence of L. miniatus on the reef slope (Table 1853
6.2). 1854

Chapter 6: Environmental drivers
100
Table 6.1 Top mixed effects sub-models examining the effects of water temperature 1855
(temp), rainfall (log(10)rain), wind speed (wind), moon phase (moon) and fork length (FL) 1856
on presence (PA) of Lethrinus miniatus at Heron Island Reef. 1857
All models included a random effect for individual fish and day of deployment by deployment 1858
number. AICc is the small-sample bias-corrected form of Akaike’s information criterion, ∆AICc 1859
is the Akaike difference, and w is the Akaike weight. Models with ∆AICc < 2 (in bold) were the 1860
best fitting models. 1861
Model df AICc ∆AICc w
M1 PA ~ temp 6 4791.88 0 0.32
M2 PA ~ temp + lograin 7 4793.81 1.93 0.12
M3 PA ~ temp + wind 7 4793.86 1.99 0.12
M4 PA ~ temp + FL 7 4793.88 2.00 0.12
M5 PA ~ temp + moon 9 4794.93 3.05 0.07
M6 PA ~ temp + lograin + wind 8 4795.74 3.86 0.05
M7 PA ~ temp + lograin + FL 8 4795.74 3.86 0.05
M8 PA ~ temp + wind + FL 8 4795.87 3.99 0.04
1862
Table 6.2 Model averaging results summarising effects of each parameter on Lethrinus 1863
miniatus presence at Heron Island Reef. 1864
Parameters of water temperature (temp), rainfall (log(10)rain), wind speed (wind), fork length 1865
(FL) and moon phase (moon) were standardized to allow comparison. Coefficients were 1866
calculated with shrinkage. Bold indicates significant parameters (p < 0.05). 1867
Parameter Estimate SE p Coefficients Relative
importance
(Intercept) 0 0
Temp -1.187 0.093 < 0.001 -1.187 1.00
Lograin -0.031 0.090 0.726 -0.009 0.28
Wind -0.008 0.089 0.925 -0.002 0.27
FL -0.005 1.303 0.997 -0.001 0.27
Moon (full) -0.048 0.112 0.669 -0.008 0.18
Moon (last) -0.067 0.109 0.537 0.012
Moon (new) -0.102 0.109 0.347 -0.018
1868
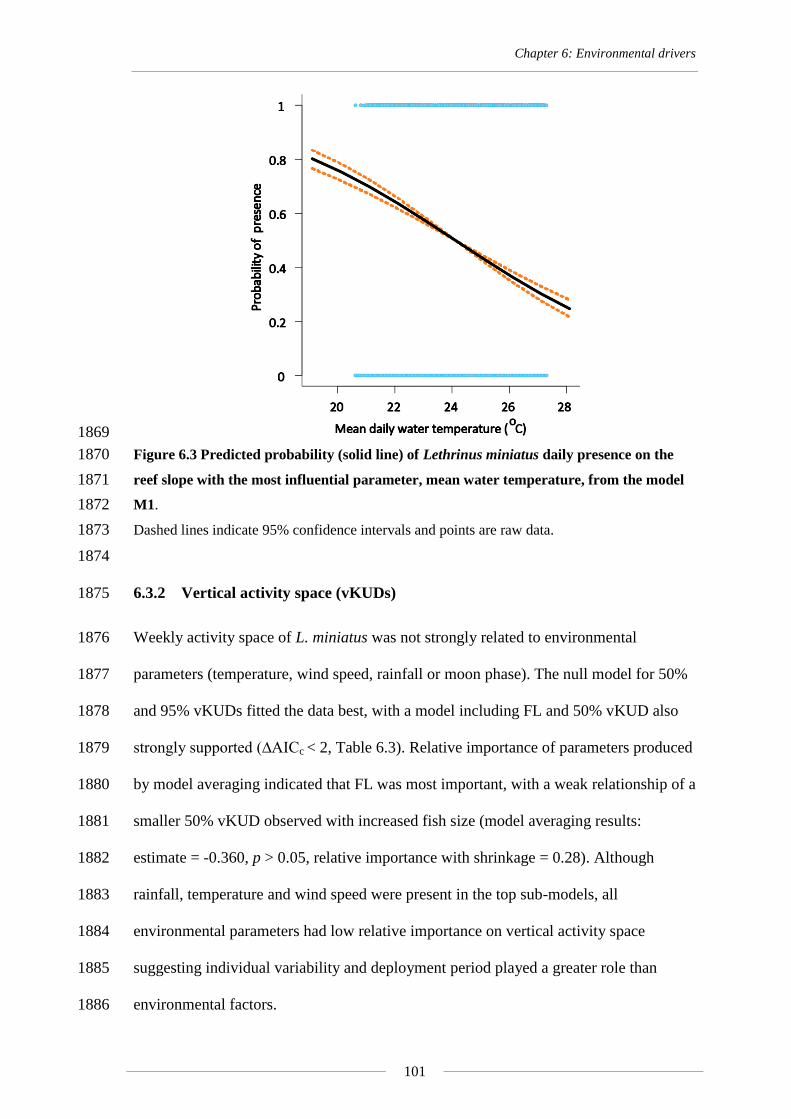
Chapter 6: Environmental drivers
101
1869
Figure 6.3 Predicted probability (solid line) of Lethrinus miniatus daily presence on the 1870
reef slope with the most influential parameter, mean water temperature, from the model 1871
M1. 1872
Dashed lines indicate 95% confidence intervals and points are raw data. 1873
1874
6.3.2 Vertical activity space (vKUDs) 1875
Weekly activity space of L. miniatus was not strongly related to environmental 1876
parameters (temperature, wind speed, rainfall or moon phase). The null model for 50% 1877
and 95% vKUDs fitted the data best, with a model including FL and 50% vKUD also 1878
strongly supported (∆AICc < 2, Table 6.3). Relative importance of parameters produced 1879
by model averaging indicated that FL was most important, with a weak relationship of a 1880
smaller 50% vKUD observed with increased fish size (model averaging results: 1881
estimate = -0.360, p > 0.05, relative importance with shrinkage = 0.28). Although 1882
rainfall, temperature and wind speed were present in the top sub-models, all 1883
environmental parameters had low relative importance on vertical activity space 1884
suggesting individual variability and deployment period played a greater role than 1885
environmental factors. 1886

Chapter 6: Environmental drivers
102
Table 6.3 Top mixed effects sub-models examining the effects of fork length (FL), moon 1887
phase (moon), rainfall (log(10) rain), wind speed (wind) and water temperature (temp) on 1888
Lethrinus miniatus vertical activity space (50% & 95% vKUDs) at Heron Island Reef. 1889
All models included a random effect for individual fish and parameters were standardized. AICc 1890
is the small-sample bias-corrected form of Akaike’s information criterion, ∆AICc is the Akaike 1891
difference, and w is the Akaike weight. Models with ∆AICc < 2 (in bold) represent the best 1892
fitting models. Models for 95% vKUD were weighted by FL using the varExp variance 1893
structure. 1894
Model df AICc ∆AICc w
MA 50%vKUD ~ 1 6 470.59 0 0.66
MB 50%vKUD ~ FL 7 472.44 1.86 0.26
MC 50%vKUD ~ lograin 7 477.38 6.79 0.02
MD 50%vKUD ~ wind 7 477.83 7.25 0.02
ME 50%vKUD ~ temp 8 477.88 7.29 0.02
MF 50%vKUD ~ FL + lograin 8 479.26 8.67 0.01
MG 50%vKUD ~ FL + wind 8 479.71 9.12 0.01
MH 50%vKUD ~ FL + temp 8 479.75 9.16 0.01
M1 95%vKUD ~ 1 4 345.78 0 0.72
M2 95%vKUD ~ FL 5 348.61 2.83 0.17
M3 95%vKUD ~ temp 5 350.73 4.95 0.06
M4 95%vKUD ~ wind 5 353.40 7.62 0.02
M5 95%vKUD ~ lograin 5 353.46 7.68 0.02
M6 95%vKUD ~ FL + temp 6 353.49 7.71 0.02
1895
1896
6.4 Discussion 1897
The results of this research provide useful information on the effect that environmental 1898
factors have on the distribution and space use of an important reef fish. Water 1899
temperature was found to be an important driver of L. miniatus presence on the reef 1900
slope, which provides insight into their movement relative to environmental conditions. 1901
Greater probability of presence on the reef slope was observed during days of lower 1902
mean water temperature. With ocean temperatures predicted to rise (Poloczanska et al. 1903
2007; IPCC 2013) it is uncertain how fish distribution and movement patterns will be 1904

Chapter 6: Environmental drivers
103
affected. Most research has focussed on potential impacts of climate change on fish 1905
metabolism, growth and reproduction (e.g. Munday et al. 2008a; Donelson et al. 2010), 1906
with few reports on environmental influences on dispersal and distribution (but see: 1907
Henderson et al. 2014). However, data here indicate increased temperature might cause 1908
L. miniatus to alter their distribution or depth use to remain in a preferred water 1909
temperature or avoid sub-optimally warm conditions. The vertical activity space of L. 1910
miniatus was not related to environmental conditions, suggesting highly variable 1911
movement patterns occur when individuals use reef slope habitats, and use of deeper 1912
areas outside receiver range could not be detected. The ability to specify the effects of 1913
environmental conditions and drivers of reef fish movement is important for predicting 1914
how fish distribution and activity space will change under future environmental 1915
scenarios. 1916
1917
Importantly, the observed correlation between water temperature and fish presence was 1918
not based on seasonal trends in water temperature. Cooler temperatures were recorded 1919
in winter during the middle of the year, while warmer temperatures occurred in 1920
summer. Neither season nor month could be incorporated as fixed factors into the 1921
models because the presence of fish from each of the three deployments was influenced 1922
by time since deployment (which is not uncommon; Pillans et al. 2014), so these factors 1923
were incorporated as random effects. Despite this bias, individuals were detected on the 1924
monitored reef slope in all months of the year, at all temperatures, regardless of season. 1925
Thus, the fact that fish were more frequently present on the reef slope during days of 1926
lower temperatures was not indicative of a seasonal trend. The lower probability of 1927
presence during days of warm temperatures was not directly related to particular 1928
months, rather, warmer days within each season through the year. Overall, this can be 1929

Chapter 6: Environmental drivers
104
interpreted as individuals were more frequently absent from the reef slope during days 1930
of elevated temperatures. 1931
1932
It is likely that individuals may have sought deeper (cooler) waters on warmer days. 1933
This is proposed since L. miniatus were: (a) not detected or sighted in the lagoon; (b) 1934
were not observed sheltering down within coral that would result in the obstruction of 1935
signal transmission for periods of 24 hours or more; and (c) are thought to utilise deeper 1936
habitats seaward from the reef slope (Chapter five). Absence from the reef slope during 1937
days of elevated temperature suggests a thermal preference may exist for this species. 1938
Temperature influences physiological processes and optimal aerobic performance of 1939
teleosts (Rummer et al. 2014), and thermal tolerance ranges have been investigated 1940
widely for temperate fishes (e.g. Pörtner 2002 ; Farrell et al. 2008; Crozier and 1941
Hutchings 2013). Inferences of thermal tolerance can be gained by inter-specific 1942
comparisons of the critical thermal maxima, which is an approximation of the 1943
maximum non-lethal temperature fishes can endure in the short-term (Elliot and Elliot 1944
1995). A preliminary study reported a critical thermal maximum of 38°C for Lethrinus 1945
reticulatus and suggested that this species had a low capacity to withstand direct 1946
exposure to elevated temperature compared to other large reef fishes (Pratchett et al. 1947
2013). Sensitivity to small increases in water temperature (e.g. Nilsson et al. 2009; 1948
Gardiner et al. 2010) and limited thermal ranges can affect spatial ecology and 1949
distribution of populations. Larger-bodied species such as P. leopardus and 1950
Paralichthys dentatus displayed reduced mobility and swimming performance at higher 1951
water temperature (Henderson et al. 2014; Johansen et al. 2014), which could 1952
consequently impact the frequency of encountering and capturing prey (Blake 2004). 1953
For L. miniatus, movement to cooler nearby habitats (absence from the monitored 1954

Chapter 6: Environmental drivers
105
array) during warmer periods may provide a physiological benefit, since this species is 1955
thought to prefer temperatures below 28°C (Williams et al. 2007a; Munday et al. 1956
2008b). In further support of the thermal preference hypothesis, the distribution of L. 1957
miniatus is fragmented distribution, separated at the equatorial zone, with populations 1958
not occurring in similar habitat at the warmest latitudes between approximately 15°N to 1959
15°S (Munday et al. 2008b). Temperature (and thus thermal optima) is clearly a major 1960
driver of the distribution and habitat use of L. miniatus. Yet, further research is required 1961
to define the thermal maxima of this species, to confirm whether L. miniatus currently 1962
experiences water temperatures close to the limit of thermal tolerance, and to evaluate 1963
how this will impact this species in a changing climate. 1964
1965
Vertical activity space of L. miniatus was not influenced by water temperature, which 1966
was likely a result of sampling design. For many other reef fishes with a latitudinal 1967
range that encompasses a broad gradient in temperature, it is likely that individuals are 1968
adapted or acclimatised to their local latitudinal region (Munday et al. 2008b). Broad 1969
distribution over a wide area and localised adaptation to a variety of temperatures may 1970
mean that some species have a greater capacity to adapt to and withstand increased 1971
water temperature associated with climate change. However, the restricted distribution 1972
of L. miniatus indicates that this species may already be excluded from warmer 1973
equatorial waters, indicating less resilience compared to others. The fact that no 1974
influence of temperature was found on vertical activity space is more likely due to 1975
constraints of the experimental design of this study. Acoustic receivers were only 1976
placed in depths of 10-20 m on the reef slope, not in the adjacent deeper waters. 1977
Therefore, vertical activity space could only be estimated when individuals were within 1978
the receiver detection range (i.e. to depths of 25 m, ~300 m from a receiver) and shifts 1979

Chapter 6: Environmental drivers
106
to depths beyond 25 m were unlikely to be recorded. This meant vKUD estimates could 1980
not account for movements into deeper water during periods of increased temperature. 1981
The analyses indicate that individuals likely optimise their position in the water column 1982
according to temperature and depth. However, they avoided increases in temperature 1983
(absence of individuals during warmer periods) by moving to deeper areas outside the 1984
receiver detection range. Timescale must also be considered when interpreting the 1985
results of activity space, as space use might vary in response to temperature at a shorter 1986
timescale (e.g. days), than at the weekly timescale used here. Since the constraints of 1987
the experimental design of this study were the likely cause for no influence of 1988
temperature on vertical activity space, future studies on L. miniatus should endeavour 1989
to provide greater spatial coverage of receivers and include deeper areas adjacent to the 1990
reef slope to test this hypothesis. 1991
1992
Although not incorporated into the model analysis, atmospheric pressure was highly 1993
correlated with water temperature and therefore could be a factor influencing the 1994
presence of L. miniatus. The opposite trend in atmospheric pressure to water 1995
temperature occurred on a weekly and monthly (seasonal) timescale, so it is uncertain 1996
whether daily absence of fish could be associated with days of lower atmospheric 1997
pressure. Declines in atmospheric pressure during extreme storm events has caused 1998
movements of sharks (Heupel et al. 2003; Udyawer et al. 2013), and was thought to be 1999
responsible for the movement of individuals away from detection range for the 2000
congener Lethrinus nebulosus (Pillans et al. 2014) and flounder P. dentatus (Henderson 2001
et al. 2014). However, no tropical cyclone was encountered during the monitoring 2002
period of this study and previous movements in response to extreme weather were 2003
assumed to be associated with water temperature (Tobin et al. 2010). Thus, further 2004

Chapter 6: Environmental drivers
107
research is required to determine how atmospheric pressure could directly influence L. 2005
miniatus and how individuals will respond to predictions of increased storm activity 2006
associated with climate change. 2007
2008
These findings suggest that in the face of climate change L. miniatus may be able to 2009
utilise their mobility to adapt to changing environmental conditions. With the elevation 2010
in sea surface temperatures and increased frequency of storms, individuals can 2011
potentially move to alternative habitats and incorporate optimal environmental 2012
parameters within their areas of activity. The density of individuals could possibly 2013
diminish along the shallow coral reef slopes as they seek cooler waters, potentially 2014
frequenting deeper shelf and shoal habitats. Previous research has reported L. miniatus 2015
in shoal habitats at depths beyond 160 m (M. Cappo pers. comm.). Yet it is uncertain 2016
whether these individuals remain at depth for long periods, or if they use these habitats 2017
and depths for specific activities such as reproduction or feeding over a short 2018
timeframe. Further information on the residency of L. miniatus at depths > 80 m would 2019
help define their distribution and potentially add to the evidence supporting their broad-2020
scale dispersal (Williams et al. 2010; Chapter four). Alternatively, individuals may 2021
adapt to increased temperatures with time, but this is considered to be more difficult for 2022
populations further from the equator (Rummer et al. 2014), such as the individuals 2023
sampled here from the southern GBR. It will be important to further investigate these 2024
hypotheses at broader spatial and temporal scales, especially if fishing effort shifts from 2025
shallow reef slopes to deeper shoal areas to target this important fishery species. 2026
2027
Water temperature was an important predictor of L. miniatus movement, suggesting 2028
elevated temperatures could reduce the occurrence of this species along shallow coral 2029

Chapter 6: Environmental drivers
108
reef slopes. While space use in deeper habitats with in situ monitoring of environmental 2030
conditions and physiological research is required to confirm the thermal tolerance of 2031
this species, this study can be built upon to identify the resilience of L. miniatus to 2032
climate change. Gaining insight into the movement ecology of coral reef fishes will 2033
allow managers to understand how species movements are influenced by extreme and 2034
subtle changes in the environment and to predict future impacts on fishery species as 2035
the climate changes. 2036
2037

109
Assessing fine-scale diel movement Chapter 7
patterns of an exploited coral reef fish
Diel movement patterns of Lethrinus miniatus may be related to nocturnal behaviour

Chapter 7: Fine-scale diel movement
110
7.1 Introduction 2038
Reef fishes move over multiple spatial and temporal scales. Understanding the 2039
movement ecology of particular species requires study on scales appropriate to the 2040
proposed ecological question (Sale 1991). Research conducted over large spatial scales 2041
(100s of km) and periods of months to years can capture information on ontogenetic 2042
movement and spawning migrations of adult populations, while studies encompassing 2043
small spatial scales (a few kilometres) and shorter time periods can effectively define 2044
activity space use of individuals. Spatial and temporal resolution of the sampling 2045
methodology varies with scale, thus, it is necessary to consider these elements in the 2046
context of intended research. 2047
2048
Home range or extent of activity space encompasses the majority of the area typically 2049
used by individuals during daily routine activities (Quinn and Brodeur 1991). Daily 2050
space use can comprise movements between different habitats used for different 2051
functions, and these can be spatially and temporally separated. Reef fishes may traverse 2052
shallow reef crests, reef slopes and adjacent sandy habitats during different times of the 2053
day, and their activity is largely regulated by the diurnal (24 h) cycle of the sun rising 2054
and setting (Hobson 1972). Use of different habitats during different times of day may 2055
help fulfil biological and ecological needs such as foraging, predator avoidance and 2056
resting (Kozakiewicz 1995). These movement patterns are typical of Haemulids, which 2057
rest during the day among coral reefs and move along consistent routes to adjacent 2058
sandy habitats at night to forage (Appeldoorn et al. 2009). Carangids also display a 2059
pattern of roaming the reef crest at night, using different foraging areas and displaying 2060
greater activity during daylight hours (Holland et al. 1996). In contrast, diurnal scarids 2061
actively forage along the reef during daylight hours and rest inside mucous cocoons in 2062

Chapter 7: Fine-scale diel movement
111
crevices within these areas at night (Dubin and Baker 1982). It appears that benefits are 2063
gained through use of different habitats at different times of the day for resting and 2064
feeding with movement between areas rich in specific resources (e.g. shelter, prey). 2065
2066
Recent tracking research on the space use of a tropical species, Lethrinus miniatus, 2067
hypothesised that lower detection frequency at night was due to movement away from 2068
the reef slope into the adjacent sandy habitat to forage (Chapter five). This hypothesis is 2069
consistent with the documented ecology of L. miniatus, as a nocturnal predator of 2070
crustaceans and echinoderms (Carpenter 2001). Chapter five’s hypothesis was based on 2071
monitoring large-scale movement of adult individuals using a line of acoustic receivers 2072
parallel to the reef crest. Movement patterns of L. miniatus are not well understood and 2073
the resulting hypothesis of movement away from the reef crest at night could not be 2074
answered with the large-scale approach applied. This raises the questions: does space 2075
use of L. miniatus differ at different times of the day across habitats, and is use of these 2076
areas consistent through time? Individuals might utilise deeper areas off the reef crest 2077
for foraging during the night, while using shallower reef habitat during the day for 2078
resting. To test Chapter five’s hypothesis, a fine-scale acoustic tracking approach that 2079
included reef crest, slope and adjacent sandy habitats was applied to the same 2080
population of L. miniatus. 2081
2082
The aim of this chapter was to determine whether diel differences in space use and 2083
distance from the reef crest were apparent in adult L. miniatus. Data were also used to 2084
identify whether the same areas and habitat types were used consistently over multiple 2085
months. Using an array of closely-positioned acoustic receivers between reef crest and 2086
adjacent sand habitats, fine-scale horizontal and vertical space use was examined 2087
Chapter 7: Fine-scale diel movement
112
during different periods of the day and among weeks to identify the amount of overlap 2088
and reuse of these areas. Fine-scale data provided insight into diel activity to better 2089
define the variation in movement patterns observed for L. miniatus. 2090
2091
7.2 Methods 2092
7.2.1 Study site and sampling 2093
An array of Vemco VR2W® acoustic receivers deployed on the northern reef slope of 2094
Heron Island Reef (23.4500° S, 151.9167° E), Capricorn-Bunker region of the GBR 2095
was utilised to monitor L. miniatus movements (Figure 7.1). The study site included 2096
reef crest habitat, complex coral cover and coral bommies with sand patches on the reef 2097
slope, descending into sandy habitat, reaching approximately 40 m in depth in the 2098
northern channel. Ten receivers were deployed 22/3/2014-23/3/2014 on star pickets 2099
embedded in the substrate in two lines parallel to the reef crest, < 200 m in distance 2100
apart. Inner receivers were positioned close to the reef crest (5-12 m in depth) and outer 2101
receivers were positioned in sand habitats (18-21 m in depth). 2102

Chapter 7: Fine-scale diel movement
113
. 2103
Figure 7.1 Location of the study site on the north of Heron Island Reef, Australia. 2104
Acoustic receivers (yellow triangles) were deployed in two lines parallel to the reef crest across 2105
a depth gradient from those closest to the reef crest (inner) to outer receivers on the deeper reef 2106
slope (a). Contour lines indicate underwater isopleths (m). The small-scale acoustic array (a) 2107
was positioned within a larger array (b) used in Chapter five, as indicated by the white box. 2108
Inset indicates location on the east coast of Australia. Map data was generated from Hedley et 2109
al. (2009, 2010). 2110
2111
Eleven adult L. miniatus were captured by line fishing on 22-23 March 2014, using the 2112
same techniques as described in Chapter three (excluding blood sampling). 2113
2114
7.2.2 Data analysis 2115
Data from receivers were analysed in the R environment version 3.1.0 (R Development 2116
Core Team 2014). Detection data were examined to identify any spurious detections, 2117
e.g. data that represented fast, erratic movements (i.e. consistent with fish consumed by 2118
predator), or lacked vertical movement aside from a consistent tidal signature (i.e. 2119
individual perished). Fish with these detection characteristics were assumed to have 2120
perished and were removed from analyses. Detections during the first 48 h were 2121
removed for all individuals to remove any effect of handling on fish behaviour. To test 2122
for variability in transmitter detection with time of day, mean detections of L. miniatus 2123

Chapter 7: Fine-scale diel movement
114
were standardised to mean detections of sentinel tags (deployed in the array during the 2124
monitoring period) per hour, according to Payne et al. (2010). Transmitters were 2125
detected when within distances of approximately 270 m from the receivers, determined 2126
by range testing at Heron Island Reef (Chapter five). 2127
2128
For individuals detected for > 5 days by two or more receivers, average positions were 2129
calculated at 10 min intervals (Simpfendorfer et al. 2002). To estimate diel individual 2130
space use, four discrete 3 h periods were selected from the data to represent dawn, day, 2131
dusk and night. The 3 h duration was selected to enable sufficient data points for space 2132
use estimation and a balanced sampling design. The hours selected for dawn (0400-2133
0659) and dusk (1700-1959) were based on timing of local sunrise, sunset and astro 2134
twilight calculated across the three months of monitoring. Since dawn and dusk 2135
behaviours typically occur over one hour of changing light (Hobson 1972), a portion of 2136
these 3 h periods would likely encompass day and night behaviours. Hours selected for 2137
day and night periods incorporated midnight and midday. Data for remaining hours 2138
were excluded as buffer periods. 2139
2140
Horizontal and vertical space use was estimated using kernel utilisation distributions 2141
(KUDs). Horizontal space use KUDs (hKUD; Heupel et al. 2004) were calculated using 2142
methods outlined in Chapter five. Vertical KUDs (vKUD) were estimated using the ks 2143
package in R (Duong 2007) in a linear two-dimensional space to determine the vertical 2144
use of the water column perpendicular to the reef crest. The perpendicular distance 2145
between each acoustic receiver to the closest point on the reef crest was calculated, and 2146
since receivers were positioned between the reef crest and the sand, average positions 2147
were represented as the mean distance to crest by mean depth (in a similar way to that 2148

Chapter 7: Fine-scale diel movement
115
outlined in Chapters five and six). Both space use estimates were calculated for core 2149
use areas (50% KUD) and extent of activity space (95% hKUD). Data were screened 2150
for normality and homogeneity of variances. 2151
2152
Mixed effects models were used to determine whether differences in horizontal and 2153
vertical KUDs existed among time periods (dawn, day, dusk and night time periods) 2154
and individual fish size (FL). KUDs were treated as the response variable, period and 2155
FL were modelled as fixed factors and models were analysed using the nlme package in 2156
R (Pinheiro et al. 2013). Individual fish was treated as a random effects term to account 2157
for the lack of temporal and spatial independence among individuals and to reduce the 2158
effect of individuals with more detections. Mixed effects models were also used to 2159
determine whether there were differences in overlap of vertical KUDs among periods. 2160
Significance was assessed at the p < 0.05 level. 2161
2162
For each period (dawn, day, dusk, night), comparisons in the size of vertical areas (50% 2163
and 95% vKUDs) through time were examined using mixed effects models. Response 2164
variables were square root transformed vKUD estimates (to satisfy assumptions of 2165
homogeneity of variance and normality), period and week were fixed factors, and 2166
individual fish ID was the random effects term. Week was fitted as a natural spline with 2167
varying degrees of freedom, with the best-fitting model compared using the Akaike 2168
Information Criterion corrected for small sample bias (AICc). 2169
2170
To ascertain whether the 50% and 95% vKUDs covered the same locations for each 2171
time period through subsequent weeks, proportional overlap of areas from week to 2172
week were calculated. Overlap was represented as the proportion of the previous 2173

Chapter 7: Fine-scale diel movement
116
week’s value, and values were arcsine transformed. Models were weighted by week 2174
using the varIdent variance structure to achieve homogeneous variances, since patterns 2175
in residual variance were found through time (Zuur et al. 2009). 2176
2177
For each period (dawn, day, dusk and night), utilisation of new areas per week was 2178
examined using cumulative weekly activity space. Cumulative 50% and 95% vKUDs 2179
for consecutive weeks were calculated with position data from that week, and added to 2180
the positions of all previous weeks in an iterative manner (Heupel and Simpfendorfer 2181
2014). The difference between the current and previous week’s vKUD as a function of 2182
the previous week’s value was calculated to identify whether individuals were using 2183
new areas with time. Models were weighted by week for 50% vKUD estimates only. 2184
2185
7.3 Results 2186
Of the eleven L. miniatus fitted with transmitters, seven were detected over 93 days of 2187
monitoring between 22 March and 22 June 2014 (Table 7.1). The majority of these 2188
individuals (five) were detected consistently across the monitoring period and provided 2189
sufficient positions for inclusion in analyses. The other four individuals were excluded 2190
from the analysis because their detection profiles suggested they had perished. 2191
Detections varied among the four time periods of dawn, day, dusk and night, with more 2192
detections of individuals during daylight hours. Standardisation of detections based on 2193
sentinel tag data indicated that absence during crepuscular (dawn and dusk) and night 2194
periods was not an artefact of transmitter detectability. 2195

Chapter 7: Fine-scale diel movement
117
Table 7.1 Details of Lethrinus miniatus monitored at Heron Island Reef from 22 March 2196
2014 to 22 June 2014. 2197
FL refers to the size of the individual (fork length), and COAs are the number of centre of 2198
activity estimates obtained during the monitoring period. 2199
Individual FL Date
released
Last detection COAs
10154 435 23/03/2014 22/06/2014 7994
10155 464 22/03/2014 22/06/2014 10056
10158 421 23/03/2014 3/05/2014 115
10162 410 23/03/2014 22/06/2014 9964
10164 388 22/03/2014 26/03/2014 171
10168 376 23/03/2014 22/06/2014 1634
10170 415 22/03/2014 22/06/2014 9471
2200
7.3.1 Horizontal space use 2201
Tagged individuals occupied horizontal space across a number of receivers, including 2202
stations located on both receiver lines (inner and outer, Figure 7.2) indicating use of 2203
reef crest, slope and sandy habitats. In general, the location of daytime hKUDs were 2204
different to hKUDs for dawn, dusk and night periods. Specifically, core use areas (50% 2205
hKUDs) were significantly larger for dawn, dusk and night periods than the core use 2206
areas during day periods (Table 7.2). Dawn, dusk and night core use areas were also 2207
more broadly spread distributed between inner and outer receivers compared to day 2208
periods (e.g. Figure 7.2). Mixed effects models illustrated an overall trend in lower 2209
mean activity space for day periods, despite variation in 50% and 95% hKUD size 2210
estimates (Figure 7.2). Fish size was not a significant factor in horizontal space use 2211
(Table 7.2). 2212

Chapter 7: Fine-scale diel movement
118
2213
Figure 7.2 Examples of activity space illustrating horizontal and vertical kernel utilisation 2214
distributions (KUD) by time period for two individuals: 10155 (a, c) and 10154 (b, d). 2215
The four time periods are indicated by colour: dawn (red), day (orange/yellow), dusk (blue) and 2216
night (black). Horizontal space use (a, b) is represented by latitude and longitude, where solid 2217
lines and orange indicate 50% hKUD, and broken lines and yellow indicate 95% hKUDs. 2218
Vertical space use (c, d) is represented as mean depth by mean distance from the reef crest, 2219
with filled colour denoting 50% vKUD and lines as 95% vKUD. Receiver positions are denoted 2220
by yellow triangles from inner receivers (located at lower latitudes in a, b; and on left in c, d) to 2221
outer receivers (highest latitudes in a, b; and on right in c, d). 2222

Chapter 7: Fine-scale diel movement
119
Table 7.2 Mixed effects model results (p values, significant values indicated in bold) for 2223
horizontal and vertical kernel utilisation distributions (KUD), comparing among time 2224
periods (dawn, day, dusk and night) and individual size (FL). 2225
All models included individual as a random effects term. 2226
50% hKUD 95% hKUD 50% vKUD 95% vKUD
Day vs Dawn 0.006 0.085 0.064 < 0.001
Day vs Dusk 0.001 0.493 0.092 < 0.001
Day vs Night 0.002 0.565 0.190 0.001
Dawn vs Dusk 0.410 0.263 0.842 0.692
Dawn vs Night 0.496 0.222 0.529 0.411
Dusk vs Night 0.882 0.910 0.665 0.232
FL 0.131 0.922 0.141 0.217
2227
Activity space extent (95% hKUDs) during dawn, dusk and night periods was not 2228
significantly greater compared to during the day (Table 7.2; Figure 7.3b). Greater 2229
variability was observed in 95% hKUD for individual 10168 (and lower 50% hKUD) 2230
which was likely due to the home range of this individual straddling the boundary of 2231
the monitored area, thus space use would have been underestimated. 2232

Chapter 7: Fine-scale diel movement
120
2233
Figure 7.3 Results from mixed effects models illustrating 50% (a) and 95% (b) horizontal 2234
kernel utilisation distribution (KUD) area and 50% (c) and 95% (d) vertical KUD area by 2235
time period (dawn, day, dusk and night). 2236
Lines indicate mean KUD, grey shading is the 95% confident intervals, and asterisks signify 2237
significant differences among periods. 2238
2239
7.3.2 Vertical space use 2240
Patterns in vertical space use were similar among individuals. Similar to hKUDs, 2241
vKUDs illustrated clear differences between periods, with day contrasting dawn, dusk 2242
and night periods. Core space use during the day was concentrated among the middle of 2243
the reef slope, compared to dawn, dusk and night core areas which were spread among 2244
all receivers (e.g. Figure 7.2). Vertical core area was not significantly different among 2245

Chapter 7: Fine-scale diel movement
121
periods (Table 7.2; Figure 7.3c). Core depth use was often shallower during the day, 2246
however, depth use overall was consistent among individuals (~ 10-15 m). In contrast, 2247
activity space extent was significantly larger during dawn, dusk and night periods than 2248
during the day (Table 7.2, Figure 7.3d), illustrating the nocturnal habits of this species. 2249
2250
Overlap in daytime vertical space use with dawn, dusk and night periods revealed 2251
significant differences for core (50% vKUD) estimates (mixed effects model, F = 2252
11.029, df = 5, p < 0.001), but not for extent of movement (95%vKUD) estimates 2253
(mixed effects model, F = 2.628, df = 5, p = 0.067). Overlap was lowest for day 2254
periods, and average core areas comprised 37% of the area used at dawn, 29% at dusk 2255
and 30% at night areas. An overlap of 72% of the core areas was observed between 2256
dawn and dusk and dawn and night, and 28% overlap of dusk and night areas. High 2257
overlap was observed across periods for movement extent (77-91%). In general, this 2258
highlights the greater spread of vertical core areas used during dawn, dusk and night 2259
periods. 2260
2261
7.3.3 Vertical activity space by period and week 2262
Weekly analysis of space use revealed that the significant differences between daytime 2263
areas of activity compared with dawn, dusk and night periods were consistent through 2264
time (Table 7.3, Figure 7.4, Figure 7.5). Statistically, 95% vKUDs were dissimilar 2265
among dusk and night periods, but overall vertical space use patterns among periods 2266
were similar for both 50% and 95% vKUDs. Extent of activity space was also 2267
significantly related to week through the monitoring period (Table 7.3, Figure 7.5c). 2268
Activity space extent was significantly influenced by week and the model predicted 2269
larger areas within the water column used around weeks 15-16 (14-27 April), 19-20 2270

Chapter 7: Fine-scale diel movement
122
(12-28 May) and week 24 (23 June; Figure 7.5c). Full moon occurred on 15 April 2271
(week 15), 15 May (week 19) and 13 June (week 23) during the monitoring period 2272
(denoted on Figure 7.4). 2273
2274
Table 7.3 Results of mixed effects models (p values, significant values indicated in bold) 2275
examining vertical activity space use (kernel utilisation distributions, KUD) of L. miniatus 2276
by period and monitoring week. 2277
Area, percentage overlap and cumulative area by week were calculated for core (50%) and 2278
extent (95%) of activity space. Week was fitted as a natural spline with varying degrees of 2279
freedom (models with df = 3 provided best fits to the data for all estimates except 95% vKUD 2280
and 95% overlap estimates, where df = 7). Transformations of vKUD are indicated as asterisks 2281
(square root transformed) and crosses (arcsine square root transformed). 2282
Activity space Percentage overlap Cumulative area
50%
vKUD*
95%
vKUD*
50%
vKUD×
95%
vKUD×
50%
vKUD
95%
vKUD
Day vs Dawn < 0.001 < 0.001 0.967 0.056 < 0.001 < 0.001 Day vs Dusk < 0.001 < 0.001 0.702 0.171 < 0.001 < 0.001 Day vs Night < 0.001 < 0.001 0.053 0.183 < 0.001 < 0.001 Dawn vs Dusk 0.953 0.079 0.733 0.586 0.770 0.564
Dawn vs Night 0.403 0.725 0.048 0.862 0.001 0.084
Dusk vs Night 0.438 0.036 < 0.001 0.711 0.002 0.248
Week 0.066 < 0.001 < 0.001 < 0.001 0.482 < 0.001
2283

Chapter 7: Fine-scale diel movement
123
2284
Figure 7.4 Mean 50% (a) and 95% (b) vertical kernel utilisation distributions (vKUD) by 2285
period and week. 2286
The four time periods are indicated by colour: dawn (red), day (orange), dusk (blue) and night 2287
(black). Filled circles represent full moon weeks. 2288

124
2289
Figure 7.5 Results from mixed effects models illustrating the significant factors that influenced 50% (a) and 95% (b and c) vertical kernel 2290
utilisation distributions (vKUD). 2291
Vertical activity space (vKUD) was square root transformed, and was significantly different among periods (a, b) and week (c). Lines indicate mean 2292
vKUD and grey shading is the 95% confidence intervals. 2293

125
Percent overlap of activity space was calculated to determine whether activity space 2294
included consistent re-use of space across weeks. Estimates of 50% and 95% vKUD 2295
were calculated for each time period (dawn, day, dusk and night) and compared among 2296
monitoring weeks. Variation was observed in the overlap of core space use among 2297
periods over time, with significant differences in overlap only observed between dusk 2298
and night periods (Table 7.3, Figure 7.6a, b). Significant differences were detected 2299
among weeks for core and extent of space use (Table 7.3, Figure 7.7a, b). Dawn and 2300
day periods followed the same trend with a peak in core space use at week 19, while 2301
overlap fluctuated among weeks for dusk and night, with night overlap ranging between 2302
50 and 90% between successive weeks (Figure 7.6a). Following week 22 (8 June), 2303
overlap decreased for all periods, signifying core activity shifted to using different areas 2304
for the final two weeks of monitoring (Figure 7.6a). An n-shaped pattern was observed 2305
for percent overlap of core areas by model results, with a peak in overlap between 2306
weeks 18-20 (28 April-25 May) decreasing thereafter (Figure 7.7a). 2307

Chapter 7: Fine-scale diel movement
126
2308
Figure 7.6 Mean percent weekly overlap in 50% (a) and 95% (b) vertical kernel 2309
utilisation distributions (vKUD) by period and week. 2310
The four time periods are indicated by colour: dawn (red), day (orange), dusk (blue) and night 2311
(black). 2312
2313
2314
Figure 7.7 Results from mixed effects models illustrating the significant factors that 2315
influenced 50% (a) and 95% (b) vertical kernel utilisation distributions (vKUD) overlap 2316
by week. 2317
Vertical activity space (vKUD) was arcsine square root transformed, lines indicate mean 2318
percent vKUD overlap and grey shading is the 95% confidence intervals. 2319
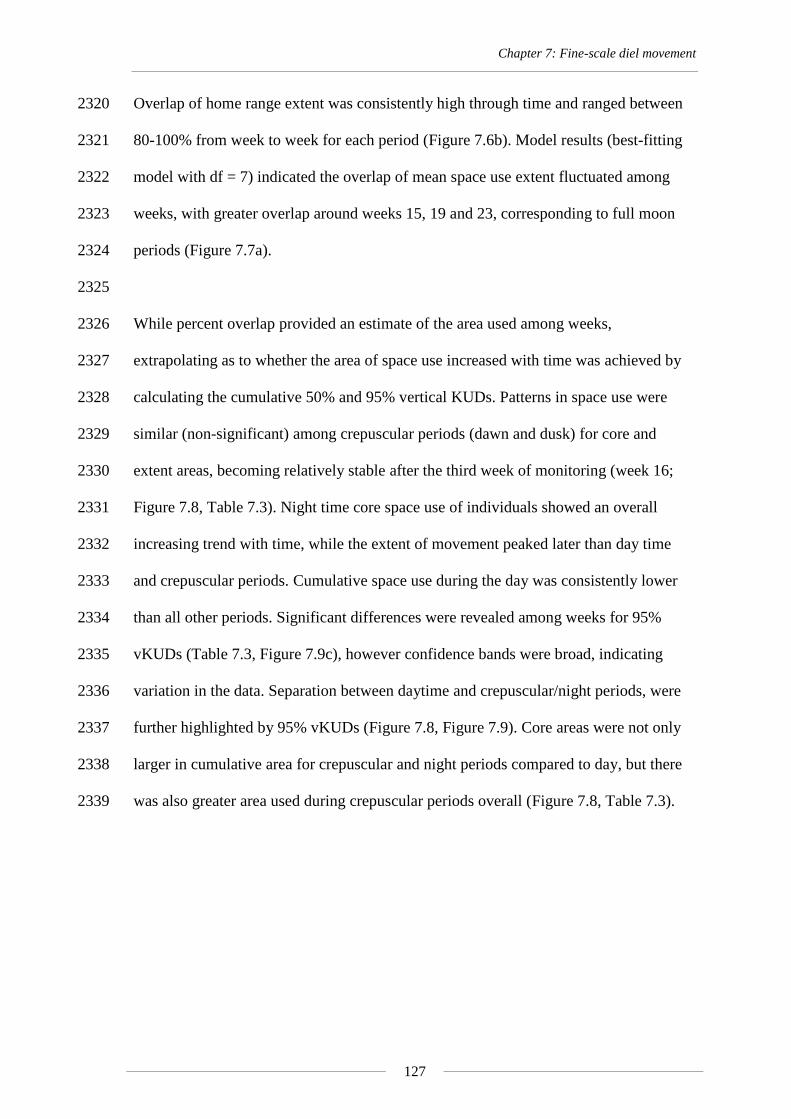
Chapter 7: Fine-scale diel movement
127
Overlap of home range extent was consistently high through time and ranged between 2320
80-100% from week to week for each period (Figure 7.6b). Model results (best-fitting 2321
model with df = 7) indicated the overlap of mean space use extent fluctuated among 2322
weeks, with greater overlap around weeks 15, 19 and 23, corresponding to full moon 2323
periods (Figure 7.7a). 2324
2325
While percent overlap provided an estimate of the area used among weeks, 2326
extrapolating as to whether the area of space use increased with time was achieved by 2327
calculating the cumulative 50% and 95% vertical KUDs. Patterns in space use were 2328
similar (non-significant) among crepuscular periods (dawn and dusk) for core and 2329
extent areas, becoming relatively stable after the third week of monitoring (week 16; 2330
Figure 7.8, Table 7.3). Night time core space use of individuals showed an overall 2331
increasing trend with time, while the extent of movement peaked later than day time 2332
and crepuscular periods. Cumulative space use during the day was consistently lower 2333
than all other periods. Significant differences were revealed among weeks for 95% 2334
vKUDs (Table 7.3, Figure 7.9c), however confidence bands were broad, indicating 2335
variation in the data. Separation between daytime and crepuscular/night periods, were 2336
further highlighted by 95% vKUDs (Figure 7.8, Figure 7.9). Core areas were not only 2337
larger in cumulative area for crepuscular and night periods compared to day, but there 2338
was also greater area used during crepuscular periods overall (Figure 7.8, Table 7.3). 2339
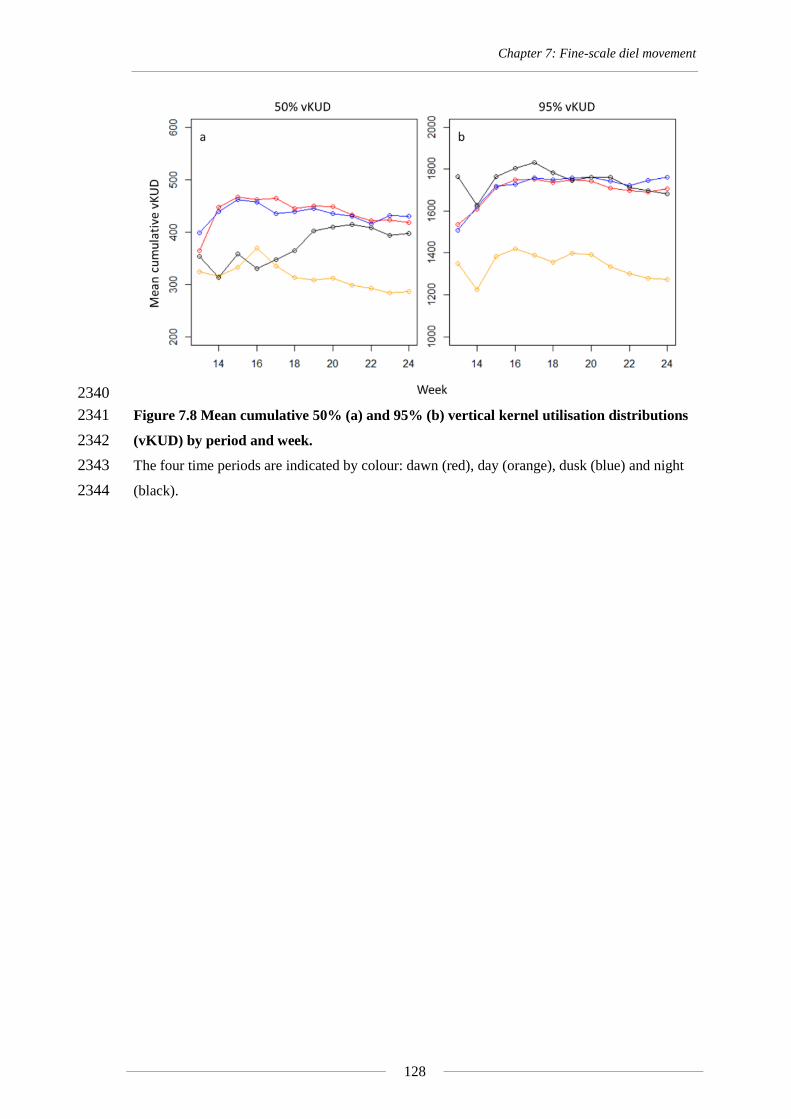
Chapter 7: Fine-scale diel movement
128
2340
Figure 7.8 Mean cumulative 50% (a) and 95% (b) vertical kernel utilisation distributions 2341
(vKUD) by period and week. 2342
The four time periods are indicated by colour: dawn (red), day (orange), dusk (blue) and night 2343
(black). 2344

Chapter 7: Fine-scale diel movement
129
2345
Figure 7.9 Results from mixed effects models illustrating the significant factors that influenced the 50% and 95% vertical kernel utilisation 2346
distribution (vKUD) cumulative area, (a, b) period, and (c) week. 2347
Lines indicate mean cumulative vKUD and grey shading is the 95% confidence intervals. 2348

130
7.4 Discussion 2349
Fine-scale telemetry data illustrated differences in space use of L. miniatus during 2350
different periods of the day. Fewer detections of this species on the reef slope at night 2351
documented in Chapter five was hypothesised to reflect dispersal away from daytime 2352
areas on the reef slope to deeper sandy areas at night. Application of an expanded fine-2353
scale telemetry array revealed that horizontal core use areas and vertical extent of 2354
activity space were significantly smaller during the day compared to dawn, dusk and 2355
night periods, with the latter likely comprising space beyond the outer sandy area 2356
detection range. When examined on a weekly basis, this diel pattern was stronger for 2357
vertical space use, corresponding with a lifestyle of nocturnal mobility and foraging 2358
behaviour (Carpenter and Allen 1989). Individual core areas varied in size, and re-use 2359
through time, while overlap differed through time. Day time extent of activity space 2360
was also smaller in area compared to other times of the day, and over time, appeared to 2361
be linked to lunar phase. Fine-scale analysis of movement patterns revealed greater 2362
detail about the habitats exploited by this species and the consistency of use through 2363
time, enhancing our understanding of the movement ecology of L. miniatus. 2364
2365
Diel patterns in activity are common for many coral reef fishes (Holland et al. 1993; 2366
Willis et al. 2006; Fox and Bellwood 2011). With most fishes being either diurnal or 2367
nocturnal, a complex sequence of events occurs on coral reefs during dusk and dawn 2368
transition periods (Hobson 1972). Patterns in daily activity influence how species 2369
persist in their environment and adapt to different niches (Hitt et al. 2011). For 2370
nocturnal species, foraging typically occurs during crepuscular and night periods while 2371
daylight hours are spent resting or patrolling (Hobson 1972, 1975). Diurnally active 2372
species typically leave night time refuges at dawn to forage, returning to rest at sunset 2373

Chapter 7: Fine-scale diel movement
131
(Mazeroll and Montgomery 1995; Howard et al. 2013). Crepuscular periods in 2374
particular can be advantageous hours for foraging, since low light levels can provide 2375
predators with an advantage (Pitcher and Turner 1986). Feeding on crustaceans, 2376
echinoderms, molluscs and small fish, L. miniatus is known as a nocturnal predator that 2377
forages in sandy habitats adjacent to coral reefs, reported to only feed opportunistically 2378
during day (Carpenter 2001). This is consistent with recent research that revealed low 2379
presence of this species on a reef slope during night hours (1800-0600 h), and a 2380
suggested shift to deeper sandy habitats at night (Chapter five). Although the dawn and 2381
dusk periods selected in this study comprised portions of day and night hours, the 2382
strong patterns observed likely relate to nocturnal habits. 2383
2384
Horizontal and vertical space use for dawn, dusk and night periods was significantly 2385
larger than day periods, indicating larger areas are used, potentially as part of their 2386
foraging strategy. Although greater mobility and a larger night time space use could be 2387
expected for L. miniatus as a nocturnal predator, movements were not restricted to 2388
sandy habitat, as proposed in Chapter five. Instead, crepuscular and night hKUDs were 2389
spread across the monitored area, encompassing reef crest, slope and sandy regions. 2390
Patrolling large areas across habitat types could provide greater foraging opportunity 2391
among patches of sand between areas of coral cover in depths of greater than 7 m. 2392
Analysis of paths of movement and tortuosity (e.g. Hitt et al. 2011) would assist in 2393
elucidating evidence of feeding activity. Interestingly, individuals displayed relatively 2394
consistent depth use within the water column between reef crest and outer sand habitat, 2395
particularly for individuals with the most data (i.e. 10155, 10162, 10170, 10154). For 2396
these benthic foragers (Walker 1978), the lack of detections near deep sandy sediment 2397
(i.e. at 20 m+) suggests this area may not have been used for foraging since individuals 2398

Chapter 7: Fine-scale diel movement
132
did not appear to be spending time near the benthos. Since this species occurs to depths 2399
>100 m (Newman and Williams 1996) and long-distance movements have been 2400
reported, the home range of these individuals likely extends further away from the reef 2401
crest than the monitored area. Thus, foraging areas may be located in deeper habitats 2402
further offshore and the observed midwater space use at the edge of the array may 2403
represent a midwater transit corridor. Shifts between daytime reef habitat for resting to 2404
sand habitat for foraging at night are common for haemulids (Ogden and Ehrlich 1977; 2405
Tulevech and Recksiek 1994; Appeldoorn et al. 2009), and like acanthurids that use 2406
landmarks, it is plausible that L. miniatus could visually follow bottom contours to 2407
deeper foraging areas nearby (Mazeroll and Montgomery 1998). However, individuals 2408
used the monitored area during all periods of the day (including night). Therefore, 2409
movements to any habitats outside the acoustic array were interspersed with substantial 2410
time spent on and close to the reef. 2411
2412
During daylight hours, monitored L. miniatus spent most time along the reef slope to 2413
crest. This space use is consistent with that reported in Chapter five. These core areas 2414
along the reef were smaller in size than for hours of twilight or darkness, which 2415
corresponds with other studies in which less movement occurred during the day than in 2416
other periods, e.g. mullids, haemulids, and lutjanids (Meyer et al. 2000; Hitt et al. 2011; 2417
Topping and Szedlmayer 2011). Daytime horizontal core areas for L. miniatus were 2418
generally located within the areas used during other periods, like that for Kyphosus 2419
sectatrix (Eristhee and Oxenford 2001). Thus, horizontal core areas used during dawn, 2420
dusk and night periods were spatially separated from areas used during the day, which 2421
was more restricted along the reef. Vertical core areas were similar and only marginally 2422
shallower during the day than in other periods, and represented 29-37% of dawn, dusk 2423

Chapter 7: Fine-scale diel movement
133
and night areas by overlap. Coral reef fishes including mullids, scarids and acanthurids 2424
often display some degree of diel spatial separation in habitat use (Meyer et al. 2000; 2425
Meyer et al. 2010; Howard et al. 2013), and a greater amount of time spent over a 2426
smaller area by L. miniatus signifies the lifestyle of this species may incorporate resting 2427
during the day. The complexity of coral structure interspersed with sand on the Heron 2428
Island reef slope could be used for opportunistic foraging, or may also assist in daytime 2429
predator avoidance for L. miniatus, as has been observed for haemulids and lutjanids in 2430
the Caribbean (Hitt et al. 2011). For activity space extent, horizontal areas were similar 2431
in size along the reef during daytime, with significantly larger vertical areas used 2432
during crepuscular and night periods. However, like Plectropomus leopardus (Zeller 2433
1997), movement within the water column substantially overlapped among periods, 2434
which may be an effect of the estimates incorporating movements across the 2435
monitoring period of > 3 months, including potential temporal variability. 2436
2437
By examining vertical space use at a weekly temporal scale, stronger trends were 2438
observed through the monitoring period. Vertical space use extent fluctuated from the 2439
start of monitoring in March and peaked during the middle to end of each month (April, 2440
May and June) until the cessation of monitoring in towards the end of June. The 2441
amount of overlap in the extent of space use among weeks also displayed this trend, 2442
while core area overlap increased from March, peaked during the beginning of May, 2443
and decreased in size thereafter. Strong seasonal trends have been observed for other 2444
reef-associated fishes such as carangids, where shifts in core areas to spawning grounds 2445
occur during June to (Afonso et al. 2009). While the proportion of mature L. miniatus 2446
females begins to increase in May within the region of the study site (Williams et al. 2447
2006), spawning occurs on the GBR between July and October, rendering this 2448

Chapter 7: Fine-scale diel movement
134
possibility as a cause for the observed pattern unlikely. High variability was evident in 2449
area and overlap among weeks, periods and individuals, which signifies that trends with 2450
time are unrelated to spawning or environmental drivers related to season. 2451
Alternatively, a strong correlation was observed between the monthly trend for 2452
increased home range extent and the weeks in which full moons occurred. Three 2453
expansions in vKUD area were demonstrated among all periods coinciding with moon 2454
illumination, and increased size of overall search areas during these phases may be 2455
necessary since higher luminosity may alter prey behaviour, making prey capture more 2456
difficult (Hobson 1973). If home ranges become larger during this moon phase linked 2457
to a need to increase search area, this would explain the high degree of overlap space 2458
use among periods. Although the relationship between lunar cycle and activity has not 2459
been investigated for reef fish, increased catch-per-unit-effort of pelagic fishes has been 2460
observed during full moon periods, indicating increased foraging activity during times 2461
of prey availability (Poisson et al. 2010; Shimose et al. 2013). The underlying 2462
relationship between activity space and moon luminosity has been observed for 2463
terrestrial carnivores (Cozzi et al. 2012) and presents a possible explanation for the 2464
temporal variation observed. Further research is required to link moon luminosity to 2465
space use and foraging behaviours in reef fishes. 2466
2467
Like the model results for space use overlap, cumulative vertical space use, or re-use of 2468
area, was variable with time. Cumulative core area was consistently high during 2469
crepuscular periods, suggesting that individuals reused the same large areas during 2470
dawn and dusk hours. Similarly, the smaller core daytime areas were revisited, and 2471
overall movement extent for all periods was relatively stable after the first few weeks of 2472
monitoring. Night areas in which individuals spent most time (core areas) appeared to 2473

Chapter 7: Fine-scale diel movement
135
increase in size through time, but it was the weekly difference in space extent which 2474
was significant, which implies increased travel to new areas and variability through 2475
time. 2476
2477
Fine-scale data revealed diel activity space use of L. miniatus which reflects a nocturnal 2478
lifestyle. Testing the hypothesis proposed in Chapter five, it appears that monitored 2479
individuals occupied smaller areas on the reef slope during the day. Rather than simply 2480
shifting to deeper adjacent sandy areas during night, larger horizontal and vertical areas 2481
were used during crepuscular and night periods. While these patterns reflect only a 2482
small proportion of the population, these trends were persistent and clear, particularly 2483
when incorporating temporal variation by examining vertical space use at a finer 2484
weekly scale. Understanding how animal behaviour and movements change temporally 2485
and spatially (among habitats) is important to understanding how species coexist within 2486
ecological niches (Kronfeld-Schor and Dayan 2003; Bosiger and McCormick 2014). 2487
Insight into diel activity potentially related to foraging, predator avoidance or 2488
intraspecific competition, can be gained through analysis at a finer-scale and enhanced 2489
resolution, which provided a better understanding of the ecology of this exploited 2490
species. 2491
2492

136
General discussion Chapter 8
This research has provided valuable insight into the movement patterns of
Lethrinus miniatus at multiple spatial and temporal scales,
which can be applied to other reef fishes
(Photo credit: M. Heupel)

Chapter 8: Discussion
137
An understanding of reef fish movement patterns is important for the conservation and 2493
management of coral reef environments. Definition of reef fish movements throughout 2494
life is required for ecological knowledge, to produce effective management strategies, 2495
and predict the influence of a changing climate on exploited species. Consideration of 2496
temporal and spatial scales enables research to effectively target specific ecological 2497
questions, such as ‘where’ and ‘when’ fish move. Investigation of movement at 2498
multiple scales enables a more complete picture of species-specific spatial ecology 2499
(Figure 8.1). This thesis used multiple techniques to reveal new information about adult 2500
movement patterns of an exploited reef fish, for which contradictory evidence was 2501
previously available. 2502
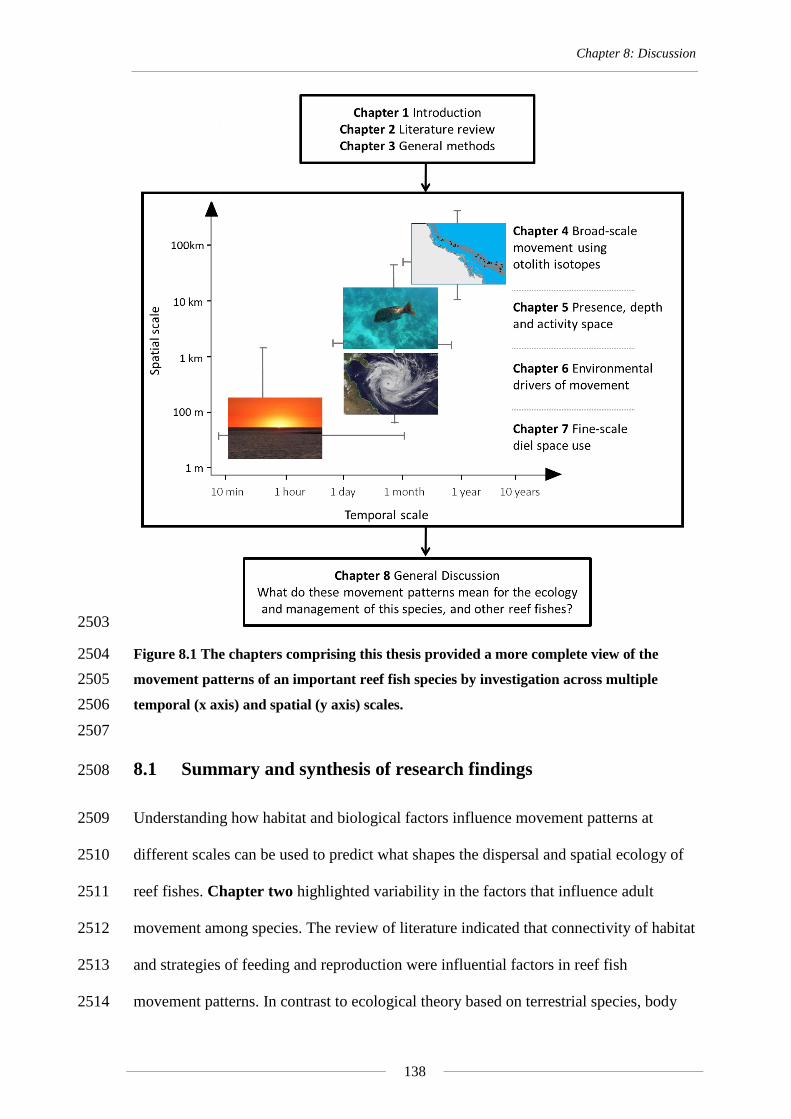
Chapter 8: Discussion
138
2503
Figure 8.1 The chapters comprising this thesis provided a more complete view of the 2504
movement patterns of an important reef fish species by investigation across multiple 2505
temporal (x axis) and spatial (y axis) scales. 2506
2507
8.1 Summary and synthesis of research findings 2508
Understanding how habitat and biological factors influence movement patterns at 2509
different scales can be used to predict what shapes the dispersal and spatial ecology of 2510
reef fishes. Chapter two highlighted variability in the factors that influence adult 2511
movement among species. The review of literature indicated that connectivity of habitat 2512
and strategies of feeding and reproduction were influential factors in reef fish 2513
movement patterns. In contrast to ecological theory based on terrestrial species, body 2514

Chapter 8: Discussion
139
size or mass was not a useful indicator for adult reef fish space use. For example, large 2515
home ranges have been observed for small species (e.g. 0.24 km2 for 188 cm FL Naso 2516
lituratus: Marshell et al. 2011) and large species can be restricted to areas < 0.005 km2
2517
(e.g. Shapiro et al. 1994). Although distance travelled was positively related to 2518
contiguous habitat, mobile feeding methods, and reproductive behaviour (e.g. spawning 2519
migrations), it is the complex combination of these factors that characterise the spatial 2520
ecology of reef fish. 2521
2522
8.1.1 Aim One - Movement patterns across multiple scales 2523
Individual variability was observed at all scales studied in this project, yet clear patterns 2524
were observed in movement and space use, which were influenced by temperature, 2525
light and lunar cycle. Long-distance movement was investigated at broad spatial and 2526
temporal scales – 100s of kilometres (4⁰ of latitude on GBR) over the lifetime of four-2527
year-old reef fish. Previous studies identified long distance movement of two L. 2528
miniatus recorded by tag-recapture (B. Sawynock unpubl. data), and broad-scale 2529
movement was hypothesised as an explanation for regional differences in demography 2530
of GBR populations (Williams et al. 2010). One individual from this study was also 2531
captured after a similar long distance movement. Otolith isotopic signatures provided a 2532
novel method to infer net movement of individuals through different isotopic 2533
environments with ontogeny (Chapter three). 2534
2535
Although precise habitats and trajectories of individuals through life could not be 2536
determined with isotope analysis, the results provided strong indications of movement 2537
of individuals with ontogeny at a broad spatial scale. This technique was validated 2538
through the confirmation that oxygen and carbon isotopic signatures for adult portions 2539

Chapter 8: Discussion
140
of otoliths differed among capture locations (at known latitudes). As juveniles, 2540
individuals inhabited environments of similar chemistries despite the adult catch 2541
location, which is intriguing since the location of juvenile habitat(s) of this species is 2542
unknown. With ontogeny, three overall results were identified. Firstly, overall isotopic 2543
signatures imply that the majority of adults from the southern GBR and almost half of 2544
northern individuals emigrated from environments characterised by warmer waters 2545
(potentially from the north). In the north of the GBR L. miniatus distribution, a 2546
significantly greater proportion of spawning females and smaller size at sex change was 2547
observed compared to the southern regions (Williams et al. 2006). Thus, many recruits 2548
likely originated as larvae from the north, and were transported south by the Eastern 2549
Australian Current. Secondly, a small fraction of adults in all latitudes appeared to have 2550
remained in a habitat with similar isotopic chemistry, highlighting the residency of a 2551
proportion of the population through life stages. Thirdly, almost half of the northern 2552
adults originated from habitats characterised by cooler waters. This suggests that a 2553
proportion of the northern adults may have emigrated to the north from a cooler, more 2554
southerly juvenile habitat with age. This is a plausible theory, since the only two studies 2555
of L. miniatus movement on the GBR reported three individuals tagged at Heron Island 2556
Reef moved north, between approximately 160-220 km in distance to an adjacent reef 2557
platform (Chapter five of this project; Williams et al. 2010; Sawynock B unpubl. data). 2558
These broad-scale movements were undertaken over periods of 16 months to 3 years, 2559
which suggests that over the lifetime of an individual, movements could be in the order 2560
of 100s km. Since these individuals were larger in size (420-493 mm FL), isotopic 2561
analysis of older (> 4 years) and larger individuals would likely show clearer evidence 2562
of migration. Long-distance movements of many reef fishes are thought to be rare 2563
(Kaunda-Arara and Rose 2004b), however the use of otolith isotope analysis in this 2564

Chapter 8: Discussion
141
chapter infers that movement through habitats of different isotopic chemistry is much 2565
more common than tag recapture reports suggest. 2566
2567
Evidence suggests ontogenetic movement across regions of the GBR. Therefore, the 2568
next question was: over shorter time periods, are adults mobile or sedentary? At a 2569
smaller spatial and temporal scale, adult movement patterns were examined in Chapter 2570
five among three reefs over periods of up to a year, to enhance our understanding of L. 2571
miniatus mobility. Overall, individuals displayed variability in movement patterns with 2572
characteristics of both mobile and sedentary lifestyles. Evidence supporting a mobile 2573
lifestyle included broad-scale movement of one individual across fragmented habitat (~ 2574
160 km across a deep channel), periods of non-detection and potential movement away 2575
from the reef edge at night. In contrast, most individuals displayed high site fidelity and 2576
moderate-sized horizontal activity spaces (~ 4 km2) over a period of up to 12 months, 2577
suggesting variability exists among individuals within the population. Repeated use of 2578
small areas of the reef slope implies that MPAs that encapsulate reef slopes of > 4 km2
2579
would provide protection to a substantial proportion of the population for periods of up 2580
to a year, particularly during the day. 2581
2582
Since L. miniatus can occur in deep habitats and non-detection during night periods was 2583
apparent, it was proposed that individuals used adjacent deep sandy habitats for 2584
foraging at night. Using an array of closely-positioned acoustic receivers within the 2585
study area, Chapter seven examined movement at a finer spatial and temporal scale, to 2586
shed light on activity patterns across hours of daylight, twilight and darkness. The array 2587
used in other telemetry chapters only allowed for detections along the reef slope, 2588
whereas this experiment was designed to observe fish movements closer to the reef 2589

Chapter 8: Discussion
142
crest, and incorporate deeper sandy habitat. Supporting research from Chapter five, 2590
fine-scale data indicated daytime core activity spaces were focused on the reef slope, 2591
compared to during dawn, dusk and night. However, core areas during night and 2592
crepuscular periods were not limited to the deeper sandy habitat, but were larger and 2593
spread among the shallow reef crest and deeper sandy areas. Thus, during twilight and 2594
dark hours, individuals were more mobile and covered greater area both horizontally 2595
and vertically. Greater movement to other habitats during these periods may explain the 2596
observed diel differences in L. miniatus abundance using baited underwater videos by 2597
Harvey et al. (2012a; 2012b; 2012c; 2013). Since daytime detections were more 2598
numerous than other periods, and vertical space use in sandy areas were not aligned 2599
with substrate depths, it is likely that activity spaces included unmonitored areas further 2600
seaward for nocturnal foraging on benthic prey (Walker 1978). These movements were 2601
consistent through time, however vertical space use (and hence overlap) was greatest 2602
during full moon periods, implying lunar effects on nocturnal activity (Poisson et al. 2603
2010; Shimose et al. 2013) and that additional search area is potentially required to find 2604
prey during these periods. This result highlights the influence environmental conditions 2605
can exert on reef fish movement. 2606
2607
8.1.2 Aim Two – Influence of environmental conditions on fish movement 2608
patterns 2609
The investigation of a suite of environmental parameters in Chapter six revealed that 2610
water temperature was correlated with presence of L. miniatus in reef slope habitats. 2611
During days of warmer water temperature, monitored individuals were less likely to be 2612
present on the reef slope, probably shifting into deeper adjacent sandy habitats with 2613
cooler water. This finding indicates important implications of climate change for this 2614

Chapter 8: Discussion
143
species, in which the population may cope with future elevations in temperature by 2615
dispersing deeper or shifting distribution further south along the eastern Australian 2616
coast. Evidence of L. miniatus at depths of > 100 m exists from line fishing and trap 2617
surveys (Newman and Williams 2001) and from baited underwater videos in Western 2618
Australia (Harvey et al. 2012b), but little is known about whether fish use these areas 2619
consistently, or during particular periods for specific purposes, punctuated with 2620
movement to other habitats. The distribution of L. miniatus does not extend into 2621
tropical waters at the equator, which signifies this species is already excluded from 2622
water temperature in that region, despite the presence of preferred habitat (Munday et 2623
al. 2008b). Little information is available on the physiological constraints of this reef 2624
fish (maximum or minimum temperatures), or the ability to tolerate a permanent 2625
increase in water temperature (Pratchett et al. 2013). On the west coast of Australia, 2626
water temperature is thought to be responsible for an observed range extension of L. 2627
miniatus. In 2011, a warming event coupled with a strong Leeuwin current (which 2628
circulates warmer waters from the north to south) generated a recruitment pulse that 2629
resulted in an influx of individuals further south of their typical distribution, to reefs 2630
near Perth (Lenanton et al. In prep; D. Fairclough unpubl. data). It is uncertain how 2631
these individuals will persist in the cooler conditions experienced from this range 2632
extension. However, reproductively active individuals were among the proportion of 2633
the population that moved south from reefs further north. The mobility of L. miniatus 2634
indicated that, compared to site-attached species, it can respond to changes in climate 2635
by moving to avoid adverse conditions. Yet it remains to be determined how important 2636
shallow reef waters are for this species, because a population shift into deep reef and 2637
sand environments may or may not meet the needs of L. miniatus for optimal fitness. 2638

Chapter 8: Discussion
144
8.1.3 Aim Three - Implications for management of reef fishes 2639
For L. miniatus, a great deal of variability in movement patterns was observed among 2640
individuals which is important for fisheries management and when considering the 2641
effects of future climate predictions. Marine protected areas (MPAs, areas where no 2642
fishing is allowed) are a popular tool for the management of reef fish for conservation 2643
and fishery resources, and much research has focused on the design and implementation 2644
of these spatial closures worldwide (Appeldoorn 1997; Roberts and Sargant 2002). The 2645
observed intra-specific variation observed in this project suggests that MPAs are 2646
unlikely to provide complete protection from fishing for all L. miniatus individuals 2647
within an MPA. Long-distance movements by a proportion of the population may assist 2648
in connectivity among spatially separate reefs, and multiple MPAs (such as those that 2649
make up the GBR Marine Park) may afford protection to these individuals. Likewise, 2650
more sedentary individuals within MPAs > 4km2 on the reef slope may be protected 2651
during daytime hours, yet there is evidence for larger home ranges into adjacent 2652
habitats during crepuscular and night periods, and it is uncertain how far individuals 2653
move during these hours. Thus the efficacy of MPAs will vary by individual and 2654
possibly even time of day. 2655
2656
Changes in climate may affect L. miniatus, particularly in the north of its distribution. 2657
Since a higher proportion of larger and older females spawn in the north, the effect of 2658
fishing on productivity is uncertain. Like in Western Australia, fisheries for L. miniatus 2659
could develop further south on the Queensland coast, or fishers may adapt their 2660
practices to fish deeper areas. While this species is caught in areas off southern 2661
Queensland, the availability of sufficient suitable habitat would be important in 2662
sustaining their growth and reproduction to support fisheries. In Queensland, L. 2663

Chapter 8: Discussion
145
miniatus is managed by minimum legal size limits, possession limits, individual 2664
transferable quotas as part of a total allowable commercial catch (TACC; 43% of the 2665
700 t annual TACC was caught in 2009-2010: Fisheries Research and Development 2666
Corporation 2012), limited commercial licences, temporal fishery closures (although 2667
not during the spawning season for this species, these still provide temporal protection 2668
from fishing), and spatial closures (MPAs). While this combination of regulations 2669
likely ensures that the size of populations of L. miniatus on the GBR remains high 2670
relative to unfished levels (Leigh et al. 2006), the management regulations do not 2671
directly provide protection from the effects of a changing climate. Warm waters can 2672
lead to faster growth rates, but the impact of physiological disturbance on fitness and 2673
productivity is unknown (Taylor et al. 1993; Munday et al. 2008b). Increasing evidence 2674
suggests that elevations in water temperature and ocean acidification may 2675
disproportionately affect larvae and juveniles, which may be more sensitive to climate 2676
change effects (Munday et al. 2008b; Pratchett et al. 2013; Feary et al. 2014; Heuer and 2677
Grosell 2014). Yet further research is needed to determine if these factors are likely to 2678
be significant for L. miniatus. Managers may need to develop additional methods to 2679
maintain sustainable populations of L. miniatus to ensure productive catches in the 2680
future. 2681

Chapter 8: Discussion
146
8.2 Future directions 2682
Based on the knowledge gained through this project, there are several areas in need of 2683
further research. Firstly, investigation of broad-scale movement for this species and 2684
others could include isotope analysis of otoliths (including larger and older individuals) 2685
collected at locations across the GBR shelf (and stratified by depth) in conjunction with 2686
analysis of water samples. This would provide a stronger comparison between 2687
environmental conditions experienced by the fish during different life stages and further 2688
strengthen the use of this technique to assess reef fish dispersal. 2689
2690
Second, results from reef-scale tracking would benefit from expansion of the acoustic 2691
array. Space use of individuals was likely underestimated, thus additional acoustic 2692
receivers deployed in the northern channel of Heron Island Reef and at reefs north of 2693
Heron Island would provide more complete estimates of L. miniatus activity space. 2694
Furthermore, an acoustic array in the southern section of the Swains reefs could better 2695
capture long-distance movement of tagged individuals from the south, with further 2696
tagging at the Swains allowing comparison of results from a different region. The 2697
Capricorn-Bunker reefs experience differences in hydrodynamics compared to other 2698
parts of the GBR due to their location in the southern section of the GBR where the 2699
continental shelf is widest (Kleypas and Burrage 1994). Patterns in reef fish movement 2700
should be replicated (Sale 1998) in other GBR locations to confirm whether current 2701
data directly translates to other parts of the GBR or elsewhere. 2702
2703
Comprehension of temperature elevation effects on L. miniatus is required, since water 2704
temperature was shown to influence distribution and habitat use. Laboratory 2705
experiments investigating the thermal tolerance of adult individuals should focus on 2706

Chapter 8: Discussion
147
examining critical thermal maxima. This measurement of the maximum non-lethal 2707
temperature that individuals can endure in the short-term (Elliot and Elliot 1995) should 2708
be estimated for individuals collected from reefs along a latitudinal and depth gradient. 2709
This strategy would distinguish whether fish experiencing regionally different water 2710
temperatures have the same tolerance to temperature elevations. Physiological research 2711
such as critical thermal maxima experiments would help elucidate whether future 2712
predicted water temperatures will affect the distribution and fitness of L. miniatus, 2713
which would assist in assessing how this will impact this species in a changing climate. 2714
2715
It is likely that movement could be influenced by sex. Thus, the fourth pathway for 2716
future research is the development of a method to differentiate the sex of L. miniatus 2717
individuals. Since the reproductive strategy of many species including L. miniatus is 2718
complex, and fish size cannot be used to infer sex, a non-lethal technique that allows 2719
the release of live individuals requires development. The ability to discern the sex of 2720
acoustically tagged individuals could reveal whether the species display sex-specific 2721
movement patterns (e.g. whether large males move greater distances than females). 2722
2723
This project has focused on one model species, so it would be useful to compare these 2724
observed patterns to other species that differ in biology and ecology. It is unclear 2725
whether patterns observed for L. miniatus would be observed in other species in the 2726
family Lethrinidae. However, it is likely that movement patterns would vary among 2727
some species given that the population biology varies among species (Currey et al. 2728
2013). The observed behaviour and ecology is dissimilar to Lethrinus nebulosus, 2729
another popular and important species to fisheries elsewhere, which forages in large 2730
schools and frequents lagoonal waters (Carpenter 2001). Comparisons between L. 2731

Chapter 8: Discussion
148
miniatus and L. nebulosus in the same location, as well as with the one study from 2732
Western Australia, would be beneficial (Pillans et al. 2014). Using the technologies 2733
employed in this research would provide a better understanding of the dispersal of 2734
important fishery species. Likewise, comparisons among species of other families 2735
simultaneously would provide insight into the ecology of reef predators applicable to 2736
similar systems worldwide. 2737
2738
8.3 Concluding remarks 2739
Mobility may be beneficial for a species faced with climate change and exploitation. 2740
One strategy to tolerate elevated sea temperatures is to shift into deeper cooler water. 2741
However, this may act only as a temporary fix if temperatures become physiologically 2742
intolerable. Alterations of a species distribution to cooler regions could result in 2743
changes to the ecosystem and the fisheries it supports. Since variability in movement 2744
patterns within populations exists, this research emphasises the need for multiple 2745
management strategies to manage the exploitation of reef fishes. This thesis has 2746
demonstrated the differences in movement patterns of an exploited reef fish, identified 2747
at multiple scales by using a combination of techniques. It highlights the essential need 2748
for conducting research of other reef fishes across multiple spatial and temporal scales, 2749
to gain a complete understanding of the spatial ecology of a species for sustainability. 2750
2751
2752

149
References Chapter 92753
Adams S, Mapstone BD, Russ GR, Davies CR (2000) Geographic variation in the sex 2754
ratio, sex specific size, and age structure of Plectropomus leopardus 2755
(Serranidae) between reefs open and closed to fishing on the Great Barrier Reef. 2756
Canadian Journal of Fisheries and Aquatic Sciences 57:1448-1458 2757
Afonso P, Fontes J, Holland KN, Santos RS (2009) Multi-scale patterns of habitat use 2758
in a highly mobile reef fish, the white trevally Pseudocaranx dentex, and their 2759
implications for marine reserve design. Marine Ecology Progress Series 2760
381:273-286 2761
Appeldoorn RS (1997) Dispersal rates of commercially important coral reef fishes: 2762
what do tagging studies tell us about potential emigration from marine fisheries 2763
reserves. Proceedings of the Gulf and Caribbean Fisheries Institute 49:54-63 2764
Appeldoorn RS, Aguilar-Perera A, Bouwmeester BLK, Dennis GD, Hill RL, Merten 2765
W, Recksiek CW, Williams SJ (2009) Movement of fishes (Grunts: 2766
Haemulidae) across the coral reef seascape: A review of scales, patterns and 2767
processes. Caribbean Journal of Science 45:304-316 2768
Arnold GP, Dewar H (2001) Electronic tags in marine fisheries research: a 30-year 2769
perspective. In: Sibert JR, Nielsen JL (eds) Reviews: Methods and technologies 2770
in fish biology and fisheries: Electronic tagging and tracking in marine fisheries. 2771
Kluwer Academic Publishers, Dordrecht, pp7-64 2772
Ayvazian SG, Bastow TP, Edmonds JS, How JR, Nowara GB (2004) Stock structure of 2773
Australian herring (Arripis georgiana) in southwestern Australia. Fisheries 2774
Research 67:39-53 2775
Barton K (2013) MuMIn: Multi-model inference. R package version 1.9.5. 2776
Bastow TP, Jackson G, Edmonds JS (2002) Elevated salinity and isotopic composition 2777
of fish otolith carbonate: stock delineation of pink snapper, Pagrus auratus, in 2778
Shark Bay, Western Australia. Marine Biology 141:801-806 2779
Bates D, Maechler M, Bolker B, Walker S (2014) lme4: Linear mixed-effects models 2780
using Eigen and S4. R package version 1.1-6. 2781
Bean K, Mapstone BD, Davies CR, Murchie CD, Williams AJ (2003) Gonad 2782
development and evidence of protogyny in the red-throat emperor on the Great 2783
Barrier Reef. Journal of Fish Biology 62:299-310 2784
Begg GA, Waldman JR (1999) An holistic approach to fish stock identification. 2785
Fisheries Research 43:35-44 2786
Bellquist LF, Lowe CG, Caselle JE (2008) Fine-scale movement patterns, site fidelity, 2787
and habitat selection of ocean whitefish (Caulolatilus princeps). Fisheries 2788
Research 91:325-335 2789
Bellwood DR, Wainwright PC (2006) The history and biogeography of fishes on coral 2790
reefs. In: Sale PF (ed) Coral reef fishes: dynamics and diversity in a complex 2791
ecosystem. Academic Press, Burlington, pp5-32 2792
Bellwood DR, Renema W, Rosen BR (2012) Biodiversity hotspots, evolution and coral 2793
reef biogeography: A review. In: Gower D, Johnson KG, Richardson J, Rosen 2794
BR, Williams ST, Ruber L (eds) Biotic evolution and environmental change in 2795
southeast Asia. Cambridge University Press, London, pp216-245 2796
Blake RW (2004) Fish functional design and swimming performance. Journal of Fish 2797
Biology 65:1193-1222 2798
Bode M, Bode L, Armsworth PR (2006) Larval dispersal reveals regional sources and 2799
sinks in the Great Barrier Reef. Marine Ecology Progress Series 308:17-25 2800

References
150
Bode M, Armsworth PR, Fox HE, Bode L (2012) Surrogates for reef fish connectivity 2801
when designing marine protected area networks. Marine Ecology Progress 2802
Series 466:155-166 2803
Bolden SK (2000) Long-distance movement of a Nassau grouper (Epinephelus striatus) 2804
to a spawning aggregation in the central Bahamas. Fishery Bulletin 98:642-645 2805
Bosiger YJ, McCormick MI (2014) Temporal links in daily activity patterns between 2806
coral reef predators and their prey. PLoS ONE 9:e111723 2807
Botsford LW, Brumbaugh DR, Grimes C, Kellner JB, Largier J, O'Farrell MR, Ralston 2808
S, Soulanille E, Wespestad V (2009) Connectivity, sustainability, and yield: 2809
bridging the gap between conventional fisheries management and marine 2810
protected areas. Reviews in Fish Biology and Fisheries 19:69-95 2811
Breheny P, Burchett W (2013) visreg: Visualization of regression models. R package 2812
version 2.0-3 2813
Brill RW, Lutcavage ML (2001) Understanding environmental influences on 2814
movements and depth distributions of tunas and billfishes can significantly 2815
improve population assessments. American Fisheries Society Symposium 2816
25:179-198 2817
Brill RW, Block BA, Boggs CH, Bigelow KA, Freund EV, Marcinek DJ (1999) 2818
Horizontal movements and depth distribution of large adult yellowfin tuna 2819
(Thunnus albacares) near the Hawaiian Islands, recorded using ultrasonic 2820
telemetry: implications for the physiological ecology of pelagic fishes. Marine 2821
Biology 133:395-408 2822
Brown IW, Sumpton WD (1998) Age, growth and mortality of redthroat emperor 2823
Lethrinus miniatus (Pisces: Lethrinidae) from the southern Great Barrier Reef, 2824
Queensland, Australia. Bulletin of Marine Science 62:905-917 2825
Brown IW, Doherty P, Ferreira B, Keenan C, McPherson GR, Samoilys M, Sumpton 2826
WD (1994) Growth, reproduction and recruitment of Great Barrier Reef food 2827
fish stocks. Report to Fisheries Research and Development Corporation, FRDC 2828
Project No 90/18. Department of Primary Industries, Queensland 2829
Bunt CM, Kingsford MJ (2014) Movement, habitat utilization and behaviour of coral 2830
trout Plectropomus leopardus during and after the reproductive period on the 2831
southern Great Barrier Reef. Marine Ecology Progress Series 496:33-45 2832
Burnham KP, Anderson DR (2002) Model selection and multimodel inference: A 2833
practical information-theoretic approach. Springer, New York 2834
Cadrin CX, Secor D (2009) Accounting for spatial population structure in stock 2835
assessment: past, present, and future. In: Beamish RJ, Rothschild BJ (eds) The 2836
future of fisheries science in North America. Springer, Dordrecht, pp405-426 2837
Cagua EF, Berumen ML, Tyler EHM (2013) Topography and biological noise 2838
determine acoustic detectability on coral reefs. Coral Reefs. 32:1123-1134 2839
Calenge C (2006) The package adehabitat for the R software: tool for the analysis of 2840
space and habitat use by animals. Ecological Modelling 197:516-519 2841
Camilo M, Sale PF (2002) Are populations of coral reef fish open or closed? Trends in 2842
Ecology and Evolution 17:422-428 2843
Campana SE (1999) Chemistry and composition of fish otoliths: pathways, mechanisms 2844
and applications. Marine Ecology Progress Series 188:263-297 2845
Campana SE (2005) Otolith elemental composition as a natural marker of fish stocks. 2846
In: Cadrin SX, Friedland KD, Waldman JR (eds) Stock identification methods 2847
applications in fishery science. Academic Press, New York, pp227-245 2848
Carpenter KE (2001) Lethrinidae. Emperor (emperor snappers). In: Carpenter KE, 2849
Niem V (eds) FAO species identification guide for fishery purposes The living 2850

References
151
marine resources of the Western Central Pacific Volume 5 Bony fishes part 3 2851
(Menidae to Pomacentridae). FAO, Rome, pp3004-3051 2852
Carpenter KE, Allen GR (1989) FAO Species Catalogue Vol. 9. Emperor fishes and 2853
large-eye breams of the world (family Lethrinidae). An annotated and illustrated 2854
catalogue of lethrinid species known to date. FAO Species Synop. No. 9. FAO, 2855
Rome 2856
Cartamil DP, Lowe CG (2004) Diel movement patterns of ocean sunfish Mola mola off 2857
southern California. Marine Ecology Progress Series 266:245-253 2858
Carter J, Perrine D (1994) A spawning aggregation of dog snapper, Lutjanus jocu 2859
(Pisces: Lutjanidae) in Belize, Central America. Bulletin of Marine Science 2860
55:228-234 2861
Cesar H, Burke L, Pet-Soede L (2003) The economics of worldwide coral reef 2862
degradation. Cesar Environmental Economics Consulting, Arnhem 2863
Chambers RC, Trippel EA (1997) Early life history and recruitment in fish populations. 2864
Chapman and Hall, London 2865
Chapman BB, Skov C, Hulthén K, Brodersen J, Nilsson PA, Hansson L-A, Brönmark 2866
C (2012) Partial migration in fishes: definitions, methodologies and taxonomic 2867
distribution. Journal of Fish Biology 81:479-499 2868
Chapman MR, Kramer DL (2000) Movements of fishes within and among fringing 2869
coral reefs in Barbados. Environmental Biology of Fishes 57:11-24 2870
Chateau O, Wantiez L (2007) Site fidelity and activity patterns of a humphead wrasse, 2871
Cheilinus undulatus, (Labridae), as determined by acoustic telemetry. 2872
Environmental Biology of Fishes 80:503-508 2873
Chateau O, Wantiez L (2008) Human impacts on residency behaviour of spangled 2874
emperor, Lethrinus nebulosus, in a marine protected area, as determined by 2875
acoustic telemetry. Journal of the Marine Biological Association of the United 2876
Kingdom 88:825-829 2877
Chateau O, Wantiez L (2009) Movement patterns of four coral reef fish species in a 2878
fragmented habitat in New Caledonia: implications for the design of marine 2879
protected areas. ICES Journal of Marine Science 66:50-55 2880
Claisse JT, Clark TB, Schumacher BD, McTee SA, Bushnell ME, Callan CK, Laidley 2881
CW, Parrish JD (2011) Conventional tagging and acoustic telemetry of a small 2882
surgeonfish, Zebrasoma flavescens, in a structurally complex coral reef 2883
environment. Environmental Biology of Fishes 91:185-201 2884
Claydon J (2004) Spawning aggregations of coral reef fishes: Characteristics, 2885
hypotheses, threats and management. Oceanography and Marine Biology 2886
42:265-302 2887
Claydon JAB, McCormick MI, Jones GP (2012) Patterns of migration between feeding 2888
and spawning sites in a coral reef surgeonfish. Coral Reefs 31:77-87 2889
Clutton-Brock TH, Harvey PH (1978) Mammals, resources and reproductive strategies. 2890
Nature 273:191-195 2891
Colin PL (1978) Daily and summer-winter variation in mass spawning of striped 2892
parrotfish, Scarus croicensis. Fishery Bulletin 76:117-124 2893
Colin PL (1992) Reproduction of the Nassau grouper, Epinephelus striatus (Pisces: 2894
Serranidae) and its relationship to environmental conditions. Environmental 2895
Biology of Fishes 34:357-377 2896
Colin PL (2010) Aggregation and spawning of the humphead wrasse Cheilinus 2897
undulatus (Pisces: Labridae): general aspects of spawning behaviour. Journal of 2898
Fish Biology 76:987-1007 2899

References
152
Colin PL, Clavijo IE (1988) Spawning activity of fishes producing pelagic eggs on a 2900
shelf edge coral reef, southwestern Puerto Rico. Bulletin of Marine Science 2901
43:129-279 2902
Cowen RK (1990) Sex change and life history patterns of the labrid, Semicossyphus 2903
pulcher, across an environmental gradient. Copeia 1990:787-795 2904
Cozzi G, Broekhuis F, McNutt JW, Turnbull LA, Macdonald DA, Schmid B (2012) 2905
Fear of the dark or dinner by moonlight? Reduced temporal partitioning among 2906
Africa's large carnivores. Ecology 93:2590-2599 2907
Craig H, Gordon LI (1965) Deuterium and oxygen 18 variations in the ocean and 2908
marine atmosphere. In: Tongiogi E (ed) Stable Isotopes in Oceanographic 2909
Studies and Paleotemperatures, Spoleto, pp9-130 2910
Crozier LG, Hutchings JA (2013) Plastic and evolutionary responses to climate change 2911
in fish. Evolutionary Applications 7:68-87 2912
Currey LM, Williams AJ, Mapstone BD, Davies CR, Carlos G, Welch DJ, 2913
Simpfendorfer CA, Ballagh AC, Penny AL, Grandcourt EM, Mapleston AJ, 2914
Wiebken AS, Bean K (2013) Comparative biology of tropical Lethrinus species 2915
(Emperors): challenges for multi-species management. Journal of Fish Biology 2916
82:764-788 2917
Davies CR, Williams AJ, Mapstone BD, Benzie J, van Herwerden L, Choat JH, Adams 2918
S, Murchie CD, Bean K, Carlos G, A. T, Ackerman J (2006) Stock structure and 2919
regional variation in population dynamics of the Red Throat Emperor and other 2920
target species of the Queensland tropical reef line fishery CRC Reef Research 2921
Centre Technical Report No 61. CRC Reef Research Centre, Townsville 2922
Dingle H (1995) Migration: The biology of life on the move. Oxford University Press, 2923
New York 2924
Dingle H, Drake VA (2007) What is migration? Bioscience 57:113-121 2925
Doherty PJ (2006) Variable replenishment and the dynamics of reef fish populations. 2926
In: Sale PF (ed) Coral reef fishes: dynamics and diversity in a complex 2927
ecosystem. Academic Press, Burlington, pp327-355 2928
Doherty PJ, Williams DM, Sale PF (1985) The adaptive significance of larval dispersal 2929
in coral reef fishes. Environmental Biology of Fishes 12:81-90 2930
Domeier ML, Colin PL (1997) Tropical reef fish spawning aggregations: defined and 2931
reviewed. Bulletin of Marine Science 60:698-726 2932
Donelson JM, Munday PL, McCormick MI, Pankhurst NW, Pankhurst PM (2010) 2933
Effects of elevated water temperature and food availability on the reproductive 2934
performance of a coral reef fish. Marine Ecology Progress Series 401:233-243 2935
Dubin RE, Baker JD (1982) Two types of cover-seeking behavior at sunset by the 2936
princess parrotfish, Scarus taeniopterus, at Barbados, West Indies. Bulletin of 2937
Marine Science 32:572-583 2938
Dufour V, Pierre C, Rancher J (1998) Stable isotopes in fish otoliths discriminate 2939
between lagoonal and oceanic residents of Taiaro Atoll (Tuaotu Archipelago, 2940
French Polynesia). Coral Reefs 17:23-28 2941
Duong T (2007) ks: Kernel density estimation and kernel discriminant analysis for 2942
multivariate data in R. Journal of Statistical Software 21:1-16 2943
Edmonds JS, Fletcher WJ (1997) Stock discrimination of pilchards Sardinops sagax by 2944
stable isotope ratio analysis of otolith carbonate. Marine Ecology Progress 2945
Series 152:241-247 2946
Eggleston DB (1995) Recruitment in Nassau grouper Epinephelus striatus: post-2947
settlement abundance, microhabitat features, and ontogenetic habitat shifts. 2948
Marine Ecology Progress Series 124:9-22 2949

References
153
Egli DP, Moy W, Naisilisili W (2010) Fish movement in MPAs on coral reefs in 2950
Kubulau, Fiji. Technical Report no. 05/10. Wildlife Conservation Society-Fiji, 2951
Suva 2952
Eklund AM, Schull J (2001) A stepwise approach to investigating the movement 2953
patterns and habitat utilisation of goliath grouper, Epinephelus itajara using 2954
conventional tagging, acoustic telemetry and satelite tracking. In: Sibert JR, 2955
Nielsen JL (eds) Reviews: Methods and technologies in fish biology and 2956
fisheries: electronic tagging and tracking in marine fisheries. Kluwer Academic 2957
Press, Dordrecht, pp189-216 2958
Elliot JM, Elliot JA (1995) The effect of the rate of temperature increase on the critical 2959
thermal maximum for parr of Altlantic salmon and brown trout. Journal of Fish 2960
Biology 47:917-919 2961
Elsdon TS, Gillanders BM (2002) Interactive effects of temperature and salinity on 2962
otolith chemistry: challenges for determining environmental histories of fish. 2963
Canadian Journal of Fisheries and Aquatic Sciences 59:1796-1808 2964
Elsdon TS, Ayvazian S, McMahon KW, Thorrold SR (2010) Experimental evaluation 2965
of stable isotope fractionation in fish muscle and otoliths. Marine Ecology 2966
Progress Series 408:195-205 2967
Eristhee N, Oxenford HA (2001) Home range size and use of space by Bermuda chub 2968
Kyphosus sectatrix (L.) in two marine reserves in the Soufriere Marine 2969
Management Area, St Lucia, West Indies. Journal of Fish Biology 59:129-151 2970
Fairclough DV, Edmonds JS, Jackson GD, Lenanton RCJ, Kemp J, Molony B, Keay 2971
IS, Crisafuli BM, Wakefield CB (2013) A comparison of the stock structures of 2972
two exploited demersal teleosts, employing complementary methods of otolith 2973
element analysis. Journal of Experimental Marine Biology and Ecology 2974
439:181-195 2975
Farrell AP, Hinch SG, Cooke SJ, Patterson DA, Crossin GT, Lapointe M, Mathes MT 2976
(2008) Pacific salmon in hot water: Applying aerobic scope models and 2977
biotelemetry to predict the success of spawning migrations. Physiological and 2978
Biochemical Zoology 81:97-709 2979
Feary DA, Pratchett MS, Emslie MJ, Fowler AM, Figueira WF, Luiz OJ, Nakamura Y, 2980
Booth DJ (2014) Latitudinal shifts in coral reef fishes: why some species do and 2981
others do not shift. Fish and Fisheries 15:593-615 2982
Fishelson L (1975) Ethology and reproduction of pteroid fishes found in the Gulf of 2983
Aqaba (Red Sea), especially Dendrochirus brachypterus (Cuvier), (Pteroidae, 2984
Teleostei). Pubblicazioni della Stazione Zoologica di Napoli 39:635-656 2985
Fisheries Queensland (2013) Coral Reef Fin Fish Fishery 2011–12 Fishing Year 2986
Report. Department of Agriculture, Fisheries and Forestry, Brisbane 2987
Fisheries Research and Development Corporation (2012) Status of Key Australian Fish 2988
Stocks Reports 2012. Australian Government, Canberra 2989
Fitzpatrick BM, Harvey ES, Heyward AJ, Twiggs EJ, Colquhoun J (2012) Habitat 2990
specialization in tropical continental shelf demersal fish assemblages. PLoS 2991
ONE 7:e39634 2992
Fletcher WJ, Santoro K (2013) Status Reports of the Fisheries and Aquatic Resources 2993
of Western Australia 2012/13: The State of the Fisheries. Department of 2994
Fisheries Western Australia, Perth 2995
Fox RJ, Bellwood DR (2007) Quantifying herbivory across a coral reef depth gradient. 2996
Marine Ecology Progress Series 339:49–59 2997

References
154
Fox RJ, Bellwood DR (2011) Unconstrained by the clock? Plasticity of diel activity 2998
rhythm in a tropical reef fish, Siganus lineatus. Functional Ecology 25:1096-2999
1105 3000
Friedlander AM, Parrish JD, DeFelice RC (2002) Ecology of the introduced snapper 3001
Lutjanus kasmira (Forsskal) in the reef fish assemblage of a Hawaiian bay. 3002
Journal of Fish Biology 60:28-48 3003
Fromentin JM, Powers JE (2005) Atlantic bluefin tuna: population dynamics, ecology, 3004
fisheries and management. Fish and Fisheries 6:281-306 3005
Gardiner NM, Munday PL, Nilsson GRE (2010) Counter-gradient variation in 3006
respiratory performance of coral reef fishes at elevated temperatures. PLoS ONE 3007
5:e13299 3008
Gerking S (1959) The restricted movement of fish populations. Biological Reviews 3009
34:221-242 3010
Gillanders BM, Able KW, Brown JA, Eggleston DB, Sheridan PF (2003) Evidence of 3011
connectivity between juvenile and adult habitats for mobile marine fauna: an 3012
important component of nurseries. Marine Ecology Progress Series 247:281-3013
295 3014
Godo OR, Hjellvik V, Iversen SA, Slotte A, Tenningen E, Torkelsen T (2004) 3015
Behaviour of mackerel schools during summer feeding migration in the 3016
Norwegian Sea, as observed from fishing vessel sonars. ICES Journal of Marine 3017
Science 61:1093-1099 3018
Grober-Dunsmore R, Frazer TK, Lindberg WJ, Beets J (2007) Reef fish and habitat 3019
relationships in a Caribbean seascape: the importance of reef context. Coral 3020
Reefs 26:201-216 3021
Grober-Dunsmore R, Pittman SJ, Caldow C, Kendall MS, Frazer TK (2009) A 3022
landscape ecology approach for the study of ecological connectivity across 3023
tropical marine seascapes. In: Nagelkerken I (ed) Ecological connectivity 3024
among tropical coastal ecosystems Springer, Dordrecht, pp493-530 3025
Grueber CE, Laws RJ, Nakagawa S, Jamieson IG (2011) Multimodel inference in 3026
ecology and evolution: challenges and solutions. Journal of Evolutionary 3027
Biology 24:699-711 3028
Grüss A, Kaplan DM, Guénette S, Roberts CM, Botsford LW (2011) Consequences of 3029
adult and juvenile movement for marine protected areas. Biological 3030
Conservation 144:692-702 3031
Guénette S, Lauck T, Clark C (1998) Marine reserves: from Beverton and Holt to the 3032
present. Reviews in Fish Biology and Fisheries 8:251-272 3033
Hamer PA, Jenkins GP, Gillanders BM (2003) Otolith chemistry of juvenile snapper 3034
Pagrus auratus in Victorian waters: natural chemical tags and their temporal 3035
variation. Marine Ecology Progress Series 263:261-273 3036
Hammerschlag-Peyer CM, Layman CA (2010) Intrapopulation variation in habitat use 3037
by two abundant coastal fish species. Marine Ecology Progress Series 415:211-3038
220 3039
Harvey ES, Butler JJ, McLean DL, Shand J (2012a) Contrasting habitat use of diurnal 3040
and nocturnal fish assemblages in temperate Western Australia. Journal of 3041
Experimental Marine Biology and Ecology 426-427:78-86 3042
Harvey ES, Newman SJ, Cappo MC, Radford B, Heyward AJ (2012b) Ningaloo deeper 3043
water habitat. WAMSI Node 3 Project 3.1.1 Fish Sampling. Western Australian 3044
Marine Science Institution, Perth 3045

References
155
Harvey ES, Dorman SR, Fitzpatrick C, Newman SJ, McLean DL (2012c) Response of 3046
diurnal and nocturnal coral reef fish to protection from fishing: An assessment 3047
using baited remote underwater video. Coral Reefs 31:939-950 3048
Harvey ES, Cappo M, Kendrick GA, McLean DL (2013) Coastal fish assemblages 3049
reflect geological and oceanographic gradients within an Australian zootone. 3050
PLoS ONE 8:e80955 3051
Hastings PA, Galland GR (2010) Ontogeny of microhabitat use and two-step 3052
recruitment in a specialist reef fish, the Browncheek Blenny (Chaenopsidae). 3053
Coral Reefs 29:155-164 3054
Hazen EL, Maxwell SM, Bailey H, Bograd SJ, Hamann M, Gaspar P, Godley BJ, 3055
Shillinger GL (2012 ) Ontogeny in marine tagging and tracking science: 3056
technologies and data gaps. Marine Ecology Progress Series 457:221-240 3057
Hedley J, Roelfsema C, Phinn SR (2009) Efficient radiative transfer model inversion 3058
for remote sensing applications. Remote Sensing of Environment 113:2527-2532 3059
Hedley J, Roelfsema C, Phinn SR (2010) Propagating uncertainty through a shallow 3060
water mapping algorithm based on radiative transfer model inversion. 20th 3061
Ocean Optics Conference, 27 Sep-1 Oct 2010 3062
Henderson MJ, Fabrizio MC, Lucy JA (2014) Movement patterns of summer flounder 3063
near an artificial reef: Effects of fish size and environmental cues. Fisheries 3064
Research 153:1-8 3065
Heuer RM, Grosell M (2014) Physiological impacts of elevated carbon dioxide and 3066
ocean acidification on fish. American Journal of Physiology - Cell Physiology - 3067
Regulatory, Integrative and Comparative Physiology 307:R1061-R1084. 3068
Heupel MR, Simpfendorfer CA (2014) Importance of environmental and biological 3069
drivers in the presence and space use of a reef-associated shark. Marine Ecology 3070
Progress Series 496:47-57 3071
Heupel MR, Simpfendorfer CA, Hueter RE (2003) Running before the storm: blacktip 3072
sharks respond to falling barometric pressure associated with Tropical Storm 3073
Gabrielle. Journal of Fish Biology 63:1357-1363 3074
Heupel MR, Simpfendorfer CA, Heuter RE (2004) Estimation of shark home ranges 3075
using passive monitoring techniques. Environmental Biology of Fishes 71:135-3076
142 3077
Heupel MR, Semmens JM, Hobday AJ (2006) Automated acoustic tracking of animals: 3078
scales, design and deployment of listening station arrays. Marine and 3079
Freshwater Research 57:1-13 3080
Heupel MR, Currey LM, Williams AJ, Simpfendorfer CA, Ballagh AC, Penny AL 3081
(2009) Comparative biology of lutjanid species on the Great Barrier Reef: 3082
Project 4.8.3. Milestone report to the Marine and Tropical Sciences Research 3083
Facility. Reef and Rainforest Research Centre Limited, Cairns 3084
Heyman WD, Kjerfve B (2008) Characterization of transient multi-species reef fish 3085
spawning aggregations at Gladden Spit, Belize. Bulletin of Marine Science 3086
83:531-551 3087
Hilborn R, Stokes K, Maguire J-J, Smith T, Botsford LW, Mangel M, Orensanz J, 3088
Parma A, Rice J, Bell J, Cochrane KL, Garcia S, Hall SJ, Kirkwood GP, 3089
Sainsbury K, Stefansson G, Walters C (2004) When can marine reserves 3090
improve fisheries management? Ocean and Coastal Management 47:197-205 3091
Hitt S, Pitman SJ, Nemeth RS (2011) Diel movements of fishes linked to benthic 3092
seascape structure in a Caribbean coral reef ecosystem. Marine Ecology 3093
Progress Series 427:275-291 3094

References
156
Hobson ES (1972) Activity of Hawaiian reef fishes during the evening and morning 3095
transitions between daylight and darkness. Fishery Bulletin 70:715-740 3096
Hobson ES (1973) Diel feeding migrations in tropical reef fishes. Helgolainder wiss 3097
Meeresunters 24:361-370 3098
Hobson ES (1975) Feeding patterns among tropical reef fishes: Understanding the way 3099
fishes respond to changing conditions during the day-night cycle provides 3100
insight into their feeding activities. American Scientist 63:382-392 3101
Høie H, Folkvord A, Otterlei E (2003) Effect of somatic and otolith growth rate on 3102
stable isotopic composition of early juvenile cod (Gadus morhua L) otoliths. 3103
Journal of Experimental Marine Biology and Ecology 289:41-58 3104
Høie H, Andersson C, Folkvord A, Karlsen Ø (2004) Precision and accuracy of stable 3105
isotope signals in otoliths of pen-reared cod (Gadus morhua) when sampled 3106
with a high-resolution micromill. Marine Biology 144:1039-1049 3107
Holland K, Brill R, Ferguson S, Chang R, Yost R (1985) A small vessel technique for 3108
tracking pelagic fish. Marine Fisheries Review 47:26-32 3109
Holland KN, Brill RW, Chang RKC (1990) Horizontal and vertical movements of 3110
yellowfin and bigeye tuna associated with fish aggregating devices. Fishery 3111
Bulletin 88:493-507 3112
Holland KN, Peterson JD, Lowe CG, Wetherbee BM (1993) Movements, distribution 3113
and growth rates of the white goatfish Mulloides flavolineatus in a fisheries 3114
conservation zone. Bulletin of Marine Science 52:982-992 3115
Holland KN, Lowe CG, Wetherbee BM (1996) Movements and dispersal patterns of 3116
blue trevally (Caranx melampygus) in a fisheries conservation zone. Fisheries 3117
Research 25:279-292 3118
Hourigan TF, Stanton FJ, Motta PJ, Kelley CD, Carlson B (1989) The feeding ecology 3119
of three species of Caribbean angelfishes (family Pomacanthidae). 3120
Environmental Biology of Fishes 24:105-116 3121
Howard KG, Claisse JT, Clark TB, Boyle K, Parrish JD (2013) Home range and 3122
movement patterns of the Redlip Parrotfish (Scarus rubroviolaceus) in Hawaii. 3123
Marine Biology 160:1583-1595 3124
Huxam M, Kimani E, Newton J, Augley J (2007) Stable isotope records from otoliths 3125
as tracers of fish migration in a mangrove system. Journal of Fish Biology 3126
70:1554-1567 3127
IPCC (2013) Climate change 2013: the physical science basis. Contribution of working 3128
group I to the fifth assessment report of the Intergovernmental Panel on Climate 3129
Change. Cambridge University Press, Cambridge 3130
Itzkowitz M, Itzkowitz DE, Shelly D (1995) Territory use and disuse in the 3131
beaugregory damselfish. Bulletin of Marine Science 57:653-662 3132
Jetz W, Carbone C, Fulford J, Brown JH (2004) The scaling of animal space use. 3133
Science 3134
Johannes RE (1978) Reproductive strategies of coastal marine fishes in the tropics. 3135
Environmental Biology of Fishes 3:65-84 3136
Johannes RE, Squire L (1988) Spawning aggregations of coral trout and Maori wrasse 3137
in the Cairns section of the Great Barrier Reef Marine Park. Report to the Great 3138
Barrier Reef Marine Park Authority. Great Barrier Reef Marine Park Authority, 3139
Townsville 3140
Johansen JL, Messmer V, Coker DJ, Hoey AS, Pratchett MS (2014) Increasing ocean 3141
temperatures reduce activity patterns of a large commercially important coral 3142
reef fish. Global Change Biology 20:1067-1074 3143

References
157
Jones GP (1991) Post recruitment processes in the ecology of coral reef fish 3144
populations. In: Sale PF (ed) The ecology of fishes on coral reefs. Academic 3145
Press, San Diego, pp294-328 3146
Jones KMM (2005) Home range areas and activity centres in six species of Caribbean 3147
wrasses (Labridae). Journal of Fish Biology 66:150-166 3148
Jud ZR, Layman CA (2012) Site fidelity and movement patterns of invasive lionfish, 3149
Pterois spp., in a Florida estuary. Journal of Experimental Marine Biology and 3150
Ecology 414-415:69-74 3151
Kalish JM (1991) Oxygen and carbon stable isotopes in the otoliths of wild and 3152
laboratory-reared Australian salmon (Arripis trutta). Marine Biology 110:37-47 3153
Kaunda-Arara B, Rose GA (2004a) Out-migration of tagged fishes from marine reef 3154
national parks to fisheries in coastal Kenya. Environmental Biology of Fishes 3155
70:363-372 3156
Kaunda-Arara B, Rose GA (2004b) Long-distance movements of coral reef fishes. 3157
Coral Reefs 23:410-412 3158
Kleypas JA, Burrage DM (1994) Satellite observations of circulation in the Southern 3159
Great Barrier Reef, Australia. International Journal of Remote Sensing 15:2051-3160
2063 3161
Kozakiewicz M (1995) Resource tracking in space and time. In: Hansson L, Fahrig L, 3162
Merriam G (eds) Mosaic Landscapes and Ecological Processes. Chapman and 3163
Hall, London, pp136-148 3164
Kramer DL, Chapman MR (1999) Implications of fish home range size and relocation 3165
for marine reserve function. Environmental Biology of Fishes 55:65-79 3166
Kronfeld-Schor N, Dayan T (2003) Partitioning of time as an ecological resource. 3167
Annual Review of Ecology and Systematics 34:153-181 3168
Kuwamura T (1997) Evolution of female egg care in haremic triggerfish, Rhinecanthus 3169
aculeatus. Ethology 103 1015-1023 3170
Leigh GM, Williams AJ, Begg GA, Gribble NA, Whybird OJ (2006) Stock assessment 3171
of the Queensland east coast red throat emperor (Lethrinus miniatus) fishery. 3172
Sustainable Fisheries Unit, Animal Science, Department of Primary Industries 3173
and Fisheries, Brisbane 3174
Leis JM (1991) The pelagic stage of reef fishes: the larval biology of coral reef fishes. 3175
In: Sale PF (ed) The ecology of fishes on coral reefs. Academic Press, New 3176
York, pp183-231 3177
Lenanton RC, Dowling C, Jackson G, Fairclough DV (In prep) Potential climate-3178
induced marine range extensions off Western Australia: (1) effects of the 2010-3179
11 marine heatwave on the coastal fish fauna off the lower west coast. Global 3180
Change Biology 3181
Lienart GDH, Mitchell MD, Ferrari MCO, McCormick MI (2014) Temperature and 3182
food availability affect risk assessment in an ectotherm. Animal Behaviour 3183
89:199-204 3184
Loubens G (1980) Biologie de quelques espèces de poissons du lagon néo-calédonien. 3185
III. Croissance. Cahiers de l'Indo-Pacifique 2:101-153 3186
Lowe CG, Topping DT, Cartamil DP, Papastamatiou YP (2003) Movement patterns, 3187
home range, and habitat utilization of adult kelp bass Paralabrax clathratus in a 3188
temperate no-take marine reserve. Marine Ecology Progress Series 256:205-216 3189
Mapstone BD, Davies CR, Little LR, Punt AE, Smith ADM, Pantus F, Lou DC, 3190
Williams AJ, Jones A, Ayling AM, Russ GR, McDonald AD (2004) The effects 3191
of line fishing on the Great Barrier Reef and evaluations of alternative potential 3192

References
158
management strategies CRC Reef Research Centre Technical Report No 52. 3193
CRC Reef Research Centre, Townsville 3194
Marshell A, Mills JS, Rhodes KL, McIlwain JL (2011) Passive acoustic telemetry 3195
reveals highly variable home range and movement patterns among unicornfish 3196
within a marine reserve. Coral Reefs 30:631-642 3197
Matley JK, Heupel MR, Simpfendorfer CA (In press) Depth and space use of leopard 3198
coralgrouper (Plectropomus leopardus) using passive acoustic tracking. Marine 3199
Ecology Progress Series 3200
Mazeroll AI, Montgomery WL (1995) Structure and organization of local migrations in 3201
brown surgeonfish (Acanthurus nigrofuscus). Ethology 99:89-106 3202
Mazeroll AI, Montgomery WL (1998) Daily migrations of a coral reef fish in the Red 3203
Sea (Gulf of Aqaba, Israel): initiation and orientation. Copeia 1998:893-905 3204
Metcalfe JD, Righton DA, Hunter E, Neville S, Mills DK (2009) New technologies for 3205
the advancement of fisheries science. In: Payne A, Cotter J, Potter T (eds) 3206
Advances in fisheries science: 50 Years on From Beverton and Holt. Wiley-3207
Blackwell, Oxford, pp225-279 3208
Meyer CG, Holland KN, Wetherbee BM, Lowe CG (2000) Movement patterns, habitat 3209
utilization, home range size and site fidelity of whitesaddle goatfish, 3210
Parupeneus porphyreus, in a marine reserve. Environmental Biology of Fishes 3211
59:235-242 3212
Meyer CG, Papastamatiou YP, Holland KN (2007a) Seasonal, diel, and tidal 3213
movements of green jobfish (Aprion virescens, Lutjanidae) at remote Hawaiian 3214
atolls: implications for marine protected area design. Marine Biology 151:2133-3215
2143 3216
Meyer CG, Holland KN, Papastamatiou YP (2007b) Seasonal and diel movements of 3217
giant trevally Caranx ignobilis at remote Hawaiian atolls: implications for the 3218
design of Marine Protected Areas. Marine Ecology Progress Series 333:13-25 3219
Meyer CG, Papastamatiou YP, Clark TB (2010) Differential movement patterns and 3220
site fidelity among trophic groups of reef fishes in a Hawaiian marine protected 3221
area. Marine Biology 157:1499-1511 3222
Moran M, Burton C, Jenke J (2003) Long-term movement patterns of continental shelf 3223
and inner gulf snapper (Pagrus auratus, Sparidae) from tagging in the Shark 3224
Bay region of Western Australia. Marine and Freshwater Research 54:913-922 3225
Munday P, Kingsford M, O’Callaghan M, Donelson J (2008a) Elevated temperature 3226
restricts growth potential of the coral reef fish Acanthochromis polyacanthus. 3227
Coral Reefs 27:927-931 3228
Munday PL, Jones GP, Pratchett MS, Williams AJ (2008b) Climate change and the 3229
future for coral reef fishes. Fish and Fisheries 9:261-285 3230
Munro JL (1996) The scope of coral reef fisheries and their management. In: Polunin 3231
N, Roberts C (eds) Coral Reef Fisheries. Chapman and Hall, New York 3232
Musyl MK, Brill RW, Boggs CH, Curran DS, Kazama TK, Seki MP (2003) Vertical 3233
movements of bigeye tuna (Thunnus obesus) associated with islands, buoys, and 3234
seamounts near the main Hawaiian Islands from archival tagging data. Fisheries 3235
Oceanography 12:152-169 3236
Nakamura Y, Feary DA, Kanda M, Yamaoka K (2013) Tropical fishes dominate 3237
temperate reef fish communities within western Japan. PLoS ONE 8:e81107 3238
Nanami A, Yamada H (2009) Site fidelity, size, and spatial arrangement of daytime 3239
home range of thumbprint emperor Lethrinus harak (Lethrinidae). Fisheries 3240
Science 75:1109-1116 3241

References
159
Nemeth RS, Blondeau J, Herzlieb S, Kadison E (2007) Spatial and temporal patterns of 3242
movement and migration at spawning aggregations of red hind, Epinephelus 3243
guttatus, in the U.S. Virgin Islands. Environmental Biology of Fishes 78:365-3244
381 3245
Newman SJ, Williams DM (1996) Variation in reef associated assemblages of the 3246
Lutjanidae and Lethrinidae at different distances offshore in the central Great 3247
Barrier Reef. Environmental Biology of Fishes 46:123-138 3248
Newman SJ, Williams DM (2001) Spatial and temporal variation in assemblages of 3249
Lutjanidae, Lethrinidae and associated fish species among mid-continental shelf 3250
reefs in the central Great Barrier Reef. Marine and Freshwater Research 3251
52:843-851 3252
Newman SJ, Buckworth RC, Mackie MC, Lewis AR, Wright IA, Williamson PC, 3253
Bastow TP, Ovenden JR (2009) Spatial subdivision among assemblages of 3254
Spanish mackerel, Scomberomorus commerson (Pisces: Scombridae) across 3255
northern Australia: implications for fisheries management. Global Ecology and 3256
Biogeography 18:711-723 3257
Newman SJ, Allsop DJ, Ballagh AC, Garrett RN, Gribble N, Meeuwig JJ, Mitsopoulos 3258
GEA, Moore BR, Pember MB, Rome BM, Saunders T, Skepper CL, Stapley 3259
JM, van Herwerden L, Welch DJ (2010) Variation in stable isotope (δ18O and 3260
δ13C) signatures in the sagittal otolith carbonate of king threadfin, Polydactylus 3261
macrochir across northern Australia reveals multifaceted stock structure. 3262
Journal of Experimental Marine Biology and Ecology 396:53–60 3263
Newman SJ, Pember MB, Rome BM, Mitsopoulos GEA, Skepper CL (2011) Stock 3264
structure of blue threadfin Eleutheronema tetradactylum across northern 3265
Australia as inferred from stable isotopes in sagittal otolith carbonate. Fisheries 3266
Management and Ecology 18:246-257 3267
Newton K, Côté IM, Pilling GM, Jennings S, Dulvy NK (2007) Current and future 3268
sustainability of island coral reef fisheries. Current Biology 17:655-658 3269
Nilsson GE, Crawley N, Lunde IG, Munday PL (2009) Elevated temperature reduces 3270
the respiratory scope of coral reef fishes. Global Change Biology 15:1405-1412 3271
Noble MM, Pratchett MS, Coker DJ, Cvitanovic C, Fulton CJ (2014) Foraging in 3272
corallivorous butterflyfish varies with wave exposure. Coral Reefs 33:351-361 3273
O'Toole AC, Danylchuk AJ, Goldberg TL, Suski CD, Philipp DP, Brooks E, Cooke SJ 3274
(2011) Spatial ecology and residency patterns of adult great barracuda 3275
(Sphyraena barracuda) in coastal waters of The Bahamas. Marine Biology 3276
158:2227-2237 3277
Ogden JC, Ehrlich PR (1977) The behavior of heterotypic resting schools of juvenile 3278
grunts (Pomadasyidae). Marine Biology 42:273-280 3279
Oufiero CE, Holzman RA, Young FA, Wainwright PC (2012) New insights from 3280
serranid fishes on the role of trade-offs in suction-feeding diversification. 3281
Journal of Experimental Botany 215:3845-3855 3282
Palumbi SR (2004) Marine reserves and ocean neighbourhoods: the spatial scale of 3283
marine populations and their management. Annual Review of Environment and 3284
Resources 29:31-68 3285
Patterson HM, Thorrold SR, Shenker JM (1999) Analysis of otolith chemistry in 3286
Nassau grouper (Epinephelus striatus) from the Bahamas and Belize using 3287
solution-based ICP-MS. Coral Reefs 18:171-178 3288
Pauly D, Christensen V, Guénette S, Pitcher TJ, Sumaila UR, Walters CJ, Watson C, 3289
Zeller DC (2002) Towards sustainability in world fisheries. Nature 418:689-695 3290

References
160
Payne NL, Gillanders BM, Webber DM, Semmens JM (2010) Interpreting diel activity 3291
patterns from acoustic telemetry: the need for controls. Marine Ecology 3292
Progress Series 419:295-301 3293
Peters RH (1983) The ecological implications of body size. Cambridge University 3294
Press, Cambridge 3295
Pillans RD, Boomer A, Downie R, Patterson TA, Thomson DP, Babcock RC (2014) 3296
Multi year observations reveal variability in residence of a tropical demersal 3297
fish, Lethrinus nebulosus: implications for spatial management. PLoS ONE 3298
9:e105507 3299
Pinheiro J, Bates D, DebRoy S, Sarkar D, Team RDC (2013) nlme: Linear and 3300
nonlinear mixed effects models. R package version 3.1-109 3301
Pitcher TJ, Turner JR (1986) Danger at dawn: experimental support for the twilight 3302
hypothesis in shoaling minnows. Journal of Fish Biology 29:59–70 3303
Pittman SJ, McAlpine CA (2001) Movements of marine fish and decapod crustaceans: 3304
process, theory and application. Advances in Marine Biology 44:205-294 3305
Planes S, Jones GP, Thorrold SR (2009) Larval dispersal connects fish populations in a 3306
network of marine protected areas. Proceedings of the National Academy of 3307
Sciences of the United States of America 106:5693-5697 3308
Poisson F, Gaertner J-C, Taquet M, Durbec J-P, Bigelow K (2010) Effects of lunar 3309
cycle and fishing operations on longline-caught pelagic fish: fishing 3310
performance, capture time and survival of fish. Fishery Bulletin 108:268-281 3311
Poloczanska ES, Babcock RC, Butler A (2007) Climate change and Australian marine 3312
life. Oceanography and Marine Biology 45:407-478 3313
Popple ID, Hunte W (2005) Movement patterns of Cephalopholis cruentata in a marine 3314
reserve in St Lucia, W.I., obtained from ultrasonic telemetry. Journal of Fish 3315
Biology 67:981-992 3316
Pörtner HO (2002 ) Climate variations and the physiological basis of temperature 3317
dependent biogeography: systemic to molecular hierarchy of thermal tolerance 3318
in animals. Comparative Biochemistry and Physiology Part A Molecular & 3319
Integrative Physiology 132:739-761 3320
Potts WM, Booth AJ, Richardson TJ, Sauer WHH (2014) Ocean warming affects the 3321
distribution and abundance of resident fishes by changing their reproductive 3322
scope. Reviews in Fish Biology and Fisheries 24:493-504 3323
Pratchett MS, Messmer V, Reynolds A, Martin J, Clark TD, Munday PL, Tobin AJ, 3324
Hoey AS (2013) Effects of climate change on reproduction, larval development, 3325
and adult health of coral trout (Plectropomus spp.) FRDC Project No: 2010/554. 3326
Fisheries Research and Development Corporation and James Cook University, 3327
Townsville 3328
Quinn TP, Brodeur RD (1991) Intra-specific variations in the movement patterns of 3329
marine animals. American Zoologist 31:231-241 3330
R Development Core Team (2014) R: A Language and Environment for Statistical 3331
Computing, Version 3.1.0, [http://www.R-project.org], Vienna 3332
Reef Line Council Inc, Queensland Seafood Industry Association, Queensland Seafood 3333
Marketers Association, The State of Queensland Department of Employment 3334
Economic Development and Innovation (2011) Draft reef line and Spanish 3335
mackerel industry development plan: 2011-2014. Department of Employment 3336
Economic Development and Innovation, Brisbane 3337
Reese ES (1975) A comparative field study of the social behavior and related ecology 3338
of reef fishes of the family Chaetodontidae. Zeitschrift für Tierpsychologie 3339
37:37-61 3340

References
161
Richards BL, Williams ID, Vetter OJ, Williams GJ (2012) Environmental factors 3341
affecting large-bodied coral reef fish assemblages in the Mariana Archipelago. 3342
PLoS ONE 7:e31374 3343
Righton D, Miller M, Ormond R (1998) Correlates of territory size in the butterflyfish 3344
Chaetodon austriacus (Rüppell). Journal of Experimental Marine Biology and 3345
Ecology 226:183-193 3346
Roberts CM (1995) Effects of fishing on the ecosystem structure of coral reefs. 3347
Conservation Biology 9:988-995 3348
Roberts CM, Sargant H (2002) Fishery benefits of fully protected marine reserves: why 3349
habitat and behaviour are important. Natural Resource Modelling 15:487-507 3350
Rummer JL, Couturier CS, Stecyk JAW, Gardiner NM, Kinch JP, Nilsson GE, Munday 3351
PL (2014) Life on the edge: thermal optima for aerobic scope of equatorial reef 3352
fishes are close to current day temperatures. Global Change Biology 20:1055-3353
1066 3354
Russ GR (1991) Coral reef fisheries: effects and yields. In: Sale PF (ed) The ecology of 3355
fishes on coral reefs. Academic Press, London, pp601–635 3356
Russell DJ, McDougall AJ (2005) Movement and juvenile recruitment of mangrove 3357
jack, Lutjanus argentimaculatus (Forsskål), in northern Australia Marine and 3358
Freshwater Research 56:465-475 3359
Sadovy YJ (1996) Reproduction of reef fishery species. In: Polunin NVC, Roberts CM 3360
(eds) Reef fisheries. Chapman and Hall, London, pp15-59 3361
Sadovy Y (2005) Trouble on the reef: the imperative for managing vulnerable and 3362
valuable fisheries. Fish and Fisheries 6:167-185 3363
Sadovy Y, Domeier M (2005) Are aggregation-fisheries sustainable? Reef fish fisheries 3364
as a case study. Coral Reefs 24:254-262 3365
Sadovy Y, Eklund AM (1999) Synopsis of biological data on the Nassau grouper, 3366
Epinephelus striatus (Bloch, 1792), and the jewfish, E. itajara (Lichtenstein, 3367
1822) NOAA Technical Report NMFS Series TR 146. NOAA, Seattle 3368
Sale PF (1971) Extremely limited home range in a coral reef fish, Dascyllus aruanus 3369
(Pisces; Pomacentridae). Copeia 1971:324-327 3370
Sale PF (1977) Maintenance of high diversity in coral reef fish communities. The 3371
American Naturalist 111:337-359 3372
Sale PF (1978) Coexistence of coral reef fishes - a lottery for living space. 3373
Environmental Biology of Fishes 3:85-102 3374
Sale PF (1991) The ecology of fishes on coral reefs. Academic Press, New York 3375
Sale PF (1998) Appropriate spatial scales for studies of reef-fish ecology. Australian 3376
Journal of Ecology 23:202-208 3377
Salem M (1999) Management of fishing in the Ras Mohammed National Park with 3378
special reference to the fishery for Lethrinus nebulosus (Forsskal, 1775). 3379
University of York, p272 3380
Samoilys MA (1997) Movement in a large predatory fish: coral trout, Plectropomus 3381
leopardus (Pisces: Serranidae), on Heron Reef, Australia. Coral Reefs 16:151-3382
158 3383
Samoilys MA, Squire LC (1994) Preliminary observations on the spawning behaviour 3384
of coral trout, Plectropomus leopardus (Pisces: Serranidae), on the Great 3385
Barrier Reef. Bulletin of Marine Science 54:332-342 3386
Schwarcz HP, Gao Y, Campana SE, Browne D, Knyf M, Brand U (1998) Stable carbon 3387
isotope variations in otoliths of Atlantic cod (Gadus morhua). Canadian 3388
Journal of Fisheries and Aquatic Sciences 55:1798-1806 3389

References
162
Shapiro DY, Garcia-Moliner G, Sadovy Y (1994) Social system of an inshore stock of 3390
the red hind grouper, Epinephelus guttatus (Pisces: Serranidae). Environmental 3391
Biology of Fishes 41:415-422 3392
Shimose T, Yokawa K, Tachihara K (2013) Higher catch rates around the full moon for 3393
blue marlin, Makiaira nigricans, in a diurnal trolling fishery. Bulletin of Marine 3394
Science 89:759-765 3395
Simpfendorfer CA, Heupel MR, Hueter RE (2002) Estimation of short-term centers of 3396
activity from an array of omnidirectional hydrophones and its use in studying 3397
animal movements. Canadian Journal of Fisheries and Aquatic Sciences 59:23-3398
32 3399
Simpfendorfer CA, Heupel MR, Collins AB (2008) Variation in the performance of 3400
acoustic receivers and its implication for positioning algorithms in a riverine 3401
setting. Canadian Journal of Fisheries and Aquatic Sciences 65:482-492 3402
Sluka RD (2001) Grouper and Napoleon wrasse ecology in Laamu Atoll, Republic of 3403
the Maldives: Part 1. Habitat, behaviour and movement patterns. Atoll Research 3404
Bulletin 491:1-27 3405
Smith CL (1972) A spawning aggregation of nassau gouper, Epinephelus striatus 3406
(Bloch). Transactions of the American Fisheries Society 101:257-261 3407
Squires D, Campbell H, Cunningham S, Dewees C, Grafton RQ, Herrick SF, Kirkley J, 3408
Pascoe S, Salvanes K, Shallard B, Turris B, Vestergaard N (1998) Individual 3409
transferable quotas in multispecies fisheries. Marine Policy 22:135-159 3410
Starr RM, Heine JN, Felton JM, Cailliet GM (2002) Movements of bocaccio (Sebastes 3411
paucispinis) and greenspotted (S. chlorostictus) rockfishes in a Monterey 3412
submarine canyon: implications for the design of marine reserves. Fishery 3413
Bulletin 100:324-338 3414
Steer MA, Halverson GP, Fowler AJ, Gillanders BM (2010) Stock discrimination of 3415
Southern Garfish (Hyporhamphus melanochir) by stable isotope ratio analysis 3416
of otolith aragonite. Environmental Biology of Fishes 89:369-381 3417
Sumpton WD, Mayer DG, Brown IW, Sawynok B, McLennan M, Butcher A, 3418
Kirkwood J (2008) Investigation of movement and factors influencing post-3419
release survival of line-caught coral reef fish using recreational tag-recapture 3420
data. Fisheries Research 92:189-195 3421
Takeuchi N (2009) Ontogenetic changes in foraging tactics of the piscivorous 3422
cornetfish Fistularia commersonii. Ichthyological Research 56:18-27 3423
Taylor BM, Mills JS (2013) Movement and spawning migration patterns suggest small 3424
marine reserves can offer adequate protection for exploited emperorfishes. 3425
Coral Reefs 32:1077-1087 3426
Taylor PD, Fahrig L, Henein K, Merriam G (1993) Connectivity is a vital element of 3427
landscape structure. Oikos 68:571-573 3428
Thorrold SR, Campana SE, Jones CM, Swart PK (1997) Factors determining d13C and 3429
d18O fractionation in aragonitic otoliths of marine fish. Geochimica et 3430
Cosmochimica Acta 61:2909-2919 3431
Thorrold SR, Jones CM, Swart PK, Targett TE (1998) Accurate classification of 3432
juvenile weakfish Cynoscion regalis to estuarine nursery areas based on 3433
chemical signatures in otoliths. Marine Ecology Progress Series 173:253-265 3434
Thresher RE (1984) Reproduction in reef fishes. T.F.H. Publications, Neptune City 3435
Tobin A, Schlaff A, Tobin R, Penny AL, Ayling T, Ayling A, Krause B, Welch DJ, 3436
Sutton S, Sawynok B, Marshall N, Marshall P, Maynard J (2010) Adapting to 3437
change: minimising uncertainty about the effects of rapidly-changing 3438
environmental conditions on the Queensland Coral Reef Fin Fish Fishery. Final 3439

References
163
Report to the Fisheries Research & Development Corporation, Project 3440
2008/103. Fishing & Fisheries Research Centre Technical Report No. 11. James 3441
Cook University, Townsville 3442
Tobin AJ, Currey LM, Simpfendorfer CA (2013) Informing the vulnerability of species 3443
to spawning aggregation fishing using commercial catch data. Fisheries 3444
Research 143:47- 56 3445
Topping DT, Szedlmayer ST (2011) Home range and movement patterns of red snapper 3446
(Lutjanus campechanus) on artificial reefs. Fisheries Research 112:77-84 3447
Tulevech SM, Recksiek CW (1994) Acoustic tracking of adult white grunt, Haemulon 3448
plumieri, in Puerto Rico and Florida. Fisheries Research 19:301-319 3449
Turgeon K, Robillard A, Gregoire J, Duclos V, Kramer DL (2010) Functional 3450
connectivity from a reef fish perspective: behavioral tactics for moving in a 3451
fragmented landscape. Ecology 91:3332-3342 3452
Tyler III WA, Stanton FG (1995) Potential influence of food abundance on spawning 3453
patterns in a damselfish Abudefduf abdominalis. Bulletin of Marine Science 3454
57:610-623 3455
Udyawer V, Chin A, Knip DM, Simpfendorfer CA, Heupel MR (2013) Variable 3456
response of coastal sharks to severe tropical storms: environmental cues and 3457
changes in space use. Marine Ecology Progress Series 480:171-183 3458
Walker MH (1978) Food and feeding habits of Lethrinus chrysostomus Richardson 3459
(Pisces : Perciformes) and other lethrinids on the Great Barrier Reef. Australian 3460
Journal of Marine and Freshwater Research 29:623-630 3461
Weeks S, Bakun A, Steinberg C, Brinkman R, Hoegh-Guldberg O (2010) The 3462
Capricorn Eddy: a prominent driver of the ecology and future of the southern 3463
Great Barrier Reef. Coral Reefs 29:975-985 3464
Weidman CR, Millner R (2000) High-resolution stable isotope records from North 3465
Atlantic cod. Fisheries Research 46:327-342 3466
Welsh JQ, Bellwood DR (2012a) Spatial ecology of the steephead parrotfish 3467
(Chlorurus microrhinos): an evaluation using acoustic telemetry. Coral Reefs 3468
31:55-65 3469
Welsh JQ, Bellwood DR (2012b) How far do schools of roving herbivores rove? A case 3470
study using Scarus rivulatus. Coral Reefs 31:991-1003 3471
Welsh JQ, Fox RJ, Webber DM, Bellwood DR (2012) Performance of remote acoustic 3472
receivers within a coral reef habitat: implications for array design. Coral Reefs 3473
31:693-702 3474
Welsh JQ, Goatley CHR, Bellwood DR (2013) The ontogeny of home ranges: evidence 3475
from coral reef fishes. Proceedings of Royal Society B 280:1-7 3476
Wiens JA (1992) Ecological flows across landscape boundaries: a conceptual overview. 3477
In: Hansen AJ, di Castri F (eds) Landscape boundaries: consequences for biotic 3478
diversity and ecological flows. Springer-Verlag, New York, pp217-235 3479
Williams AJ, Davies CR, Mapstone BD, Russ GR (2003) Scales of spatial variation in 3480
demography of a large coral-reef fish - an exception to the typical model? 3481
Fishery Bulletin 101:673-683 3482
Williams AJ, Davies CR, Mapstone BD (2005) Variation in the periodicity and timing 3483
of increment formation in red throat emperor (Lethrinus miniatus) otoliths. 3484
Marine and Freshwater Research 56:529-538 3485
Williams AJ, Davies CR, Mapstone BD (2006) Regional patterns in reproductive 3486
biology of Lethrinus miniatus on the Great Barrier Reef. Marine and 3487
Freshwater Research 57:403-114 3488

References
164
Williams AJ, Mapstone BD, Davies CR (2007a) Spatial and interannual patterns in 3489
growth of an exploited coral-reef fish Journal of Fish Biology 71:970-992 3490
Williams AJ, Mapstone BD, Davies CR (2007b) Spatial patterns in cohort-specific 3491
mortality of red throat emperor, Lethrinus miniatus, on the Great Barrier Reef. 3492
Fisheries Research 84:328-337 3493
Williams AJ, Little LR, Punt AE, Mapstone BD, Davies CR, Heupel MR (2010) 3494
Exploring movement patterns of an exploited coral reef fish when tagging data 3495
are limited. Marine Ecology Progress Series 405:87-99 3496
Williams DM, Russ GR (1994) Review of data on fishes of commercial and 3497
recreational fishing interest on the Great Barrier Reef Report to the Great 3498
Barrier Reef Marine Park Authority. Great Barrier Reef Marine Park Authority, 3499
Townsville 3500
Willis TJ, Badalamenti F, Milazzo M (2006) Diel variability in counts of reef fishes 3501
and its implications for monitoring. Journal of Experimental Marine Biology 3502
and Ecology 331:108-120 3503
Wurster CM, Patterson WP, Cheatham MM (1999) Advances in micromilling 3504
techniques: a new apparatus for acquiring high-resolution oxygen and carbon 3505
stable isotope values and major/minor elemental ratios from accretionary 3506
carbonate. Computers and Geosciences 25:1159-1166 3507
Zeller DC (1997) Home range and activity patterns of the coral trout Plectropomus 3508
leopardus (Serranidae). Marine Ecology Progress Series 154:65-77 3509
Zeller DC (1998) Spawning aggregations: patterns of movement of the coral trout 3510
Plectropomus leopardus (Serranidae) as determined by ultrasonic telemetry. 3511
Marine Ecology Progress Series 162:253-263 3512
Zuur AF, Ieno EN, Walker N, Saveliev AA, Smith GM (2009) Mixed effects models 3513
and extentions in ecology with R. Springer, New York 3514

Appendices
165
Appendices Chapter 103515
10.1 Appendix A 3516
Currey LM, Heupel MR, Simpfendorfer CA, Clark TD (2013) Blood lactate loads of 3517
redthroat emperor Lethrinus miniatus associated with angling stress and exhaustive 3518
exercise. Journal of Fish Biology 83: 1401–1406 3519

Journal of Fish Biology (2013) 83, 1401–1406
doi:10.1111/jfb.12216, available online at wileyonlinelibrary.com
Blood lactate loads of redthroat emperor Lethrinusminiatus associated with angling stress and exhaustive
exercise
L. M. Currey*†‡§, M. R. Heupel†‡, C. A. Simpfendorfer‡and T. D. Clark†‖
*AIMS@JCU, Townsville, Australia, †Australian Institute of Marine Science, PMB No 3,Townsville, Australia, ‡Centre for Sustainable Tropical Fisheries and Aquaculture, School of
Earth and Environmental Sciences, James Cook University, Townsville, Australia and ‖Schoolof Marine and Tropical Biology, James Cook University, Townsville, Australia
(Received 9 February 2013, Accepted 9 July 2013)
Baseline, post-angling and maximum attainable blood lactate concentrations were measured forthe fishery species redthroat emperor Lethrinus miniatus to gain insight into the condition of fishreleased following c. 30 s angling and <45 s air exposure. Mean ± s.d. baseline blood lactate was1·5 ± 0·6 mmol l−1, which increased and plateaued around 6 mmol l−1 at 15–30 min post-angling.These values were significantly lower than those obtained from fish maximally exhausted with aprolonged chase and air exposure protocol following capture (10·9 ± 1·8 mmol l−1), suggesting thatL. miniatus is not maximally exhausted during standard angling practices.
© 2013 The Fisheries Society of the British Isles
Key words: catch-and-release; fish; fisheries; post-release; stress physiology.
§Author to whom correspondence should be addressed. Tel.: +61 7 4781 4158; email: [email protected]
1401
© 2013 The Fisheries Society of the British Isles


