movement generation and trip distribution for freight
TRANSCRIPT
European Transport \ Trasporti Europei (2013) Issue 54, Paper n° 6, ISSN 1825-3997
1
Movement generation and trip distribution
for freight demand modelling applied to city logistics
Guido Gentile 1, Daniele Vigo
2
1 Università di Roma “La Sapienza”, Dipartimento di Ingegneria Civile Edile e Ambientale
Via Eudossiana 18 - 00184 Roma, Italy, [email protected] 2 Università di Bologna, Dipartimento di Ingegneria dell’Energia Elettrica e dell’Informazione
“Guglielmo Marconi”
Viale Risorgimento, 2 - 40136 Bologna, Italy, [email protected]
Abstract
The quantification of the freight movements disaggregated by supply chain occurring in each traffic
zone for the urban delivery of goods and that of the corresponding Origin-Destination trip tables is
essential to evaluate the effects of any city logistic policy in terms of vehicle congestion and polluting
emissions through the assignment of truck flows on the road network.
In this paper we propose two innovative demand models: the first one for movement generation, the
second one for trip distribution. The movement generation is addressed through an extension of the
category index model, which takes into account the hierarchy in the classification system of the economic
activities, thus avoiding aggregating the many existing classification codes into pre-specified groups. The
trip distribution is addressed through an adaptation of the gravity model, which takes into account that
deliveries are organized in tours.
This approach has been successfully applied to the case of Emilia-Romagna Region in Italy, where an
extensive campaign of surveys has permitted to calibrate both models for several towns and cities with various dimensions and vocations.
Keywords: urban delivery of goods, estimation of freight O-D matrices, category index model with
hierarchy, gravity model with tours.
1. Introduction
City logistics is concerned with the efficient transport of products from industrial and
stocking sites to retail local units, and then to offices and houses. To better understand
the problem, it is worth examining the physical itinerary of important items, such as
grocery and household articles, which generally make up more than one third of the
total freight traffic in urban areas (see, e g. Strauss-Wieder et al, 1989 or Danielis et al.,
2010). Since the main focus of this paper is the distribution within city centers affected
by relevant congestion problems, that in many cases have a dominant retailing vocation,
we simplify our description by considering only transportation of goods towards shops.
The goods are transported to the shops in the city by: private carriers, the manufacturing
European Transport \ Trasporti Europei (2013) Issue 54, Paper n° 6, ISSN 1825-3997
2
companies themselves or the shops in own account; logistic service providers, each
owning a large fleet of vehicles to provide the delivery service(such as third and fourth-
party logistics providers, 3PL and 4PL), autonomous transporters, small operators often
owning a single truck. Along this journey, transshipment may occur at logistic centers,
located near or within the city, where load rearrangement is performed; here the goods
are dropped off from heavy trucks, possibly stocked, and then transferred to smaller
vehicles for the distribution in town. These flows of goods are organized into different
supply chains depending on their characteristics and service requirements, e.g., fresh
foods, frozen foods, dry foods, household articles (Browne and Gomez, 2011; Danielis
et al., 2013). In the last step, which is not addressed in this paper, the goods are
purchased by final consumers who personally bring them home.
City logistics may be analyzed by two different points of view, each one rising
different problems. For logistic agencies the most relevant aspect is that of minimizing
the shipment industrial costs. Therefore, one of the main issue is that of finding the
optimal routes to be used by the vehicles providing the delivery service. Vehicle
Routing Problems (VRPs) have been extensively studied in the context of Operations
Research and several algorithms have been proposed in the literature (for recent surveys
see: Toth and Vigo, 2002; Cordeau et al., 2007, Golden et al., 2008). Vehicle routing
models are highly disaggregated and require fine-grained data on demand distribution
and on the service specifications. The existing tools for pickup and delivery planning
are conceived for supporting the operational management of a city logistic service, or
for analyzing mid-term problems such as fleet sizing.
For the Public Administrations the most important aspect is instead that of moderating
the social costs generated by freight mobility in the urban area. These are primarily
connected with the impact on traffic congestion of the vehicles circulating for delivery
tours, as well as with the road capacity reductions caused by the stationary vehicles for
loading or unloading operations, often caused by illegal parking of private cars in
double line or on dedicated delivery bays (see e.g., Routhier, 2002, and FREILOT,
2012). In the following we will call such loading and unloading operations also
movements. Then the problem consists either in positioning new logistic centres or in
establishing effective policies for the regulation of freight traffic. This latter option may
be implemented by imposing temporal and/or spatial limitations to the circulation
and/or parking of trucks as well as by creating dedicated stopping areas to let freight
vehicles perform the movements.
The quantification of freight demand in terms of movements and flows on each link of
the road network due to the urban delivery of goods is essential for evaluating the
effects of any city logistic policy. In the following we briefly review the main
approaches that were proposed in the literature to model the transport of goods in the
urban case. For a detailed survey the reader is referred to Anand et al. (2012), Comi et
al. (2012), Gonzalez-Feliu and Routhier (2012), Gonzalez-Feliu et al. (2012), Holguín
Veras et al. (2012), as well as to the extensive bibliography compiled by the Oak Ridge
National Laboratory (2004) for the Freight Model Improvement Program.
In general, the demand models used in the context of freight distribution can be
classified into three main types: gravity (Hutchinson, 1974; Ogden, 1992; Taylor, 1997;
He and Crainic, 1998; Gorys and Hausmanis, 1999), spatial price equilibrium
(Oppenheim, 1995; Nagurney, 1999), and input-output (Harris and Liu, 1998; Marzano
and Papola, 2004). In all these cases, the resulting O-D matrices can be adjusted to
match truck link flows. The above approaches seem to be more suitable for regional and
European Transport \ Trasporti Europei (2013) Issue 54, Paper n° 6, ISSN 1825-3997
3
national planning, than to the context of urban freight shipment, since many factors (e.g.
historical traditions, city structure) beside accessibility influence the location of shops.
Note also that such models refers mainly to the distribution step, whereas those used in
the context of people’s movements generally refers to the demand generation at origins
or consider integrated approaches. Few practical implementations of demand models for
urban freight distribution, such as that described in this paper, are available nowadays
and are reviewed in the next Section 1.
Gravity models may be further divided into truck-based and commodity-based
approaches. Truck-based models (Zavettero and Waseman, 1981; Habib, 1985; Ogden,
1977; Slavin, 1976) yield a direct estimation of trip rates, but suffer transferability
problems. Although the average quantities of consumed goods per inhabitant usually do
not vary too much from one city to another in a same country, the organization of
logistics in terms of shop and truck dimensions may indeed differ considerably. This
observation, which is consistent with the survey results used in our study is also
addressed by Gerardin et al. (2000), and Gonzalez-Feliu et al. (2013).
Commodity-based models (Taniguchi and Thompson, 1999, 2003, 2006; Holguin-
Veras and Thorson, 2000) estimate the quantity of goods sold in each traffic zone
(which is strictly correlated to the number of employees in the commerce sector), under
the assumption that consumer demand (which is instead related to the number of
residents) must be satisfied, thus reproducing the process of acquisition and
consumption of goods. As a counterpart, commodity-based models require a loading
model to convert the tons of goods into the number of vehicle trips (Noortman, 1984,
for example, uses a fixed share of the truck capacity, which may vary according to the
commodity type, although such a simplification is not acceptable for most of the goods
travelling in the urban context, as observed by Button and Pearman, 1981), and to take
into account complementary empty trips (as described, for example, in: Hautzinger,
1984; Holguín-Veras and Thorson, 2003a, 2003b; Holguín-Veras et al., 2005).
In addition to trucks and commodities, alternative units to describe freight transport
are also routes (see, e.g., Sonntag, 1985 or Hunt and Stefan, 2007), trips (Ogden, 1992;
Bera and Rao, 2011) and movements as used in this paper, in the Freturb software (see
Routhier and Aubert, 1999) and in Nuzzolo et al. (2012), among others.
In practice, most demand models for urban freights are based on the same “four-
steps” sequential approach (generation, distribution, modal split, and assignment) used
for passenger transport. For example, the demand generation and attraction of every
supply chain is first determined for each traffic zone through a regression model, then a
gravity model for distribution is applied to obtain an Origin-Destination (O-D) matrix to
be assigned on the road network taking into account access restrictions, while mode
choice usually reduces to the vehicle dimensioning which depends strongly on the
supply chain.
This classical approach involves two open questions. The first one is intrinsic in the
approximation introduced by arbitrarily aggregating the many different economic
activities into a few groups of categories. The second one lays in the fact that many
deliveries are performed by a commercial vehicle within the same tour, so that before
assigning the demand flows to the network one has to transform the pickups and
deliveries into an O-D matrix of direct truck trips. Both issues will be addressed in this
paper and new solutions will be proposed. In particular, our main contributions are two
innovative demand models: the first one for movement generation, the second one for
trip distribution. The movement generation is addressed through an extension of the
European Transport \ Trasporti Europei (2013) Issue 54, Paper n° 6, ISSN 1825-3997
4
category index model, which takes into account the hierarchy in the classification
system of the economic activities, thus avoiding to aggregate the many existing
classification codes into pre-specified groups. The trip distribution is addressed through
an adaptation of the gravity model, which takes into account that deliveries are
organized in tours.
The paper is organized as follows. In the next section, we outline the overall approach
underlying the proposed models. In Section 2 we describe the generation model,
whereas in Section 3 we describe the distribution model. Finally, Section 4 presents the
application of the methodology to the city of Bologna, capital of the Emilia-Romagna
Region. Section 5 draws some conclusions.
2. The overall approach for impact evaluation
The quantification of the external effects produced by freight mobility in urban areas
is currently an important field of research but, in contrast to what happened with people
mobility, no consolidated methodology of analysis is yet available. In order to fill this
gap some attempts were recently carried out in Europe. The information collected from
some German towns within the Bestufs Project, financed by the European Union, led to
the Wiver model (Meimbresse and Sonntag, 2001), now integrated within the Viseva
software package (Friedrich et al., 2003). Other examples of practical models are the
Good Trip model (Boerkamps and Van Binsbergen, 1999) developed in The
Netherlands, and the VENUS software (Janssen and Vollmer, 2005) produced by IVV
Aachen.
The French Government promoted the development at the Laboratoire d’Economie
des Transportes in Lyon of the Freturb model (Routhier and Aubert, 1999; Ambrosini
and Routhier, 2004, Routhier and Toilier, 2007). In this latter case, the statistical
analysis of the data collected through surveys performed in three important cities
(Marseilles, Bordeaux and Dijon) produced an overall model that allows for evaluating
a set of impact indicators, based on the average number of movements made by each
category of economic activity as a function of the employees. Demand generation in
Freturb is related to all premises since also end-users movements are considered. For
example, to evaluate the occupation of parking slots for freight movements it is assumed
that the total number of stopping hours spent within a given traffic zone is the sum, over
all categories of shops and vehicle types, of the products among: a) the number of
premises belonging to that category present in the zone; b) the number of movements
each shop generates for that type of vehicle; c) the average duration of such movements;
and d) an equivalence factor typical of the vehicle, for example, related to the travelled
distance or the number of stops.
In this paper we present a new model for the analysis of urban freight demand and the
evaluation of its external effects, which originates from the intensive collaboration
between the authors and the Council on Transportation of the Emilia-Romagna Region
in Italy. There, an extensive survey has been promoted in the years 2004-5, partially
financed by European Projects CityPorts and Merope, on the logistic activities in ten
(out of fourteen) towns with more than 50,000 inhabitants. Almost all surveys have
been performed according to the methodology developed within the CityPorts Project,
where the phenomenon of urban freight shipment is faced from different points of view,
thus including specific interviews to: commercial local units, logistic operators, and
truck drivers. The surveys collected more than 1700 interviews to shops and other
relevant premises (covering between 1% and 10% of the overall universe), 80 logistic
European Transport \ Trasporti Europei (2013) Issue 54, Paper n° 6, ISSN 1825-3997
5
operators and more than 3500 vehicles (see Section 4 for additional details on the
surveys). Each interview collected detailed information of the characteristics of the
movements (regular and irregular) that interested the premise for all possible Supply
Chain in a time horizon of a week, leading to several hundreds of movements analyzed
for each surveyed town. The result is an extensive and homogeneous data source that
represents an interesting modeling opportunity.
The CityPorts Project proposes a methodological framework for the planning of
initiatives to support city logistics, such as new transshipment infrastructures or
regulatory policies. Any specific logistic action affects only a subset of Traffic Zones
(TZ) and of Supply Chains (SC). Its relative impact can then be measured through the
so called TZ-SC matrix (Gentile and Vigo, 2006), whose generic element yields the total
number of, say annual, movements for a given supply chain in a certain traffic zone. For
example, access restrictions to freight vehicles may be applied to the city center and not
to other zones, while a logistic center may serve only a part of the whole town and some
supply chains. Therefore, the overall impact of a logistic action may be easily
determined by computing the total number of movements that it “covers” on the TZ-SC
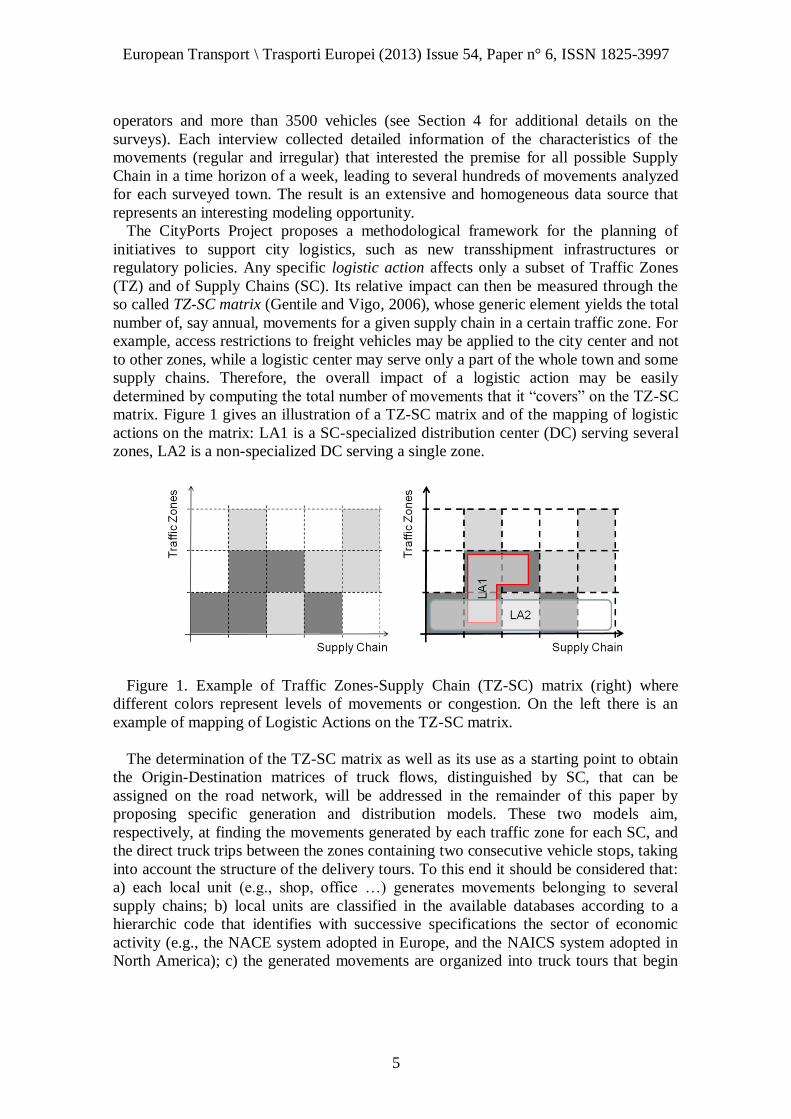
matrix. Figure 1 gives an illustration of a TZ-SC matrix and of the mapping of logistic
actions on the matrix: LA1 is a SC-specialized distribution center (DC) serving several
zones, LA2 is a non-specialized DC serving a single zone.
Figure 1. Example of Traffic Zones-Supply Chain (TZ-SC) matrix (right) where
different colors represent levels of movements or congestion. On the left there is an
example of mapping of Logistic Actions on the TZ-SC matrix.
The determination of the TZ-SC matrix as well as its use as a starting point to obtain
the Origin-Destination matrices of truck flows, distinguished by SC, that can be
assigned on the road network, will be addressed in the remainder of this paper by
proposing specific generation and distribution models. These two models aim,
respectively, at finding the movements generated by each traffic zone for each SC, and
the direct truck trips between the zones containing two consecutive vehicle stops, taking
into account the structure of the delivery tours. To this end it should be considered that:
a) each local unit (e.g., shop, office …) generates movements belonging to several
supply chains; b) local units are classified in the available databases according to a
hierarchic code that identifies with successive specifications the sector of economic
activity (e.g., the NACE system adopted in Europe, and the NAICS system adopted in
North America); c) the generated movements are organized into truck tours that begin
European Transport \ Trasporti Europei (2013) Issue 54, Paper n° 6, ISSN 1825-3997
6
and end at given portals (logistic centers, or access roads to town) and may serve local
units in several traffic zones.
The CityPorts surveys that we used as a base for the development and tuning of our
models confirmed the above remarks. Several SCs were identified a priori according to
their relevance in the movements of towns under study, the important of which are:
• Clothes and accessories
• Food (subdivided into Fresh, non Fresh and Frozen as separate SCs)
• Household and electrics
• Newspapers
• Pharmaceuticals
• Wholesale and department stores
• Other non specialized retail
• Services
• Documents
• Reverse logistics
For each surveyed premise where an local unit is located, the questionnaire collected
all data on the movements it possibly generated for each such SCs within a weekly time
horizon. Thus the NACE code of the local unit may provide a link between premises
and movement generation for different SCs.
The main difficulty of performing a statistical analysis to determine the number of
movements for each SC generated by every type of activity is represented by the fact
that, generally, the classification systems include hundreds of different codes (e.g., in
the NACE system they are more than 1500). Therefore, the activity codes are typically
partitioned into groups, or categories, and an average for each group is retrieved from a
sample of local units. However, when many categories are defined one cannot expect
the sample to cover uniformly and satisfactorily each group. In our case, this happened
because of the relatively limited size of the sample for each town dictated by the
available budget for the survey activities.
Category index models are an evolution of the above simple aggregation approach.
The main idea is to take into consideration the correlation among categories, if present,
so as to provide a better estimate for groups that are not adequately covered by the
sample. The classical case is when the categories are defined on the basis of several
discrete attributes (continuous variables can be handled by defining suitable intervals),
and the correlation among categories arises naturally from having the same value for
some attribute. In our case, apparently there is only one attribute available, namely the
activity code; however, we can consider the single digits forming the code as separate
attributes, each one identifying a successive specification of the economic sector.
In this paper we introduce a new demand generation model for the determination of
urban freight movements that extends the category index approach, thus avoiding any a-
priori aggregation of activity codes into a predefined number of groups. The proposed
model is based on the explicit consideration of the tree-based structure adopted by most
classification systems for local units, that typically include a progressive level of
disaggregation represented by the subsequent digits in the code associated with each
economic activity. We then assume that the correlation among categories depends on
their topological relationship by exploiting the hierarchical structure of one explanatory
attribute: the activity code. More specifically, the main assumption is that the number of
movements generated by a given activity code is correlated with those generated by
European Transport \ Trasporti Europei (2013) Issue 54, Paper n° 6, ISSN 1825-3997
7
activity codes that are associated with its descendant and ascendant nodes in the
classification tree, i.e., those representing its disaggregation or aggregation.
The second contribution of this paper is a distribution model that implements the
gravity paradigm in the case of urban freights, taking into account the average number
of deliveries made along shipping routes of each supply chain. Every route of a vehicle
serving a certain supply chain is assumed to begin at some portal, make a specific
number of stops to perform the deliveries (or the pickups, in the case of reverse
logistics), and end at the same portal. Therefore every section of the tour between two
successive stops, including the first and the last leg from and to the portal respectively,
shall be associated with a direct trip in the O-D matrix from the traffic zone of the
previous stop to the traffic zone of the following stop. In other words, each movement
occurring in a given traffic zone shall be associated with one direct trip that terminates
in that zone and with another direct trip that originates in the same zone. These tours are
associated with the different portals proportionally to their relative importance,
measured for example by the truck traffic that they generate. Then, the number of direct
trips originating and terminating at each portal is equal to the number of tours associated
with it. The probability that a tour leaving a given zone will reach another zone through
a direct trip is assumed to decrease with the distance on the network between the two
zones, for example measured by the generalized travel cost, thus implementing the
gravity paradigm.
The two demand models, along with a classical assignment model, have been
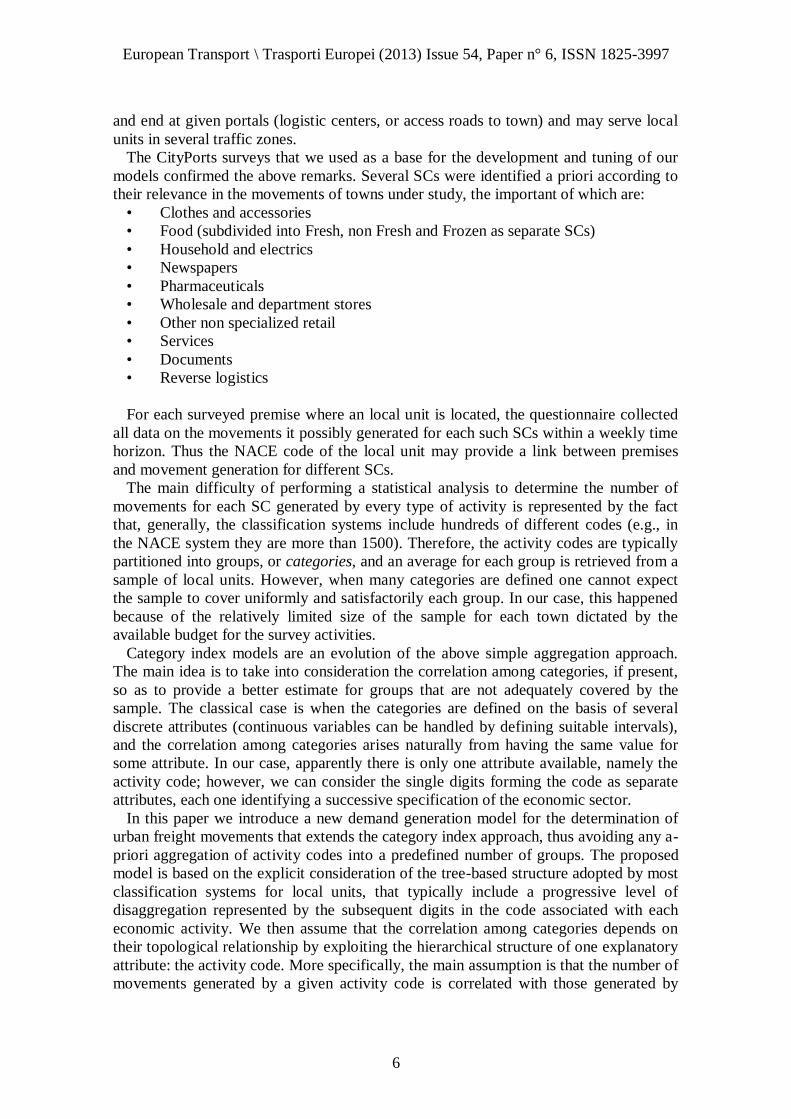
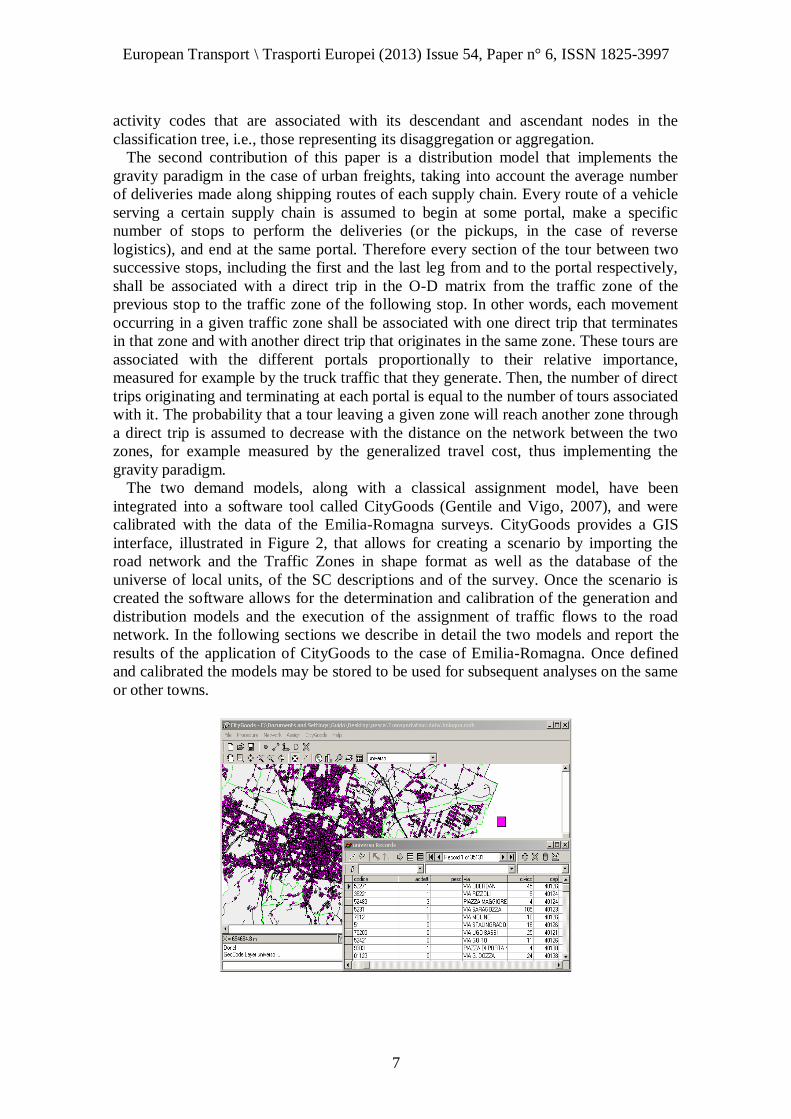
integrated into a software tool called CityGoods (Gentile and Vigo, 2007), and were
calibrated with the data of the Emilia-Romagna surveys. CityGoods provides a GIS
interface, illustrated in Figure 2, that allows for creating a scenario by importing the
road network and the Traffic Zones in shape format as well as the database of the
universe of local units, of the SC descriptions and of the survey. Once the scenario is
created the software allows for the determination and calibration of the generation and
distribution models and the execution of the assignment of traffic flows to the road
network. In the following sections we describe in detail the two models and report the
results of the application of CityGoods to the case of Emilia-Romagna. Once defined
and calibrated the models may be stored to be used for subsequent analyses on the same
or other towns.
European Transport \ Trasporti Europei (2013) Issue 54, Paper n° 6, ISSN 1825-3997
8
Figure 2. Screenshot of CityGoods software showing the distribution of the universe.
3. The generation model
In this section we describe a generation model aimed at the estimation of the number
of movements produced by each local unit for freight deliveries (or residuals pick-ups)
of different supply chains. It should be noted that in the case of urban logistics the
movement generators are actually the destinations of the goods, i.e., the shops, if we
refer to shipments, whereas in modeling passenger demand the traffic generators are
typically the origins, i.e., the homes, if we refer to morning commuters; the opposite is
true if we consider collection activities and afternoon return trips.
As introduced in the previous sections, the model is an extension of a category-index
approach whose main characteristic is that it does not require any a-priori aggregation
of the economic activities into categories. In classical models generation is indeed based
either on mean values or on a-priori aggregations of activities into categories, often
using standard aggregation patterns from the literature that map into each such category
sets of codes of the activity classification system adopted by most countries to identify
the economic activities in census statistics.
Our model explicitly associates movement generation to a fine-grained classification,
such as that informing the activity classification systems. Such systems have normally a
hierarchic structure, topologically represented by a tree structure, which reflects the
progressive disaggregation of economic sectors into sub-sectors. More specifically, each
disaggregation level is associated with an additional digit of the code that identifies the
economic activity in the system. For example, the Italian specification of the NACE
system, called ATECO, identifies 15 main categories further disaggregated into sub-
categories with up to five hierarchic levels. The main assumption of this fine-grained
approach is that a correlation exists between the movement generated by activities
whose codes are belonging to the same branch of the classification tree. Once the
movement generation is determined for each code of the tree it is easy to re-aggregate
them into a-priori categories. The computational validation on the Emilia-Romagna
sample data, described later in this section, shows that our approach is not only simple
and fast to be applied but it provides considerably more accurate results than classical
methods from the literature.
2.1 Detailed description of the generation models
We now give the formal description of two variants of the generation model. For the
sake of simplicity we refer our analysis to generic movements, although in practice we
shall build a specific model for each SC, given that every category may produce
movements of several SCs. To this end, we simply must add a SC-related index to all
movement variables in the formulas reported below.
Given an economic activity classification system, the topological relationship between
a sub-category and its immediate aggregation in the higher level is clearly unique, i.e.,
each sub-category is originated from the disaggregation of a single category. Hence, as
previously observed the classification system may be suitably represented as a tree T =
(C, B), i.e., an acyclic oriented graph, where the set C includes a node for every
category plus a special root node r. The latter is the only node with no entering
branches, while all the other nodes have a single entering branch. The final nodes of the
branches exiting from the root represent the main categories, which can be considered
European Transport \ Trasporti Europei (2013) Issue 54, Paper n° 6, ISSN 1825-3997
9
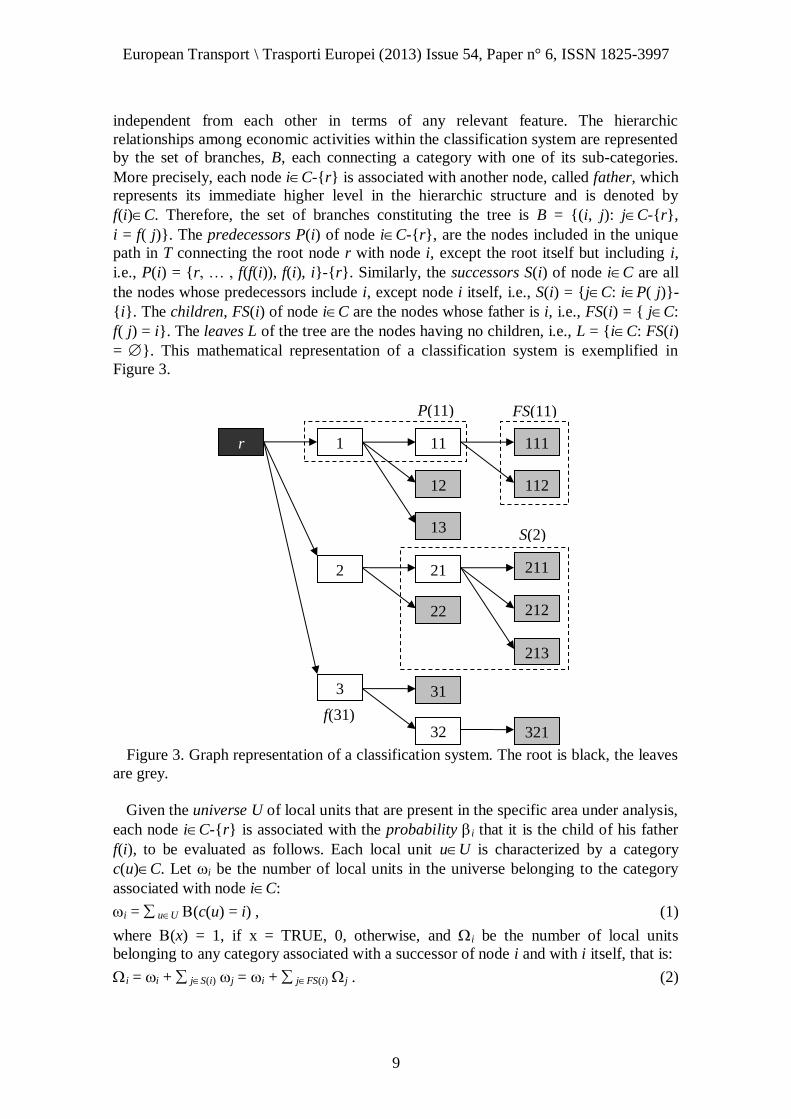
independent from each other in terms of any relevant feature. The hierarchic
relationships among economic activities within the classification system are represented
by the set of branches, B, each connecting a category with one of its sub-categories.
More precisely, each node iC-{r} is associated with another node, called father, which
represents its immediate higher level in the hierarchic structure and is denoted by
f(i)C. Therefore, the set of branches constituting the tree is B = {(i, j): jC-{r},
i = f( j)}. The predecessors P(i) of node iC-{r}, are the nodes included in the unique
path in T connecting the root node r with node i, except the root itself but including i,
i.e., P(i) = {r, … , f(f(i)), f(i), i}-{r}. Similarly, the successors S(i) of node iC are all
the nodes whose predecessors include i, except node i itself, i.e., S(i) = {jC: iP( j)}-
{i}. The children, FS(i) of node iC are the nodes whose father is i, i.e., FS(i) = { jC:
f( j) = i}. The leaves L of the tree are the nodes having no children, i.e., L = {iC: FS(i)
= }. This mathematical representation of a classification system is exemplified in
Figure 3.
Figure 3. Graph representation of a classification system. The root is black, the leaves
are grey.
Given the universe U of local units that are present in the specific area under analysis,
each node iC-{r} is associated with the probability i that it is the child of his father
f(i), to be evaluated as follows. Each local unit uU is characterized by a category
c(u)C. Let i be the number of local units in the universe belonging to the category
associated with node iC:
i = uU (c(u) = i) , (1)
where (x) = 1, if x = TRUE, 0, otherwise, and i be the number of local units
belonging to any category associated with a successor of node i and with i itself, that is:
i = i + jS(i) j = i + jFS(i) j . (2)
12
r
13
22
2
1
3
111
31
32
112
211
212
321
213
21
11
S(2)
P(11) FS(11)
f(31)
f
European Transport \ Trasporti Europei (2013) Issue 54, Paper n° 6, ISSN 1825-3997
10
Then, the probability i is computed as:
i = i / jFS( f(i)) j = i / (f(i) - f(i)) . (3)
The number of local units i and the probabilities i may be computed in linear time
by visiting the tree in reverse topological order, i.e., from the leaves up to the root. We
can then define the relationship ji of any successor jS(i) of node iC with i itself as
the probability that j is the descendant of i, expressed as a product of conditional
probabilities at nodes:
ji = hP(j)-P(i) h . (4)
The main assumption of the generation model we propose is that the number of
movements associated with a given activity code of the classification system, i.e., with a
given node of the tree, is correlated with the number of movements generated by the
codes of its predecessors and successors nodes. To specify the form of this correlation,
we assume that a non-negative number of movements mj is associated with each branch
of the tree (f(j), j), jC-{r}. Then, the number of movements Mi generated by the
generic node iC in the reference period (e.g. one year) is obtained by adding two
different terms: Hi , given by the sum of the movements associated with the branches
entering each predecessor jP(i) of i, and Wi , given by the sum of the movements
associated with the branches entering each successor jS(i) of i suitably weighted by
their relationship ji with i.
In other words, the main output of the model are the number of movements Mi
produced by each node of the tree, which are correlated among each other due to the
hierarchic structure of the classification system. But the relevant independent variables
to be estimated are the number of movements mj associated with each branch of the tree,
that express the contribution to the demand generation common to node j and to all and
only its successors. Indeed, each branch of the tree represents an additional specification
of economic activity that identifies a category, and thus contributes with a specific
number of movements to its demand generation as well as to those of all the sub-
categories obtained through its further disaggregation. Based on the above assumptions
any portion of the classification system relative to each main category is independent
from the others in terms of movement generation.
In formal terms, we assume that for each iC it is:
Mi = Hi + Wi , (5)
where
Hi = jP(i) mj , (6)
Wi = 0, if iL, and Wi = jS(i) ji mj , otherwise. (7)
To clarify the physical interpretation of the model we can observe that: a) the number
of movements generated by a leaf is given by the sum of the movements associated with
the branches entering its predecessors; b) the correlation among two leaves is given by
the sum of the movements associated with the overlapping branches in the two paths
connecting the root to them; c) a node which is not a leaf synthesizes all the leaves in its
successors, indeed it generates the average number of movements relative to the leaves
in its successors weighted by the relationship of each leaf with it.
Assertions a) and c) are formally expressed by the following equations:
Mi = jP(i) mj , iL, (8)
Mi = jS(i)L ji Mj , iC-L. (9)
European Transport \ Trasporti Europei (2013) Issue 54, Paper n° 6, ISSN 1825-3997
11
While (8) derives directly from the model (5)-(7), (9) could be easily proved through
a recursive argumentation.
For the two contributions, respectively, we can state the following local and recursive
formula:
Hr = 0 , Hi = mi + Hf(i) iC-{r} , (10)
Wi = 0, iL ; Wi = jFS(i) j (mj + Wj), iC-L . (11)
Indeed, it is:
Hi = mi + jP(f(i)) mj , (12)
Wi = kFS(i) k jS(k)L ( hP(j)-P(k) h) (mk + hP(j)-P(k) mh) . (13)
The triangular system (10) can be solved by processing the nodes in topological order,
while the triangular system (11) can be solved by processing the nodes in reverse
topological order. On this basis the model can be solved in linear time.
The system (5)-(7) expressing the dependent variables Mi in terms of the independent
variables mj is linear. Therefore we can also write:
Mi = jC ij mj , iC , in compact form M = m , (14)
where ij represents the unit contribution of mj to Mi , which can be determined as
follows.
Three different cases may occur:
a) j P(i)S(i) , then ij = 0;
b) jP(i) , from (6) we have that ij = 1;
c) jS(i) , from (7) we have that ij = ji.
The matrix can be computed directly from the probabilities i without introducing
explicitly the relationships ji as shown in the algorithm presented below.
= 0
for each iC
= 1
j = i
until j = r
= j
ij = 1
j = f( j)
loop
next i
The formulation as a linear system turns out to be useful for the calibration of the
model. Let yq be the movements generated by the generic element qQ of the sample
QU. The calibration process can be addressed by solving the following least square
problem through the algorithm NNLS - Non-Negative Least Squares of (Lawson and
Hanson, 1995):
min{||y - m||2: m 0} , (15)
where = [c(1)T , … , c(q)
T, … , c(|Q|)
T]
T, i is the generic i-th row of matrix , with
iC, and y = (y1 , … , yq , … , y|Q|)T. The proposed model introduces many
parameters to be determined. However, in practice the number of movements associated
with a branch is left to zero by the calibration process whenever no element of the
European Transport \ Trasporti Europei (2013) Issue 54, Paper n° 6, ISSN 1825-3997
12
sample requires to introduce that specific disaggregation for distinguishing its category
from those in the rest of the sample. In such a case, the number of movements generated
by that category is equal to the number of movements generated by its father.
The proposed model can be considered a particular application of the category index
approach, since for each economic activity we deduce the rate of freight movements
produced for every supply chain by averaging the sample data through a procedure that
introduces a correlation among the activity codes of the categories, taking into account
the hierarchic structure of the classification system.
As previously described, this model does not exploit any information about the local
unit other than its activity code to explain the magnitude of the generation phenomenon.
A major improvement can then be achieved by considering some attribute expressing
the dimension of the local unit, such as the number of employees or the available selling
surface. The proposed approach is easily extended to obtain a linear model with respect
to a given size function (see Ben Akiva and Lerman, 1985) E as follows:
Mi + E Xi = jC ij (mj + E xj) , iC ,
in compact form M + E X = (m + E x) . (16)
In this version of the model the variable Mi expresses the minimum number of
movements that local units of the category associated to node iC generate in any case
regardless of their dimension, whereas Xi expresses the additional number of
movements generated per each dimension unit, while the variables mi and xi referred to
the branches entering node i allow to express the correlation among M and X,
respectively, in terms of independent variables.
The calibration problem becomes:
min{||y - [, diag(E) ] [mT, x
T]T||
2: m 0, x 0}. (17)
where Eu is the dimension attribute of the generic local unit uU, and E = (E1 , … , Eq ,
… , E|Q|)T are the dimension attributes of the sample Q.
Once we have calibrated our disaggregated model, which allows to associate a
number of generated movements to each local unit given its economic activity and
possibly its dimension, the application to a study area typically requires to aggregate the
movements generated by all local units present in a single traffic zone zZ, where Z
denotes the set of zones in which the study area is partitioned. Let z(u)Z be the zone
where the generic unit uU is located. Since each local unit generates a yearly number
of movements Mc(u) + Eu Xc(u) , the total number of movements Dz generated in the
generic traffic zone zZ is:
Dz = uU: z(u) = z Mc(u) + Eu Xc(u) . (18)
2.2 Validation
The proposed model has been validated on a dataset of 315 surveys carried out in the
framework of the CityPort European Project to assess the movements produced by retail
shops (i.e., the sub-tree rooted at code 52 of the NACE tree) in the city center of
Bologna, Italy. The validation has been performed by randomly choosing a subset of the
surveys, including 5%, 10%, 20%, or 50%, of the whole sample. Our model without
size function factors (e.g., employees), is calibrated on the complementary fraction of
the sample (i.e., the remaining 95%, 90%, 80% and 50% samples not in the validation
set), and the output is compared with the actual values. This process is repeated 1000
times for each size of the sample subset and only total movements are considered for the
European Transport \ Trasporti Europei (2013) Issue 54, Paper n° 6, ISSN 1825-3997
13
comparison; indeed a model based solely on the activity code may not provide an
accurate estimation for the single shop. This is consistent with the actual need of
proving the quality of the method at a rather aggregated level, since in practice it will be
applied to estimate the movements generated by all shops of a given traffic zone.
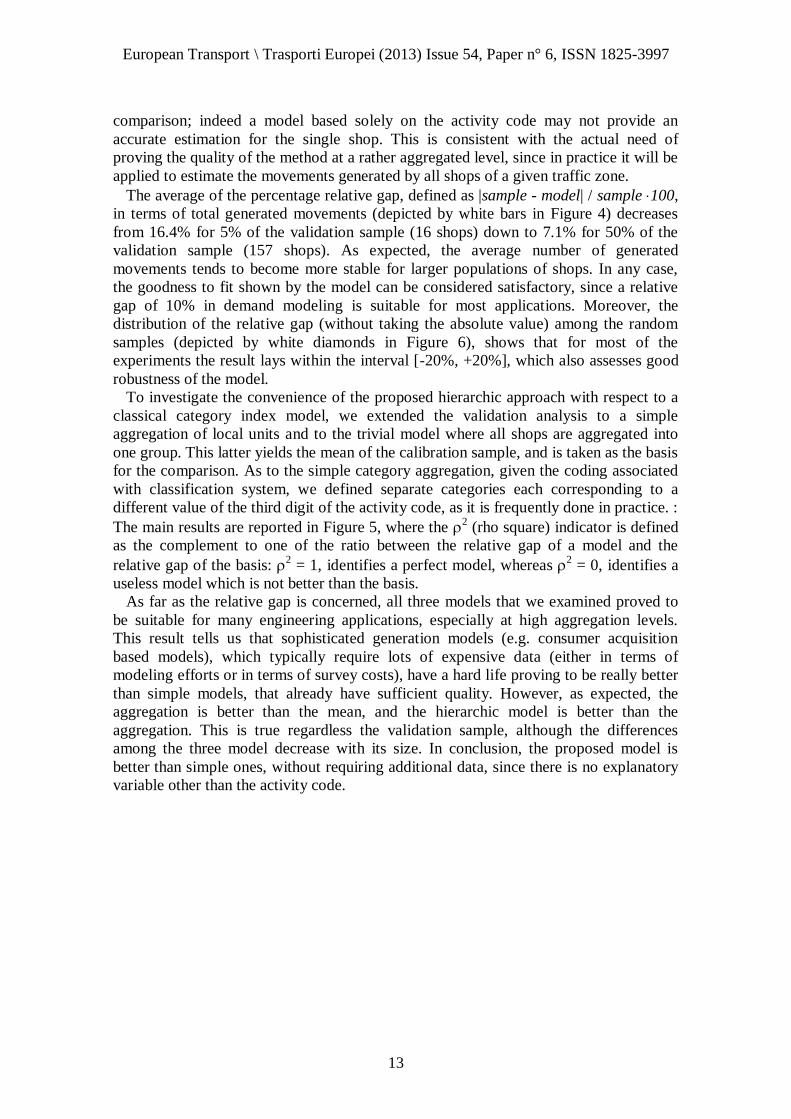
The average of the percentage relative gap, defined as |sample - model| / sample 100,
in terms of total generated movements (depicted by white bars in Figure 4) decreases
from 16.4% for 5% of the validation sample (16 shops) down to 7.1% for 50% of the
validation sample (157 shops). As expected, the average number of generated
movements tends to become more stable for larger populations of shops. In any case,
the goodness to fit shown by the model can be considered satisfactory, since a relative
gap of 10% in demand modeling is suitable for most applications. Moreover, the
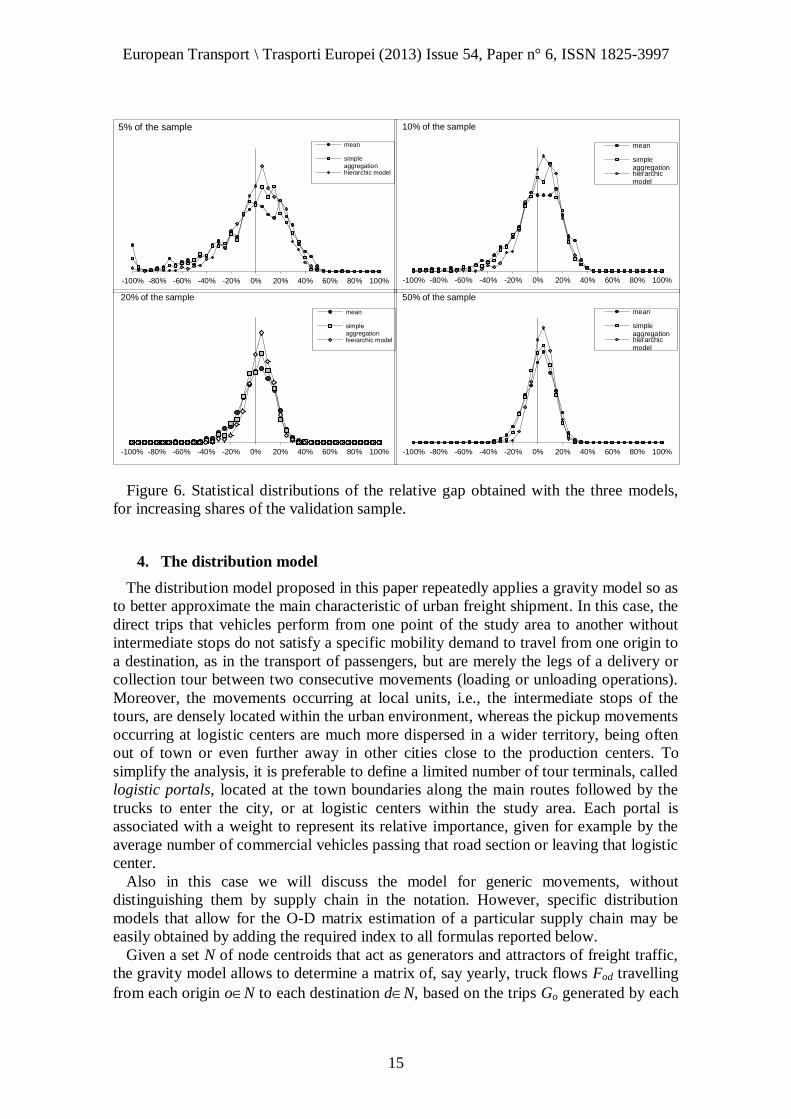
distribution of the relative gap (without taking the absolute value) among the random
samples (depicted by white diamonds in Figure 6), shows that for most of the
experiments the result lays within the interval [-20%, +20%], which also assesses good
robustness of the model.
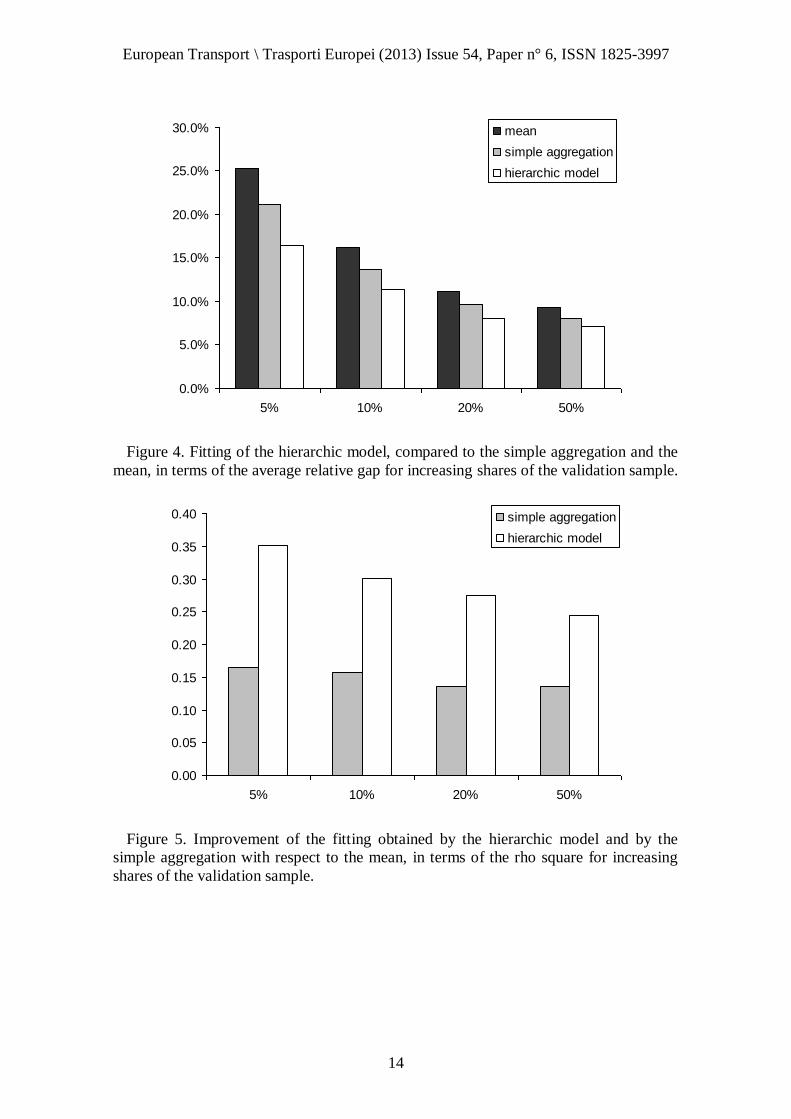
To investigate the convenience of the proposed hierarchic approach with respect to a
classical category index model, we extended the validation analysis to a simple
aggregation of local units and to the trivial model where all shops are aggregated into
one group. This latter yields the mean of the calibration sample, and is taken as the basis
for the comparison. As to the simple category aggregation, given the coding associated
with classification system, we defined separate categories each corresponding to a
different value of the third digit of the activity code, as it is frequently done in practice. :
The main results are reported in Figure 5, where the 2 (rho square) indicator is defined
as the complement to one of the ratio between the relative gap of a model and the
relative gap of the basis: 2 = 1, identifies a perfect model, whereas
2 = 0, identifies a
useless model which is not better than the basis.
As far as the relative gap is concerned, all three models that we examined proved to
be suitable for many engineering applications, especially at high aggregation levels.
This result tells us that sophisticated generation models (e.g. consumer acquisition
based models), which typically require lots of expensive data (either in terms of
modeling efforts or in terms of survey costs), have a hard life proving to be really better
than simple models, that already have sufficient quality. However, as expected, the
aggregation is better than the mean, and the hierarchic model is better than the
aggregation. This is true regardless the validation sample, although the differences
among the three model decrease with its size. In conclusion, the proposed model is
better than simple ones, without requiring additional data, since there is no explanatory
variable other than the activity code.
European Transport \ Trasporti Europei (2013) Issue 54, Paper n° 6, ISSN 1825-3997
14
Figure 4. Fitting of the hierarchic model, compared to the simple aggregation and the
mean, in terms of the average relative gap for increasing shares of the validation sample.
Figure 5. Improvement of the fitting obtained by the hierarchic model and by the
simple aggregation with respect to the mean, in terms of the rho square for increasing
shares of the validation sample.
0.0%
5.0%
10.0%
15.0%
20.0%
25.0%
30.0%
5% 10% 20% 50%
mean
simple aggregation
hierarchic model
0.00
0.05
0.10
0.15
0.20
0.25
0.30
0.35
0.40
5% 10% 20% 50%
simple aggregation
hierarchic model
European Transport \ Trasporti Europei (2013) Issue 54, Paper n° 6, ISSN 1825-3997
15
Figure 6. Statistical distributions of the relative gap obtained with the three models,
for increasing shares of the validation sample.
4. The distribution model
The distribution model proposed in this paper repeatedly applies a gravity model so as
to better approximate the main characteristic of urban freight shipment. In this case, the
direct trips that vehicles perform from one point of the study area to another without
intermediate stops do not satisfy a specific mobility demand to travel from one origin to
a destination, as in the transport of passengers, but are merely the legs of a delivery or
collection tour between two consecutive movements (loading or unloading operations).
Moreover, the movements occurring at local units, i.e., the intermediate stops of the
tours, are densely located within the urban environment, whereas the pickup movements
occurring at logistic centers are much more dispersed in a wider territory, being often
out of town or even further away in other cities close to the production centers. To
simplify the analysis, it is preferable to define a limited number of tour terminals, called
logistic portals, located at the town boundaries along the main routes followed by the
trucks to enter the city, or at logistic centers within the study area. Each portal is
associated with a weight to represent its relative importance, given for example by the
average number of commercial vehicles passing that road section or leaving that logistic
center.
Also in this case we will discuss the model for generic movements, without
distinguishing them by supply chain in the notation. However, specific distribution
models that allow for the O-D matrix estimation of a particular supply chain may be
easily obtained by adding the required index to all formulas reported below.
Given a set N of node centroids that act as generators and attractors of freight traffic,
the gravity model allows to determine a matrix of, say yearly, truck flows Fod travelling
from each origin oN to each destination dN, based on the trips Go generated by each
-100% -80% -60% -40% -20% 0% 20% 40% 60% 80% 100%
5% of the sample
mean
simpleaggregationhierarchic model
-100% -80% -60% -40% -20% 0% 20% 40% 60% 80% 100%
10% of the sample
mean
simpleaggregationhierarchicmodel
-100% -80% -60% -40% -20% 0% 20% 40% 60% 80% 100%
20% of the sample
mean
simpleaggregationhierarchic model
-100% -80% -60% -40% -20% 0% 20% 40% 60% 80% 100%
50% of the sample
mean
simpleaggregationhierarchicmodel
European Transport \ Trasporti Europei (2013) Issue 54, Paper n° 6, ISSN 1825-3997
16
origin oN and the trips Ad attracted by each destination dN. The main explanatory
variable of the gravity model is the LoS (Level of Service) matrix of generalized travel
cost Cod from each origin oN to each destination dN, which may in turn be expressed
by a linear combination of suitable attributes weighted by coefficients to be calibrated.
By definition, we have:
dN Fod = Go , oN , (19)
oN Fod = Ad , dN , (20)
which also imply that the total generation and attraction are equal:
oN Go = dN Ad = oN dN Fod . (21)
The functional form of the gravity model is:
Fod = ao bd Go Ad / (Cod) , odNN , (22)
where Go and Ad play the role of the masses, while the monotonic function (Cod) of
generalized travel costs plays the role of the square distance. In our analysis we have
considered the following impedance function:
(Cod) = exp( Cod) , (23)
where is a parameter to be calibrated. The generalized travel costs can be, for instance,
those of the shortest paths on the road network computed with respect to the link costs
obtained through a traffic assignment model.
In a origin-constrained model the structural coefficients ao have to be consistent with
equation (19), while bd is set to 1, so that we have:
ao = 1 / [ dN Ad / (Cod)] , oN . (24)
In a destination-constrained model the structural coefficients bd have to be consistent
with equation (20), while ao is set to 1, so that we have:
bd = 1 / [ oN Go / (Cod)] , dN . (25)
In a doubly-constrained model the structural coefficients ao and bd have to be
consistent with both equations (19) and (20), so that we have, respectively:
ao = 1 / [ dN bd Ad / (Cod)] , oN , (26)
bd = 1 / [ oN ao Go / (Cod)] , dN . (27)
The non-linear system defined by (26)-(27) can be conveniently seen as a fixed point
problem that turns out to be a contraction, i.e., it can be easily solved by initially setting
the coefficients to arbitrary values, e.g. az = bz = 1 for each zone zN, and then
calculating (26)-(27) iteratively until convergence is achieved. The above solution
approach is also adopted in Bablu and Sanat Kumar (2006), where the doubly-
constrained gravity model is formulated as an equivalent minimization problem.
In our case, the set of centroids is partitioned into two subsets, namely the set Z of
traffic zones and the set P of logistic portals, so that formally we have: N = Z P, Z
P = . The urban freight shipping from the portals to the local units is performed by
vehicles that leave from a specific portal, visit some units possibly located in more than
one zone, and return to the same portal. Therefore, the same vehicle may perform
during one tour not only a trip from a portal, origin of the freight, to a single zone,
destination of the freight, and backward, but also trips within such zone or even between
different zones.
We are interested here in estimating the number of direct trips between centroids, but
not in deriving the actual structure of vehicle routes which, being the result of VRP
European Transport \ Trasporti Europei (2013) Issue 54, Paper n° 6, ISSN 1825-3997
17
algorithms, is out of the scope of the demand oriented methodology proposed in this
paper. However, the gravity model is not conceived to yield O-D flows that satisfy the
topological constraints of tours. To force such a structure we will consider a sequence of
gravity models, each one representing implicitly a further stop of the delivery tour.
From the generation model we know the total number of movements Dz occurring in
each zone zZ. Moreover, we assume to known the average number of movements
per route, for example as a result of a specific survey. The total number of performed
tours will then be:
R = zZ Dz / . (28)
Each portal pP is associated with a weight wp that represents its relative importance.
We can therefore compute the number of tours Rp headed at portal p as:
Rp = R wp / sP ws . (29)
Clearly, the average number of movements per route and the weight wp of each
portal pP are specific characteristics of each supply chain.
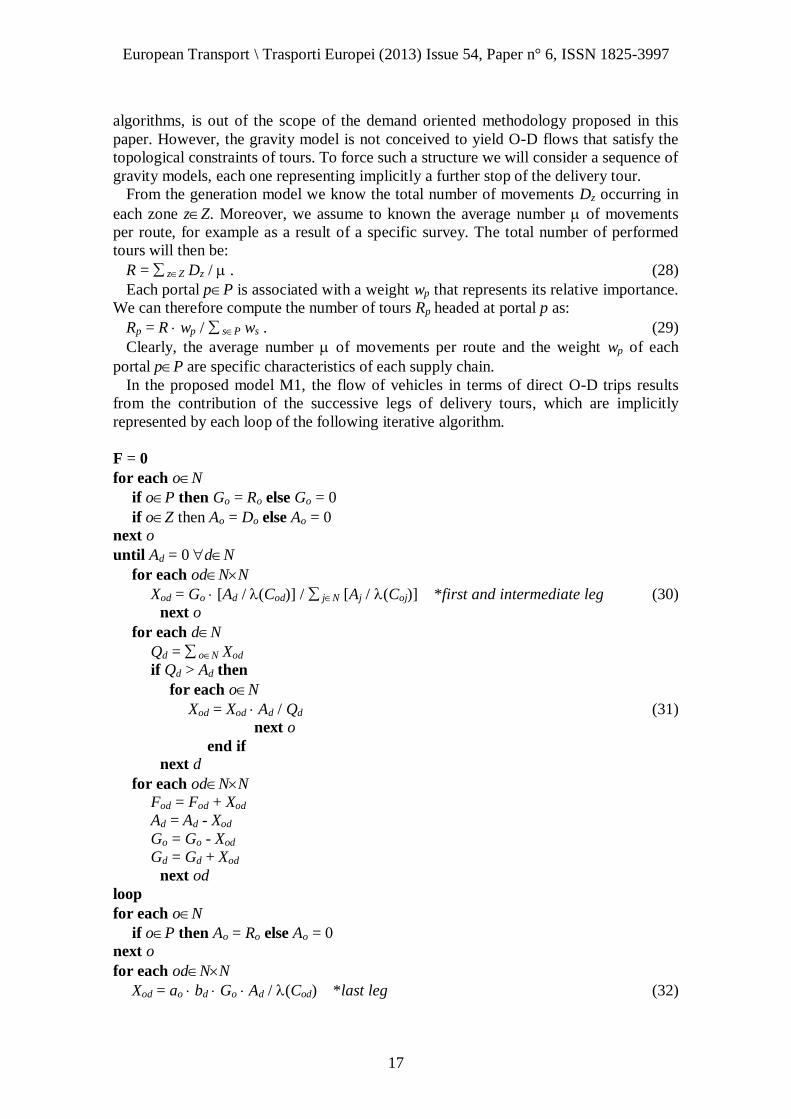
In the proposed model M1, the flow of vehicles in terms of direct O-D trips results
from the contribution of the successive legs of delivery tours, which are implicitly
represented by each loop of the following iterative algorithm.
F = 0
for each oN
if oP then Go = Ro else Go = 0
if oZ then Ao = Do else Ao = 0
next o
until Ad = 0 dN
for each odNN
Xod = Go [Ad / (Cod)] / jN [Aj / (Coj)] *first and intermediate leg (30)
next o
for each dN
Qd = oN Xod
if Qd > Ad then
for each oN
Xod = Xod Ad / Qd (31)
next o
end if next d
for each odNN
Fod = Fod + Xod
Ad = Ad - Xod
Go = Go - Xod
Gd = Gd + Xod
next od
loop
for each oN
if oP then Ao = Ro else Ao = 0
next o
for each odNN
Xod = ao bd Go Ad / (Cod) *last leg (32)
European Transport \ Trasporti Europei (2013) Issue 54, Paper n° 6, ISSN 1825-3997
18
Fod = Fod + Xod
next od
The probability that the next stop of any tour carries out a movement in zone dZ is
given by the origin-constrained model expressed by equation (30), where, at each step
of the algorithm, the generation is the number of trucks present at centroid oN, while
the attraction is the number of deliveries to be still covered in d. If the sum Qd of the
resulting movements exceed the deliveries to be still covered in zone dZ, then only a
share of the vehicles are moved there, as implied by (31).
As far as the first leg is concerned, the generation Go is then equal to the number of
tours Ro headed at each portal oP and is null for each zone oZ, while the attraction
Ao is equal to the total number of movements Do of each zone oZ and is null for each
portal oP. To take into account the last legs of the delivery tours needed for going
back to the portal, i.e., to represent the empty trips, we consider the doubly-constrained
model (32), where the attraction Ao is equal to the number of tours Ro headed at each
portal oP and is null for each zone oZ, while the generation Go of each centroid oN
is that resulting at the end of the main cycle.
Instead, for , the model can be regarded as an approximate solution to the
corresponding VRP with the relaxation that the number of stops per route is satisfied
only on average; indeed in this case the gravity model is a solution to the corresponding
transportation problem (Bablu and Sanat Kumar, 2006).
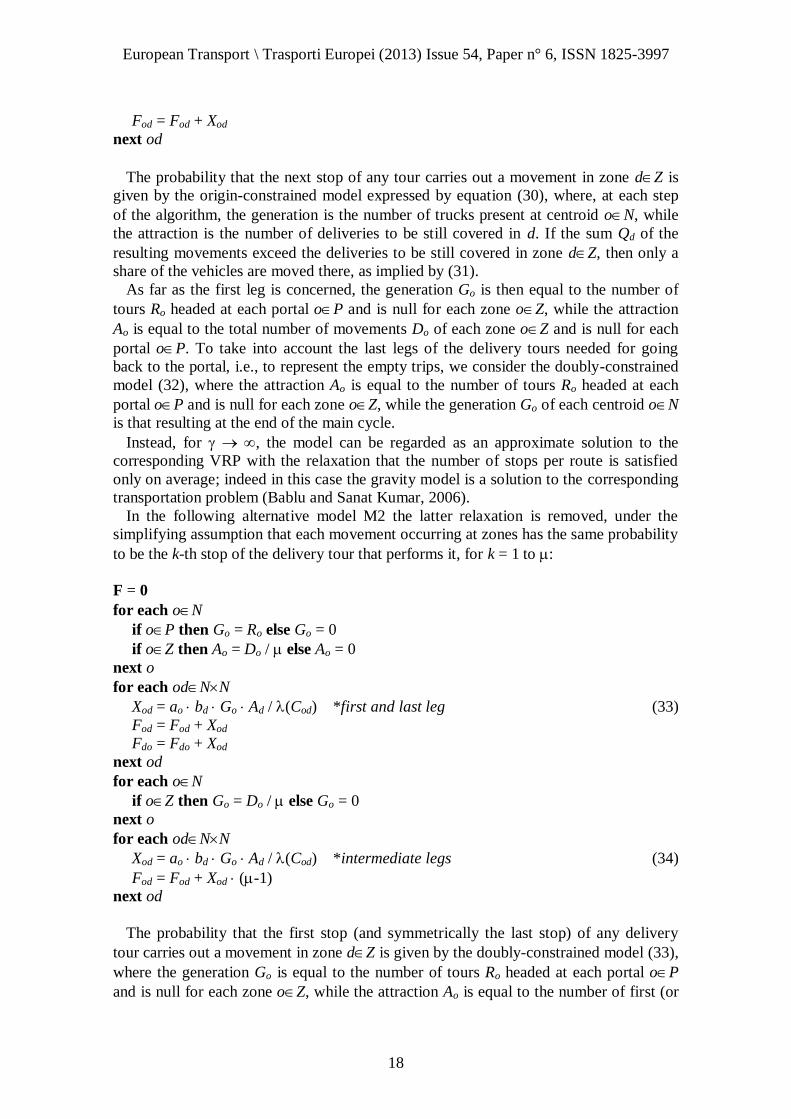
In the following alternative model M2 the latter relaxation is removed, under the
simplifying assumption that each movement occurring at zones has the same probability
to be the k-th stop of the delivery tour that performs it, for k = 1 to :
F = 0
for each oN
if oP then Go = Ro else Go = 0
if oZ then Ao = Do / else Ao = 0
next o
for each odNN
Xod = ao bd Go Ad / (Cod) *first and last leg (33)
Fod = Fod + Xod
Fdo = Fdo + Xod
next od
for each oN
if oZ then Go = Do / else Go = 0
next o
for each odNN
Xod = ao bd Go Ad / (Cod) *intermediate legs (34)
Fod = Fod + Xod (-1)
next od
The probability that the first stop (and symmetrically the last stop) of any delivery
tour carries out a movement in zone dZ is given by the doubly-constrained model (33),
where the generation Go is equal to the number of tours Ro headed at each portal oP
and is null for each zone oZ, while the attraction Ao is equal to the number of first (or
European Transport \ Trasporti Europei (2013) Issue 54, Paper n° 6, ISSN 1825-3997
19
last) stops Do / of each zone oZ and is null for each portal oP. The probability that
the intermediate k-th stop, k[2, ], of any tour carries out a movement in zone dZ is
given by the doubly-constrained model (34), with symmetric generation and attraction
equal to the number of k-th stops Do / to occur at each zone oZ and null for each
portal oP. Since these (-1) gravity models are identical to each other, we compute
one of them and multiply the resulting O-D flows by (-1) times.
It is interesting to observe that, for 1, the number of tours tends to the total
number of movements so that the proposed model collapses into a classical gravity
model between origin portals and destination zones (and back), without direct trips
among zones.
The model calibration, i.e., the estimation of the impedance parameter , can be
performed by maximizing the likelihood, which is defined as the joint probability that
the model associates to the (independent) events revealed in the sample. In this case, the
event is a vehicle performing a particular tour. The generic tour kK of the sample K is
a sequence of (k) zones {z(1, k), z(2, k), … , z((k), k)} and a portal p(k). The
probability k() that the model associates to such a tour is:
k() = Fp(k) z(1, k) / Dp(k) Fz(1, k) z(2, k) / Dz(1, k) …
Fz((k)-1, k) z((k), k) / Dz((k)-1, k) Fz((k), k) p(k) / Dz((k), k) , (35)
where the dependency from is implicit in the flow model (22) through (23). The
parameter shall then be determined by solving the following unconstrained nonlinear
optimization problem with one variable:
max{ kK log(k()): } , (36)
which we suggest to address simply by determining the objective function values for a
suitable interval of values through fixed steps.
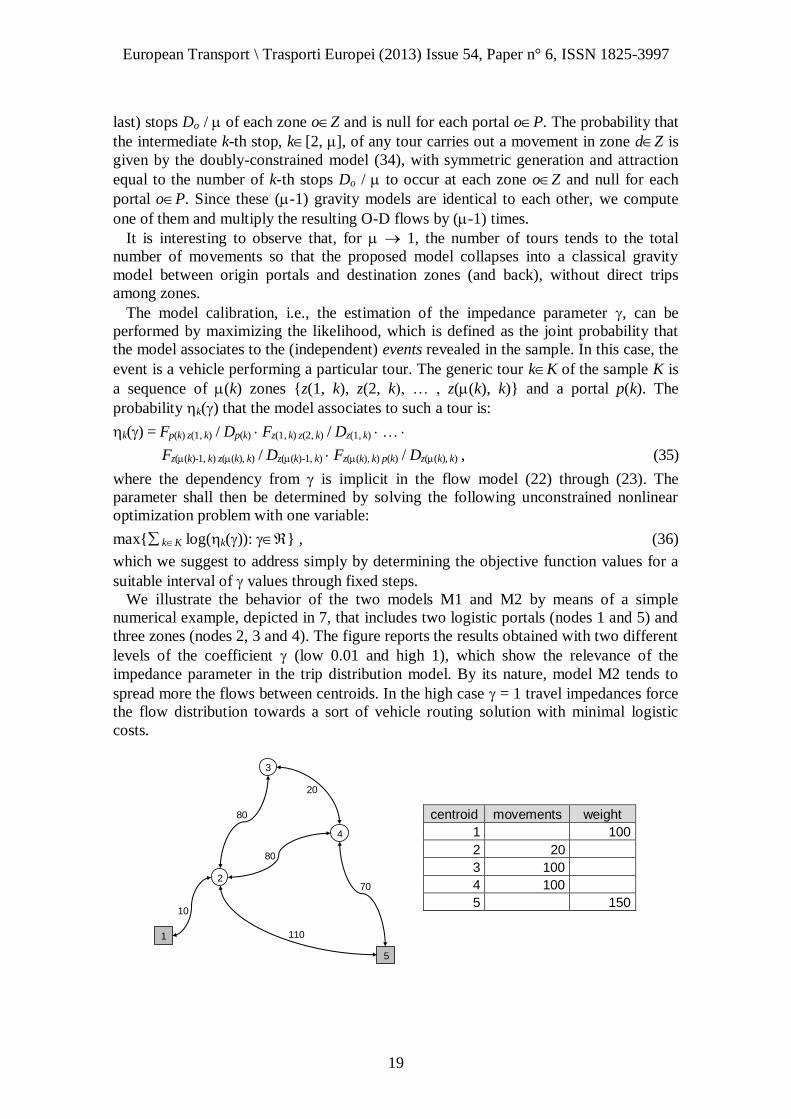
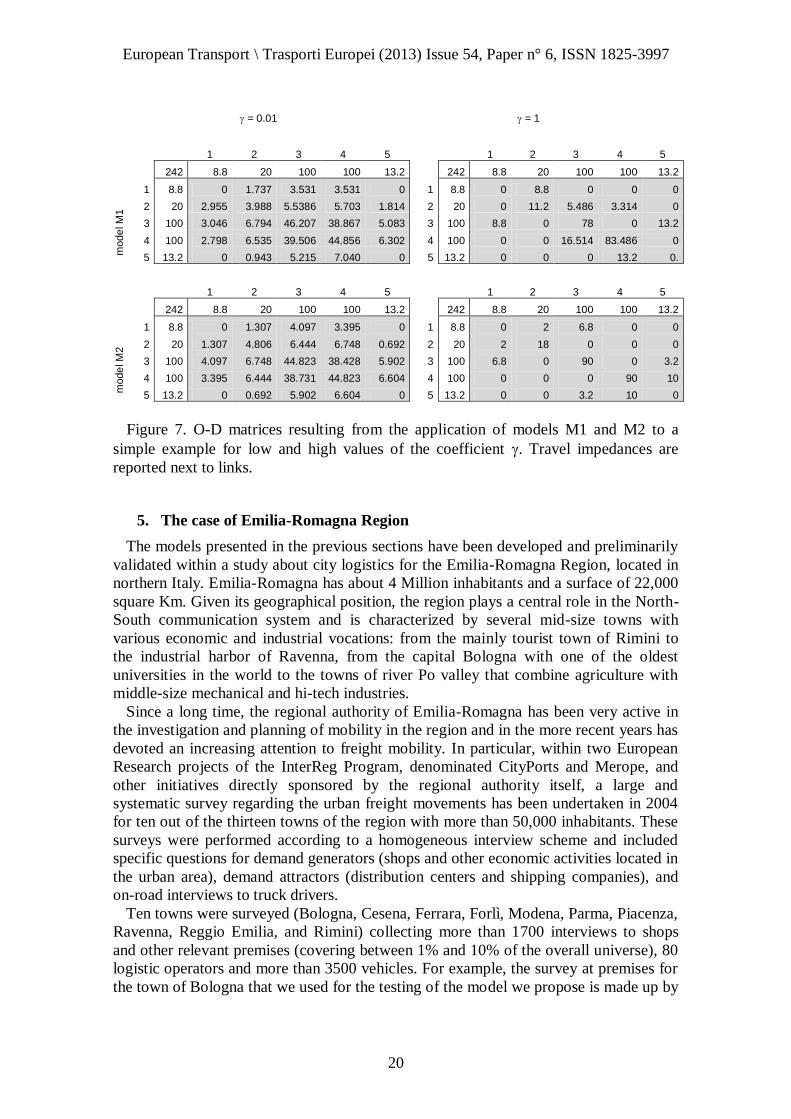
We illustrate the behavior of the two models M1 and M2 by means of a simple
numerical example, depicted in 7, that includes two logistic portals (nodes 1 and 5) and
three zones (nodes 2, 3 and 4). The figure reports the results obtained with two different
levels of the coefficient (low 0.01 and high 1), which show the relevance of the
impedance parameter in the trip distribution model. By its nature, model M2 tends to
spread more the flows between centroids. In the high case = 1 travel impedances force
the flow distribution towards a sort of vehicle routing solution with minimal logistic
costs.
1
5
2
4
3
80
110
80
10
70
20
centroid movements weight
1 100
2 20
3 100
4 100
5 150
European Transport \ Trasporti Europei (2013) Issue 54, Paper n° 6, ISSN 1825-3997
20
mode
l M
1
= 0.01 = 1
1 2 3 4 5 1 2 3 4 5
242 8.8 20 100 100 13.2 242 8.8 20 100 100 13.2
1 8.8 0 1.737 3.531 3.531 0 1 8.8 0 8.8 0 0 0
2 20 2.955 3.988 5.5386 5.703 1.814 2 20 0 11.2 5.486 3.314 0
3 100 3.046 6.794 46.207 38.867 5.083 3 100 8.8 0 78 0 13.2
4 100 2.798 6.535 39.506 44.856 6.302 4 100 0 0 16.514 83.486 0
5 13.2 0 0.943 5.215 7.040 0 5 13.2 0 0 0 13.2 0.
mode
l M
2
1 2 3 4 5 1 2 3 4 5
242 8.8 20 100 100 13.2 242 8.8 20 100 100 13.2
1 8.8 0 1.307 4.097 3.395 0 1 8.8 0 2 6.8 0 0
2 20 1.307 4.806 6.444 6.748 0.692 2 20 2 18 0 0 0
3 100 4.097 6.748 44.823 38.428 5.902 3 100 6.8 0 90 0 3.2
4 100 3.395 6.444 38.731 44.823 6.604 4 100 0 0 0 90 10
5 13.2 0 0.692 5.902 6.604 0 5 13.2 0 0 3.2 10 0
Figure 7. O-D matrices resulting from the application of models M1 and M2 to a
simple example for low and high values of the coefficient . Travel impedances are
reported next to links.
5. The case of Emilia-Romagna Region
The models presented in the previous sections have been developed and preliminarily
validated within a study about city logistics for the Emilia-Romagna Region, located in
northern Italy. Emilia-Romagna has about 4 Million inhabitants and a surface of 22,000
square Km. Given its geographical position, the region plays a central role in the North-
South communication system and is characterized by several mid-size towns with
various economic and industrial vocations: from the mainly tourist town of Rimini to
the industrial harbor of Ravenna, from the capital Bologna with one of the oldest
universities in the world to the towns of river Po valley that combine agriculture with
middle-size mechanical and hi-tech industries.
Since a long time, the regional authority of Emilia-Romagna has been very active in
the investigation and planning of mobility in the region and in the more recent years has
devoted an increasing attention to freight mobility. In particular, within two European
Research projects of the InterReg Program, denominated CityPorts and Merope, and
other initiatives directly sponsored by the regional authority itself, a large and
systematic survey regarding the urban freight movements has been undertaken in 2004
for ten out of the thirteen towns of the region with more than 50,000 inhabitants. These
surveys were performed according to a homogeneous interview scheme and included
specific questions for demand generators (shops and other economic activities located in
the urban area), demand attractors (distribution centers and shipping companies), and
on-road interviews to truck drivers.
Ten towns were surveyed (Bologna, Cesena, Ferrara, Forlì, Modena, Parma, Piacenza,
Ravenna, Reggio Emilia, and Rimini) collecting more than 1700 interviews to shops
and other relevant premises (covering between 1% and 10% of the overall universe), 80
logistic operators and more than 3500 vehicles. For example, the survey at premises for
the town of Bologna that we used for the testing of the model we propose is made up by
European Transport \ Trasporti Europei (2013) Issue 54, Paper n° 6, ISSN 1825-3997
21
315 interviews at shops and relevant premises, which represent about 1% of the large
universe of more than 30000 units. For smaller towns the coverage is much larger:
Ravenna has about 170 interviews which cover more than 6% of the universe of less
than 2800 premises. Each interview collected detailed information of the characteristics
of the movements (regular and irregular) that interested the premise for all possible
Supply Chain in a time horizon of a week, leading to several hundreds of movements
analyzed for each surveyed town. More details on the whole data set and its
organization can be found in (Regione Emilia Romagna, 2005).
The initial purpose of the survey was to improve the knowledge on freight distribution
activities in Italian towns by obtaining information disaggregated over the main supply
chains so as to support the impact analysis of infrastructures and policies. The richness
of the data that have been collected was indeed very promising, reporting on the freight
movements generated by a given economic activity with respect to different supply
chains and with many information on commercial vehicles, time windows, parking
habits, delivery features, etc. However, the available funds have considerably limited
the size of the samples, hence making impossible its direct statistical use, and
motivating the development of an appropriate modeling tool that would allow for the
extension of the observations to the universe in a structured way.
As previously mentioned, the quantity and quality of logistic information associated
with the observed sample is very rich, whereas very little is available for the whole
universe, that is census data reporting the localization of each economic activity, its
category code according to the ATECO/NACE classification system, and its size
measured in terms of employees (but in many cases not highly reliable). An extensive
preliminary testing and validation of the demand generation and distribution models
presented in this paper has been performed during the years 2005-06 on various towns
by using these data for the calibration. In particular the analysis has considered 6 supply
chains and has allowed to determine the average number of freight movements
generated yearly in each traffic zone of the town and the specific O-D matrices of
freight vehicles serving each such supply chain, which are then assigned to the road
network jointly with private cars.
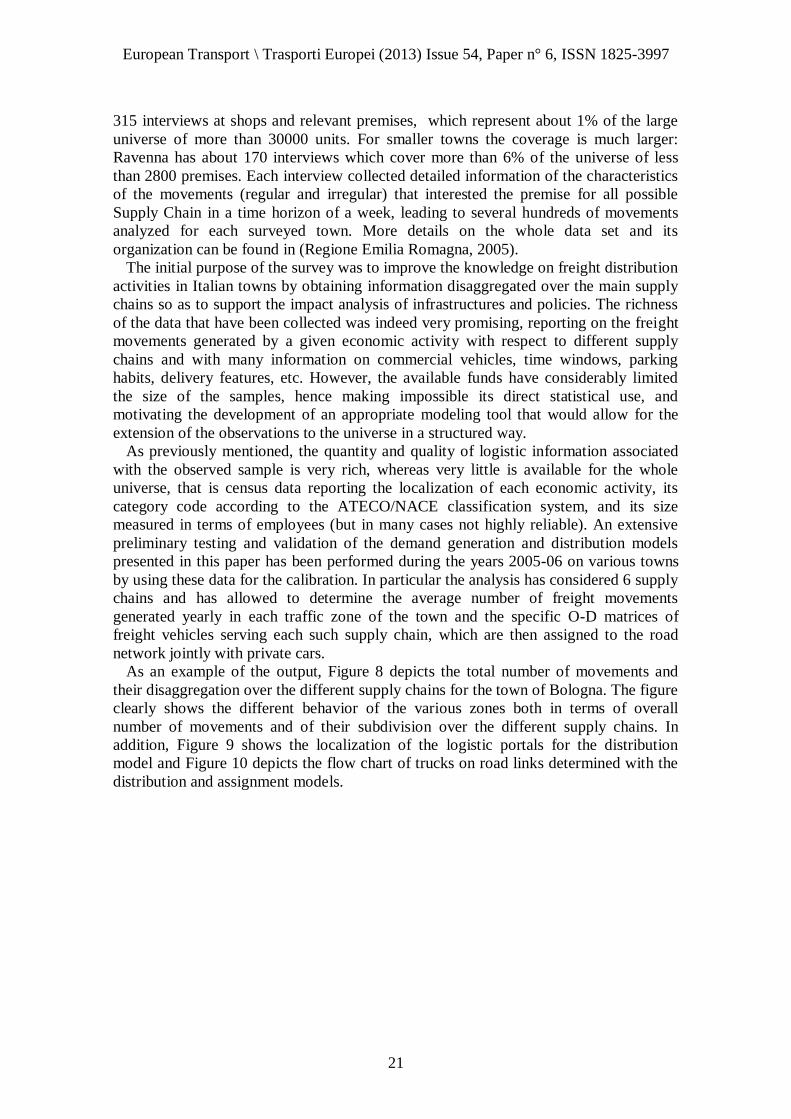
As an example of the output, Figure 8 depicts the total number of movements and
their disaggregation over the different supply chains for the town of Bologna. The figure
clearly shows the different behavior of the various zones both in terms of overall
number of movements and of their subdivision over the different supply chains. In
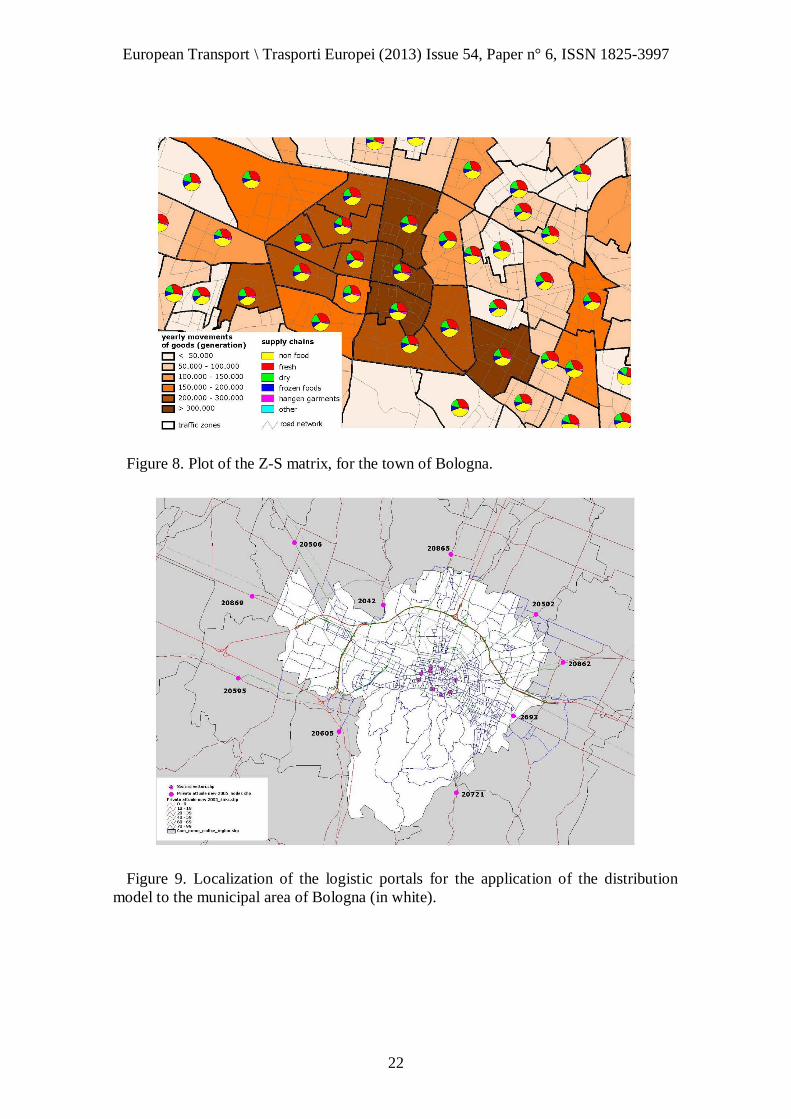
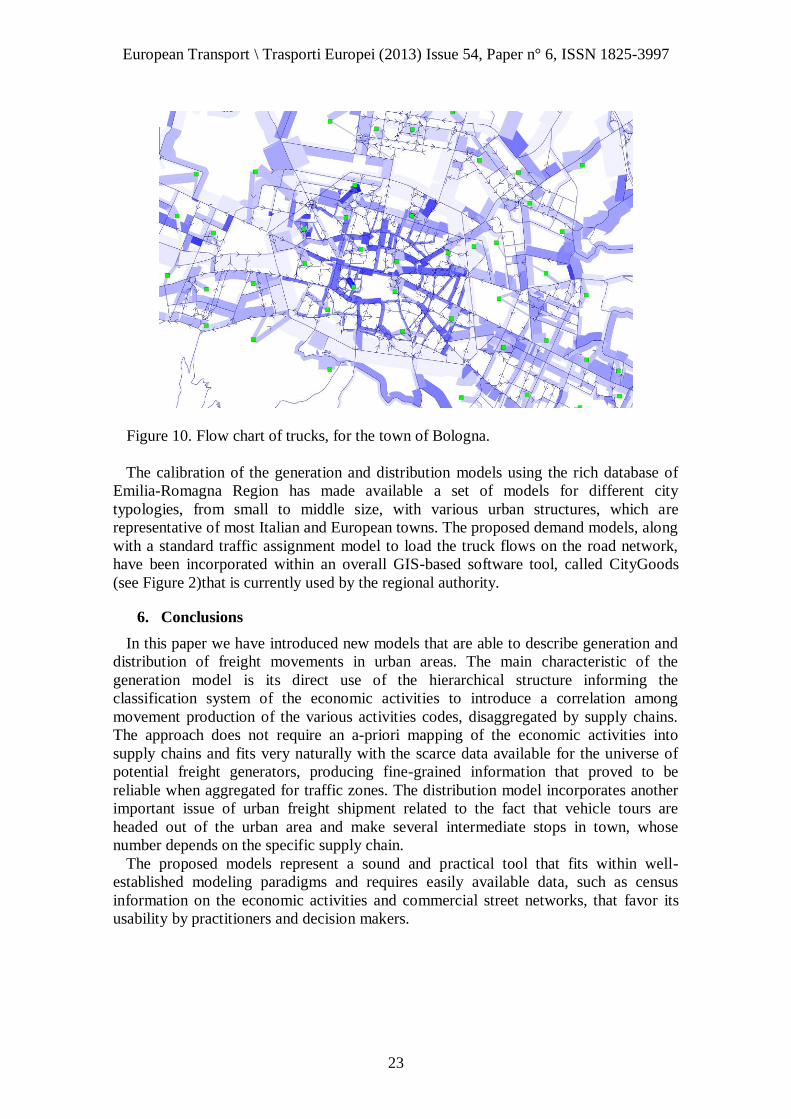
addition, Figure 9 shows the localization of the logistic portals for the distribution
model and Figure 10 depicts the flow chart of trucks on road links determined with the
distribution and assignment models.
European Transport \ Trasporti Europei (2013) Issue 54, Paper n° 6, ISSN 1825-3997
22
Figure 8. Plot of the Z-S matrix, for the town of Bologna.
Figure 9. Localization of the logistic portals for the application of the distribution
model to the municipal area of Bologna (in white).
European Transport \ Trasporti Europei (2013) Issue 54, Paper n° 6, ISSN 1825-3997
23
Figure 10. Flow chart of trucks, for the town of Bologna.
The calibration of the generation and distribution models using the rich database of
Emilia-Romagna Region has made available a set of models for different city
typologies, from small to middle size, with various urban structures, which are
representative of most Italian and European towns. The proposed demand models, along
with a standard traffic assignment model to load the truck flows on the road network,
have been incorporated within an overall GIS-based software tool, called CityGoods
(see Figure 2)that is currently used by the regional authority.
6. Conclusions
In this paper we have introduced new models that are able to describe generation and
distribution of freight movements in urban areas. The main characteristic of the
generation model is its direct use of the hierarchical structure informing the
classification system of the economic activities to introduce a correlation among
movement production of the various activities codes, disaggregated by supply chains.
The approach does not require an a-priori mapping of the economic activities into
supply chains and fits very naturally with the scarce data available for the universe of
potential freight generators, producing fine-grained information that proved to be
reliable when aggregated for traffic zones. The distribution model incorporates another
important issue of urban freight shipment related to the fact that vehicle tours are
headed out of the urban area and make several intermediate stops in town, whose
number depends on the specific supply chain.
The proposed models represent a sound and practical tool that fits within well-
established modeling paradigms and requires easily available data, such as census
information on the economic activities and commercial street networks, that favor its
usability by practitioners and decision makers.
European Transport \ Trasporti Europei (2013) Issue 54, Paper n° 6, ISSN 1825-3997
24
Acknowledgements
The authors thanks Rino Rosini, Paola Bartolini and Monica Zanarini from the
Council on Transportation of the Emilia-Romagna regional authority for their helpful
and active support in producing this research.
References
Ambrosini, C., Routhier, J.-L. (2004) “Objectives, methods and results of surveys
carried out in the field of urban freight transport: an international comparison”,
Transport Reviews 24, 57-77.
Anand, N., Quak, H., van Duin, R. Tavasszy, L. (2012) “City Logistics Modelling
Efforts: Trends and Gaps-A Review” Procedia Social and Behavioural Science 39,
101-115.
Bablu, S., Sanat Kumar, M. (2006) “The constrained gravity model with power function
as a cost function”, Journal of Applied Mathematics and Decision Sciences, Article
ID 48632.
Bera, S., Rao, K.V.K. (2011) “Estimation of origin-destination matrix from traffic
counts: the state of the art”, European Transport/Trasporti Europei 49, 2-23.
Ben Akiva, M., Lerman, R. (1985) Discrete Choice Analysis: Theory and Application to
Travel Demand, MIT Press, Cambridge, Massachusetts.
Boerkamps, J., Van Binsbergen, A. (1999) “GoodTrip - A new approach for modelling
and evaluation of urban goods distribution”, in City logistics, E. Taniguchi and R.G.
Thompson (eds), Institute of System Science Research, Japan.
Browne, M., Gomez, M. (2011) “The impact on urban distribution operations of
upstream supply chain constraints”, International Journal of Physical Distribution &
Logistics Management 41(9), 896 - 912.
Button, K.J., Pearman, A.D. (1981) The economics of urban freight transport,
Macmillan, London, and Holmes and Mier, New York.
Comi, A., Delle Site, P., Filippi, F., Nuzzolo, A. (2012) “Urban Freight Transport
Demand Modelling: a State of the Art”. European Transport 51.
Cordeau, J.-F., Laporte, G., Savelsbergh, M, Vigo, D. (2007) “Vehicle Routing”, in
Transportation, C. Barnhart and G. Laporte (eds), Elsevier.
Danielis, R., Rotaris, L., Marcucci, E. (2010) “Urban freight policies and distribution
channels: a discussion based on evidence from Italian cities”, European
Transport/Trasporti Europei 46, 114-146
Danielis, R., Maggi, E., Rotaris, L., Valeri, E. (2013) “Urban freight distribution: urban
supply chains and transportation policies” to appear in Freight Transport Modelling,
M. Ben-Akiva, H. Meersman, E. Van de Voorde (editors), Emerald Press.
Friedrich, M., Haupt, T., Nökel, K. (2003) “Freight modelling: data issues, survey
methods, demand and network models”, presented at the 10th
International
Conference on Travel Behaviour Research, Moving Through Nets: The Physical and
Social Dimensions of Travel, Lucerne.
FREILOT (2012) Urban Freight Energy Efficiency Pilot, Deliverable 4.2 Final
Evaluation report. Available at www.freilot.eu, Ertico-ITS Brussels.
Gentile, G., Vigo, D. (2006) “A Demand Model for Freight Movements in City
Logistics Applications”. In Odysseus 2006. Third International Workshop on Freight
Transport and Logistics, Universitat de València, Valencia, Spain, pp. 159-164.
Gentile, G., Vigo, D. (2007) “CityGoods: An integrated model for city logistics”,
presented at AIRO 2007, Genova, Italy.
European Transport \ Trasporti Europei (2013) Issue 54, Paper n° 6, ISSN 1825-3997
25
Gerardin, B., Patier, D., Routhier, J. L., Segalou, E. (2000), Diagnostic du Transport de
marchandises dans une agglomération, Programme national Marchandises en ville,
DRAST, France.
Golden, B. L., Raghavan, S., & Wasil, E. A. (2008) Vehicle routing: Latest advances
and challenges, Kluwer, Boston, USA.
Gonzalez-Feliu, J., Ambrosini, C., Routhier, J.L. (2012), “New trends on urban goods
movement: modeling and simulation of e-commerce distribution”, European
Transport/Trasporti Europei 50 (6), 1-23.
Gonzalez-Feliu, J., Routhier, J.L. (2012) “Modelling urban goods movement : how to be
oriented with so many approaches?” Procedia Social and Behavioral Science 39, 89-
100.
Gonzalez-Feliu J., Toilier F., Ambrosini C., Routhier J.L. (2013), “Estimated data
production for urban goods transport diagnosis. The Freturb methodology”. In
Gonzalez-Feliu J., Semet., F., Routhier, J.L. (eds.), Sustainable Urban Logistics:
Concepts, Methods and Information Systems, Springer.
Gorys, J., Hausmanis, I. (1999) “A strategic overview of goods movement in the Great
Toronto Area”, Transportation Quarterly 53.
Habib, P.A. (1985) “Urban freight practice: an evaluation of selected examples”,
Transportation Research Record 1038.
Harris, R.I., Liu, A. (1998) “Input-output modelling of the urban and regional economy:
the importance of external trade”, Regional Studies 32.
Hautzinger, H. (1984) “The prediction of interregional goods vehicle flows: some
modeling concepts”, Ninth International Symposium on Transportation and Traffic
Flow Theory, VNU Science Press, 375-396.
He, S., Crainic, T.G. (1998) “Freight transportation in congested urban areas: issues and
methodologies”, presented at the 8th World Conference on Transport Research,
Antwerp, Belgium.
Holguin-Veras, J., Thorson, E. (2000) “An investigation on the relationships between
the trip length distributions in commodity-based and trip-based freight demand
modeling”, presented at the 79th Transportation Research Record, Washington.
Holguín-Veras, J., Thorson, E. (2003a) “Modeling commercial vehicle empty trips with
a first order trip chain model”, Transportation Research B 37, 129-148.
Holguín-Veras, J., Thorson, E. (2003b) “Practical implications of modeling commercial
vehicle empty trips”, Transportation Research Record 1833, 87-94.
Holguín-Veras, J., Zorrilla, J.C., Thorson, E. (2005) “Modeling commercial vehicle
empty trips: theory and application”. In Mahmassani, H. (ed), XVI International
Symposium of Traffic and Transportation Theory (ISTTT), Elsevier, 585-608.
Holguín Veras, J., Thorson, E., Wang, Q., Xu, N., González, C., Sánchez-Díaz, I. ,
Mitchell, J. (2012), “Urban Freight Tour Models: State of The Art And Practice”,
Working Paper, Rensselaer Polytechnic Institute, New York.
Hutchinson, B.G. (1974) “Estimating urban goods movement demands”, Transportation
Research Record 496.
Janssen, T., Vollmer, R. (2005) “Development of a urban commercial transport model
for smaller areas”, In German Society for Geography Annual meeting, Berlin.
Lawson, C.H. and Hanson, R.J. (1995), Solving least squares problems, SIAM.
List, G.F., Turnquist, M.A. (1994) “Estimating truck travel patterns in urban areas”,
Transportation Research Record 1430.
European Transport \ Trasporti Europei (2013) Issue 54, Paper n° 6, ISSN 1825-3997
26
Marzano, V., Papola, A. (2004) “Modelling freight demand at a national level:
theoretical developments and application to Italy”, in Proceedings of 2004 ETC
Conference, Strasbourg.
Meimbresse, B., Sonntag, H. (2001) “Modelling urban commercial traffic with the
model Wiver”. In Patier, D. (ed.), L’intégration des marchandises dans le système des
déplacements urbains, Laboratoire d’Economie des Transports, Lyon, 93-106.
Nagurney, A. (1999) Network economics: a variational inequality approach, second
revised edition, Kluwer Academic Publishers, Dordrecht, Netherlands.
Noortman, H.J. (1984) “Goods distribution in urban area”, in Goods Distribution
Systems in Urban Area: Report of the 61st Round Table on Transport Economics,
European Conference of Ministers of Transport, Paris.
Nuzzolo, A., Crisalli, U., Comi, A. (2012) “A trip chain order model for simulating
urban freight restocking”, European Transport/Trasporti Europei 50 (7), 1-13.
Ogden, K.W. (1977) “Modelling urban freight generation”, Traffic Engineering and
Control 18.
Ogden, K.W. (1992),Urban goods movement. A guide to policy and planning, Ashgate,
Aldershot, England.
Oppenheim, N. (1995) “On the integrability problem in discrete spatial activity systems
with site and network externalities”, Regional Science and Urban Economics 25, 85-
108.
Regione Emilia-Romagna (2005) “City Ports Project interim report”, in Quaderni del
Servizio Pianificazione dei Trasporti e Logistica 7, Bologna, Italy.
Routhier J. L. (2002) Du transport de marchandises en ville à la logistique urbaine,
Synthèses et Recherches. 2001 plus n.59, DRAST, 67 pages, France.
Routhier, J-L., Aubert, P-L. (1999) “FRETURB, un modèle de simulation des transports
de marchandises en ville”, In Proceedings from the 8th World Conference on
Transportation Research, Antwerp, Elsevier, 531-544.
Routhier, J-L., Toilier, F. (2007), “FRETURB V3, a Policy Oriented Software of
Modelling Urban Goods Movement”, In Proceedings from the 11th World
Conference on Transport Research - WCTR'07, Berkeley.
Slavin, H.L. (1976) “Demand for urban good vehicle trip”, Transportation Research
Record 591.
Sonntag, H. (1985) “A Computer Model of Urban Commercial Traffic, in Transport”,
Policy and Decision Making, 3, 171-180.
Strauss-Wieder, A., Kang, K., Yokei, M. (1989) “The truck commodity survey in the
New York-New Jersey metropolitan area”, in Good transportation in urban areas,
Proceedings of the 5th Conference, Santa Barbara, CA, 83-94.
Taniguchi, E., Thompson, R.G. (1999) City Logistics, Institute of Systems Science
Research, Japan.
Taniguchi, E., Thompson, R.G. (2003) “Logistics systems for sustainable cities”, in
Proceedings of 3trd Conference on City Logistics, Elsevier.
Taniguchi, E., Thompson, R.G. (2006) “Recent advances in city logistics, in
Proceedings of the 4th International Conference on City Logistics, Elsevier.
Taylor, S.Y. (1997) “A basis for understanding urban freight and commercial vehicle
travel”, Transport Research Report, ARR300.
The Oak Ridge National Laboratory (2004), “Freight Modeling Bibliography”, for the
Freight Model Improvement Program (see http://www.fmip.gov/models/library.htm),
U.S. Department of Transportation (USDOT).
European Transport \ Trasporti Europei (2013) Issue 54, Paper n° 6, ISSN 1825-3997
27
Toth, P.,Vigo, D. (2002) The vehicle routing problem, SIAM Series on Discrete
Mathematics and Applications, SIAM, Philadelpia, PA.
Zavettero, D.A., Waseman, S.E. (1981) “Commercial vehicle trip generation in the
Chicago Region”, Transportation Research Record 834.