mountain climate notes
TRANSCRIPT
1 Draft: Chap. 4 Mt. Climate by A. Bach for Mountains and People
Chapter 4: Mountain Climate
Climate is the fundamental factor in establishing a natural environment, it sets the stage
upon which all physical, chemical, and biological processes operate. This becomes especially
evident at the climatic margins of the earth, i.e., desert and tundra. Under temperate conditions,
the effects of climate are often muted and intermingled so that the relationships between stimuli
and reaction are difficult to isolate, but under extreme conditions the relationship becomes more
evident. Extremes constitute the norm in many areas within high mountains; for this reason, a
basic knowledge of climatic processes and characteristics is a prerequisite to an understanding of
the mountain milieu.
The climate of mountains is kaleidoscopic, composed of myriad individual segments
continually changing through space and time. Great environmental contrasts occur within short
distances as a result of the diverse topography and highly variable nature of the energy and
moisture fluxes within the system. While in the mountains, have you ever sought refuge from the
wind in the lee of a rock? If so, you have experienced the kind of difference that can occur
within a small area. Near the margin of a species' distribution, such differences may decide
between life and death; thus, plants and animals reach their highest elevations by taking
advantage of microhabitats. Great variations also occur within short time-spans. When the sun is
shining it may be quite warm, even in winter, but if a passing cloud blocks the sun, the
temperature drops rapidly. Therefore, areas exposed to the sun undergo much greater and more
frequent temperature contrasts than those in shade. This is true for all environments, of course,
but the difference is much greater in mountains because the thin alpine air does not hold heat
well and allows a larger magnitude of solar radiation to reach the surface.
In more general terms, the climate of a slope may be very different from that of a ridge
or valley. When these basic differences are compounded by the infinite variety of combinations
created by the orientation, spacing, and steepness of slopes, along with the presence of snow
patches, shade, vegetation, and soil, the complexity of climatic patterns in mountains becomes
truly overwhelming. Nevertheless, predictable patterns and characteristics are found within this
heterogeneous system; for example, temperatures normally decrease with elevation while
cloudiness and precipitation increases, it is usually windier in mountains, the air is thinner and
clearer, and the sun’s rays are more intense.

2 Draft: Chap. 4 Mt. Climate by A. Bach for Mountains and People
The dynamic effects of mountains also have a major impact on regional and local airflow
patterns that impact the climates of adjacent regions. Their influence may be felt for hundreds or
thousands of kilometers, making surrounding areas warmer or colder, wetter or drier than they
would be if the mountains were not there. The exact effect of the mountains depends upon their
location, size, and orientation with respect to the moisture source and the direction of the
prevailing winds. The 2,400-kilometer-long (1,500 mi.) natural barrier of the Himalayas permits
tropical climates to extend farther north in India and southeast Asia than they do anywhere else
in the world (Tang and Reiter 1984). One of the heaviest rainfall records in the world was
measured at Cherrapunji, near the base of the Himalayas in Assam. This famous weather station
has an annual rainfall of 10,871 mm (428 in.). Its record for a single day is 1,041 mm (41 in.) as
much as Chicago or London receives in an entire year (Kendrew 1961)! On the north side of the
Himalayas, however, there are extensive deserts and the temperatures are abnormally low for the
latitude. This contrast in environment between north and south is due almost entirely to the
presence of the mountains, whose east-west orientation and great height prevent the invasion of
warm air into central Asia just as surely as they prevent major invasions of cold air into India. It
is no wonder that the Hindus pay homage to Siva, the great god of the Himalayas.
EXTERNAL CLIMATIC CONTROLS
Mountain climates occur within the framework of the surrounding regional climate and
are controlled by the same factors, including latitude, altitude, continentality, and regional
circumstances such as ocean currents, prevailing wind direction, and the location of semi-
permanent high and low-pressure cells. Mountains themselves, by acting as a barrier, affect
regional climate and modifying passing storms. Our primary concern is in the significance of all
these more or less independent controls to the weather and climate of mountains.
Latitude
The distance north or south of the equator governs the angle at which the sun's rays strike
the earth, the length of the day, thus the amount of solar radiation arriving at the surface. In the
tropics, the sun is always high overhead at midday and the days and nights are of nearly equal
length throughout the year. As a result, there is no winter or summer; one day differs from
another only in the amount of cloud cover. There is an old adage, "Night is the winter of the

3 Draft: Chap. 4 Mt. Climate by A. Bach for Mountains and People
tropics." With increasing latitude, however, the height of the sun changes during the course of
the year, and days and nights become longer or shorter depending on the season (Fig. 4.1). Thus,
during summer solstice in the northern hemisphere (June 21) the day is 12 hours, 7 minutes long
at Mount Kenya on the equator; 13 hours, 53 minutes long at Mount Everest in the Himalayas
(28˚N lat.); 15 hours, 45 minutes long at the Matterhorn in the Swiss Alps (41˚N lat.); and 20
hours, 19 minutes long at Mount McKinley in Alaska (63˚N lat.) (List 1958). During the winter,
of course, the length of day and night at any given location are reversed. Consequently, the
distribution of solar energy is greatly variable in space and time. In the polar regions, the
extreme situation, up to six months of continuous sunlight follow six months of continuous
night.
Although the highest latitudes receive the lowest amounts of heat energy, middle
latitudes frequently experience higher temperatures during the summer than do the tropics. This
is due to moderate sun heights and longer days. Furthermore, mountains in middle latitudes may
experience even greater solar intensity than lowlands, both because the atmosphere is thinner and
because the sun's rays strike slopes oriented toward the sun at a higher angle than level surfaces.
A surface inclined 20˚ toward the sun in middle latitudes receives about twice as much radiation
during the winter as a level surface. It can be seen that slope angle and orientation with respect
to the sun are vastly important and may partially compensate for latitude.
The basic pattern of global atmospheric pressure systems reflects the role of latitude in
determining climatic patterns (Fig. 4.2). These systems are known as the equatorial low (0˚- 20˚
lat.), subtropical high (20˚- 40˚ lat.), polar front and subpolar lows (40˚- 70˚ lat.), and polar high
(70˚- 90˚ lat.). The equatorial low and subpolar low are zones of relatively heavy precipitation
while the subtropical high and polar high are areas of low precipitation. These pressure zones
create the global circulation system (Fig. 4.2). General circulation dictates the prevailing wind
direction and types of storms that occur latitudinally. The easterly Trade Winds have warm, very
moist convective (tropical) storms, which seasonally follow the direct rays of the sun. The
subtropical highs have slack winds and clear skies year round. The subpolar lows and polar front
are imbedded in the Westerlies, bringing cool, wet cyclonic storms and large seasonal
temperature fluctuations. The cold and dry Polar Easterlies develop seasonally, dissipating in
the summer season.

4 Draft: Chap. 4 Mt. Climate by A. Bach for Mountains and People
The distribution of mountains in the global circulation system has a major influence on
their climate. Mountains near the equator, such as Mount Kilimanjaro in East Africa, Mount
Kinabalu in Borneo, or Mount Cotopaxi in Ecuador, are under the influence of the equatorial
low and receive precipitation almost daily on their east-facing windward slopes. By contrast,
mountains located around 30˚ latitude may experience considerable aridity; as do the northern
Himalayas, Tibetan highlands, the Puna de Atacama in the Andes, the Atlas Mountains of North
Africa, the mountains of the southwestern United States, and northern Mexico (Troll 1968).
Farther poleward, the Alps, the Rockies, Cascades, the southern Andes, and the Southern Alps of
New Zealand again receive heavy precipitation on westward slopes facing prevailing Westerlies.
Leeward facing slopes and lands down wind are notably arid. Polar mountains are cold and dry
year round.
Altitude
Fundamental to mountain climatology are the changes that occur in the atmosphere with
increasing altitude, especially the decrease in temperature, air density, water vapor, carbon
dioxide, and impurities. The sun is the ultimate source of energy, but little heating of the
atmosphere takes place directly. Rather, solar radiation passes through the atmosphere and is
absorbed by the earth’s surface. The earth itself becomes the radiating body, emitting long-wave
energy that is readily absorbed by CO2, H2O and other greenhouse gases in the atmosphere. The
atmosphere, therefore, is heated directly by the earth, not by the sun. This is why the highest
temperatures usually occur near the earth’s surface and decrease outward. Mountains are part of
the earth, too, but they present a smaller land area at higher altitudes within the atmosphere, so
they are less able to modify the temperature of the surrounding air. A mountain peak is
analogous to an oceanic island. The smaller the island and the farther it is from large land
masses, the more its climate will be like that of the surrounding sea. By contrast, the larger the
island or mountain area, the more it modifies its own climate. This mountain mass effect is a
major factor in the local climate (see pp. 77-81).
The density and composition of the air control its ability to absorb and hold heat. The
weight or density of the air at sea level (standard atmospheric pressure) is generally expressed as
1013 mb (millibars, or 760 mm [29.92 in.] of mercury). Near the earth, pressure decreases at a
rate of approximately 1 mb per 10 m (30 mm/300 m (1 in./1,000 ft.) of increased altitude. Above

5 Draft: Chap. 4 Mt. Climate by A. Bach for Mountains and People
5,000 m (20,000 ft.) atmospheric pressure begins to fall off exponentially. Thus, half the weight
of the atmosphere occurs below 5,500 m (18,000 ft.) and pressure is halved again in the next
6,000 m (Fig. 4.3).
The ability of air to hold heat is a function of its molecular structure. At higher altitudes,
molecules are spaced farther apart, so there are fewer molecules in a given parcel of air to
receive and hold heat. Similarly, the composition of the air changes rapidly with altitude, losing
water vapor, carbon dioxide, and suspended particulate matter (Tables 4.1 and 4.2). These
constituents, important in determining the ability of the air to absorb heat, are all concentrated in
the lower reaches of the atmosphere. Water vapor is the chief heat-absorbing constituent, and
half of the water vapor in the air occurs below an elevation of 1,800 m (6,000 ft.). It diminishes
rapidly above this point and is barely detectable at elevations above 12,000 m (40,000 ft.).
The importance of water vapor as a reservoir of heat can be seen by comparing the daily
temperature ranges of a desert to that of a humid area. Both areas may heat up equally during the
day but, due to the relative absence of water vapor to absorb and hold the heat energy, the desert
area cools down much more at night than the humid area. The mountain environment responds
in a similar fashion to that of a desert, but is even more accentuated. The thin pure air of high
altitudes does not effectively intercept radiation, allowing it to be lost to space. Mountain
temperatures respond almost entirely to radiation fluxes, not on the temperature of the
surrounding air (although some mountains receive considerable heat from precipitation
processes). The sun's rays pass through the high thin air with negligible heating. Consequently,
although the temperature at 1,800 m (6,000 ft.) in the free atmosphere changes very little
between day and night, next to a mountain peak, the sun's rays are intercepted and absorbed. The
soil surface may be quite warm but the envelope of heated air is usually only a few meters thick
and displays a steep temperature gradient.
In theory, every point along a given latitude receives the same amount of sunshine; in
reality, of course, clouds interfere. The amount of cloudiness is controlled by distance from the
ocean, direction of prevailing winds, dominance of pressure systems, and altitude. Precipitation
normally increases with elevation, but only up to a certain point. Precipitation is generally
heaviest on middle slopes where clouds first form and cloud moisture is greatest, decreasing at
higher elevations. Thus, the lower slopes can be wrapped in clouds while the higher slopes are
sunny. In the Alps, for example, the outer ranges receive more precipitation and less sunshine
6 Draft: Chap. 4 Mt. Climate by A. Bach for Mountains and People
than the higher interior ranges. The herders in the Tien Shan and Pamir Mountains of Central
Asia traditionally take their flocks higher in the winter than in summer to take advantage of the
lower snowfall and sunnier conditions at the higher elevations. High mountains have another
advantage with respect to possible sunshine: in effect, they lower the horizon. The sun shines
earlier in the morning and later in the evening on mountain peaks than in lowlands. The same
peaks, however, can raise the horizon for adjacent land, delaying sunrise or creating early
sunsets.
Continentality
The relationship between land and water has a strong influence on the climate of a
region. Generally, the more water-dominated an area is, the more moderate its climate. An
extreme example is a small oceanic island, on which the climate is essentially that of the
surrounding sea. The other extreme is a central location on a large land mass such as Eurasia, far
removed from the sea. Water heats and cools more slowly than land, so the temperature ranges
between day and night and between winter and summer are smaller in marine areas than in
continental areas.
The same principle applies to alpine landscapes, but is intensified by the barrier effect of
mountains. We have already noted this effect in the Himalayas between India and China. The
Cascades in the Pacific Northwest of the United States provide another good example. This
range extends north-south at right angles to the prevailing westerly wind off the Pacific Ocean.
As a result, western Oregon and Washington have a marine-dominated climate characterized by
moderate temperatures, cloudiness, and persistent winter precipitation (Schermerhorn 1967). The
eastern side of the Cascades, however, experiences a continental climate characterized by hot
summers and cold winters with low precipitation. In less than 85 km (50 mi.) across the
Cascades the vegetation changes from lush green forests to dryland shrubs and grasses (Price
1971a). This spectacular transect provides eloquent testimony to the vast differences in climate
that may occur within a short horizontal distance. The presence of the mountains increases the
precipitation in western Oregon and Washington at the expense of that received on the east side.
Additionally, the Cascades inhibit the invasion of cold continental air to the Pacific side. At the
same time, their obstruction of mild Pacific air allows the continental climate to extend much
closer to the ocean than it otherwise would (Church and Stephens 1941). It must be stressed that

7 Draft: Chap. 4 Mt. Climate by A. Bach for Mountains and People
the significance of mountains in accentuating continentality depends upon their orientation with
respect to the ocean and prevailing winds. Western Europe has a climate similar to the Pacific
Northwest, but the east-west orientation of the European mountains allows the marine climate to
extend far inland, resulting in a milder climate throughout Europe.
The effect of continentality on mountain climate is much like that on climate generally.
Mountains in the interior of continents experience more sunshine, less cloudiness, greater
extremes in temperatures, and less precipitation than mountains along the coasts. This would
seem to add up to a more rigorous environment, but there may be extenuating circumstances.
The extra sunshine in continental regions tends to compensate for the lower ambient
temperatures, while the greater cloudiness and snowfall in coastal mountains tend to make the
environment more rigorous for certain organisms than is suggested by the moderate temperatures
of these regions. The fact that trees generally grow to higher altitudes on continental mountains
than coastal mountains is a good, if rough, indication of the importance of these compensating
circumstances to regional mountain climate and ecology (see pp. 277-82). People, too, find that
the bright sunshine typical of high mountain slopes can make the low air temperatures of the
alpine environment tolerable. During the winter in the Alps, for instance, when it is cloudy and
rainy in the surrounding lowlands and foggy in the lower valleys, the mountain slopes and
higher valleys may bask in brilliant sunshine. It is for this reason that lodges and tourist facilities
in the Alps are generally located higher up on the slopes and in high valleys. Health resorts and
sanatoriums also take advantage of the intense sunlight and clean dry air of the high mountains
(Hill 1924).
Barrier Effects
Several examples of how mountains serve as barriers have already been given. The
Himalayas and Cascades are both outstanding climatic divides that create unlike conditions on
their windward and leeward sides. All mountains serve as barriers to a greater or lesser extent,
depending on their size, shape, orientation, and relative location. Specifically, the barrier effect
of mountains can be grouped under the following subheadings: (1) damming, (2) deflection and
funneling, (3) blocking and disturbance of the upper air, (4) forced ascent, and (5) forced
descent.

8 Draft: Chap. 4 Mt. Climate by A. Bach for Mountains and People
Damming
Damming of stable air occurs when the mountains are high enough to prevent the
passage of an air mass across them. When this happens, a steep pressure-gradient may develop
between the windward and leeward sides of the range (Stull 1988). The effectiveness of the
damming depends upon the depth of the air mass and the elevation of the lowest valleys or
passes (Smith 1979). A shallow, ground-hugging air mass may be effectively dammed, but a
deep one is likely to flow through higher gaps and transverse valleys to the other side. In the Los
Angeles Basin of southern California, for example, the San Gabriel, San Bernardino, and San
Jacinto Mountains act as dams for marine air blowing from the Pacific Ocean. As the
automobile-based culture of southern California pollutes the air, the pollution can only be vented
as far east as the towns of San Bernardino and Riverside at the base of the mountains. In the
absence of a strong wind system, the pollution can build up to dangerous levels as the air
stagnates behind the mountain barrier.
Deflection and Funneling
When an air mass is dammed by a mountain range, the winds can be deflected around the
mountains if topographic gaps exist. Deflected winds can have higher velocities as their
streamlines are compressed, the so-called ‘Bernoulli-effect’ (Davidson et al. 1964; Chen and
Smith 1987). In winter, polar continental air coming down from Canada across the central
United States is channeled to the south and east by the Rocky Mountains. Consequently, the
Great Plains experience more severe winter weather than does the Great Basin (Church and
Stephens 1941; Baker 1944). Similarly, as the cold air progresses southward, the Sierra Madre
Oriental prevents it from crossing into the interior of Mexico. The east coast of Mexico also
provides an excellent example of deflection in the summer: the northeast trade winds blowing
across the Gulf of Mexico cannot cross the mountains and are deflected southward through the
Isthmus of Tehuantepec, where they become northerly winds of unusual violence (Hurd 1929).
Maritime air from the northeastern Pacific is deflected north and south around the Olympic
Mountains (Fig. 4.4). To the north of the Olympics where wind is also deflected south from the
Vancouver Island Ranges, these winds converge into a topographic funnel of the Strait of Juan
de Fuca, resulting in much higher wind speeds (Ramachandran et al. 1980). A similar
phenomenon occurs around the Southern Alps of New Zealand, with winds funneled through
9 Draft: Chap. 4 Mt. Climate by A. Bach for Mountains and People
Cook Strait between the islands (Reid 1996; 1997; Sturman and Tapper 1996). These
perturbations to the local airflow influence transit storms, making local forecasts difficult. The
same funneling effect occurs over mountain passes as winds are deflected around peaks or ridges
on either side of the pass. In the Los Angeles Basin example given above, the San Gorgonio Pass
(750 m) is the lowest divide through the damming mountains. Wind speeds average 7.2 m/s and
are very consistent, resulting in very active aeolian processes and a booming wind power
generating industry (Williams and Lee 1995).
Blocking and Disturbance of the Upper Air
High-pressure areas prevent the passage of storms. Large mountain ranges such as the
Rockies, Southern Alps and Himalayas are very efficient at blocking storms, since they are often
the foci of anti-cyclonic systems (because the mountains are a center of cold air), the storms
must detour around the mountains (Kimurak and Manins 1988; McCauley and Sturman 1999).
In addition to the effect of blocking, mountains cause other perturbations to upper-air circulation
and subsequent effects on clouds and precipitation (Chater and Sturman 1998). This occurs on a
variety of scales: locally, with the wind immediately adjacent to the mountains; on an
intermediate scale, creating large waves in the air; and on a global basis, with the larger
mountain ranges actually influencing the motion of planetary waves (Bolin 1950; Gambo 1956;
Kasahara 1967; Carruthers and Hunt 1990; Walsh 1994) and the transport momentum of the
total circulation (White 1949; Wratt et al. 1996). Disturbance of the air by mountains generally
creates a wave pattern much like that found in the wake of a ship. This may result in the kind of
clear-air turbulence feared by airline pilots (Alaka 1958; Colson 1963) or it may simply produce
lee waves with their beautiful lenticular (standing-wave) clouds, associated with mountains the
world over (Fig. 4.41; Scorer 1961). An area of low precipitation occurs immediately lee of the
Rocky Mountains: the area immediately to the lee is frequently cloud-free and receives low
precipitation, while regions farther east are cloudy and wetter. This pattern corresponds to an
intermediate-scale wave whose trough is located close to the lee of the mountains and whose
ridge is located over the eastern United States (Reiter et al. 1965; Dirks et al. 1967 Durran 1990;
Czarnetzki and Johnson 1996).
Mountains have additional influence on the location and intensity of the jet streams,
which have vastly important effects on the kind of weather experienced at any particular place

10 Draft: Chap. 4 Mt. Climate by A. Bach for Mountains and People
and time. The jet streams may also split to flow around the mountains; they rejoin to the lee of
the range, where they often intensify and produce storms (Reiter 1963; Buzzi et al. 1987). In
North America these storms, known as "Colorado Lows" or "Alberta Lows," reach their greatest
frequency and intensity in the spring season, sometimes causing heavy blizzards on the Great
Plains and Prairie provinces. The tornadoes and violent squall lines that form in the American
Midwest also result from the great contrasts in air masses which develop in the confluence zone
to the lee of the Rockies (McClain 1958; Henz 1972; Chung et al 1976).
The splitting of the jet streams by the Himalayas has the effect of intensifying the barrier
effect in this region and produces a stronger climatic divide. In addition, the presence of the
Himalayas reverses the direction of the jet streams in early summer. The Tibetan Highlands act
as a "heat engine" in the warm season, with a giant chimney in their southeastern comer through
which heat is carried upward into the atmosphere. This causes a gradual warming of the upper
air above the Himalayas during the spring, which weakens and finally eliminates the subtropical
westerly jet. The easterly tropical jet then replaces the subtropical jet during the summer. Thus,
the Himalayas are intimately connected with the complex interaction of the upper air and the
development of the Indian monsoon (Flohn 1968; Hahn and Manabe 1975; Reiter and Tang
1984; Tang and Reiter 1984; Kurtzbach et al. 1989).
Forced Ascent
When moist air blows perpendicular to a mountain range, the air is forced to rise; as it
does, it is cooled. Eventually the dew point is reached, condensation occurs, clouds form, and
precipitation results (see p. 94). This increased cloudiness and precipitation on the windward
slope is known as the orographic effect (Browning and Hill1981). Some of the rainiest places in
the world are mountain slopes in the path of winds blowing off relatively warm oceans. There
are many examples and could be given from every continent, but the mountainous Hawai’ian
Islands will serve as an illustration. The precipitation over the water around Hawai’i averages
about 650 mm (25 in.) per year, while the islands average 1,800 mm (70 in.) per year. This is
largely due to the presence of mountains, many of which receive over 6,000 mm (240 in.) per
year (Nullet and MacGranaghan 1988). At Mount Waialeale on Kauai, the average annual
rainfall reaches the extraordinary total of 12,344 mm (486 in.), i.e., 12.3 m (40.5 ft.)! This is the
highest recorded annual average in the world (Blumenstock and Price 1967). In the continental
11 Draft: Chap. 4 Mt. Climate by A. Bach for Mountains and People
United States, the heaviest precipitation occurs at the Hoh Rain Forest on the western side of the
Olympic Mountains in Washington, where an average of 3,800 mm (150 in.) or more is received
annually as storms are funneled up valleys oriented towards winter storm tracks (Fig. 4.4;
Phillips 1972; Collie and Mass 1996).
Forced Descent
Atmospheric-pressure conditions determine whether the air, after passing over a
mountain barrier, will maintain its altitude or whether it will be forced to descend. If the air is
forced to descend, it will be heated by compression (adiabatic heating) and will result in clear,
dry conditions. This is a characteristic phenomenon in the lee of mountains and is responsible for
the famous foehn or chinook winds (see pp. 114-19). The important point here is that the
descent of the air is induced by the barrier effect and results in clear dry conditions that allow the
sunshine to reach the ground with much greater intensity and frequency than it otherwise would.
This can produce "climatic oases" in the lee of mountain ranges, e.g., in the Po Valley of Italy
(Thams 1961).
Although heavy precipitation may occur on the windward side of mountains where the
air is forced to rise, the leeward side may receive considerably less precipitation because the air
is no longer being lifted (it is descending) and much of the moisture has already been removed.
The so-called rainshadow effect is an arid area on the leeward or down-wind side of mountains.
To the lee of Mount Waialeale, Kauai, precipitation decreases at the rate of 3,000 mm (118 in.)
per 1.6 km (1 mi.) along a 4 km (2.5 mi.) transect to Hanalei Tunnel (Blumenstock and Price
1967). In the Olympic Mountains, precipitation decreases from the windward side to less than
430 mm (17 in.) at the town of Sequim on the leeward, a distance of only 48 km (30 mi.) (Fig.
4.4; Phillips 1972). Since both of these leeward areas are maritime, they are still quite cloudy;
under more continental conditions, there would be a corresponding increase in sunshine as
precipitation decreases, especially where the air is forced to descend on the leeward side.
MAJOR CLIMATIC ELEMENTS
The discussion so far has covered the more or less independent climatic controls of
latitude, altitude, continentality, and the barrier effect of mountains. These factors, along with

12 Draft: Chap. 4 Mt. Climate by A. Bach for Mountains and People
ocean currents, pressure conditions, and prevailing winds, control the distribution of sunshine,
temperature, humidity, precipitation, and local winds. The climatic elements of sunshine,
temperature, and precipitation are essentially dependent variables reflecting the major climatic
controls (Thompson 1990). They interact in complex ways to produce the day-to-day weather
conditions experienced in different regions. In mountains, these processes frequently occur on
small enough scales to be invisible to standard measurement networks used in weather
forecasting, while their impact can be serious.
Solar Radiation
The effect of the sun becomes more exaggerated and distinct with elevation. The time
lag, in terms of energy flow, between stimulus and reaction is greatly compressed in mountains.
Looking at the effect of the sun in high mountains is like viewing its effects at lower elevations
through a powerful magnifying glass. The alpine environment has perhaps the most extreme and
variable radiation climate on earth. The thin clean air allows very high solar intensities, and the
topographically complex landscape provides surfaces with a range of different exposures and
shadowing from nearby peaks. Although the air next to the ground may heat up very rapidly
under the direct rays of the sun, it may cool just as rapidly if the sun's rays are blocked. Thus, in
the sun's daily and seasonal march through the sky, mountains experience a continually changing
pattern of sunshine and shadow, influencing the energy flux in the ecosystem (Saunders and
Bailey 1994; Germino and Smith 2000). The factors to consider are the amount of sunlight
received, the quality or kinds of radiation, and the effect of slopes upon this energy.
Amount of Solar Radiation
The most striking aspect of the vertical distribution of solar radiation in the atmosphere is
the rapid depletion of short-wavelength energy at lower elevations. This attenuation results from
the increased density of the atmosphere and the greater abundance of water vapor, carbon
dioxide, and particulate matter near the earth’s surface (Tables 4.1 and 4.2). The atmosphere acts
as a filter, reducing the intensity of some wavelengths and screening out others altogether.
Consequently, the amount of energy reaching the surface at sea level is only about half that at
the top of the atmosphere (Fig. 4.5). High mountains protrude through the lower atmospheric

13 Draft: Chap. 4 Mt. Climate by A. Bach for Mountains and People
blanket and thus have the potential for receiving much higher levels of solar radiation, as well as
cosmic-ray and ultraviolet radiation (Solon et al. 1960).
The first, and very vital, screening of solar energy takes place in the stratosphere where
most of the ultraviolet radiation from the sun is absorbed by the ozone layer. Greenhouse gases
absorb infrared solar radiation, but visible light passes through to the surface except when there
is cloud-cover. The visible light is scattering as it strikes molecules of air, water, and dust.
Scattering is a selective process, principally affecting the wavelengths of blue light. Have you
ever noticed how much bluer or darker the sky looks in high mountains than it appears at lower
elevations? That is because there is more water and pollutants at lower altitudes, scattering light
of other wavelengths, which dilutes the blue color (Valko 1980). Clouds, of course, are the
single most important factor in controlling variable receipt of solar energy at any given latitude
and in mountains (Saunders and Bailey 1994).
Because of the atmospheric filtering of solar radiation, the more atmosphere the sunlight
passes through, the greater the attenuation. Consequently, the sun is most intense when it is
directly overhead (90˚) and its rays concentrated in the smallest area. When the sun is only 4˚
above the horizon, solar rays have to penetrate an atmosphere more than twelve times as thick as
when the sun is directly overhead. This explains why it is possible to look directly at the orange
ball of the sun at sunrise and sunset without being blinded. Since mountains stand above the
lower reaches of the atmosphere, the solar radiation is much more intense since it has passed
through less atmosphere (Fig. 4.6).
Table 4.3 gives values for daily global radiation received at different elevations in the
Austrian Alps. Solar intensity increases with altitude under all conditions, but the greatest
differential between high and low-level stations occurs when skies are overcast. In summer,
when skies are clear, there is 21% more radiation at 3,000 m (10,000 ft.) than at 200 m (650 ft.);
but when skies are overcast, there is 160% more radiation at the higher elevation. Overcast skies
are much more efficient at filtering out shortwave energy, so less reaches the lower elevation
(Geiger 1965).
The solar constant is defined as the average amount of total radiation energy received
from the sun at the top of the atmosphere on a surface perpendicular to the sun's rays (Fig. 4.5).
This is approximately 1365 Wm-2 (2 calories per square centimeter per min). At midday under
clear skies the total energy flux from the sun in high mountains may approach the solar constant.
14 Draft: Chap. 4 Mt. Climate by A. Bach for Mountains and People
Angstrom and Drummond (1966) have calculated the theoretical upper limit on high mountains
to be 1263 Wm-2 (1.85 cal. cm-2 min-1), but several field investigations have recorded readings
even slightly above the solar constant (Turner 1958a; Gates and Janke 1966; Bishop et al. 1966;
Terjung et al. 1969a, b; Marcus and Brazel 1974). Turner (1958a) measured instantaneous values
as high as 1529 Wm-2 (2.25 cal. cm-2 min-1) in the Alps, 112% of the solar constant! The
additional radiation comes from sunlight reflected from cloud bottoms and snow on higher
slopes.
Quality of Solar Radiation
The alpine environment receives considerably more ultraviolet radiation (UV) than low
elevations. If only wavelengths shorter than 320 m. are considered, then alpine areas receive
50% more UV during summer solstice than does sea level (Caldwell 1980). Later in the year,
when the sun is lower in the sky (and therefore passes through denser atmosphere), alpine areas
receive 120% more UV than areas at sea level (Gates and Janke 1966). The relatively greater
quantity of UV received at high elevations has special significance for human comfort and
biological processes. A proverb in the Andes says, “Solo los gringos y los burros caminan en el
sol” (“Only foreigners and donkeys walk in the sunshine”). This saying indicates the respect the
Andeans give to the efficacy of the sun at high altitudes (Prohaska, 1970). UV has been cited for
a number of harmful effects, ranging from the retardation of growth in tundra plants (Lockart
and Franzgrote 1961; Caldwell 1968; Runeckles and Krupa 1994) to cancer in humans (Blum
1959). UV is mainly responsible for the deep tans of mountain dwellers and the painful sunburns
of neophytes who expose too much of their skin too quickly. The wavelengths responsible for
sunburn occur primarily between 280 and 320 m, while those responsible for darkening the
skin occur between 300 and 400 m. Wavelengths less than 320 m are known to cause skin
cancer and weaken the immune system (Chapman and Werkema 1995). UV has been increasing
in alpine areas in recent decades, apparently a response to the depletion of stratospheric ozone
(Blumenthaler and Ambach 1990).
Effect of Slopes on Solar Radiation
The play of the sun on the mountain landscape is like a symphony. As the hours, days,
and seasons follow one another, the sun bursts upon some slopes with all the strength of
15 Draft: Chap. 4 Mt. Climate by A. Bach for Mountains and People
crescendo while the shadows lengthen and fade into diminuendo on others. The melody is
continuous and ever-changing, with as many scores as there are mountain regions, but the theme
remains the same. It is a study of slope angle and orientation.
The closer to perpendicularly the sun's rays strike a surface, the greater their intensity.
The longer the sun shines on a surface, the greater the heating that takes place (Anderson 1998).
In mountains, every slope has a different potential for receiving solar radiation. This amount can
be measured if the following data are known: latitude, time of year (height of sun), time of day,
elevation, slope angle, and slope orientation (Gamier and Ohmura 1968, 1970; Swift 1976; Baily
et al. 1989; Bowers and Bailey 1989; Huo and Bailey 1992). The basic characteristics of solar
radiation on slopes are illustrated in Figure 4.7. This very useful diagram shows the situation for
one latitude at four times of the year, at four slope orientations. They do not include the effects
of clouds; diffuse sky radiation, or the receptiveness of different slopes to the sun's rays. The
diagram also fails to reveal the shadow effects caused by the presence of ridges or peaks above a
location.
Most mountain slopes receive fewer hours of sunshine than a level surface, although
slopes facing the sun may receive more energy than a level surface (this is particularly true at
higher latitudes). In the tropics, level surfaces usually receive a higher solar intensity than slopes
because the sun is always high in the sky. Whatever the duration and intensity of sunlight, the
effects are generally clearly evident in the local ecology (Fig. 4.8). In the northern hemisphere,
south-facing slopes are warmer and drier than north-facing slopes and, under humid conditions,
are more favorable for life. Timberlines go higher on south-facing slopes, and the number and
diversity of plants and animals are greater (Germino and Smith 2000). Humans take advantage
of the sunny slopes. In the east-west valleys of the Alps most settlements are located on
south-facing slopes. Houses are seldom found within the mid-winter noonday shadow area,
although they may go right up to the shadow line (Fig. 4.9; Garnett 1935, 1937). In spring
north-facing slopes may still be deep in snow while south-facing slopes are clear. As a result,
north-facing slopes have traditionally been left in forest while south-facing slopes are used for
high pastures (Fig. 4.10). The environmental differences are so great between the sunny and
shady sides of the valley that each mountain speech or dialect in the Alps has a special term for
these slopes (Peattie 1936). The most frequently used are the French adret (sunny) and ubac
(shade).

16 Draft: Chap. 4 Mt. Climate by A. Bach for Mountains and People
East- and west-facing slopes are also affected differently by solar radiation. Soil and
vegetation surfaces are frequently moist in the morning, owing to higher humidity at night and
the formation of dew or frost. On east-facing slopes the sun's energy has to evaporate this
moisture before the slope can heat appreciably. By the time the sun reaches the west-facing
slope, however, the moisture has already evaporated, so the sun's energy more effectively heats
the slope. The driest and warmest slopes are, therefore, those that face toward the southwest
rather than strictly south (Blumer 1910).
Cloud cover, which varies latitudinally, from season to season, and according to time of
day, can make a great deal of difference in the amount of solar energy received on slopes.
During storms the entire mountain may be wrapped in clouds; even during relatively clear
weather, mountains may still experience local clouds. In winter, stratus clouds and fog are
characteristic on intermediate slopes and valleys, but these frequently burn off by midday. In
summer, the mornings are typically clear but convection clouds (cumulus) build by mid-
afternoon from thermal heating. Consequently, convection clouds result in east-facing slopes
receiving greater sunlight while stratus clouds, as described above, allow greater sun on
west-facing slopes. As clouds move over mountains, build and dissipate through each day, they
have a marked effect upon the amount and character of radiation received.
Mountains are composed of a wide range of surface types, snow, ice, water, grassy
pastureland, extensive forests, desert shrub, soils, and bare bedrock. This extensive variety of
surface characteristics affects the receipt of incoming solar radiation (Miller 1965, 1977; Goodin
and Isard 1989; Tappenier and Cernusca 1989). The effects of two factors, groundcover and
topographic setting, will illustrate this. Dark-colored features, including vegetation, absorb
rather than reflect radiation, receiving increased amounts of energy. Snowfields, glaciers, and
light-colored rocks have a high reflectivity (albedo), so that much of the incoming shortwave
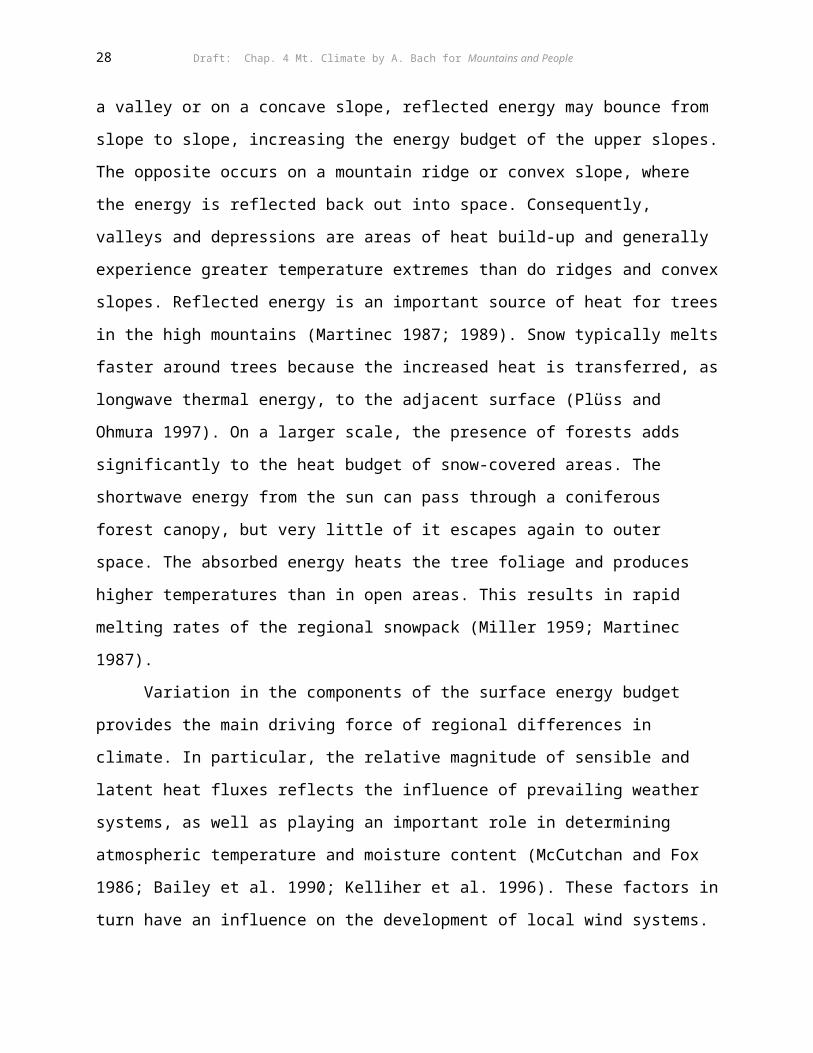
energy is lost. If the snow is in a valley or on a concave slope, reflected energy may bounce
from slope to slope, increasing the energy budget of the upper slopes. The opposite occurs on a
mountain ridge or convex slope, where the energy is reflected back out into space.
Consequently, valleys and depressions are areas of heat build-up and generally experience
greater temperature extremes than do ridges and convex slopes. Reflected energy is an important
source of heat for trees in the high mountains (Martinec 1987; 1989). Snow typically melts faster
around trees because the increased heat is transferred, as longwave thermal energy, to the

17 Draft: Chap. 4 Mt. Climate by A. Bach for Mountains and People
adjacent surface (Plüss and Ohmura 1997). On a larger scale, the presence of forests adds
significantly to the heat budget of snow-covered areas. The shortwave energy from the sun can
pass through a coniferous forest canopy, but very little of it escapes again to outer space. The
absorbed energy heats the tree foliage and produces higher temperatures than in open areas. This
results in rapid melting rates of the regional snowpack (Miller 1959; Martinec 1987).
Variation in the components of the surface energy budget provides the main driving force
of regional differences in climate. In particular, the relative magnitude of sensible and latent heat
fluxes reflects the influence of prevailing weather systems, as well as playing an important role
in determining atmospheric temperature and moisture content (McCutchan and Fox 1986; Bailey
et al. 1990; Kelliher et al. 1996). These factors in turn have an influence on the development of
local wind systems. The surface energy budgets can vary significantly in mountains due to the
effects of both complex topography and surface characteristics. When snow or ice are present,
energy must first be partitioned to ablation before temperatures rise, and once the snow melts
there are large changes in albedo (Cline 1997). These variations affect both the distribution of
incoming and outgoing radiation, influencing net radiation, soil heat flux, sensible and latent
heat; and producing a range of topo- and microclimates (Barry and Van Wie 1974; Green and
Harding 1980; Fitzharris 1989; Germino and Smith 2000).
Temperature
The decrease of temperature with elevation is one of the most striking and fundamental
features of mountain climate. Those of us who are fortunate enough to live near mountains are
constantly reminded of this fact, either by spending time in the mountains or by viewing the
snowcapped peaks from a distance. Nevertheless, there are many subtle and poorly understood
characteristics about the nature of temperature in mountains. Alexander Von Humboldt was so
struck by the effect of temperature on the elevational zonation of climate and vegetation in the
tropics that he proposed the terms tierra calienfe, tierra templada, and tierra fria for the hot,
temperate, and cold zones. These terms, commonplace in the tropics today, are still valid for this
region. Their extension to higher latitudes by others, however, under the mistaken assumption
that the same basic kinds of temperature conditions occur in belts from the equator to the poles
has been unfortunate. This simplistic approach is still used in some textbooks.

18 Draft: Chap. 4 Mt. Climate by A. Bach for Mountains and People
Vertical Temperature-Gradient
Change of temperature with elevation is called the environmental or normal lapse rate.
De Saussure, who climbed Mount Blanc in 1787, was one of the first to measure temperature at
different elevations. Since his time many temperature measurements have been made in
mountains throughout the world, and almost every one of them has been different (Tabony
1985). The lapse rate varies according to many factors. Nevertheless, by averaging the
temperatures at different levels, as well as those measured in the free air by balloon, radiosonde,
and aircraft, average lapse rates have been established, ranging from 1˚C to 2˚C (1.8˚F to 3.6˚F)
per 300 m (1,000 ft.) (McCutchan 1983). Aside from purposes of gross generalization, however,
average lapse rates have little value in mountains. There is no constant relationship between
altitude and temperature. Instead, the lapse rate changes continually with changing conditions,
particularly the diurnal heating and cooling of the earth’s surface. For example, the vertical
temperature-gradient is normally greater during the day than at night, and greater during the
summer than in winter. The gradient is steeper under clear than cloudy conditions, steeper on
sun-exposed slopes than shaded ones, and steeper on continental mountains than on maritime
mountains (Peattie 1936; Dickson 1959; Tanner 1963; Yoshino 1964a, 1975; Coulter 1967;
Marcus 1969). There is also a difference between the characteristics of free-air temperature and
that measured on a mountain slope (McCutchan 1983; Richner and Phillips 1984; Pepin and
Losleben 2002). Of course, the higher and more isolated a mountain peak is, the more closely its
temperature will approach that of the free atmosphere (Schell 1934, 1935; Eide 1945; Samson
1965).
Table 4.4 shows data for the average decrease of temperature with changing elevation in
the Alps, and Figure 4.11 illustrates the temperature changes with elevation in the southern
Appalachians of the United States. The temperatures shown are averages, with some
interpolation between stations; the actual decrease with elevation is much more variable. A
station located on a sunny slope will have a temperature regime different from that of a shaded
slope (Fig. 4.23). The disposition of winds and clouds is equally important, as is the nature of
the slope surface-whether it is snow-covered, wet or dry, bare or vegetated (Green and Hardy
1979; 1980). A convex slope has qualities of heat retention different from those of a concave
slope. A high valley will heat up more during the day (and cool down more at night) than an
exposed ridge at the same elevation. Nevertheless, broad averages will smooth out the extremes

19 Draft: Chap. 4 Mt. Climate by A. Bach for Mountains and People
and individual differences, generally showing a steady and progressive decrease in temperature
with increase in elevation.
Mountain Mass (Massenerhebung) Effect
Large mountain systems create their own surrounding climate (Ekhart 1948). Similar to
the continentality effect, the greater the surface area or land mass at any given elevation, the
greater effect the mountain area will have on its own environment. Mountains serve as elevated
heat islands where solar radiation is absorbed and transformed into long-wave heat energy,
resulting in much higher temperatures than those found at similar altitudes in the free air (Flohn
1968; Chen et al. 1985; Rao and Endogan 1989). Accordingly, the larger the mountain mass, the
more its climate will vary from the free atmosphere at any given altitude. This is particularly
evident on some of the high plateaus, where treeline and snowline often occur at higher
elevations than on isolated peaks at the same elevation. On the broad general level of the
Himalayas, at 4,000 m (13,100 ft.) it seldom freezes during summer, while on the isolated peaks
at 5,000 m (16,400 ft.) it seldom thaws (Peattie 1936; Tang and Reiter 1989; Brazel and Marcus
1991).
An excellent example of the heating effect of large high-altitude land masses is the
Mexican Meseta (Fig. 4.12). Radiosonde data indicate higher temperatures in the free
atmosphere over the plateau than over the Pacific and Gulf coasts up to an elevation of almost
6,000 m (20,000 ft.). The mean annual temperature over the central plateau at 3,000 m (10,000
ft.) is about 3˚C (5.4˚F) warmer than that over coastal stations (Hastenrath 1968). This is largely
due to the heating effects of the sun on the larger land mass exposed at higher elevations.
In establishing the relationships between mountain mass and the heat balance,
continentality, latitude, amount of cloud cover, winds, precipitation, and surface conditions must
all be considered. A persistent cloud cover during the summer can prevent a large mountain
mass from showing substantial warming. Also, the presence of a heavy snow cover can retard
the warming of a mountain area in spring because of surface reflectivity and the amount of
initial heat required to melt the snow. The high Sierra Nevada of California are relatively warm
compared with other mountain areas, in spite of heavy snowfalls (Miller 1955). This is partially
because the extreme clarity of the skies over this region in late summer allows maximum
reception of solar energy. In general, the effect of greater mountain mass on climate is somewhat

20 Draft: Chap. 4 Mt. Climate by A. Bach for Mountains and People
like that of increasing continentality. The ranges of temperature are greater than on small
mountains, i.e., the winters are colder and the summers warmer, but the average of these
temperatures will generally be higher than the free air at the same altitude. The effective
growing climate, especially, is more favorable at the soil surface than in the free air, owing to
higher soil temperatures. This is particularly true when there is a high percentage of sunshine
(Peattie 1931; Yoshino 1975).
Generally, the larger the mountain mass, the higher the elevation at which vegetation
grows. The most striking example of this is found in the Himalayas, where plants reach their
absolute highest altitude (Zimmermann 1953; Webster 1961; Chen et al. 1985). In the Alps
(where the influence of mountain mass, Mussenerhebung, was first observed) the timberline is
higher in the more massive central area than on the marginal ranges (Imhof 1900, in Peattie
1936, p. 18). At a more local level, the effects of mountain mass on vegetation development can
be observed in the Oregon Cascades. Except for Mount McLoughlin in southern Oregon,
timberline is highest and alpine vegetation reaches its best development in the Three Sisters
Wilderness area, where three peaks join to form a relatively large land mass above 1,800 m
(6,000 ft.) (Price 1978). On the higher but less massive peaks of Mount Hood and Mount
Washington a few kilometers to the north, the timberline is 150-300 m (500-1,000 ft.) lower and
the alpine vegetation is considerably more impoverished. The development of vegetation
involves more than climate, of course, since plant adaptations and species diversity are related to
the size of the gene pool and other factors (Van Steenis 1961). Nevertheless, vegetation is a
useful indicator of environmental conditions and a positive correlation between vegetation
development and mountain mass can be observed in most mountain areas (see pp. 266-67).
An interesting practical consequence of the mountain mass effect is that rice, basically a
tropical plant, can grow at higher altitudes in the subtropics than in the tropics. Rice cultivation
goes up to 2,500 m (8,250 ft.) in the high interior valleys of the Himalayas (Fig. 4.13) but only
reaches about 1,500 m (5,000 ft.) in the humid tropics. The lower tropical limits are due to the
lower cloud level, whereas the higher elevations reached in the Himalayas are due to the greater
mountain mass and reduced cloudiness, permitting greater possible sunshine, higher
temperatures, and a longer growing season than would otherwise be expected. In general, the
upper limit of rice cultivation corresponds closely to the limit of frost during the growing season.
At the highest levels in the Himalayas, rice seedlings are germinated and grown inside the

21 Draft: Chap. 4 Mt. Climate by A. Bach for Mountains and People
houses, since it takes eight months for complete production at this elevation but the growing
season is only seven months long (Uhlig 1978).
Temperature Inversion
Temperature inversions are ubiquitous in landscapes with marked relief, and anyone who
has spent time in or around mountains is certain to have experienced their effects. Inversions are
the exception to the general rule of decrease in temperature with elevation. During a temperature
inversion the lowest temperatures occur in the valley and increase upward along the mountain
slope. Eventually, however, the temperatures will begin to decrease again, so that an
intermediate zone, the thermal belt, will experience higher night temperatures than either the
valley bottom or the upper slopes (Yoshino 1984).
Cold air is denser and therefore heavier than warm air. As slopes cool at night, the colder
air begins to slide down slope, flowing underneath and displacing the warm air in the valley.
Temperature inversions are best developed under calm, clear skies, where there is no wind to
mix and equalize the temperatures and the transparent sky allows the surface heat to be rapidly
radiated and lost to space (Blackadar 1957). Consequently, the surface becomes colder than the
air above it, and the air next to the ground flows downslope. These slope winds are further
explored on pp. 34. The cold air will continue to collect in the valley until an equilibrium
between the temperatures of the slopes and the valleys has been established. If the valley is
enclosed, a pool of relatively stagnant colder air may collect, but if the valley is open there may
be a continuous movement of air to the lower levels, leading to the development of pollution
problems (Whiteman and KcKee 1978; Nappo et al 1989). The depth of the inversion depends
on the characteristics of the local topography and the general weather conditions, but it is
generally not more than 300-600 m (1,000-2,000 ft.) in depth.
Figure 4.14 demonstrates a temperature inversion in Gstettneralm, a small enclosed basin
at an elevation of 1,270 m (4,165 ft.) in the Austrian Alps, about 100 km (62 mi.) southwest of
Vienna. Because of the local topographic situation and the "pooling" of cold air, this valley
experiences some of the lowest temperatures in Europe, even lower than the high peaks
(Schmidt 1934). The lowest temperature recorded at Gstettneralm is -51˚C (-59.8˚F) while the
lowest temperature recorded at Sormblick at 3,100 m (10,170 ft.) is -32.6˚C (-26.7˚F).

22 Draft: Chap. 4 Mt. Climate by A. Bach for Mountains and People
As might be expected, distinct vegetation patterns are associated with these extreme
temperatures. Normally, valley bottoms are forested and trees become stunted on the higher
slopes, eventually being replaced by shrubs and grasses still higher up, but the exact opposite
occurs here. The valley floor is covered with grass, shrubs, and stunted trees, while the larger
trees occur higher up. An inversion of vegetation matches that of temperature (Schmidt 1934). A
similar vegetative pattern has been found in the arid mountains of Nevada, where valley bottoms
support sagebrush, while higher up is a zone of pinyon and juniper woodland. Higher still the
trees again disappear (Billings 1954). The pinyon/juniper zone, the thermal belt, is sandwiched
between the lower night temperatures of the valley bottom and those which occur higher up on
the slopes.
Human populations have taken advantage of thermal belts for centuries, particularly in
the cultivation of frost-susceptible crops such as vineyards and orchards. In the southern
Appalachians of North Carolina, the effect of temperature inversions is clearly displayed by the
distribution of the fruit orchards (Cox 1920,1923; Dickson 1959; Dunbar 1966). During the
winter, the valleys are often brown with dormant vegetation, while the mountain tops at 1,350 m
(4,430 ft.) may be white with snow. In between is a strip of green that marks the thermal belt.
Frost is common in the valley, but in the thermal belt they cultivate a sensitive Isabella grape
which has apparently grown for years without danger from frost (Peattie 1936). A similar
situation exists in the Hood River Valley of Oregon, on the north side of Mount Hood. Cherries
are grown on the slopes of this valley in a sharply delimited thermal belt between the river and
the upper slopes. With increased demand, more fruit trees are being planted in marginal areas,
but their success is questionable, since the risk of frost is much greater.
Temperature Range
The temperature difference between day and night and between winter and summer
generally decreases with elevation (Fig. 4.15; Linacre 1982). This is because of the relatively
greater distance from the heat source, the broad level of the earth's surface. Like the analogy of a
marine island and the dominating influence of the ocean, the higher and more isolated a
mountain, the more its temperature will reflect that of the surrounding free air. Temperature in
mountains is largely a response to solar radiation. The free air, however, is essentially
non-responsive to the heating effects of the sun, particularly at higher altitudes. A mountain
23 Draft: Chap. 4 Mt. Climate by A. Bach for Mountains and People
becomes heated at the surface but there is a rapid temperature-gradient in the surrounding air. As
a result, only a thin boundary layer or thermal shell surrounds the mountain, its exact thickness
depending on a variety of factors (e.g., solar intensity, mountain mass, humidity, wind velocity,
surface conditions, and topographic setting).
Ambient temperatures are normally measured at a standard instrument-shelter height of
1.5 m (5 ft.). Such measurements generally show a progressive decline in temperature and a
lower temperature range with elevation (Table 4.4; Figs. 4.11, 4.15). There is a vast difference
between the temperature conditions at a height of 1.5 m (5 ft.) and immediately next to the soil
surface, however. Paradoxically, the soil surface in alpine areas may experience higher
temperatures (and therefore a greater temperature range) than the soil surface of low elevations,
due to the greater intensity of the sun at high elevations (Anderson 1998). At an elevation of
2,070 m (6,800 ft.) in the Alps, temperatures up to 80˚C (176˚F) were measured on a dark
humus surface near timberline on a southwest-facing slope with a gradient of 35˚ (Turner
1958b). This is comparable to the maximum temperatures recorded in hot deserts! At the same
time, the air temperature at a height of 2 m (6.5 ft.) was only 30˚C (86˚F), a difference of 50˚C
(90˚F). Such high surface temperatures may occur infrequently and only under ideal conditions,
but temperatures somewhat less extreme are characteristic, and demonstrate the vast differences
that may exist between the surface and the overlying air (Fig. 4.16). The soil surface in the
alpine tundra will almost always be warmer during the day than the air above it. It may also
become colder at night, although the differences are far less at night than during the day. The
low growth of most alpine vegetation may be viewed as an adaptation to take advantage of these
warmer surface conditions. In fact, several studies have shown that tundra plants may suffer
more from high temperatures than from low temperatures (Dahl 1951; Mooney and Billings
1961).
Temperature ranges vary not only with elevation, but on a latitudinal basis as well. The
contrast in daily and annual temperature ranges is one of the most important distinguishing
characteristics between tropical and mid-latitude or polar climates. The average annual
temperatures of high tropical mountains and polar climates are similar. The average annual
temperature of El Misti in Peru at 5,850 m (19,193 ft.) is -8˚C (18˚F), which is comparable to
many polar stations. The use of this value alone is grossly misleading, however, since there are
vast differences in the temperature regimes. Tropical mountains experience a temperature range

24 Draft: Chap. 4 Mt. Climate by A. Bach for Mountains and People
between day and night that is relatively greater than any other mountain area, due to the strongly
positive heating effect of the sun in the tropics. On the other hand, changes in temperature from
month to month or between winter and summer are minimal. This is in great contrast to
middle-latitude and polar mountains, which experience lower daily temperature ranges with
latitude, but are increasingly dominated by strong seasonal gradients. Knowledge of the
differences between these temperature regimes is essential to an understanding of the nature and
significance of the physical and biological processes at work in each latitude.
Figure 4.17a depicts the temperature characteristics of Irkutsk, Siberia, a subpolar station
with strong continentality. The most striking feature of this temperature regime is its marked
seasonality. The daily range is only 5˚C (9˚F), while the annual range is over 60˚C (108˚F). This
means that during winter, which lasts from October to May, the temperatures are always below
freezing, while in summer they are consistently above freezing. The period of stress for
organisms, then, is concentrated into winter. An alpine station at this latitude would have
essentially the same temperature regime except for a relatively longer period with negative
temperatures and a shorter period with positive temperatures. More poleward stations would
show an even smaller daily temperature range (Troll 1968).
Such a temperature regime stands in great contrast to that of tropical mountains. Figure
4.17b shows the temperature characteristics of Quito, Ecuador, located on the equator at an
elevation of 2,850 m (9,350 ft.). The isotherms on the graph are oriented vertically, indicating
very little change between winter and summer, but with a marked contrast between day and
night. The average annual range is less than 1˚C (1.8˚F), while the average daily range is
approximately 11˚C (19.8˚F). This beautifully demonstrates the saying, "Night is the winter of
the tropics"; night is indeed the only winter the humid tropics experience. This is particularly
true if the station is high enough for freezing to occur.
The lower limit of frost is determined principally by latitude, mountain mass,
continentality, and the local topographic situation. In the equatorial Andes it exists at about
3,000 m (10,000 ft.). This elevation decreases with latitude; the point where frost begins to occur
in the lowlands is normally taken as being the outer limits of the tropics. In North America the
frost line runs through the middle of Baja California and eastward to the mouth of the Rio
Grande, although it is highly variable from year to year. The frost line in tropical mountains is
much more sharply delineated. In Quito, Ecuador, at 2,850 m (9,350 ft.), frost is practically

25 Draft: Chap. 4 Mt. Climate by A. Bach for Mountains and People
unknown. The vegetation consists of tropical evergreen plants which blossom continuously;
farmers plant and harvest crops throughout the year. By an elevation of 3,500 m (11,500 ft.),
however, frost becomes a limiting factor (Troll 1968). At an elevation of 4,700 m (15,400 ft.) on
El Misti in southern Peru, it freezes and thaws almost every day of the year.
The fundamental relationships between these disparate freeze-thaw regimes are
demonstrated in Figure 4.18. Each of the sites selected has a similar average annual temperature
of -8˚C to -2˚C (18˚F to 28˚F) but the daily and annual ranges are markedly different. Yakutsk,
Siberia, experiences strong seasonality, with a frost-free summer period of 126 days, but in
winter the temperatures remain below freezing for 197 days. Alternating freezing and thawing
take place during 42 days in the spring and fall. At Sormblick in the Alps, the winter season is
much longer (276 days), with a very short summer during which freezing and thawing can occur
at any time. El Misti, however, is dominated by a freeze-thaw regime that operates almost every
day throughout the year. This type of weather has been characterized as "perpetual spring": the
sun melts the night frost every morning and the days are quite pleasant. The twelve-hour day
adds to the impression of spring (McVean 1968). It can be seen that these different systems
provide greatly contrasting frameworks for the survival of plants and animals, as well as for the
development of landscapes.
Humidity and Evaporation
Water vapor constitutes less than 5% of the atmosphere but it is by far the single most
important component with regard to weather and climate. It is highly variable in space and time.
Water vapor provides energy for storms and its abundance is an index of the potential of the air
for yielding precipitation; it absorbs infrared energy from the sun and reduces the amount of
shortwave energy reaching the earth; it serves as a buffer from temperature extremes; and it is
important biologically, since it controls the rate of chemical reactions and the drying power of
the air. The moisture content of the atmosphere decreases rapidly with increasing altitude. At
2,000 m (6,600 ft.) it is only about 50 percent of that at sea level; at 5,000 m (16,400 ft.) it is
less than 25%; and at 8,000 m (26,200 ft.) the water-vapor content of the air is less than 1% of
that at sea level (Table 4.2). Within this framework, however, the presence of moisture is highly
variable. This is true on a temporal basis, between winter and summer, day and night, or within a
matter of minutes when the saturated air of a passing cloud shrouds a mountain peak

26 Draft: Chap. 4 Mt. Climate by A. Bach for Mountains and People
(McCutchan and Fox 1986; Huntington et al. 1998). It is also true on a spatial basis, between
high and low latitudes, a marine and a continental location, the windward and leeward sides of a
mountain range, or north and south-facing slopes. The general upward decrease in water-vapor
content, and the variations that occur, are illustrated by the east and west sides of the tropical
Andes (Fig. 4.19). The contrast in absolute humidity between these two environments is
immediately apparent, although the difference decreases with elevation and probably disappears
altogether above the mountains. Imata, Salcedo, and Arequipa on the west have only about half
the water-vapor content of stations on the east (Cerro do Pasco, Pachachaca, Huancayo,
Bambamarca). Values similar to those at Arequipa occur at elevations 2,000 m (6,600 ft.) higher
on the east side (e.g., at Pachachaca). During the wet season, however, the absolute humidity at
Arequipa may be two to three times higher than during the dry season. This corresponds to an
elevational difference of up to 3,000 m (10,000 ft.).
The decrease in water vapor with altitude may seem somewhat difficult to explain, since
it is well-known that precipitation increases with elevation. The two phenomena are not directly
related, however. Precipitation results from the lifting of moist air from lower elevations upward
into an area of lower temperature. Increasing precipitation does create a more humid
environment in mountains, at least for part of the year and up to certain elevations, but
eventually signs of aridity increase. Aridity at high elevations is due, in part, to lower barometric
pressure, stronger winds, porous well-drained soils, and the intense sunlight.
The greater aridity of high elevation is evident from the plants and animals, many of
which have adapted to a dry environment. Thick, corky bark and waxy leaves are common in
alpine plants (Isard and Belding 1986). Mountain sheep and goats and their cousins, the llama,
guanaco, alpaca, chamois, and ibex, are all able to live for prolonged periods on little moisture.
Geomorphologically, aeolian processes become increasingly important in higher landscapes, and
the low availability of moisture is reflected in soil development (Litaor 1987). One of the
physiological stresses reported by climbers on Mount Everest is a dryness of the throat and a
general desiccation. The establishment of sanatoriums in alpine areas to utilize the intense
sunlight and clean, dry air was mentioned earlier (Hill 1924). Air-dried meat is a provincial dish
in the high Engadine, and pemmican and jerky were both important in the mountains of western
North America. In the Andes, an ancient method exists for the production of dried potatoes
(chuho) in the high dry air above 3,000 m (10,000 ft.). Permanent settlement of the higher
27 Draft: Chap. 4 Mt. Climate by A. Bach for Mountains and People
elevations apparently depended upon the development of this technique of food preservation
(Troll 1968). Mummification of the dead was practiced in the Andes and in the Caucasus.
The lower absolute humidities and the tendency toward aridity at higher altitudes suggest
greater evaporation rates with elevation. However, this may not be true, since the few studies of
alpine evaporation have conflicting results (reviewed in Barry, 1992). Several studies do indicate
an increase of evaporation with elevation (Hann 1903; Church 1934; Matthes 1934; Peattie
1936; Henning and Henning 1981; Sturman and Tapper 1996). For example, Matthes (1934), in
discussing the development of the dimpled surfaces (sun cups) of snowfields above 3,600 m
(12,000 ft.) in the Sierra Nevada of California, states that ablation (the combined processes of
wasting away of snow and ice) is caused entirely by evaporation, since melting does not occur at
this elevation. Two years of water balance data from a high elevation (2,800-3,400 m) lake in
the Sierra Nevada show that evaporation accounts for 19-32% of the ablation (Kattelman and
Elder 1991). Snowfall contributed 95% of the precipitation and 80% of the evaporative
(sublimation) losses came from snowcover. Similar results were reported from the alpine zone of
the White Mountains of California (Beatty 1975). However, other studies in the have shown that
evaporation does not exceed 10% of the total ablation (Kehrlein et al. 1953). Whichever of these
observations is accepted as being the more general, it should be noted that these particular alpine
areas are exceptionally, if not uniquely, dry environments, with high solar intensities, strong
winds, and persistent subfreezing temperatures (Terjung et al. 1969a; LeDrew 1975). The bulk
of investigations on snowfields and glaciers in other regions have tended to show that
evaporation is relatively unimportant in total ablation. In some cases, evaporation may actually
inhibit ablation, owing to the heat it extracts (Howell 1953; Martinelli 1960; Hoinkes and
Rudolph 1962; Platt 1966). In addition, long-term studies of evaporation in measurement pans
and lakes at different elevations in the western United States have shown that evaporation
decreases with elevation (Fig. 4.20; Shreve 1915; Blaney 1958; Longacre and Blaney 1962;
Peck and Pfankuch 1963).
Evaporation and the factors that control it in a natural environment are exceedingly
complex (Horton 1934; Penman1963; Gale 1972; Calder 1990). The rate depends upon
temperature, solar intensity, atmospheric pressure, the available quantity of water (soil
moisture), the degree of saturation of the air, and wind. One of the problems in measuring the
rate of evaporation is the availability of moisture. In a lake or evaporating pan, the available
28 Draft: Chap. 4 Mt. Climate by A. Bach for Mountains and People
moisture is for all practical purposes unlimited, but this is not true for most surfaces in high
mountains. Rainfall is generally lost to the surface by drainage through porous soil or by runoff
on steep slopes. As a result, there is frequently little surface moisture available for evaporation,
no matter how great the measured rates are from an evaporation pan. For this reason, the
determination of evapotranspiration, the loss of water to the air from both plant and soil
surfaces, has become an increasingly attractive approach (Thomthwaite and Mather 1951;
Penman 1963; Rao et al. 1975; Henning and Henning 1981).
The single most important factor in controlling the decrease of evaporation with
elevation is temperature, both of the evaporation surface and of the air directly above it
(Konzelman et al. 1997; Huntinton et al. 1998). While it is true that soil surfaces exposed to the
sun at high elevations may reach exceptionally high temperatures, this is a highly variable
condition (Anderson 1998; Germino and Smith 2000). During periods of high sun intensity and
high soil temperatures, the potential for evaporation may be considerable, especially when the
wind is blowing (Isard and Belding 1986). Generally, however, the lower temperatures of higher
altitudes are more than sufficient to compensate for the decreasing water-vapor content and
lower barometric pressure, so that the vapor pressure gradient is likewise decreased (Bailey et al.
1990). In other words, the relative humidity (ratio of water vapor in the air to the maximum
amount it could hold at that temperature) increases with decreasing temperature, and it is the
relative humidity that really determines the rate of evaporation. This is illustrated by the
surprising fact that the water-vapor content of the air in the Sahara Desert is two to three times
greater than that over the Rocky Mountains during clear summer weather. Owing to the higher
temperatures in the Sahara, however, the relative humidity is usually not more than 20-30%,
compared to 40-60% for the Rockies. Consequently, the evaporation rate in the Sahara far
exceeds that of the Rockies, even though there is more actual moisture in the desert.
An inverse relationship exists between air temperature and relative humidity. This can be
seen by comparing measurements taken in mountains during day and night, and at various slope
exposures (Fig. 4.21). The greatest contrasts occur on south-facing slopes in the northern
hemisphere. Under the higher temperatures that prevail during the day, relative humidity varies
very little with elevation, although it is lowest in the valley bottom. At night there is
considerable contrast because of the temperature inversion that develops in the valley, resulting
in lower temperatures and high relative humidities. The lowest relative humidity occurs

29 Draft: Chap. 4 Mt. Climate by A. Bach for Mountains and People
immediately above the temperature inversion, in the thermal belt, where temperatures are higher
(Hayes 1941). The difference in relative humidity between the two slopes gradually decreases
with elevation.
Local wind circulation can also greatly affect water-vapor content: descending air brings
dry air from aloft, while ascending air carries moist air upward from below. At night colder air
tends to descend through air drainage, but during the day the slopes are warmed and the air rises.
Under these conditions, the normal inverse temperature/relative-humidity relationship may be
overridden. Even though the summit air is cool at night, the motion of the descending air lowers
the relative humidity. During the day, however, when temperatures are higher and
relative humidity would normally decrease, it may actually increase, because the valley breezes
carry moist air up the mountain slopes. This frequently results in afternoon clouds and
precipitation (Schell 1934).
Precipitation
The increase of precipitation with elevation is well-known. It is demonstrated in every
country of the world, even if the landforms involved are only small hills. In many regions an
isohyetal map with its lines of equal precipitation will look similar to a topographic map
composed of lines of equal elevation (Fig. 4.22). Of course, the data on which most precipitation
maps are based are scanty, so that considerable interpolation may be necessary, particularly in
the areas of higher relief (Peck and Brown 1962; Kyriakidis et al. 2001). Precipitation does not
always correspond to landforms. In some cases, maximum precipitation may occur at the foot or
in advance of the mountain slopes (Reinelt 1968; Barry 1992). In some regions and under certain
conditions, valleys may receive more rainfall than the nearby mountains (Sinclair et al. 1997). In
many higher alpine areas, precipitation decreases above a certain elevation, with the peaks
receiving less than the lower slopes. Wind direction, temperature, moisture content, storm and
cloud type, depth of the air mass and its relative stability, orientation and aspect, and
configuration of the landforms are all contributing factors in determining location and amount of
precipitation (Sinclair 1994; Ferretti et al. 2000; McGinnis 2000; Drogue et al. 2002). The
complex topographic arrangement and often high relief of mountains creates complex meso- and
micro-scale three-dimensional circulation and cloud formations, leading to complex spatial
patterns of precipitation within mountainous regions (Bossert and Cotton 1994; Cline et al. 1998;

30 Draft: Chap. 4 Mt. Climate by A. Bach for Mountains and People
Garreaud 1999; Germann and Joss 2001; 2002). Great variations in precipitation occur within
short distances; one slope may be excessively wet while another is relatively dry. The terms "wet
hole" and "dry hole" may be used in this regard. Jackson Hole, Wyoming, is located in a
protected site at the base of the Grand Tetons. The mountains receive 1,400 mm. (55 in.) but
Jackson Hole, only 16 km (10 mi.) away, receives 380 mm (15 in.).
The most fundamental reason for increased precipitation with elevation is that landforms
obstruct the movement of air and force it to rise. This is part of a complex of processes known as
the orographic effect (from the Greek oros, meaning "mountain," and graphein, "to describe").
Forced ascent of air is most effective when mountains are oriented perpendicular to the
prevailing winds; the steeper and more exposed the slope, the more rapidly air will be forced to
rise. As air is lifted over the mountains it is cooled by expansion and mixing with cooler air at
higher elevations. The ability of air to hold moisture depends primarily upon its temperature,
warm air can hold much more moisture than cold air. The temperature, the pressure, and the
presence of hygroscopic nuclei in the atmosphere tend to concentrate the water vapor in its lower
reaches. This is why most clouds occur below 9,000 m (30,000 ft.), and why those that do
develop higher than this are usually thin and composed of ice particles and yield little or no
precipitation.
When the air holds as much moisture as it can (relative humidity is 100%), it is said to be
saturated. Condensation is a common process in saturated air, and the temperature at which
condensation takes place is called the dew point. Ground forms of condensation, i.e., fog, frost,
and dew, are caused by cooling of the air in contact with the ground surface, but condensation in
the free atmosphere, i.e., clouds, can only result from rising air. The key to forming clouds and
creating precipitation, therefore, is rising air. This may be brought about by one of several ways.
The driving force may be convection (thermal heating), where the sun warms the earth's surface
and warm air rises until clouds begin to form. Such clouds may grow to great size since they are
fed from below by relatively warm, moist rising air, until the moisture content within the clouds
becomes too great and it is released as precipitation. Convectional rainfall is best displayed in
the humid tropics where water vapor is abundant, but it occurs in all climates. The air may also
be forced to rise by the passage of cyclonic storms, where warm and cold fronts lift moist, warm
air over cooler, denser air. This takes place primarily in the middle latitudes in association with
the polar front (Fig. 4.2). Although both of these processes can operate without the presence of

31 Draft: Chap. 4 Mt. Climate by A. Bach for Mountains and People
mountains, their effectiveness is greatly increased on windward sides of mountains and decrease
on leeward sides. For example, a passing storm may drop a certain amount of precipitation on a
plains area, but when the storm reaches the mountains, a several-fold increase in precipitation
typically occurs on the windward side, while a marked decrease generally takes place on the
leeward side.
One has only to compare the distribution of world precipitation with the location of
mountains to see their profound influence (Fig. 4.22). Almost every area of heavy rainfall is
associated with mountains. In general, any area outside the tropics receiving more than 2,500
mm (100 in.) and any area within the tropics receiving more than 5,000 mm (200 in.) is
experiencing a climate affected by mountains. The examples of Cherrapunji, Assam; Mount
Waialeale, Hawai’i; and the Olympic Mountains were given earlier. Many others could be
added: Mount Cameroon, West Africa, the Ghats along the west coast of India, the Scottish
Highlands, the Blue Mountains of Jamaica, Montenegro in Yugoslavia, and the Southern Alps of
New Zealand. The list could go on and on. The reverse is also true, for to the lee of each of these
ranges is a rain-shadow in which precipitation decreases drastically (Manabe and Broccoli 1990;
Broccoli and Manabe 1992). The western Ghats receive over 5,000 mm (200 in.) but
immediately to their lee on the Deccan Plateau the average amount of precipitation is only 380
mm (15 in.). The windward slopes of the Scottish Highlands receive over 4,300 mm (170 in.)
but the amount decreases to 600 mm (24 in.) on the lowlands around the Moray Firth. The Blue
Mountains on the northeast side of Jamaica face the Trade Winds and receive over 5,600 mm
(220 in.), while Kingston, 56 km (35 mi.) to the leeward, receives only 780 mm (31 in.)
(Kendrew 1961). Mountains, therefore, not only cause increased precipitation, but also have the
reciprocal effect of decreasing precipitation.
Despite these useful generalities, many local and regional variations occur within
mountains. The complex local topography creates funneling effects that can increase
atmospheric moisture content and precipitation, even downwind from the funnel (Sinclair et al.
1997). High peaks or ridges within a range can create ‘mini-rain-shadow’ zones even in the
center of a range (Garreaud 1999). The central portion of the north Cascades Range in
Washington receives ~100 cm less precipitation than the surrounding ridges (Kresch 1994).
Significant quantities of precipitation can fall on the leeside of mountains due to spillover effects
(Sinclair et al. 1997; Thompson et al. 1997; Chater and Sturman 1998). Many precipitation maps

32 Draft: Chap. 4 Mt. Climate by A. Bach for Mountains and People
of mountainous regions do not indicate this internal variability due to the lack of data points and
interpolation between existing station data using generalized elevation-precipitation relationships
(Kyriakidis et al. 2001). Additionally, seasonal and interannual variability of storm tracks and
storm intensities can create non-elevational precipitation patterns (Lins 1999).
The movement of air up a mountain slope, creating clouds and precipitation, may be due
simply to the wind, but it is usually associated with convection and frontal activity. Rising air
cools at a rate of 3.05˚C (5.5˚F) per 300 m (1,000 ft.) (dry adiabatic rate) until the dew point is
reached and condensation occurs (Fig. 4.39). Thereafter, the air will cool at a slightly lower rate
(wet adiabatic rate) because of the release of the latent heat of condensation. If, upon being
lifted, the air has a high relative humidity, it may take only slight cooling to reach saturation, but
if it has a low relative humidity it may be lifted considerable distances without reaching the dew
point. Conversely, if the air is warm, it often takes considerable cooling to reach dew point but
then may yield copious amounts of rainfall, whereas cool air usually needs only slight cooling to
reach dew point but also yields far less precipitation. After the air has passed over the mountains
precipitation decreases or may cease as the air descends. As air descends it gains heat at the same
rate at which it was cooled initially 3.05˚C per 300 m (5.5˚F per 1,000 ft.), since it is being
compressed and moving into warmer air (Fig. 4.39). Such conditions are not conducive to
precipitation.
The orographic effect involves several distinct processes: (1) forced ascent, (2) blocking
(or retardation) of storms, (3) the triggering effect, (4) local convection, (5) condensation and
precipitation processes, and (6) runoff.
Forced Ascent
Forced ascent is the most important precipitation process in mountains; after all, rainfall
increases with elevation and is greater on windward than on leeward slopes. The process may be
most clearly seen in coastal mountains, like the Olympics, that lie athwart moisture-laden winds.
Other processes contribute to the total precipitation, of course, and differentiation among them is
difficult. In order to explain the amount and distribution of rainfall caused strictly by forced
ascent it is necessary to consider the atmospheric conditions from three different perspectives
(Sawyer 1956; Sarker 1966; Browning and Hill 1981). First is the large-scale synoptic pattern
that determines the characteristics of the air mass crossing the mountains, its depth, stability,
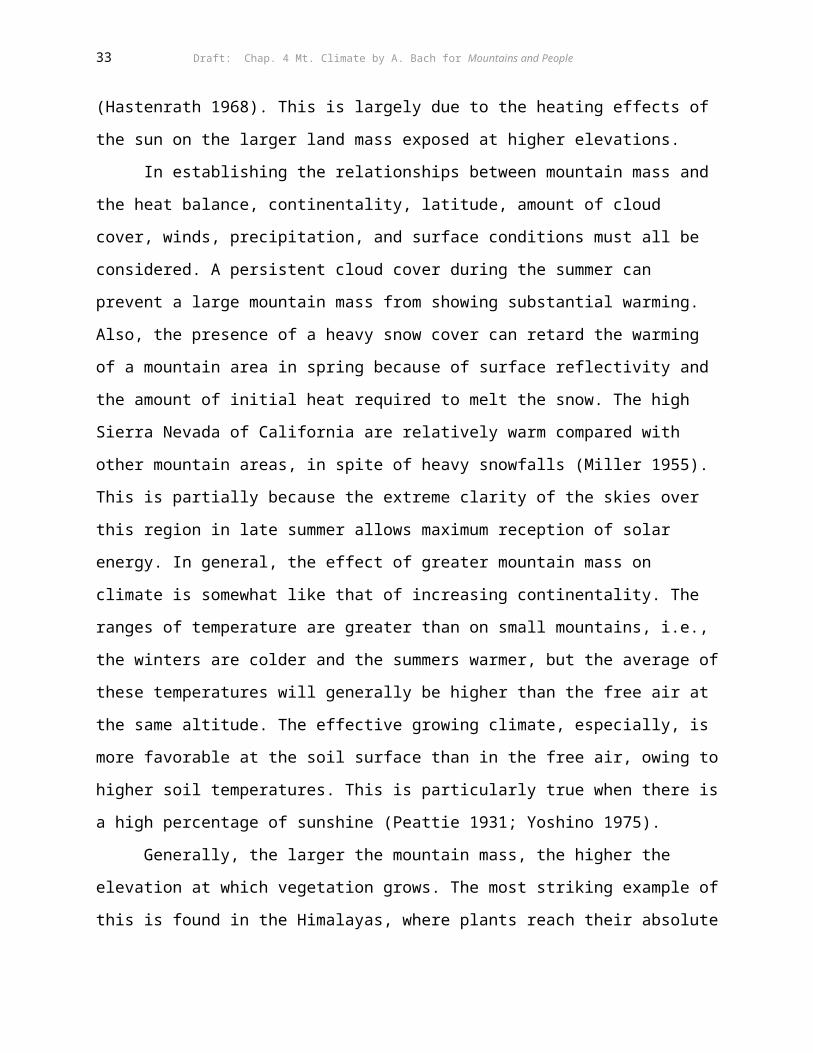
33 Draft: Chap. 4 Mt. Climate by A. Bach for Mountains and People
moisture content, wind speed, and direction (Sinclair 1994; McGinnis 2000). Second is the
microphysics of the clouds, the presence of hydroscopic nuclei, the size of the water droplets,
and their temperature, which will determine whether the precipitation will fall as rain or as snow
or will evaporate before reaching the ground (Andersson 1980; Meyers et al 1995; Uddstrom et
al. 2001). Third, and most important, is the air motion with respect to the mountain (Bates,
1990; Bossert and Cotton 1994; Tucker and Crook 1999). Will it blow over, or around, the
mountain? This will determine to what depth and extent the air mass at each level is lifted. It is
not realistic, for example, to assume that the air is lifted the same amount at all levels. The
solution to these problems involves atmospheric physics and the construction of dynamic models
(Myers 1962; Sarker 1966, 1967; Sinclair 1994; Thompson et al. 1997; Susong et al. 1999;
Drogue et al. 2002).
The simplest system is that of coastal mountains with moisture-laden winds approaching
from the ocean. As the air is lifted from sea-level, the resulting precipitation is clearly due to the
landforms (Colle and Mass, 1996). Exceptions may occur in areas where the mountains are
oriented parallel to the prevailing winds and/or where the frontal systems resist lifting. In
southern California, for example, precipitation is often heavier in the Los Angeles coastal
lowlands than in the Santa Inez and San Gabriel mountains due to the blocking of storms. The
orographic component of precipitation increases only when the approaching air mass is unstable;
under stable conditions, the wind will flow around the mountains (which are oriented east-west),
so there is no significant orographic lifting and the precipitation is due entirely to frontal lifting.
The mountains apparently receive less rainfall than the lowlands under these conditions because
the shallow cloud-development does not allow as much depth for falling precipitation particles
to grow by collision and coalescence with cloud droplets before reaching the elevated land.
The situation becomes even more complex in interior high elevation areas where there is
more than one source region and storms enter the area at various levels in the atmosphere. Such
a situation exists in the Wasatch Mountains of Utah (Williams and Peck 1962; Peck 1972a;
Sassen and Zhao 1993). It has long been known that precipitation in this region is highly
variable; the valleys may receive greater amounts than the mountains during any given storm or
season (Clyde 1931). The average over a period of years, however, does show an increase with
elevation (Price and Evans 1937; Lull and Ellison 1950). The greater precipitation in valleys is
apparently associated with certain synoptic situations, particularly when a "cold low" is observed

34 Draft: Chap. 4 Mt. Climate by A. Bach for Mountains and People
on the upper-air charts. These occur as closed lows on the 500-millibar pressure chart, i.e., at a
height of about 5,500 m (18,000 ft.), and are associated with large-scale upward (vertical)
movement of air which is not displayed in normal cold or warm-front precipitation (Schultz et
al. 2002). Under these conditions, precipitation may occur with relatively little dependence on
orographic lifting, compared to other storm types (Williams and Peck 1962).
Blocking of storms
By retarding or hindering the free movement of storm systems, mountains can cause
increased precipitation (Kimura and Manins 1988). Storms often linger for several days or weeks
as they slowly move up and over the mountains, producing a steady downpour (Kimura and
Manins 1988; Gan and Rao 1994). This is best displayed in the middle latitudes with
high-barrier mountains. Winter storms linger with amazing persistence in the Cascades and in
the Gulf of Alaska before they pass across the mountains or are replaced by another storm.
Storms of similar character in the Great Plains travel much more rapidly, since there are no
restrictions to their movement. The countries surrounding the Alps are ideally located with
respect to storm blocking. Switzerland frequently experiences lingering torrential rains during
the summer (Bonacina 1945; Chen and Smith 1987). In northern Italy, between the Alps and the
Apennines, heavy and persistent rains are associated with the "lee depressions" caused by the
interception of polar air by the Alps (Grard and Mathevet 1972; Pichler and Steinacker 1987).
The Triggering Effect
Although little mention has so far been made of it, one important variable influencing the
amount of precipitation is the stability of the air, that is, its resistance to vertical displacement.
This is controlled primarily by temperature. When there is a low environmental lapse rate, i.e.,
less than 1.4˚C per 300 m (2.5˚F per 1,000 ft.), as there frequently is at night in mountains, the
air is stable. Stable air resist lifting in mountains will often move down slope. During the day,
when the sun warms the slopes and the surface air is heated, the environmental lapse rate
increases and the air will have a tendency to rise, frequently producing afternoon clouds. When
the lapse rate exceeds the dry adiabatic rate of 3.05˚C per 300 m (5.5˚F per 1,000 ft.), a
condition of absolute instability prevails. Under these conditions even slight lifting of the air by
a landform is enough to "trigger" it into continued lifting on its own accord. If it then begins to

35 Draft: Chap. 4 Mt. Climate by A. Bach for Mountains and People
feed upon itself through the release of latent heat of condensation, it can yield considerable
precipitation (Bergeron 1965; Thornthwaite 1961; Revell 1984). As a result of this effect,
thunderstorms can develop, even on small hills in the path of moist unstable air (Schaaf et al.
1988).
Local Convection
Clouds commonly form over mountains during the day, especially in the summer, when
nights and early mornings are clear but by mid-morning clouds begin to build, often culminating
in thunderstorms with hail and heavy rain (Fuquay 1962; Baughman and Fuquay 1970; Flohn
1974). This has been well-documented for the base of the Colorado Rockies, where the higher
peaks of the Front Range provide a "heated chimney effect" in the initiation of thunder and
hailstorms (Harrison and Beckwith 1951; Beckwith 1957; Banta and Schaaf 1987). Mountains
serve as elevated heat-islands during the day, since their surfaces can be warmed to a similar
temperature as surrounding lowlands (Raymond and Wilkening 1980). As a consequence, the air
at a given altitude is much warmer over the mountains than over the valley (MacCready 1955).
The lapse rate above the peaks, therefore, is considerably greater than in the surrounding free air,
resulting in actively rising air. Glider pilots have long taken advantage of this fact (Scorer 1952,
1955; Ludlam and Scorer 1953). Airline pilots, on the other hand, make every effort to avoid the
turbulence associated with unstable air over mountains (Reiter and Foltz 1967, Colson
1963,1969). Rarely, given weak synoptic conditions, local mountain convection can become
organized into a meso-scale convective complex (Tucker and Crook 1999). These strong storms
can reinforce themselves, spawning severe thunderstorms and even tornadoes (mountainadoes).
Clouds and thunderstorms initiated in the Front Range frequently drift eastward,
continuing to develop as they move onto the plains, and producing locally heavy precipitation
(Chung et al. 1976; McGinley 1982). A study in the San Francisco Mountains north of Flagstaff,
Arizona, suggests that clouds may increase in volume by as much as ten times after drifting
away from a mountain source (Glass and Carlson 1963; Banta and Schaaf 1987). Most of the
clouds observed in this area were small cumuli that eventually dissipated once removed from
their supply of moist, rising air, but a large cumulonimbus could maintain itself independently of
the mountains and result in storms at some distance away. Fujita (1967) found that there was a
ring of low precipitation about 24 km (15 mi.) in diameter encircling these mountains, with an
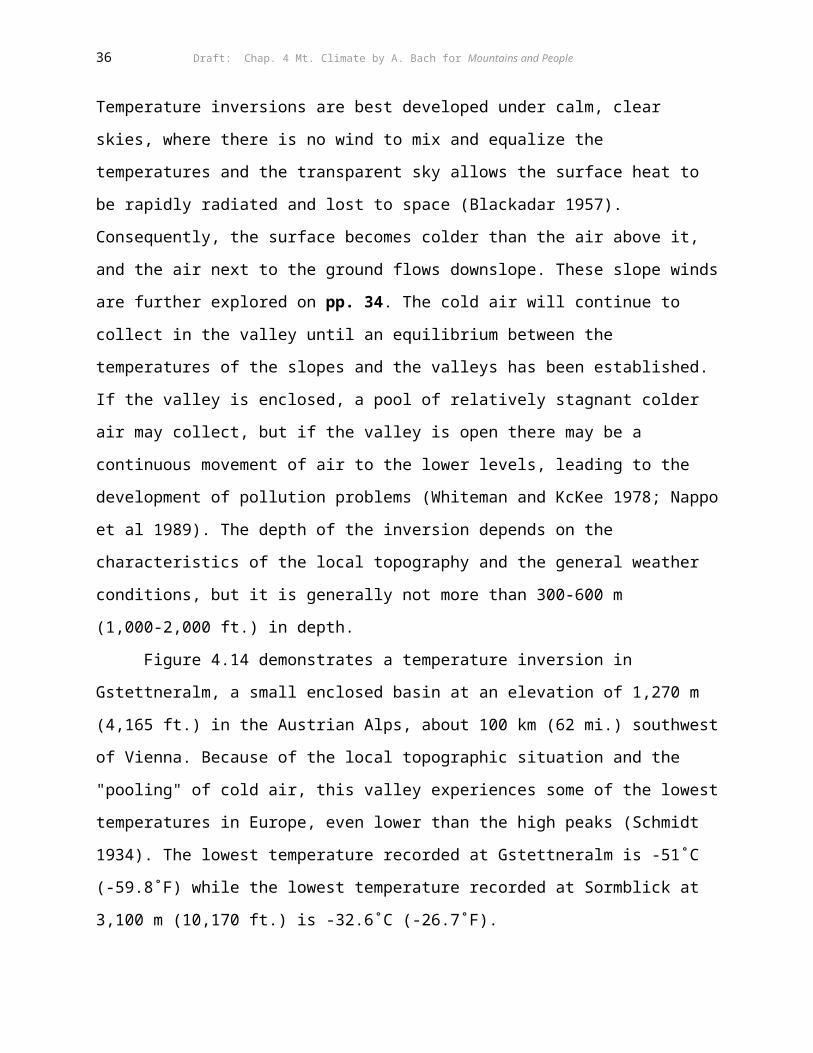
36 Draft: Chap. 4 Mt. Climate by A. Bach for Mountains and People
outer ring of heavier precipitation. During the day the rainfall is over the mountains but at night
it falls over the lowlands because the mountains are relatively cold. A "wake effect" due to wave
action created by airflow over the mountains may be partly responsible for the inner ring of light
precipitation (Fujita 1967). A similar phenomenon occurs adjacent to the Rockies, on the Great
Plains, where there is a second peaking of thunderstorm activity in the early evening (Bleeker
and Andre 1951).
Well-studied mountain convection phenomena are found in the San Francisco and Santa
Catalina Mountains of Arizona. A number of studies have traced the initiation and development
of convection and cumulus clouds over the range (Braham and Draginis 1960; Orville 1965;
Fujita 1967). Figure 4.23 shows the change in temperature and moisture content over the Santa
Catalina Mountains from early morning to midmorning. Note that the south-facing slopes show
considerably more thermal convection than the north-facing slopes. On this particular day the
base of the clouds was about 4,500 m (15,000 ft.), so the sun was not blocked and could
continue to shine on the slopes to feed the thermal convection (Braharn and Draginis 1960).
The height of the cloud base is very important to the development of convection in
mountains, since once the sun is blocked the positive effect of solar heating is eliminated. The
height of the cloud base is also critical to the distribution of precipitation, as is demonstrated in
the San Gabriel Mountains, California (see p. 95). If the cloud base is below the level of the
peaks, as it usually is in the winter, when forced ascent occurs, cloud growth and precipitation
will take place mainly on the windward side. In summer, however, the base of convection clouds
is generally much higher.
Mountains, as sites of natural atmospheric instability, are ideal areas for artificial
stimulation of precipitation. The considerable efforts that have been made in this regard have
met with varied success, depending upon technique and local atmospheric conditions (Mielke et
al. 1970; Chappell et al. 1971; Hobbs and Radke 1973; Grant and Kahan 1974; Deshler et al.
1990; Meyers et al. 1995; Long and Carter 1996). Most of the projects have been aimed at
increasing the snowpack for runoff during the summer. This appears to be a desirable objective,
but the ecological implications of such undertakings are far-reaching (Weisbecker 1974;
Steinhoff and Ives 1976). For example, the Portland General Electric Company of Portland,
Oregon, hired a commercial firm during the winter of 1974/75 to engage in cloud-seeding on the
eastern side of the Cascades. The objective was to increase the snowpack in the Deschutes River

37 Draft: Chap. 4 Mt. Climate by A. Bach for Mountains and People
watershed, where they have two dams and power-generating plants. Considerable success was
apparently achieved, but problems arose when residents of small towns at the base of the
mountains were suddenly faced with a marked increase in snow. There were new problems of
transportation and of snow removal, as well as other hardships for the local people. Greater
snowfall meant greater profits for the power company but it also meant greater expenses for the
local people. Objections were raised in the courts, and the project was eventually halted. The
positive effects of such programs must always be balanced against the negative. In our efforts to
manipulate nature we are made increasingly aware of how little we understand the effects of our
actions on natural systems. This is especially true of the mountain environment (Steinhoff and
Ives 1976).
Condensation Processes
The presence of fog or clouds near the ground may result in increased moisture. Water
droplets in fog and clouds are usually so small that they remain suspended, and even a slight
wind will carry them through the air until they strike a solid object and condense upon it. You
have experienced this, if water droplets have ever formed on your hair and eyebrows as you
passed through a cloud or fog. Fog drip and rime deposits, which form at subfreezing
temperatures, are responsible for an appreciable amount of the moisture in mountains, since
elevated slopes are often in contact with clouds.
Clouds. Cloud cover is generally more frequent and thicker over mountains than over the
surrounding lowlands (Uddstrom et al. 2001). Forced lifting of moist air mass over the
topographic barrier is the primary cause, although it may be augmented by convective processes.
A slowing of storm movement by the blocking effect also leads to an increase in cloud water-
content (Pedgley 1971). Cloud type in mountain areas is primarily determined by synoptic
characteristics. In middle and high latitudes, stratiform clouds are common, especially during
winter in the absence of convection. These clouds often envelope the ground as hill fog. Middle
latitude summers, continental, subtropical, and tropical areas typically have cumulus clouds
associated with convection. A problem relating to cloud data from mountain stations is the
clouds often engulf the observer, obstructing the view of the cloud forms. Likewise, cloud tops
can be below the station.

38 Draft: Chap. 4 Mt. Climate by A. Bach for Mountains and People
A number of cloud forms are unique to mountain environments (Ludlam 1980). All of
them are stationary clouds, which continually dissipate on the lee edge of the cloud and reform
on the upwind edge, thus appear to remain in the same location for long periods. A cap or crest
cloud forms over the top of an isolated peak or ridge. They resemble a cumulous cloud, although
are often streamlined, or have streamers of cirrus forms. They sit near or just below the summit
level, appearing like a hat atop the peak. Banner clouds are cap cloud which extent downwind
from the peak like a flag waving in the wind. This form is sometimes difficult to distinguish
from streamers of snow blowing from summits. Lenticular clouds are lens-shaped clouds formed
in regular spaced bands parallel to the mountain barrier on the lee side (Figs. 4.39-4.42). These
streamlined cloud features form by the interaction of high velocity winds with the mountain
barriers (see p. 119). Stratification of humidity in the atmosphere can result in multi-storied
lenticular clouds, forming a ‘pile of plates’ or ‘pile of pancakes’ (Fig. 4.42). These sometimes
eerie looking clouds might be responsible for the ‘flying saucer’ scare of the 1950s, which
originated from a sighting of “a disc-shaped craft skimming along the crest of the Cascades
Range in Washington” (Arnold and Palmer, 1952).
Fog Drip. Fog drip is most significant in areas adjacent to oceans with relatively warm, moist air
moving across the windward slopes. In some cases, the moisture yield from fog drip may exceed
that of mean rainfall (Nagel 1956). The potential of clouds for yielding fog drip depends
primarily upon their liquid content, the size of the cloud-droplet spectrum, and the wind velocity
(Grunow 1960; Vermeulen et al. 1997). The amount that occurs at any particular place depends
upon the nature of the obstacles encountered and their exposure to the clouds and wind. For
example, a tree will yield more moisture than a rock, and a needle-leaf tree is more efficient at
"combing" the moisture from the clouds than a broadleaf tree (Cavelier and Goldstein 1989;
Vermeulen et al. 1997). A tall tree will yield more moisture than a short one, and a tree with
front-line exposure will yield more than one surrounded by other trees. The tiny fog droplets are
intercepted by the leaves and branches and grow by coalescence until they become heavy enough
to fall to the ground, thereby increasing soil moisture and feeding the ground-water table. If the
trees are removed, of course, this source of moisture is also eliminated.
Many tropical and subtropical mountains sustain so-called "cloud forests," which are
largely controlled by the abundance of fog drip (Cavelier and Goldstein 1989). Along the east

39 Draft: Chap. 4 Mt. Climate by A. Bach for Mountains and People
coast of Mexico in the Sierra Madre Oriental, luxuriant cloud forests occur between 1,300-2,400
m (4,300-7,900 ft.). The coastal lowlands are arid by comparison, as is the high interior plateau
beyond the mountains. Measurements in both of these drier areas show little increase in available
moisture due to fog drip, whereas on the middle and upper slopes the process boosts moisture by
more than 50% at one site located at 1,900 m (6,200 ft.), the increase over rainfall was 103%
(Vogelman 1973). These cloud forests were at one time much more extensive, but they have
been severely disturbed by humans and are now in danger of being eliminated.
On the northeast slopes of Mauna Loa, Hawai’i, at 1,500-2,500 m (5,000-8,200 ft.),
above the zone of maximum precipitation, fog drip is likewise a major ecological factor in the
floristic richness of the forests. During a twenty-eight-week study, fog drip was found to provide
638 mm (25.3 in.) of moisture at an elevation of 1,500 m (5,000 ft.); and at 2,500 m (8,200 ft.) it
provided 293 mm (11.5 in.), which was 65% of the direct rainfall (Fig. 4.24; Juvik and Perreira
1974; Juvik and Ekern 1978).
The contribution of fog drip on middle and upper mountain slopes in the lower latitudes
is clearly a major factor in the moisture regime. The relationship between the cloud forest and
fog drip is essentially reciprocal. The trees cause additional moisture in the area. At the same
time, the trees apparently need the fog drip in order to survive. This is particularly true in areas
with a pronounced dry season, at which time fog drip provides the sole source of moisture for
the plants. In the middle latitudes, fog drip is less critical to the growth of trees, but it can still be
important (Grunow 1955; Costin and Wimbush 1961; Vogelmann et al. 1968). This can be seen
in the mountains of Japan, where there is heavy fog at intermediate altitudes (Fig. 4.25).
Rime Deposits. Rime is formed at subfreezing temperatures when supercooled cloud droplets are
blown against solid obstacles, freezing on them (Hindman 1986; Berg 1988). Rime deposits tend
to accumulate on the windward side of objects (Fig. 4.26). The growth rate is directly related to
wind velocity. In extreme cases the rate of growth may exceed 2.5 cm (1 in.) per hour, although
a typical rate is usually less than 1 cm (0.4 in.) per hour (Berg 1988). Rime deposits can reach
spectacular dimensions and, by their weight, cause considerable damage to tree branches,
especially if followed by snow or freezing rain. Trees at the forest edge and at timberline
frequently have their limbs bent and broken by this process; power lines and ski lifts are also
greatly affected (Fig. 4.26). One study in Germany measured a maximum hourly growth of 230

40 Draft: Chap. 4 Mt. Climate by A. Bach for Mountains and People
g per m (8.1 oz. per 3.3 ft.) on a power-line cable (Waibel 1955, in Geiger 1965). The stress
caused by this added weight may cause a power failure if the supporting structures are not
properly engineered.
Rime accumulation is a severe obstacle to the maintenance of mountain weather stations
because instruments become coated, making accurate measurements extremely difficult. Some
instruments can be heated or enclosed in protected housing, but the logistical problems of
accurately monitoring the alpine environment are very great. The U.S. Weather Bureau Station
on Mount Washington, New Hampshire, where rime-forming fogs are frequent and the wind is
indefatigable, exemplifies the problems encountered (Smith 1982). This mountain has been
nominated as having the worst weather in the world (Brooks 1940). It is foggy over 300 days a
year, or about 87% of the time; wind velocities there average 18 m/sec. (40 mph) with frequent
prolonged spells of 45 m/sec. (100 mph) and occasional extremes of over 90 m/sec. (200 mph)
(Pagliuca 1937; Smith 1982).
Few investigations have been made concerning the moisture contribution of rime. It is
known to be generally somewhat less than fog drip, but it may nevertheless be significant. A
study in the eastern Cascades of Washington indicates that timbered areas above 1,500 m (5,000
ft.) receive an added 50-125 mm (2-5 in.) of moisture per year from this source (Berndt and
Fowler 1969). Considerably greater amounts have been measured in Norway (Table 4.5). Rime
is found primarily in middle-latitude and polar mountains, although it also occurs at the highest
elevations in the tropics. Like fog drip, it is most effective on forest-covered slopes that provide
a large surface area for its accumulation. At very high altitudes and at latitudes where total
precipitation is low, rime deposits on glaciers and snowfields may constitute the primary source
of the water taken from the air.
Zone of Maximum Precipitation
Precipitation is generally thought to increase only up to a certain elevation, beyond which
it decreases (Lauer 1975; Miller 1982). The argument is that the greatest amount of precipitation
will usually occur immediately above the cloud level because most of the moisture is
concentrated here. As the air lifts and cools further, the amount of precipitation will eventually
decrease, because a substantial percentage of the moisture has already been released on the lower
slopes (Miniscloux et al. 2001). In addition, the decreased temperature and pressure at higher

41 Draft: Chap. 4 Mt. Climate by A. Bach for Mountains and People
elevations reduce the capacity of the air to hold moisture. The water-vapor content at 3,000 m
(10,000 ft.) is only about one-third that at sea level. Forced ascent also plays a part, since the air,
seeking the path of least resistance, will generally move around the higher peaks rather than over
them.
The concept of a zone of maximum precipitation was developed over a century ago from
studies in tropical mountains and in the Alps (Hann 1903). Other studies seemed to confirm the
concept and its application to other areas (Lee 1911; Henry 1919; Peattie 1936; Lauer 1975).
The elevation of maximum precipitation varies geographically, depending upon the synoptic
setting (Barry 1992; McGinnis 2000). Tropical mountains tend to have precipitation maxima at
lower elevations, with the maximum zone rising with decreasing annual totals (Fig. 4.28). In
middle latitudes, the general trend is for precipitation to increase with elevation, often to the
highest observation station (Schermerhorn 1967; Hanson, 1982; Alpert, 1986; Marwitz 1987).
Using precipitation and accumulation data for western Greenland, a zone of maximum
precipitation was found at ~2,400 m at 69˚N latitude and lowering northward to ~1,500 m at
76˚N (Ohmura 1991). The existence of such a zone has been challenged, as calculations of the
amount of precipitation necessary to maintain active glaciers in high mountains and observations
of relatively heavy runoff from small alpine watersheds seem to call for more precipitation in
certain mountain areas than climatic station data would indicate (Court 1960, Anderson 1972;
Slaymaker 1974).
Currently, the situation is moot, the problem being one of measurement. There are very
few weather stations in high mountains, and even where measurements are available, their
reliability is questionable (Sevruk 1986; 1989). As one author says, "Precipitation in mountain
areas is as nearly unmeasureable as any physical phenomenon" (Anderson 1972, p. 347). This is
particularly true at high altitudes with strong winds. Not surprisingly, many studies have shown
that wind greatly affects the amount of water collected in a rain gauge (Fig. 4.27; Court 1960;
Brown and Peck 1962; Hovind 1965; Rodda 1971). Considerable effort has been made to
alleviate this problem by the use of shields on gauges, by location in protected sites, by use of
horizontal or inclined gauges, and by the use of radar techniques (Storey and Wilm 1944;
Harrold et al. 1972; Peck 1972b; Sevruk 1972; Rango et al. 1989).
To measure snow is even more difficult, since the wind not only drives falling snow but
redistributes it after it is on the ground (Goodinson et al. 1989). Correction factors have been

42 Draft: Chap. 4 Mt. Climate by A. Bach for Mountains and People
developed for certain types of gauges (Goodinson et al. 1989; Sevruk 1989; Kyriakidis et al.
2001). There are also problems in storage and melting of snow for water equivalency, as well as
the losses due to evaporation. The major problem, however, is accurate monitoring of snowfall.
Small clearings are used in conifer forests, and above timberline snow fences are increasingly
being used to enclose and shield the gauges. This still does not guarantee accurate
measurements, but shielded gauges (whether for rain or snow) do record greater amounts of
precipitation than unshielded gauges in the same location (Goodinson et al. 1989). For example,
the University of Colorado has since 1952 operated a series of weather stations in the Front
Range of the Rocky Mountains (Marr 1967; Marr et al. 1968a, b). The measured precipitation
amounts from the two highest sites above treeline increased abruptly in 1964 when snow fences
were erected around the recording gauges. Before the gauges were shielded, the average annual
amount was 655 mm (25.8 in.); it jumped to 1,021 mm (40.2 in.) and 771 mm (30.3 in.),
respectively, after the snow fence was installed (Barry 1973). The data now show an absolute
increase in precipitation with increasing elevation (Table 4.6). More reliable instrumentation in
the Alps has led to similar results, at least up to an elevation of 3,000 m (10,000 ft.) (Flohn
1974; Schmidli et al. 2002). Studies of snow accumulation at still higher elevations, in the Saint
Elias Mountains, Yukon Territory, indicate decreasing amounts beyond 3,000 m (10,000 ft.),
although there is a steady increase at lower elevations at least up to 2,000 in (6,000 ft.) (Murphy
and Schamach 1966; Keeler 1969; Marcus and Ragle 1970, Marcus 1974b).
Snow accumulation in alpine watersheds can be investigated more thoroughly by
collecting depth and density data from snow pits, which can be converted to water equivalent
(Østrem and Brugman 1991). In North America, an extensive network of over 1,200 snow
courses are surveyed on a monthly by the Natural Resources Conservation Service (NRCS,
formally the Soil Conservation Service) of the U.S. Department of Agriculture (NRCS 1997).
Snow courses are where depth and density is measured manually to estimate annual water
availability, spring runoff, and summer streamflows. In more remote locations of the western
United States, a network of over 650 automated snow reporting stations have been installed. The
SNOTEL (Snow Telemetry) network uses an air filled pillow attached to a pressure gauge to
measure snowpack weight, which is transmitted via VHF signals to a data collection station
(NRCS 1997). Combining field measurements of snow-water-equivalency with topographic data

43 Draft: Chap. 4 Mt. Climate by A. Bach for Mountains and People
(slope and aspect) and net radiation, estimates of watershed snowpack water content can be
modeled (Elder et al. 1989; Susong et al. 1999).
Another problem with precipitation analysis in mountains is that many weather stations
are located in valleys. Uncritical use of these data may lead to erroneous results (Benizou 1989).
Valleys oriented parallel to the prevailing winds may receive as much or more precipitation than
the mountains on either side, while valleys oriented perpendicular to the prevailing winds may
be "dry holes" (Collie and Mass 1996; Neiman et al. 2002). In addition, local circulation systems
between valleys and upper slopes may result in valleys being considerably drier than the ridges
(see p. 111). For example, in parts of the Hindu Kush, Karakoram, and Himalayas, many valleys
are distinctly arid (Schweinfurth 1972; Troll 1972b). These contrast sharply with the adjacent
mountains, where large glaciers exist. Some glaciologists have estimated an average annual
precipitation of over 3,000 mm (120 in.) for the glacial area, compared to 100 mm (4 in.) in the
valleys, data that seem to support the idea of a steady increase of precipitation with elevation
(Flohn 1968, 1969a, 1970). On the other hand, it is argued that little precipitation is required to
maintain a glacier under such low temperatures, owing to the relatively small losses to be
expected through ablation (Hock et al. 2002). Several studies have provided evidence for a zone
of maximum precipitation at about 2,000 m (6,600 ft.) along the southern slope of the Himalayas
(Dhar and Narayanan 1965; Dalrymple et al. 1970; Khurshid Alam 1972). The high, sheltered
inner core of the Himalayas is arid (Troll 1972c).
In the tropics, decrease of precipitation above a certain elevation is much better es-
tablished (Fig. 4.28; Lauer 1975). The precipitation falls principally as rain, with snow or rime
on the highest peaks, and tropical mountains experience considerably less wind than in middle
latitudes. As a result, simple rainfall measurements are more dependable. The zone of maximum
precipitation varies according to location. In the tropical Andes and in Central America it lies
between 900-1,600 m (3,000-5,300 ft.) (Hastenrath 1967; Weischet 1969; Herrmann 1970).
Mount Cameroon in West Africa near the Gulf of Guinea receives an annual rainfall of 8,950
mm (355 in.) on the lower slopes but less than 2,000 mm (80 in.) at the summit. The zone of
maximum precipitation occurs at 1,800 m (6,000 ft.) (Lefevre 1972). In East Africa,
measurements on Mount Kenya and Mount Kilimanjaro show an increase up to the montane
forest belt at 1,500 m (5,000 ft.) and then a sharp decrease (Fig. 4.28). The maximum zone
receives about 2,500 mm (100 in.) but less than 500 mm (20 in.) falls on the summit areas. The

44 Draft: Chap. 4 Mt. Climate by A. Bach for Mountains and People
effects of low rainfall, high sun-intensity, and porous soils give the alpine belt a desert-like
appearance, although both summit areas support small glaciers (Hedberg 1964; Thompson 1966;
Coe 1967). Desert-like conditions exist at the summits of many tropical mountains (Fig. 4.29).
On the islands of Indonesia and on Ceylon the zone of maximum precipitation varies between
900-1,400 m (3,000-4,600 ft.) (Domrös 1968; Weischet 1969), while it lies between 600-900 m
(2,000-3,000 ft.) in Hawai’i (Blumenstock and Price 1967; Juvik and Peffeira 1974; Nullet and
McGranaghan 1988). The decrease immediately above the zone of maximum precipitation is
counteracted somewhat by the presence of fog drip, however, since this is a zone of frequent
cloudiness (Fig. 4.24).
The vertical distribution of precipitation illustrates yet another environmental distinction
between tropical and extratropical mountains. The presence of a zone of maximum precipitation
is well established for the tropics, but is less defined in the middle latitudes. Although there are
insufficient measurements to settle the question categorically, evidence from mass-balance
studies on glaciers, runoff from mountain watersheds, and improved methods of instrumentation
seem to indicate that precipitation continues to increase with altitude in middle latitudes at least
up to 3,000-3,500 m (10,000-11,000 ft.). The decrease beyond moderate elevations in the tropics
is explained by the dominance there of convection rainfall, which means that the greatest
precipitation occurs near the base of the clouds. Where forced ascent is important the level may
be somewhat higher, but it does not vary over a few hundred meters. In many tropical areas an
upper air inversion composed of dry, stable air tends to restrict the deep development of clouds.
This is the case on Mount Kenya and on Kilimanjaro, as well as on Mauna Loa and Mauna Kea
in Hawai’i (Juvik and Perreira 1974; Ramage and Schroeder 1999).
The continued increase of precipitation with elevation in the middle latitudes is
somewhat more difficult to explain. The water-vapor content of the air decreases at the higher
levels just as it does in the tropics. Precipitation in middle-latitude mountains is caused primarily
by forced ascent rather than convection, however. Orographic lifting becomes stronger as the
wind grows stronger, and wind velocity increases markedly in middle latitudes. Apparently, this
factor is more than enough to compensate for the absolute decrease in water content. The
water-vapor transport is at its maximum in the westerlies at about the 700-millibar level, i.e., at
3,000 m (10,000 ft.). Consequently, it is postulated that precipitation continues to increase at
least up to this level (Havlik 1969). In tropical mountains, however, the wind tends to decrease

45 Draft: Chap. 4 Mt. Climate by A. Bach for Mountains and People
with elevation above 11000 m (3,300 ft.), so the decrease in water content of the air becomes
more effective and precipitation decreases beyond this point (Weischet 1969; Rohn 1974).
Runoff
Mountain surface runoff is related to topographic, biotic, pedologic, and particularly the
climatic characteristics of a watershed (Miller 1982; Alford 1985). In particular, seasonality of
precipitation inputs, temperatures, snowpack characteristics, and non-precipitation water sources
(i.e. groundwater and glaciers) are important variables in determining the amount of water
flowing down a mountain stream (Martinec 1989; Lins 1999; Peterson et al. 2000). Globally,
mountain runoff displays significant temporal and spatial variation. The temporal heterogeneity
arises from the intraannual, interannual, and secular changes in temperature, precipitation and
other climatic factors (Rebetez 1995; Lins 1999). Spatial heterogeneity is due to climatic,
topographic, biotic, land-use, and pedologic variability within and between mountains, making
generalities about mountain hydrology difficult. The two generalities of mountain hydrology are
the generation of flood events and the influences of snowpack meltwater.
Steep slopes, generally thin soils and generally high rain intensities in mountains often
result in elevated rates of overland flow compared lowlands (Miller 1982; Dingman 1993).
During lingering or moisture-ladened storms the delivery rate of runoff to main rivers can
exceed the channel capacity and a flood results. Flooding typically occurs with regular intervals
for a particular watershed, determined by its hydrologic characteristics (Castro and Jackson
2001). While floods can cause damage to mountain valleys, often their impacts are felt more
strongly in the lowlands adjacent to the mountains, where flood magnitude is often larger due to
the cumulative flow of many tributaries.
Snow meltwater has four principal impacts on watershed hydrology: lowering stream
temperature, sudden contributions to discharge resulting from rapid melting (rain on snow
events), an increase in melt-season discharge and decrease in snow-accumulation season
discharge, and a decrease in annual and especially seasonal variations in runoff (Male and Gray
1981). The changes in average seasonal discharge due to snowmelt are illustrated in Figure 30.
Differences in discharge in these side-by-side mountainous watersheds of the same size are due
to elevational effects on snowfall (Bach in review). During the month of October, the beginning
of the wet season, both basins have similar discharges. Between November and about April two

46 Draft: Chap. 4 Mt. Climate by A. Bach for Mountains and People
differences become apparent in the flow characteristics. The higher elevation basin discharge
becomes smaller in volume and less variable than the lower basin (Fig. 4.30). The decrease in
volume is due to more precipitation falling in the form of snow and accumulating in the upper
basin, while rain falls throughout the winter in the lower basin and runs off. The greater
temporal variability (as indicated by the wiggles in the line) in the lower basin is due to the
chaotic timing of storms throughout the period of record. In March, temperatures begin to warm
and the snowmelt season begins, a few weeks earlier in the lower basin (Fig. 4.30). The
variability of discharge decreases in both basins (lines become smoother), indicating a change
from storm event dominated runoff to temperature driven snowmelt runoff (Peterson et al.
2000). The peak in the snowmelt flood of the lower basin occurs about one month earlier and is
only 70% the size of the upper basin, reflecting the difference in snowpack volume. These
runoff characteristics are further exasperated by the presence of glaciers in the watershed
(Fountain and Tangborn 1985).
Besides the daily to weekly variations caused by storm events, and the seasonal
variations through out a year, streamflow regimes in mountains are prone to interannual and
secular variations related to large-scale patterns of climate variations such as the El
Niño/Southern Oscillation (Trenberth 1999). The type of climatic variations vary around the
globe, but generally result in extreme weather and climate conditions such as flooding, droughts,
different storm frequency and precipitation, or changes in snowmelt season (Karl et al. 1999).
Global warming is likely to increase the frequency and magnitude of these climatic variations
and their impacts on the hydrological system (Barry 1990; Trenberth 1999).
High-elevation snowsheds are important to the regional water supply, as they provide
water for domestic, industrial and agricultural users; recreation; hydroelectric power; habitat;
and produce flood hazards. Rapid population growth, increasing environmental concerns, and
resulting changes in the character of water demands have led to increased competition for water
even under normal flow conditions. Water management practices, storage infrastructure, and
patterns of use are tuned to the expected range of variation in surface runoff and groundwater
availability (Robinson 1977). The abundant surface water supply from mountainous regions has
promoted a historic reliance on this resource in adjacent lowlands. Effective water development
planning and policy making must recognize how changes in upper watershed conditions will
impact lowland water resources (Hulme et al. 1999). New reservoirs and water transfer systems

47 Draft: Chap. 4 Mt. Climate by A. Bach for Mountains and People
require considerable lead time to plan and construct. Such structures will be necessary to deal
with changing water supplies conditions that will exist in the future.
Winds
Mountains are among the windiest places on earth. They protrude into the high
atmosphere, where there is less friction to retard air movement. There is no constant increase in
wind speed with altitude, but measurements from weather balloons and aircraft show a persistent
increase at least up to the tropopause where, in middle latitudes, the wind culminates in the jet
streams. Similar increases occur in mountains, although the conditions at any particular site are
highly variable. Wind speeds are greater in middle latitudes than in tropical or polar areas, in
marine than in continental locations, in winter than in summer, during the day than at night, and,
of course, the velocity of the wind is dependent on the local topographic setting and the overall
synoptic conditions (Smith 1979; Gallus et al. 2000). The wind is usually greatest in mountains
oriented perpendicular to the prevailing wind, on the windward rather than the leeward side, and
on isolated, unobstructed peaks rather than those surrounded by other peaks. The reverse
situation may exist in valleys, since those oriented perpendicular to the prevailing winds are
protected while those oriented parallel to the wind may experience even greater velocities than
the peaks, owing to funneling and intensification (Ramachandan et al. 1980). Table 4.7 lists the
mean monthly wind speeds during the winter for several representative mountain stations in the
northern hemisphere.
Mountains greatly modify the normal wind patterns of the atmosphere (Smith 1979;
Bossert and Cotton 1994). Their effect may be felt for many times their height in both horizontal
and vertical distance. The question of whether the wind speed is greater close to mountains or in
the free air has long been problematic. The two basic factors that affect wind speeds over
mountains operate in opposition to on another. The vertical compression of airflow over a
mountain causes acceleration of the air, while frictional effects cause a slowing. Frictional drag
in the lowest layers of the atmosphere is caused by the interaction of air with individual small-
scale roughness elements (i.e. vegetation, rocks, buildings or landforms < 10 m dimensions) and
by influence of larger topographic features and vegetation canopies (Richard et al. 1989; Taylor
et al. 1987; 1989; Walmsley et al. 1989). It is generally believed that the wind near mountains is
greater, because of compression and forcing of the air around the peak like water around a rock

48 Draft: Chap. 4 Mt. Climate by A. Bach for Mountains and People
in a stream (Schell 1935, 1936; Conrad 1939; Ryan 1977; Woodbridge et al. 1987; Taylor et al.
1989). However, studies in the Alps indicate that the wind speed on these mountain summits
averages only about one-half that of the free air (Wahl 1966; Davies and Phillips 1985). Both of
these situations may in fact occur; much depends upon the stability of the air mass and the size
and configuration of the mountain. Generally, the more stable the air, the greater the
compression, because the air will resist lifting in its passage, and this will result in increased
wind speeds near the surface (Lee et al. 1987). On the other hand, if the air is unstable, it will
tend to rise on its own accord as it is forced up over the mountain, and this will result in greater
wind speeds aloft. The vertical velocity-gradient of the wind is largely a function of the interplay
between compressional and frictional effects (Gallus et al. 2000). Compression tends to create
greater velocities near the surface, decreasing upward, whereas friction tends to cause lower
velocities near the surface, increasing upward (Carruthers and Hunt 1990). Consequently, the
wind speeds in any given mountain area may have very different distributions in time and space
(Schell 1936).
The sharpest gradient in wind speed usually occurs immediately above the surface. Wind
speed doubles or triples within the first few meters, but the vegetation and surface roughness
make a great difference in the absolute velocity (Fig. 4.31). At a height of 1 m (3.3 ft.) the wind
speed in a closed-forest immediately below timberline is less than half that in the open tundra
just above timberline (Richard et al. 1989). The low-lying foliage of alpine vegetation does not
produce much frictional drag on the wind, so the wind can reach quite high velocities close to
the ground. There is nevertheless a sharp gradient within the first few centimeters of the surface,
and most alpine plants escape much of the wind (Warren-Wilson 1959). A reciprocal and
reinforcing effect is operative here: taller vegetation tends to reduce the wind speed and provide
a less windy environment for plants, while low-lying alpine vegetation provides little braking
effect, so the wind blows freely and becomes a major factor of stress in the environment. Under
these conditions the presence of microhabitats becomes increasingly important.
Surface roughness caused by clumps of vegetation and rocks creates turbulence and
hence great variability in wind speed near the surface (Fig. 4.32). In the illustration, wind speed
at a height of 1 m (3.3 ft.) above the grass tussock is 390 cm/sec., while closer to the ground it is
50 cm/sec. on the exposed side of the tussock and 10 cm/sec. on the lee side (Fig. 4.32a). Similar
conditions exist with the eroded soil bank, except that wind speeds are higher on the exposed

49 Draft: Chap. 4 Mt. Climate by A. Bach for Mountains and People
side and there is more eddy action and reverse flow to the lee. The restriction of the vegetation
to the lee of the soil bank is largely due to the reduced wind speed there (Fig. 4.32b). The wind
follows a similar pattern across the rock, with small eddies developing in depressions and to the
lee (Whalsley et al. 1989). A mat of vegetation occupies the center depression where wind
speeds are less (Fig. 4.32c).
Wind is clearly an extreme environmental stress; in many cases it serves as the limiting
factor to life. What may be the two most extreme environments in mountains are caused by the
wind: late-lying snowbanks, where the growing season is extremely short, and windswept, dry
ridges. Both of these environments become more common and more extreme with elevation,
until eventually the only plants are mosses and lichens-or perhaps nothing at all (but see p. 292).
Trees on a windswept ridge may be “flagged” with the majority of branch growth on the
protected lee-side (Yoshino 1973; Fig. 8.17 and 8.18). In the extreme conditions within the
krummholz (crooked wood) zone, trees take on a prostate cushion form (Fig. 8.19)
The redistribution of snow by the wind is a major feature of the alpine environment. The
wind speed necessary to pick snow up from the surface and transport it, depends upon the state
of the snow cover, including temperature, size, shape and density of the snow particles and the
degree of intergranular bonding (Tabler 1975). For loose, unbound snow the typical velocity is
about 5 m/s, while a dense bonded snow cover requires velocities in excess of 25 m/s. Blowing
snow can abrade surfaces, causing erosion to snow cover and flagging trees. Once the wind
velocity lowers, the snow is deposited into dune-like features called drifts. Drifts are found in the
lee-eddy of obstacles of all sizes (e.g trees, ridges, fences; Fig. 4.27). To control blowing snow,
snow fences and other barriers are specially engineered to maximize deposition, and carefully
placed to reduce the hazard of blowing snow or drifts (Ring 1991). In mountains, snow
redistribution by wind is strongly affected by meso- and micro-scale topography and vegetation
(Föhn 1980; Meister 1987; Tesche 1988). Topographic traps fill in with snow, where it may
survive late into spring or summer due to its depth and temperature inversions. The deposition of
drifts is an important component to alpine water storage and spring runoff (Elder et al. 1989).
Many glaciers have a significant component of their accumulation from snow blown over crests
(Föhn 1980; Pelto, 1996).
There are two overall groups or types of winds associated with mountains. One type
originates within the mountains themselves. These are local, thermally induced winds given

50 Draft: Chap. 4 Mt. Climate by A. Bach for Mountains and People
distinct expression by the topography. The other type is caused by obstruction and modification
of winds originating from outside the mountain area. The first type is a relatively predictable,
daily phenomenon, while the second is more variable, depending as it does on the vagaries of
changing regional wind and pressure patterns.
Local Wind Systems in Mountains
Winds that blow upslope and upvalley during the day and downslope and downvalley at
night are common. Albrecht von Haller, author of Die Alpen, observed and described these
during his stay in the Rhône Valley of Switzerland from 1758 to 1764. Since then many studies
(summarized by Defant 1951; Geiger 1965; and Rohn 1969b; Barry 1992) have been made on
thermally induced winds. The driving force for these winds is differential heating and cooling
which produces air density differences between slopes and valleys and between mountains and
adjacent lowlands (McGowan and Sturman 1996a). During the day, slopes are warmed more
than the air at the same elevation in the center of the valley; the warm air, being less dense,
moves upward along the slopes. Similarly, mountain valleys are warmed more than the air at the
same elevation over adjacent lowlands, so the air begins to move up the valley. These are the
same processes that give rise to convection clouds over mountains during the day and provide
good soaring for glider pilots (and birds). At night, when the air cools and becomes dense, it
moves downslope and downvalley under the influence of gravity. This is the flow responsible
for the development of temperature inversions. Although they are interconnected and part of the
same system, a distinction is generally made between slope winds, and larger mountain and
valley wind systems (Fig. 4.33).
Slope Winds. Slope winds consist of thin layers of air, usually less than 100 m (330 ft.) thick. In
general, the upslope movement of warm air during the day is termed anabatic flow, and the
downslope movement of cold air during the night is referred to as katabatic flow, or a gravity or
drainage wind. The upslope flow of air during the day is associated with surface heating and the
resulting buoyancy of the warm air (Vergeiner and Dreiseitl 1987). The wind typically begins to
blow uphill about one-half hour after sunrise and reaches its greatest intensity shortly after noon
(Fig. 4.33a). By late afternoon the wind abates and within a half hour after sunset reverses to
blow downslope (Fig. 4.33c). Katabatic winds in the strict sense are local downslope gravity

51 Draft: Chap. 4 Mt. Climate by A. Bach for Mountains and People
flows caused by nocturnal radiative cooling near the surface under calm, clear-sky conditions, or
by the cooling of air over a cold surface such as a lake or glacier. The extra weight of the stable
layer, relative to the ambient air at the same altitude, provides the mechanism for the flow. Since
slope winds are entirely thermally induced, they are better developed in clear weather than in
clouds, on sun-exposed rather than on shaded slopes, and in the absence of overwhelming
synoptic winds. Local topography is important in directing these winds; greater wind speeds will
generally be experienced in ravines and gullies than on broad slope (Defant 1951; Banta and
Cotton 1981; McKee and O’Neal 1989).
Downslope winds form better at night and during the winter, when radiative cooling
dominates the surface energy system (Horst and Doran, Barr and Orgill 1989). The down slope
flow of cold air is analogous to that of water, since it follows the path of least resistance and
always gravitates toward equilibrium, but water has a density 800 times greater than air (Bergen
1969). Even with a temperature difference of 10˚C (18˚F), the density of cold air is only 4%
greater than warm air, unlike the rapid flow of water due to gravity, the displacement of warm
air by cold air is a relatively slow process (Geiger 1969). Katabatic winds begin periodically as
the layer of air just above the surface cools, then slides downslope (Papadopoulos and Helmis
1999). The cycle is repeated when the radiative cooling rebuilds the downslope pressure
gradient. This pulsating downslope flow depends on the temperature difference between the
katabatic layer and the valley temperature (McNider 1982). Surges of cold air are commonly
observed on slopes greater than 10°, and are referred to as “air avalanches” (Scaetta 1935;
Geiger 1969). A final steady velocity will be achieved once a certain temperature has been
reached (Papadopoulos and Helmis 1999). Further down a drainage basin a steady velocity will
be reached, maintained, and increased through out the night as individual slope winds
accumulate down basin in a similar fashion to tributaries in a stream (Neff and King 1989; Porch
et al. 1989). Closed basins, even created by dense forest cover, can trap the cold air creating cold
pockets or “frost hollows” (Thompson 1986; Neff and King 1989). These temperature inversions
can reach 30°C below the ambient atmosphere, persisting for weeks to months, effectively
trapping atmospheric contaminants until sufficient winds can clear the air (Geiger 1965;
McGowan and Sturman 1993; Iijima and Shinoda 2000). These have obvious significance for a
number of human activities, such as agriculture, forestry, tourism and air pollution. In the

52 Draft: Chap. 4 Mt. Climate by A. Bach for Mountains and People
wine-producing regions of Germany, hedges are frequently planted above the vineyards to
deflect cold air from upslope (Geiger 1969).
Upslope winds form best during the day and during the summer when surfaces are
radiatively warmed (Banta 1984; 1986). The upslope wind does not rise far above the ridge tops
since it is absorbed and overruled by the regional prevailing wind. The upward movement of two
slope winds establishes a small convection system in which a return flow from aloft descends in
the center of the valley (Figs. 4.32, 4.33; cf. Fig. 4.33a). This descending flow brings from aloft
drier air that has been heated slightly by compression and thus is strongly opposed to cloud
formation. For this reason the dissipation of low-lying fog and clouds generally takes place first
in the center of the valley (Fig. 4.34). If the valley is deep enough, the dry descending air can
produce markedly arid zones. In the dry gorges and deep valleys of the Andes of Bolivia and in
the Himalayas, the vegetation ranges from semi-desert shrubs in valley bottoms to lush forests
on the upper slopes where clouds form (Troll 1952, 1968; Schweinfurth 1972).
Mountain and Valley Winds. The integrated effects of slope generated flows produce mountain
and valley winds, blowing longitudinally up and down the main valleys, essentially at right
angles to the slope winds (Whiteman 1990; Clements 1999). They are all part of the same
system, however, and are controlled by similar thermal responses. The valley wind (blowing
from the valley toward the mountain) is interlocked with the upslope winds, and both begin after
sunrise (Buettner and Thyer 1962, 1965; Banta 1984; 1986; Fig. 4.33b). Valley winds involve
greater thermal contrast and a larger air mass than slope winds, however, so they attain higher
wind speeds. In the wide and deep valleys of the Alps, the smooth surfaces left by glaciation
allow maximum development of the wind. The Rhône Valley has many areas where the trees are
wind-shaped and flagged in the upvalley direction (Yoshino 1964b). Mountain winds (blowing
from the mountains down valley) are associated with the nocturnal downslope winds and can be
very strong and quite cold in the winter (Porch et al. 1989; Whiteman 1990; Fig, 4.31d).
As with slope winds, a circulation system is established in mountain and valley winds.
The return flow from aloft (called an anti-wind) can frequently be found immediately above the
valley wind (Bleeker and Andre 1951; Defant 1951). This concept was formerly only theoretical,
but study of valley winds near Mount Rainier, Washington, using weather balloons, clearly
identified the presence of anti-winds (Fig. 4.35; Buettner and Thyer 1965). This wind system

53 Draft: Chap. 4 Mt. Climate by A. Bach for Mountains and People
beautifully demonstrates the three-dimensional aspects of mountain climatology: next to the
surface are the slope and mountain-valley winds; above them is the return flow or anti-wind; and
above this is the prevailing regional gradient wind (McGowan and Sturman 1996a; Clements
1999). During clear weather all of these may be in operation at the same time, each moving in a
different direction.
Other Local Mountain Winds. An important variant of the thermal slope wind is the glacier
wind, which arises as the air adjacent to the icy surface is cooled and moves downslope due to
gravity. The glacier wind has no diurnal period but blows continuously, since the refrigeration
source is always present. It reaches its greatest depth and intensity at mid-afternoon, however,
when the thermal contrast is greatest. At these times the cold air may rush downslope like a
torrent. During the day the glacier wind frequently collides with the valley wind and slides under
it (Fig. 4.36). At night it merges with the mountain wind that blows in the same direction
(Defant 1951). In mountains like the Rockies or Alps, with small valley glaciers, the glacier
winds are fairly shallow, but when glaciers are as extensive as they are in the St. Elias
Mountains or the Alaska Range, the wind may be several hundred meters in depth (Marcus
1974a). Glacier winds have a strong ecological effect, since the frigid temperatures are
transported downslope with authority and the combined effect of wind and low temperatures can
make the area they dominate quite inhospitable. In a valley with a receding glacier, these winds
can entrain the unconsolidated till, sand-blasting vegetation and rocks (into ventifacts) down
valley (Bach 1995).
Another famous local wind in mountains is the Maloja wind, named after the Maloja
Pass in Switzerland between the Engadine and Bergell valleys (Hann 1903; Defant 1951;
Whipperman 1984). This wind blows downvalley both day and night and results from the
mountain wind of one valley reaching over a low pass into another valley, where it overcomes
and reverses the normal upvalley windflow. This anomaly occurs in the valley with the greater
temperature-gradient and the ability to extend its circulation into the neighboring valley across
the pass. Thus, the wind ascends from the steep Bergell Valley and extends across the Maloja
Pass downward into the Engadine Valley to St. Moritz and beyond. A similar situation exists in
the Davos Valley, Switzerland (Flohn 1969b).

54 Draft: Chap. 4 Mt. Climate by A. Bach for Mountains and People
A related phenomenon occurs in coastal areas where a strong sea-breeze moves inland
and over low passes in such a way that the wind blows down the lee mountain slope during the
day. This is well-developed on the asymmetric escarpments of the Western Ghats in India. In the
equatorial Andes, cool air from the Pacific moves inland in a shallow surface layer overflowing
the lower passes into the valleys beyond, producing relatively cool flows down the east side of
the range (Lopez and Howell 1967). In some cases these winds are forced up the opposite slopes
in a hydraulic-jump phenomenon (Gaylord and Dawson 1987), producing afternoon rainfall
(Fig. 4.37). Other examples of local winds could be given, since every mountainous country has
its own peculiarities, but those mentioned suffice to illustrate their general nature.
Mountain Winds Caused by Barrier Effects
As mentioned earlier in the chapter, mountains can act as barriers to the prevailing
general circulation of the atmosphere. The barrier effect introduces turbulence to the winds,
increasing and decreasing speeds, changes directions, and modifies storms (reviewed earlier).
Once the wind passes over the mountain crest however, it will do one of two things: flow down
the lee-side or stay lifted in the atmosphere (Durran 1990). Most commonly the wind will fall
down the lee-side of mountains under the influence of gravity. These surface winds are
sometimes collectively termed fall winds, but are known by a variety of local terms because they
have long been observed in many regions downwind from mountains, and have associated with
them distinct weather phenomenon. When the winds leave the surface in a hydraulic jump, they
often travel through the atmosphere in a wave motion, producing unique cloud-forms.
Foehn Wind. Of all the transitory climatic phenomena of mountains the foehn wind (pronounced
"fern" and sometimes spelled föhn) is the most intriguing. Many legends, folklore, and
misconceptions have arisen about this warm, dry wind that descends with great suddenness from
mountains. The foehn, known in the Alps for centuries, is a feature common to all major
mountain regions formed as synoptic winds blow over a mountain crest and down the lee-side
(Barry 1992). In North America it is called the "Chinook;" in the Argentine Andes the "zonda;"
in New Zealand the "Canterbury north-wester;" in New Guinea the “warm braw;” in Japan the
“yamo oroshi;” in the Barison Mountains of Sumatra the “bohorok;” the “halny wigtr” in
Poland; the “autru” in Romania; other mountain regions have their own local names for it

55 Draft: Chap. 4 Mt. Climate by A. Bach for Mountains and People
(Brinkman 1971; Forrester 1982). The “Santa Ana” of southern California forms in a similar
fashion (Kasper 1981).
The foehn produces distinctive weather: gusts of wind, high temperatures, low humidity,
and very transparent and limpid air (Brinkman 1971; Pettre 1982). When viewed through the
foehn, mountains frequently take on a deep blue or violet tinge and seem unnaturally close and
high, because light rays are refracted upward through layers of cold and warm air. The bank of
clouds that typically forms along the crest line is associated with the precipitation failing on the
windward side. This bank of clouds remains stationary in spite of strong winds and is known as
the foehn wall (when viewed from the lee side).
The following is an early naturalist's description of the foehn in Switzerland:
In the distance is heard the rustling of the forests on the mountains. The roar of
the mountain torrents, which are filled with an unusual amount of water from the
melting snow, is heard afar through the peaceful night. A restless activity seems
to be developing everywhere, and to be coming nearer and nearer. A few brief
gusts announce the arrival of the foehn. These gusts are cold and raw at first,
especially in winter, when the wind has crossed vast fields of snow. Then there is
a sudden calm, and all at once the hot blast of the foehn bursts into the valley
with tremendous violence, often attaining the velocity of a gale which lasts two or
three days with more or less intensity, bringing confusion everywhere; snapping
off trees, loosening masses of rock; filling up the mountain torrents; unroofing
houses and barns- a terror in the land. (Quoted in Hann 1903, p. 346)
The primary characteristics of the foehn are a rapid rise in temperature, gustiness, and an
extreme dryness that puts stress on plants and animals and creates a fire hazard (Ives 1950;
Brinkman 1971; Marcus et al. 1985; Spronken-Smith 1998). Forests, houses, and entire towns
have been destroyed during foehn winds clock up to 195 km/h (Reid and Turner 1997). For this
reason, smoking and fires (even for cooking) have traditionally been forbidden in many villages
in the Alps during the foehn. In some cases special guards (Föhnwächter) were appointed to
enforce the regulations. In New Zealand foehn winds commonly entrain glacial sediments
causing dust storms and degrading grasslands (McGowan and Sturman 1996b). The foehn is
purported to cause various psychological and physiological reactions, including a feeling of
56 Draft: Chap. 4 Mt. Climate by A. Bach for Mountains and People
depression, tenseness, and irritability, and muscular convulsions, heart palpitations, and
headaches. The suicide rate is said to rise during the foehn (Berg 1950). These symptoms have
rarely been observed in North America, and medical explanations remain elusive.
In spite of its disadvantages, the foehn is generally viewed with favor, since it provides
respite from the winter's cold and is very effective at melting snow (Ashwell and Marsh 1967), a
fact reflected in many local sayings from the Alps: "if the foehn did not interfere, neither God
nor his sunshine would ever be able to melt the winter snows"; "The foehn can achieve more in
two days than the sun in ten"; "The wolf is going to eat the snow tonight" (De La Rue 1955, pp.
36-44). In North America, the value of the chinook for the Great Plains was poignantly
illustrated by the painting "Waiting for a Chinook," by Charles M. Russell. During the winter of
1886, cattle and sheep died by the thousands in Montana in one of the worst snowstorms on
record. Russell, a cowboy on a large ranch there, received a letter from his alarmed employers in
the East, asking about the condition of their stock. Instead of writing a reply, he made a
watercolor sketch of a nearly starved steer standing in deep snow unable to find food, with
coyotes waiting nearby (Fig. 4.38). The picture soon became famous and so did Russell;
"Waiting for a Chinook" remains his best-known painting (Weatherwise 1961).
The causes of the foehn are complex. One of the early explanations in the Alps was that
the warm dry wind came from the Sahara Desert. The wind was usually from the south, so this
seemed a perfectly logical solution, until one day somebody climbed to the side of the mountain
from which the foehn was coming and found that it was raining there, a very unlikely effect for a
Saharan wind to produce! The Austrian climatologist Julius Hann (1866, 1903) is given credit
for the true explanation. When air is forced up a mountain slope, it is cooled at the dry adiabatic
rate, 3.05˚C per 300 m (5.5˚F per 1,000 ft.) until the dew point is reached and condensation
begins. From this point on, the air is cooled at a lower rate (wet adiabatic rate) of approximately
1.7˚C (3˚F) (Fig. 4.39). On the lee side of the summit, precipitation ceases and the air begins to
descend. Under these conditions, the air is warmed at the dry adiabatic rate, 3.05˚C per 300 m
(5.5˚F per 1,000 ft.) the entire length of its descent. Consequently, the air has the potential for
arriving at the valley floor on the leeward side warmer than its original temperature at the same
elevation on the windward side (Fig. 4.39). While this general model has been widely
demonstrated, many foehn winds involve site specific processes (Barry 1992).

57 Draft: Chap. 4 Mt. Climate by A. Bach for Mountains and People
The foehn develops only under specific pressure conditions (Hoinka 1985; McGowan
and Sturman 1996b). The typical situation is a ridge of high pressure on the windward side and a
trough of low pressure on the leeward, creating a steep pressure-gradient across the mountain
range. Under these conditions the air may undergo the thermodynamic process just described in
a relatively short time. In order for there to be a true foehn, however, the wind must be
absolutely warmer than the air it replaces (Brinkman 1971). Either side of the mountains may
experience a foehn, depending upon the orientation of the range and the development of the
pressure systems. In the Alps there is a south foehn that affects the north side of the mountains
and comes from the Mediterranean, and a north foehn that comes from northern Europe and
affects the south side of the Alps. Because of its original warmth, the south foehn is much more
striking and more frequent than the north foehn, which has to undergo much greater warming to
make itself felt (Defant 1951). Similarly, in western North America most chinook winds occur
on the east side of the mountains, because of the prevailing westerly wind and its movement
over the Pacific Ocean, which is considerably warmer in winter than the continental polar air
characteristic of the Great Basin and High Plains. Chinooks do occur, although less frequently,
on the western side of the mountains (Ives 1950; Cook and Topil 1952; McClain 1952; Glenn
1961; Longley 1966,1967; Ashwell 1971; Riehl 1974; Bower and Durran 1986).
Bora, Mistral, and Similar Winds. Like the foehn, these winds descend from mountains onto
adjacent valleys and plains but, unlike the foehn, they are cold. Compressional heating occurs,
but it is insufficient to appreciably warm the cold air that blows from an interior region in winter
across the mountains to an area that is normally warmer. These winds and others like them are
basically caused by the exchange of unlike air across a mountain barrier.
The “bora” is a cold, dry north wind on the Adriatic coast of Dalmatia. It reaches its most
intense development in winter and originates from high-pressure, cold continental air in
southwestern Russia that results in air movement southward across Hungary and the Dinaric
Alps (Smith 1987; Durran 1990). Ideal conditions for the bora exist when a southerly wind has
brought exceptionally warm conditions to the Adriatic coast, and relatively large temperature-
and pressure-differentials exist between the coast and the interior. Under these conditions, the
cold continental air may move down the pressure gradient, steepened by the presence of the
mountains, with extraordinary violence (Yoshino 1975; Pettre 1982). It frequently reaches gale
58 Draft: Chap. 4 Mt. Climate by A. Bach for Mountains and People
force, especially when channeled through narrow valleys and passes. The bora has been known
to overturn haywagons, tear off roofs, and destroy orchards. It is even claimed that it once
overturned a train near the town of Klis (De La Rue 1955).
The “mistral” occurs in Provence and on the French Mediterranean coast (Jansa 1987). It
is caused by the movement of cold air from high-pressure areas in the north and west of France
toward low-pressure areas over the Mediterranean between Spain and Italy in the Gulf of Lyon.
It is as violent as the bora, or more so, since it must pass through the natural constriction
between the Pyrenees and the western Alps (Defant 1951). The mistral was known in ancient
times. The Greek geographer Strabo called it "an impetuous and terrible wind which displaces
rocks, and hurls men from their chariots" (De La Rue 1955, p. 32). Its effects extend throughout
Provence and may be felt as far south as Nice. Like the bora, the mistral poses a major problem
for fruit production, and great expenditures of human labor have gone into constructing stone
walls and other windbreaks to protect the orchards (Gade 1978). The greatest wind velocities
occur in the Rhône Valley, where wind speeds of over 145 km (90 mi.) per hour have been
recorded.
Although the bora and mistral are the most famous, similar cold dry winds occur in many
mountain areas (Forrester 1982). The “bise” (breeze) at Lake Geneva between the Alps and the
French “Jura” is of the same type, and numerous examples could be cited from the large
mountain gaps and passes of Asia (Flohn 1969b). “Helm” winds blow down from the Pennine
Chain in north-central England, often creating rolls of clouds. “Sno” winds fill the fjords of
Scandinavia during winter and the “oroshi” blows near Tokoyo (Yoshino 1975). In North
America, the "northers" of the Gulf of Tehuantepec, Mexico, are a similar phenomenon (Hurd
1929). Another example is the exchange of the cold air during winter between the east and west
sides of the Cascade Mountains along the Columbia River Gorge (recently term the “Coho”
wind) and the Fraser River Valley. This is most pronounced when an outbreak of cold Arctic air
moves southward and banks up against the east side of the Cascades, causing great temperature-
and pressure-contrasts between the cold continental air and the relatively warm Pacific air. At
these times cold air is forced through these sea-level valleys at high velocities and brings some
of the clearest and coldest weather of the winter to the cities of Vancouver, British Columbia,
and Portland, Oregon (both located at valley mouths). At other times the cold air may force the
warm coastal air aloft and produce locally heavy snowfall. The most dominant feature, however,

59 Draft: Chap. 4 Mt. Climate by A. Bach for Mountains and People
is the cold and ferocious wind that leaves its mark on the landscape in the brown and deadened
foliage of needle-leaf trees and in the strongly flagged and wind-shaped trees on exposed sites
(Lawrence 1938).
Lee Waves. The behavior of airflow over an obstacle depends largely on the vertical wind
profile, the stability structure, the shape of the obstacle and the surface roughness (Stull 1988;
Barry 1992; Romero et al 1995). When wind passes over an obstacle, its normal flow is
disrupted and a train of waves may be created that extends downwind for considerable distances
(Figs. 4.26 and 4.39). The major mountain ranges produce large-amplitude waves that extend
around the globe (Hess and Wagner 1948; Gambo 1956; Nicholls 1973; Vosper and Parker
2002). On a smaller scale, these waves take on a regional significance reflected in their
relationship to the foehn, in distinctive cloud forms, in upper-air turbulence and downwind
climate (Scorer 1961, 1967; Reiter and Foltz 1967; Wooldridge and Ellis 1975; Smith 1976;
Durran 1990; Reynolds 1996; Reinking et al 2000). The amplitude and spacing of lee waves
depends on the wind speed and the shape and height of the mountains, among other factors. An
average wavelength is between 2-40 km (1-25 mi.), the vertical amplitude is usually between 1-5
km (0.6-3 mi.), and occurs at altitudes of 300-7,600 m (1,000-25,000 ft.) (Hess and Wagner
1948; Durran 1990). Wind speeds within lee waves are quite strong, frequently exceeding 160
km (100 mi.) per hour (Scorer 1961).
The most distinctive visible features of lee waves are the lenticular (lens-shaped) or
lee-wave clouds that form at the crests of waves (Fig. 4.41). These are created when the air
reaches dew point and condensation occurs as the air moves upward in the wave (Ludlam 1980).
The clouds do not form in the troughs of the waves, since the air is descending and warming
slightly (Fig. 4.40). The relatively flat cloud-bottoms represent the level of condensation, and the
smoothly curved top follows the outline of the wave crest. The clouds are restricted in vertical
extent by overlying stable air (Vosper and Parker 2002). Lenticular clouds are relatively
stationary (hence the name "standing-wave clouds"), although the wind may be passing through
them at high speeds. Lee-wave clouds frequently develop above one another, as well as in
horizontal rows (Fig. 4.41; cf. Fig. 4.40). They typically consist of 1-5 clouds and extend only a
few kilometers downwind, but satellite photography has revealed series of 30-40 clouds
extending for several hundred kilometers (Fig. 4.43; Fritz 1965; Bader et al. 1995).

60 Draft: Chap. 4 Mt. Climate by A. Bach for Mountains and People
Much of the early knowledge about lee waves was acquired by glider pilots who found to
their surprise that there was often greater lift to the lee of a hill than on the windward side. The
pilots had long made use of upslope and valley winds, but by this method could never achieve a
height of more than a couple of hundred meters above the ridges. In southern England, the
members of the London Gliding Club had soared for years in the lift of a modest 70 m (230 ft.)
hill, never achieving more than 240 m (800 ft.). After discovering the up-currents in the lee
wave, however, one member soared to a height of 900 m (3,000 ft.), thirteen times higher than
the hill producing the wave (Scorer 1961). German pilots were the first to explore and exploit
lee waves fully. In 1940, one pilot soared to 11,300 m (37,400 ft.) in the lee of the Alps. The
world's altitude record of 13,410 m (44,255 ft.) was set in 1952 in the lee of the Sierra Nevada
of California. This range has one of the most powerful lee waves in the world, owing to its great
altitudinal rise and the clean shape of its east front (Scorer 1961).
Another aspect of lee waves is the development of rotors. These are awesome roll-like
circulations that develop to the immediate lee of mountains, usually forming beneath the wave
crests (Fig. 4.40). The rotor flow moves toward the mountain at the base and away from it at the
top (Tampieri 1987). It is marked by a row of cumulus clouds but, unlike ordinary cumulus, they
may contain updrafts of 95 km (60 mi.) per hour (Fig. 4.44). The potential of such a wind for
damage to an airplane can well be imagined. The height of the rotor clouds is about the same as
that of the crest cloud or foehn wall. The rotating motion is thought to be created when the lee
waves reach certain amplitude and frictional drag causes a roll-like motion in the underlying air
(Fig. 4.40; Scorer 1961, 1967).
Several other kinds of turbulence may be associated with lee waves, particularly when
the wave train produced by one mountain is augmented by that of another situated in the right
phase relationship (Fig. 4.45). In some cases they cancel each other; in others they reinforce each
other. Wind strength and direction are also important, since a small change in either one can
alter the wave length of two superposed wave trains so that they become additive and create
violent turbulence (Scorer 1967; Lilly 1971; Lester and Fingerhut 1974; Neiman et al 2001).
One example of this is where the energy in standing waves is caused to "cascade" down from a
wavelength of 10 km (6 mi.) to only a few hundred meters (Reiter and Foltz 1967).
Microclimates
61 Draft: Chap. 4 Mt. Climate by A. Bach for Mountains and People
In addition to the climatic characteristics reviewed above, it should be emphasized there
are substantial variations in climates over very short distances within mountains. Mountain
environments are exceedingly spatially complex in terms of vegetation types and structures,
geology, soils, and topography. All vary in composition (i.e. species, canopy characteristics or
rocktypes), and variations occur across a range of slopes and aspects. The climate over each of
these surfaces, or microclimate, can differ significantly due to the variations net radiation, soil
and air temperature; humidity, precipitation accumulation (amount and form) and soil moisture;
and winds (Barry and Van Wie 1974; Green and Harding 1980; Fitzharris 1989).
Large differences in temperature, moisture and wind can be found within a few meters,
or even centimeters (Turner 1980; McCutchan and Fox 1986). The thin atmosphere at high
elevation means surfaces facing the sun on a clear day can warm dramatically, but shaded
surfaces remain cold (Fig. 4.23; Germino and Smith 2000). Other effects may arise according to
valley orientation with respect to the mountain range, valley cross-profile, and the affect of
winds and cold air drainage. The effect of aspect in generating slope winds can exceed the
influence of elevation on wind velocity and temperature (McCutchan and Fox 1986).
The mosaic of microclimates determines the local variability in ecosystem processes. The
distribution of vegetation zones, and even individual species may follow the distribution of
microclimates (Fig. 4.8; Canters, et al 1991; Roberts and Gilliam 1995; Parmesan 1996). A
simple classification using solar receipt, wind exposure, depth of winter snow cover and density
and height of vegetation cover, can help to characterize alpine microclimates (Turner 1980). On
this basis the following general microclimates can be differentiated:
Sunny, windward slope – solar radiation and windspeeds high
Sunny, lee slope – solar radiation high, windspeeds low
Shaded, windward slope – solar radiation low, windspeeds high
Shaded, lee slope – solar radiation and windspeeds low.
Certainly there are gradients between these categories. Precipitation and runoff inputs with alter
the soil moisture regime of each site, but generally the list goes from dry to moist. Vegetation
creates its own microenvironment by creating shade and windbreaks (Fig. 4.32). In association
with wind regime is a recurring pattern of snow accumulation in the lee of obstacles. These
snowdrifts add to soil moisture during the melt season, and protect trees from freezing in winter
(Wardle 1974).
62 Draft: Chap. 4 Mt. Climate by A. Bach for Mountains and People
The resolution of most weather station networks in mountains is far too coarse to capture
the spatial variability of climates in mountains. Maps of climatic variables are often interpolated
from existing meager data sets, using assumed or empirical relationships with elevation (Peck
and Brown 1962; Kyriakidis et al. 2001). These models are unable to demonstrate local
deviations in trends, and when combined with map scale, microclimates are typically eliminated
from most maps of mountains. Likewise, vegetation maps of mountainous areas rarely show the
small patches of vegetation that occurs in microclimatic habitats. While these features may be
un-mappable, they are certainly observable in mountains, adding to the spender of multifaceted
mountain environment.
Climate Change and Variability
Variability of climatic phenomenon is an important natural component of earth's climate
system. Climatic variability (occurrence of certain climatic events) is different than climatic
change, which is a permanent change in climatic conditions. However, changes in variability are
a likely result of climatic change. The middle and high latitudes inherently have very variable
climates since they are influenced by large seasonal changes in energy. The equatorial region
experiences little variability, as it has nearly the same energy fluxes year round. Reflecting the
complexity of the climate system, most regions of the world show different patterns and
magnitudes of variability and trends through time (Karl et al. 1999).
All temporal climate records demonstrate some degree of interannual variability (e.g.
Karl et al. 1999; Liu and Chen 2000; Kane 2000; Peterson and Peterson 2001). Every mountain
location has its record high and low temperature, snowfall, rain event, drought, and wind speed.
While these extreme events are rare, they often occur with a greater frequency, and with more
extreme magnitudes in mountainous regions, than in lowlands (Frei and Schar 2001). Extreme
storm events are exasperated by the topographic setting of mountains, producing even higher
precipitation totals, lower temperatures, and higher wind velocities. Extreme precipitation events
in mountains are of significance because they lead to hazards, such as downstream flooding, soil
erosion and mass-movements on slopes (Ives and Messerli 1989; Rebetez et al. 1997).
Temperature, precipitation and the resulting runoff variations are often related to distant forcing
mechanisms such as the El Niño/Southern Oscillation (Dettinger and Cayan 1995; Cayan et al.
1998; 1999; Diaz et al. 2001; Clare et al. 2002; Rowe et al. 2002). Several other periodic, yet

63 Draft: Chap. 4 Mt. Climate by A. Bach for Mountains and People
chaotic perturbations to the climate system have been linked to increased climatic variability
(McCabe and Fountain 1995; Mantua et al. 1997; Fowler and Kilsby 2002).
Among the regional differences in variability, the following consistent temporal trends
emerge in data sets over the last century: the number of extremely warm summer temperatures
has increased a small amount, the number of extremely cold winter temperatures has clearly
decreased (with fewer frost days), and mean summer season precipitation has increased,
especially an increase in heavy precipitation events (Karl et al. 1999). All of these general trends
have temporally reversed during the period of record. So while variability is expected, changes
in frequency of occurrence of extreme events is recognized as a signal of ongoing climate
change (NAST 2001).
Climate changes are well-documented to have occurred in the geologic past, as illustrated
by the glacial and inter-glacial climates of the Pleistocene (COHMAP 1988; Petit et al. 1999).
General scientific consensus states that the climate is currently changes, namely warming due to
anthropogenic inputs of greenhouse gases to the atmosphere (IPCC 2001; NAST 2001).
Different magnitudes of warming, and even cooling, are predicted for different mountainous
regions of the world (IPCC 2001). Precipitation, in particular, is predicted to both increase and
decrease in different regions due to changes in general circulation (Schroeder and McGuirk
1998). Climate models in mountainous regions, however, tend to be rather poor, due to coarse
resolution, topographic smoothing and local effects not captured by the models (Brazil and
Marcus 1991; Sinclair 1993). In mountains, higher temperatures would cause both a higher
percentage of annual precipitation to fall as rain (i.e. higher snowlines), as well as accelerate
summer ablation (Barry 1990; Groisman etal. 1999). Characterizing the exact climatic impacts to
any mountain site is difficult. We can however, demonstrate that past, and likely future climatic
changes and variations are likely to have major impacts in mountain environments.
Mountain and glacier environments are especially sensitive to climate changes and
variability (Barry 1990; Willis and Bonvin 1995). Many climate changes have been detected in
mountain records (e.g. Shrestha et al. 1999; Cayan et al. 2001; Pepin and Loaleben 2002).
Changes in winter precipitation and summer temperatures will alter the rate and extent to which
snowlines migrate up and down slope and contribute to glacier mass-balance and runoff
(Rebetez 1995; Clare et al. 2002). Seasonal snow packs in the Northern Hemisphere have
significantly declined over recent years (Cayan 1996; Robinson and Frei 2000). Glaciers are

64 Draft: Chap. 4 Mt. Climate by A. Bach for Mountains and People
likely to experience negative mass, which will contribute more water to melt-season runoff and
cause the glacier to retreat. Glacier recession will have an impact on local climatic conditions,
such and energy and moisture exchanges and the generation of local winds. Measurements of
alpine glacier mass-balances globally have documented retreats in recent decades (Haeberli et al.
1989; Marsten et al. 1989; Harper 1993; Bedford and Barry, 1995; Chambers 1997; Cogley and
Adams 1998; McGabe and Fountain, 1995; Pelto 1996; Rabus and Echelmeyer 1998; McCabe et
al. 2000). As a result, downstream runoff characteristics (i.e. seasonality and magnitude) may
change appreciably over the next several decades. If glaciers entirely disappear from mountains,
than melt-season, especially late melt-season discharge will decrease substantially (Fig. 4.30).
Glaciers are estimated to provide 6-20% of annual runoff in some rivers (Aizen et al. 1995; Bach
in review). Even climate changes in non-glacierized, low mountains can have a significant
impact on municipal water supplies (Frie et al. 2002).
Land-use changes in mountains, especially urbanization, logging and hydrolake
development can have significant impacts upon the regional and microclimates in mountains
(Goulter 1990; Roberts and Gilliam 1995; McGowan and Sturman 1996a). These environmental
disturbances can have long-term influences on climates since they change the surface
characteristics and energy and moisture fluxes. Hydrolakes have been found to moderate
temperatures, increase atmospheric water vapor content and precipitation, and increase
windiness by decreasing surface roughness and developing their own wind systems (Goulter
1990; McGowan and Sturman 1996a).
Since many organisms living in mountains survive near their tolerance range for climatic
conditions, even minor climatic changes could have a significant impact on alpine ecosystems
(Grabher et al. 1994; Graumlich 1994; Parmesan 1996; Peterson 1998; Gottfried et al. 1998;
Mizuno 1998; NAST 2001). Vegetation zones will migrate altitudinally in response to warming
temperatures, possibly eliminating some biomes, although the adaptations will likely be more
complex (Rochefort et al. 1994; Neilson and Drapek 1998). Treelines in many mountainous
regions have been responding to recent temperature changes (MacDonald et al. 1998; Kullman
and Kjallgren 2000; Marlow et al. 2000; Pallatt et al. 2000; Peterson and Peterson 2001; Klasner
and Fagre 2002). Trees are invading into meadows (Rochefort et al. 1994; Gavin and Brubaker,
1999; Wearne and Morgan 2001). Complex topography will result in habitat fragmentation and
the creation of barriers to migration, making it difficult for some species to adapt and allowing

65 Draft: Chap. 4 Mt. Climate by A. Bach for Mountains and People
others, often evasive species, to expand their range. There is a chance that Quaking Aspen and
Engleman Spruce of the North American western mountains might not survive under projected
climate changes (Hansen et al. 2001).
In response to the habitat changes, wildlife also migrates to find appropriate climatic
niches (Happold 1998; Hansen et al. 2001; Wang et al. 2002). Because of microclimatic
complexity, populations or individuals could readily be insolated on individual slopes or peaks,
as the mountain environment increases in fragmentation (Fig. 4.8; Neilson and Drapek 1998).
Since this climate shift is occurring rapidly, some species may not be able to adapt or migrate
quickly enough (Grabher et al. 1994). It is probable that some alpine and cold-water fish species
will not survive climatic changes, and new water temperatures will allow for the invasion of
non-native fish species (Grimm et al. 1997). Pacific salmon, which migrate to and spawn in
some mountains, have experienced population fluctuations related to climate (Mantua et al.
1997; Downton and Miller 1998). In the Columbia River systems, the projected impacts of
global warming are warmer water temperatures and earlier snowmelt peak flows, which are
likely to further impact the beleaguered salmon population and related ecosystems (Miller 2000)

66 Draft: Chap. 4 Mt. Climate by A. Bach for Mountains and People
Cut from bibliography
Asp, 1956Bolin 1950Hales 1933Hough 1945Lawrence 1939Lynott 1966Gallimore and Lettau, 1970Gutman and Schwerdtfeger 1965Miller 1977Montieth 1965Suzuki 1965Tanner and Fuchs 1968A. H. Thompson 1967
Add to Biblio
Aizen, V.B. E.M. Aizen, and J.M. Melack 1995. Climate, snow cover, glaciers, and runoff in the Tien Shan, Central Asia, Water Resources Bulletin, 31: 1113-1129.
Alford, D. (1985) Mountain hydrologic systems, Mountain Research and Development, 5: 349-363.
Alpert, P. 1986. Mesoscale indexing of the distribution of orographic precipitation over high mountains, Journal of Applied Meteorology, 25: 532-545.
Anderson, R.S. 1998. Near-surface thermal profiles in alpine bedrock: implications for frost weathering of rock, Arctic and Alpine Research, 30: 362-372.
Andersson, T. 1980. Bergeron and the oreigenic (orogrpahic) maxima of precipitation, Pure and Applied Geophysics, 119: 558-576.
Arnold, K. and R. Palmer 1952. The Coming of the Saucers, Amherst, WI: Palmer Publications.
Bach, A.J. (1995) Aeolian Modifications of glacial moraines at Bishop Creek, eastern California. In Desert Aeolian Geomorphology (V.P. Tchakerian, Ed.), Chapman and Hall: London, pp. 179-197.Bach, A.J. (in review) Estimating high elevation snowshed contributions to the Nooksack River watershed, North Cascades, Washington. The Geographical Review.
Bader, M.J., Forbes, J.R., Grant, J.R., Lilley, R.B. and A.J. Waters 1995. Images in weather forecasting: practical guide for interpreting satellite and radar data. Cambridge : University Press.
67 Draft: Chap. 4 Mt. Climate by A. Bach for Mountains and People
Bailey, W.G., IR. Saunders, and J.D. Bowers 1990. Atmosphere and surface control on evaporation from alpine tundra in the Canadian cordillera, In: H. Lang and A. Musy (eds.), Hydrology of Mountainous Regions, International Association of Hydrologic Sciences Publication no. 193, pp. 59-64.
Bailey, W.G., E.J. Weick, and J.D. Bowers 1989. The radiation balance of alpine tundra, Plateau Mountains, Alberta, Canada, Arctic and Alpine Research, 21: 126-134.
Banta, R.M. 1984. Daytime boundary-layer evolution over mountainous terrain. Part 1. Observations of the dry conditions, Monthly Weather Review, 112: 340-356.
Banta, R.M. 1986. Daytime boundary-layer evolution over mountainous terrain. Part 2. Numerical studies of upslope flow duration, Monthly Weather Review, 114: 112-130.
Banta, R. and W.R. Cotton 1981. An analysis of the structure of local wind systems in a broad mountain basin, Journal of Applied Meteorology, 20: 1255-1266
Banta, R.M. and C.L.B. Schaaf 1987. Thunderstorm genesis zones in the Colorado Rocky Mountains as determined by traceback of geosynchronous satellite images, Monthly Weather Review, 115: 463-476.
Barr, S. and M.M. Ogill 1989. Influence of external meteorology on nocturnal valley drainage winds, Journal of Applied Meteorology, 28: 497-517.
Barry, R.G. 1990. Changes in Mountain Climate and Glacio-Hydrologic Responses. Mountain Research and Development 10: 161-170.
Barry, R.G. 1992. Mountain Weather and Climate, 2nd edition, London: Routledge.
Barry, R.G. and C.C. Van Wie 1974, Topo- and microclimatology in alpine areas, In: J.D. Ives and R.G. Barry (eds.), Arctic and Alpine Environments, London: Methuen, pp. 73-83.
Bates, G.T. 1990. A case study of the effects of topography on cyclone development in the western United States. Monthly Weather Review, 118: 1808–1825.
Bedford, D.P. and R.G. Barry 1995. Glacier trends in the Caucasus, 1960s to 1980s, Physical Geography, 15: 414-424.
Benizou, P. 1989. Taking topography into account for network optimization in mountainous areas, In: B. Suvruk (ed.) Precipitation Measurements, WMO/IAHS/ETH Workshop on Precipitation Measurement, Zurich, pp. 307-312, Swiss Federal Institute of Technology.
Berg, N.H. 1988 Mountain-top riming at sites in California and Nevada, U.S.A., Arctic and Alpine Research, 30: 429-447.

68 Draft: Chap. 4 Mt. Climate by A. Bach for Mountains and People
Blumenthaler, M. and W. Ambach 1990. Indication of increasing solar ultraviolet-B radiation flux in alpine regions, Science, 248: 206-208.
Bossert, J. E. and W.R. Cotton, 1994. Regional-scale flows in mountainous terrain. Part I: A numerical and observational comparison, Monthly Weather Review, 122: 1449–1471.
Bower, J.B. and D.R. Durran 1986. A study of wind profiler data collected upstream during windstorms at Boulder, Colorado, Monthly Weather Review, 114: 1491-1500.
Bowers, J.D. and W.G. Bailey 1989. Summer energy balance regimes of alpine tundra, Plateau Mountains, Alberta, Canada, Arctic and Alpine Research, 21: 135-143.
Brazel, A.J. and M.G. Marcus 1991. July temperatures in Kashmir and Ladakh, India: Comparisons of observations and general circulation model simulations, Mountain Research and Development, 11: 75-86.
Broccoli, A.J. and S. Manabe 1992. The effects of orography on midlatitude Northern Hemisphere dry climates. Journal of Climate, 5: 1181–1201.
Browning, K.A. and F.F. Hill 1981. Orographic rain, Weather, 36: 326-329.
Buzzi, A., A. Speranza, S. Tibaldi, and E. Tosi 1987. A unified theory of orographic influences on cyclogenesis, Meteorology and Atmospheric Physics, 36: 91-107.
Calder, I.R. 1990. Evaporation in the Uplands, Chichester: J. Wiley and Sons.
Caldwell, M.M. 1980. Light quality with special reference to UV at high altitudes, In: U. Benecke and M.R. Davis (eds.), Mountain Environments and Subalpine Tree Growth, Wellington Forest Research Institute, New Zealand Forest Service, pp. 61-79.
Canters, K.J., H. Scholler, S. Ott, and H.M. Jahns 1991. Microclimatic influences on lichen distribution and community development, Lichenologist, 23: 237-252.
Carruthers, D.J. and J.C.R.Hunt 1990. Fluid mechanisms of airflow over hills: Turbulence, fluxes, and waves in the boundary layer, In: W. Blumen (ed.) Atmospheric Processes over Complex Terrain, Meteorological Monograph 23(45), pp. 83-103, Boston: American Meteorological Society.
Castro, J.M. and P.L. Jackson (2001) Bankfull discharge recurrence intervals and regional hydraulic geometry relations: Patterns in the Pacific Northwest, USA, Journal of the American Water Resources Association, 37: 1249-1262.
Cavelier, J. and G. Goldstein 1989. Mist and fog interception in elfin cloud forests in Columbia and Venezuela, Journal of Tropical Ecology, 5: 309-322.

69 Draft: Chap. 4 Mt. Climate by A. Bach for Mountains and People
Cayan, D.R. 1996. Interannual climate variability and snowpack in the western United States. Journal of Climate,. 9: 928–948. Cayan, D.R., M.D. Dettinger, H.F. Diaz, and N.E. Graham, 1998. Decadal climate variability of precipitation over western North America. Journal of Climate, 11: 3148-3166.
Cayan, D.R., S. Kammerdiener, M.D. Dettinger, J. M. Caprio, and D.H. Peterson, 2001. Changes in the onset of spring in the western United States., Bulletin of the. American Metrological. Society, 82(3), 399-415.
Cayan, D.R., K.T. Redmond, and L.G. Riddle, 1999. ENSO and hydrologic extremes in the
western United States, Journal of Climate, 12: 2881-2893.
Chambers, F.B. 1997. Glaciology- marginal glaciers and climate change in the Sierra Nevada, California. In 1998 Science and Technology. Edited by S.P. Parker, 168-172. New York, New York: McGraw-Hill, Inc.
Chapman, R.S. and T.E. Werkema 1995. Solar ultraviolet radiation and the risk of infectious disease: Summary of a workshop, Photochemistry & Photobiology, 61: 223-247.
Chater, A.M. and A.P. Sturman 1998. Atmospheric conditions influencing the orographic spillover of westerly rainfall into the Waimakariri catchmet, Southern Alps, New Zealand, International Journal of Climatology, 18: 77-92.
Chen, L., E.R. Reiter, and Z. Feng 1985. The atmospheric heat source over the Tibetan Plateau; May-August 1979, Monthly Weather Review, 113: 1771-1790.
Chen, W.D. and R.B. Smith 1987. Blocking and deflection of airflow by the Alps, Monthly Weather Review, 115: 2578-2597.
Chung, Y.S., K.D. Hage, and E.R. Reinelt 1976. On leecyclogenesis and airflow in the Canadian Rockies and the east Asian mountains, Monthly Weather Review, 104: 879-891.
Clare,G.R. B.B. Fitzharris, T. J. H. Chinn, M. J. Salinger 2002. Interannual variation in end-of-summer snowlines of the Southern Alps of New Zealand, and relationships with Southern Hemisphere atmospheric circulation and sea surface temperature patterns, International Journal of Climatology, 22: 107-120 .
Clements, C.B. 1999. Mountain and valley winds of Lee Vining Canyon, Sierra Nevada, California, U.S.A, Arctic, Antarctic and Alpine Research,. 31: 293-302.
Cline, D.W. 1997. Snow surface energy exchanges and snowmelt at a continental, mid-latitude Alpine site, Water Resources Research, 33: 689-702.
Cline, D.W., Bales, R.C. and J. Dozier 1998. Estimating the spatial distribution of snow in mountain basins using remote sensing and energy balance modeling, Water Resources Research,

70 Draft: Chap. 4 Mt. Climate by A. Bach for Mountains and People
34: 1275-1285.Cogley J.G. and W.P. Adams 1998. Mass balance of glaciers other than ice sheets, Journal of Glaciology, 44: 315-325. COHMAP (Climates of the Holocene Mapping Project) 1988. Climatic Changes of the last 18,000 years: Observations and model simulations, Science, 241: 1043-1052.
Colle, B.A. and C.F. Mass 1996. An observational and modeling study of the interaction of low-level southwesterly flow with the Olympic Mountains during COAST IOP 4, Monthly Weather Review, 124: 2152–2175.
Czarnetzki, A.C. and D.R. Johnson, 1996. The role of terrain and pressure stresses in Rocky Mountain lee cyclones. Monthly Weather Review, 124: 553–570.
Davidson, B., S.D. Gerbier, S.D. Papagiankis, and P.J. Rijkoort 1964. Sites for wind-power installations, W.M.O. Technical Note #63, Geneva: World Meteorological Organization.
Davies, H.C. and P.D. Phillips 1985. Mountain drag along the Gottard section during ALPEX, Journal of Atmospheric Science, 42: 2093-2109.
Deshler, T, D.W. Reynolds, and A.W. Huggins 1990. Physical response of winter orographic clouds over the Sierra Nevada to airborne seeding using dry ice or silver iodide. Journal of Applied Meteorology, 29: 288–330.
Dettinger, M.D. and D.R. Cayan 1995. Large-scale atmospheric forcing of recent trends towards early snowmelt and runoff in California, Journal of Climate, 8: 606-623.
Diaz, H.F M.P. Hoerling, and J.K. Eischeid 2001 ENSO variability, teleconnections and climate change, International Journal of Climatology, 21: 1845-1862. Dingman, S.L. 1993. Physical Hydrology, Upper Saddle River, New Jersey: Prentice Hall.
Downton, M.W. and K.A. Miller 1998. Relationships between salmon catch and north Pacific climate on interannual and decadal time scales, Canadian Journal of Fisheries and Aquatic Sciences, 55: 2255-2265.
Drogue, G., J. Humbert, J. Deraisme, N. Mahr, and N. Freslon 2002 A statistical-topographic model using an omnidirectional parameterization of the relief for mapping orographic rainfall, International Journal of Climatology, 22: 599-613.
Durran, D.R. 1990. Mountain waves and downslope winds, In: W. Blumen (ed.) Atmospheric Processes over Complex Terrain, Meteorological Monograph 23(45), pp. 59-81, Boston: American Meteorological Society.

71 Draft: Chap. 4 Mt. Climate by A. Bach for Mountains and People
Elder, K., J. Dozier, and J. Michaelsen 1989. Spatial and temporal variation of net snow accumulation in a small alpine watershed, Emerald Lake basin, Sierra Nevada, California, Annals of Glaciology, 13: 56-63.
Ferretti, Rossella, Tiziana Paolucci, W. Zheng, Guido Visconti, P. Bonelli 2000. Analyses of the precipitation pattern on the alpine region using different cumulus convection parameterizations. Journal of Applied Meteorology, 39: 182–200.
Fitzharris, B.B. 1989. A review of topoclimatology in New Zealand, Weather and Climate, 9: 7-13.
Föhn, P.M. 1980. Snow transport over mountain crests, Journal of Glaciology, 26: 469-480.
Forrester, F.H. 1982. Winds of the world, Weatherwise, 35: 204-210.
Fountain, A.G., and W.V. Tangborn. 1985. The effect of glaciers on streamflow variations. Water Resources Research 21: 579-586.
Fowler, H.J. and C.G. Kilsby 2002. Precipitation and the North Atlantic Oscillation: a study of climatic variability in northern England, International Journal of Climatology, 22: 843-866.
Frei, A., R.L. Armstrong, M.P. Clark, and M.C. Serreze 2002. Catskill Mountain water resources: vulnerability, hydroclimatology, and climate-change sensitivity, Annals of the Association of American Geographers, 92: 203-224.
Frei, C. and C. Schär 2001. Detection probability of trends in rare events: Theory and application to heavy precipitation in the alpine region. Journal of Climate, 14: 1568–1584.
Gallus, WA. and J.B. Klemp 2000. Behavior of flow over steep orography. Monthly Weather Review, 128: 1153–1164.
Gan, M.A. and V.B. Rao. 1994. The influence of the Andes Cordillera on transient disturbances. Monthly Weather Review, 122: 1141–1157.
Garreaud, R. D., 1999. Multiscale analysis of the summertime precipitation over the Central Andes. Monthly Weather Review, 127: 901–921.
Gavin, D.G. and L.B. Brubaker 1999. A 6000-year soil pollen record of subalpine meadow vegetation in the Olympic Mountains, Washington, USA, Journal of Ecology, 87: 106-122.
Gaylord, D.R., and P.J. Dawson 1987. Airflow-terrain interactions through a mountain gap, with an example of eolian activity beneath an atmospheric hydraulic jump, Geology, 15: 789-792.
Germann, U. and J. Joss, 2001. Variograms of radar reflectivity to describe the spatial continuity of alpine precipitation. Journal of Applied Meteorology, 40: 1042–1059.

72 Draft: Chap. 4 Mt. Climate by A. Bach for Mountains and People
Germann, U. and J. Joss, 2002. Mesobeta profiles to extrapolate radar precipitation measurements above the Alps to the ground level, Journal of Applied Meteorology, 41: 542–557.
Germino, M.J. and W.K. Smith 2000. Differences in microsite, plant form, and low-temperature photoinhaibition in alpine plants, Arctic, Antarctic, and Alpine Research, 32: 388-396.
Goodin, D.G. and S.A. Isard 1989. Magnitude and sources of variation in albedo within an alpine tundra, Theoretical and Applied Climatology, 40: 50-60.
Goodison, B.E., B. Servuk, and S. Klemm 1989. WMO solid precipitation measurement intercomparison: objectives, methodology, analysis, In: J.W. Delleur (ed.) Atmospheric Deposition, International Association of Hydrologic Sciences Publication no. 179, pp. 59-64.
Gottfried, M., H. Pauli, and G. Grabherr 1998. Prediction of vegetation patterns at the limits of plant life: A new view of the alpine-nival ecotone Arctic, Antarctic, and Alpine Research, 30: 207-221.
Goulter, S.W. 1990. Estimation of temperature changes near Lake Pakaki, South Canterbury, since enlargement of the lake, New Zealand Journal of Geology and Geophysics, 33: 41-47.Grabher, G., Gottfried, M., and H. Pauli 1994. Climate effects on mountain plants, Nature, 369: 448. Graumlich, L.J. 1994. Long-term vegetation change in mountain environments, Mountain Environments in Changing Climates, M. Beniston (ed.) New York: Routledge, pp. 167-179.
Green, F.H.W. and R.J. Harding 1979. The effect of altitude on soil temperature, Meteorological Magazine, 108: 81-91.
Green, F.H.W. and R.J. Harding 1980. Altitudinal gradients of soil temperature in Europe, Transactions of the Institute of British Geographers, 5: 243-254.
Grimm, N.B., A. Chancon, C.N. Dahm, S.W. Hostetler, O.T. Lind, P.L. Starkweather, and W.W. Wurstbaugh 1997. Sensitivity of aquatic ecosystems to climatic and anthropogenic changes: The basin and range, American Southwest and Mexico, Hydrologic Processes, 11: 1023-1041.
Groisman, P.Y., T.R. Karl, D.R. Easterling, R.W. Knight, P.F. Jamason, K.J. Hennessy, R. Suppiah, C.M. Page, J. Wibig, K. Fortuniak, V.N. Razuvaev, A. Douglas, E. Forland, and P.M. Zhai 1999. Changes in the probability of heavy precipitation: inportant indicators of climatic change, Climatic Change, 42: 243-283.
Haerberli, W., P. Muller, P. Alean, and H. Borsch 1989. Glacier changes following the Little Ice Age- a survey of the international data base and its perspectives, In: J. Oerlemans (ed.), Glacier Fluctuations and Climate, Dordrecht: Reidel, pp. 77-110.
73 Draft: Chap. 4 Mt. Climate by A. Bach for Mountains and People
Hansen, A.J. R.P. Neilson, V. Dale, C. Flather, L. Iverson, D.J. Currie, S. Shafer, R. Cook, and P.J. Bartlein 2001. Global change in forests: Responses of species, communities, and biomes, BioScience, 51: 765-779.
Hanson, C.L. 1982. Distribution and stochastic generation of annual and monthly precipitation on a mountainous watershed in southwest Idaho, Water Resources Bulletin, 18: 875-883.
Happold, D. C. D. 1998. The subalpine climate at Smiggin Holes, Kosciusko National Park, Australia, and its influence on the biology of small mammals, Arctic, Antarctic and Alpine Research, 30: 241-251.
Harper, J.T. 1993. Glacier terminus fluctuations on Mount Baker, Washington, U.S.A. 1940-1990, and climatic variations. Arctic and Alpine Research 25: 332-340.
Henning, D. and D. Henning 1981. Potential evapotranspiration in mountain ecosystems on different altitudes and latitudes, Mountain Research and Development, 1: 267-274.
Hindman, E.E. 1986. Characteristics of supercooled liquid water in clouds at mountaintop sites in the Colorado Rockies, Journal of Applied Meteorology, 25: 1271-1279.
Hock, R., M. Johansson, P. Jansson, and L. Bärring 2002 Modeling Climate Conditions Required for Glacier Formation in Cirques of the Rassepautasjtjåkka Massif, Northern Sweden, Arctic, Antarctic and Alpine Research, 34: 3-11.
Hoinka, K.P. 1985. Observation of airflow over the Alps during a foehn event, Quarterly Journal of the Royal Meteorological Society, 111: 199-224.
Horst, T.W. and J.C. Doran 1986. Nocturnal drainage flow on simple slopes, Boundary-Layer Meteorology, 34: 263-286.
Hulme, M., E.M. Barrow, N.W. Arnell, P.A. Harrison, T.C. Johns, and T.E. Downing. 1999. Relative impacts of human-induced climate change and natural variability. Nature 397: 688-691.
Huntington, C., Blyth, E.M., Wood, N., Hewer, H.E., and A. Gant 1998. The effect of orography on evaporation, Boundary-Layer Meteorology, 86: 487-504.
Huo, Z. and W.G. Bailey 1992. Evaluation of models for estimating net radiation for alpine sloping surfaces, Acta Meteorologica Sinica, 6: 189-197.
Iijima, Y. and M. Shinoda 2000. Seasonal changes in the cold-air pool formation in a subalpine hollow, Central Japan, International Journal of Climatology, 20: 1471-1483.
IPCC (Intergovernmental Panel on Climate Change) 2001. Climate Change 2001: The Scientific Basis, edited by J.T. Houghton, Y. Ding, D.J. Griggs, M. Noguer, P.J. van der Linden, and D.

74 Draft: Chap. 4 Mt. Climate by A. Bach for Mountains and People
Xiaosu, Cambridge UK: Cambridge University Press.
Isard, S.A. and M.J. Belding 1986. Evapotranspiration from alpine tundra of Colorado, USA, Arctic and Alpine Research, 21: 71-82. Ives, J.D. and B. Messerli 1989. The Himalayan Dilemma: Reconciling development and conservation, London: Routledge.
Jansa, A. 1987. Distribution of the mistral: a satellite observation, Meteorology and Atmospheric Physics, 36: 201-214.
Kane, R.P. 2000. El Niño/La Niña relationship with rainfall at Huancayo, in the Peruvian Andes, International Journal of Climatology, 20: 63-72.
Karl, T.R., Nicholls, N., and A. Ghazi (eds.) 1999. Weather and climate extremes; changes, variations and a perspective from the Insurance industry, Dordrecht: Kluwer Academic Publishers.
Kasper, D.T. 1981. Santa Ana windflow in the Newhall Pass as determined by an analysis of tree deformation, Journal of Climate and Applied Meteorology, 20: 1267-1276.
Kattelman R. and K. Elder 1991. Hydrologic characteristics and balance of an alpine basin in the Sierra Nevada, Water Resources Research, 27: 1553-1562.
Kelliher, F.M., I.F. Owens, A.P. Sturman, J.N. Byers, J.E. Hunt, and T.M. McSeveny 1996. Radiation and ablation on the névé of Franz Josef Glacier, New Zealand Journal of Hydrology, 35: 131-145.
Kimura, F. and P. Manins 1988. Blocking in periodic valleys, Boundary-Layer Meteorology, 44: 137-169.
Klasner, F.L and D.B. Fagre 2002..A half century of change in alpine treeline patterns at Glacier National Park, Montana, U.S.A. Arctic, Antarctic, and Alpine Research, 34: 49-56.
Konzelmann, T., P. Calanca, G. Müller, L. Menzel, and H. Lang 1997. Energy balance and evapotranspiration in a high mountain area during summer. Journal of Applied Meteorology: 36: 966–973.
Kresch, D.L. 1994. Variability of streamflow and precipitation in Washington, USGS Water-Resource Investigations Report 93-4132.
Kruckeberg, A.R. 1991. The Natural History of Puget Sound Country, Seattle: University of Washington Press.
Kullman, L. and L. Kjällgren 2000. A coherent postglacial tree-limit chronology (Pinus sylvestris L.) for the Swedish Scandes: Aspects of paleoclimate and "recent warming," based on
75 Draft: Chap. 4 Mt. Climate by A. Bach for Mountains and People
megafossil evidence, Arctic, Antarctic and Alpine Research, 32: 419-428.
Kurzbach, J.E., P.J. Guetter, W.F. Ruddiman, and W.L. Prell 1989. Sensitivity of climate to Late Cenozoic uplift in southern Asia and the American West: numerical experiments, Journal of Geophysical Research, 94(D15): 18: 393-407.
Kyriakidis, P.C., J. Kim, and N.L. Miller, 2001. Geostatistical mapping of precipitation from rain gauge data using atmospheric and terrain characteristics. Journal of Applied Meteorology, 40: 1855–1877.
Lauer, W. 1975. Klimatische grundzüge der höhenstufung tropischer gebirge, In: F. Steiner (ed.) Tagungsbericht und Wissenschaftliche Abhandlungen, 40 Deutcher Geographentag,Innsbruck, pp. 79-90.
Lee, J.T., R.E. Lawson, and G.L. March 1987. Flow visualization experiments on stabily stratified flow over ridges and valleys, Meteorology and Atmospheric Physics, 37: 183-194.
Linacre, E. 1982. The effect of altitude on the daily range of temperature, Journal of Climatology, 2: 375-382.
Lins, H.F. 1999. Regional streamflow regimes and hydroclimatology of the United States, Water Resources Research 33: 1655-1667.
Litaor, M.I. 1987. The influence of eolian dust on the genesis of alpine soils in the Front Range, Colorado, Soil Science Society of America, Journal, 51: 142-147.
Liu, X., and B. Chen 2000. Climatic warming in the Tibetan Plateau during recent decades, International Journal of Climatology, 20: 1729-1742.
Long, A.B. and E.J. Carter. 1996. Australian winter mountain storm clouds: Precipitation augmentation potential. Journal of Applied Meteorology, 35: 1457–1464.
Ludlam, F.H. 1980. Clouds and Storms, University Park, PA: Pennsylvania State University Press.
Male, D.H. and D.M. Gray 1981. Handbook of Snow, New York: Pergamon Press.
Manabe, S. and A.J. Broccoli 1990. Mountains and arid climates of middle latitudes, Science, 247: 192-195.
Mantua, N.J., S.R. Hare, Y. Zhang, J.M. Wallace, and R.C. Francis. 1997. A Pacific interdecadal climate oscillation with impacts on salmon production. Bulletin of the American Meteorological Society 78: 1069-1079.

76 Draft: Chap. 4 Mt. Climate by A. Bach for Mountains and People
Marcus, M.G., R.D. Moore, and I.F. Owens 1985. Short-term estimates of surface energy transfers and ablation on the lower Franz Josef Glacier, South Westland, New Zealand, New Zealand Journal of Geology and Geophysics, 28: 559-567.
Marston, R., L. Pochop, G. Kerr, and M. Varuska 1989. Recent trends in glaciers and glacier runoff, Wind River Range, Wyoming, Proceedings, Symposium on Headwaters Hydrology, American Water Resources Association, pp. 159-169.
Martinec, J. 1989. Hour-to-hour snowmelt rates and lysimeter outflow during and entire ablation period, In: Snow Cover and Glacier Variations, International Association of Hydrological Sciences Publication No. 183, pp. 19-28.
Martinec, J. 1987. Importance and effects of seasonal snowcover, In: B.E. Goddison, R.G. Barry, and J. Dozier (eds.), Large Scale Effects of Seasonal Snow Cover, International Association of Hydrological Sciences Publication No. 166, pp. 107-120.
Marwitz, J.D. 1987. Deep orographic storms over the Sierra Nevada. Part II. The precipitation process, Journal of Atmospheric Science, 44: 174-185
Mass, C. 1981. Topographically forced convergence in western Washington, Monthly Weather Review, 109: 1335-1347.
McCabe, G.J., A. G. Fountain and M. Dyurgerov 2000. Variability in winter mass balance of Northern Hemisphere glaciers and relations with atmospheric circulation, Arctic, Antarctic, and Alpine Research, 32: 64-72.
McCabe, G.J., and A.G. Fountain. 1995. Relations between atmospheric circulation and mass balance of South Cascade Glacier, Washington, U.S.A. Arctic and Alpine Research 27: 226-233.
McCauley, M.P. and A.P. Sturman 1999. A study of orographic blocking and barrier wind development upstream of the Southern Alps, New Zealand, Meteorology and Atmospheric Physics, 70: 121-131.
McCutchan, M.H. 1983. Comparing temperature and humidity on a mountain slope and in the free air nearby, Monthly Weather Review, 111: 836-845.
McCutchan, M.H. and D.G. Fox 1986. Effect of elevation and aspect on wind, temperature and humidity, Journal of Climate and Applied Meteorology, 25: 1996-2013.
MacDonald, G. M., R. A. Case, and J. M. Szeicz 1998. A 538-year record of climate and treeline dynamics from the Lower Lena River Region of Northern Siberia, Russia, Arctic, Antarctic and Alpine Research, 30: 334-339.
McGinley, J. 1982. A diagnosis of Alpine lee cyclogenesis, Monthly Weather Review, 110: 1271-1287.

77 Draft: Chap. 4 Mt. Climate by A. Bach for Mountains and People
McGinnis, D.L. 2000. Synoptic controls on upper Columbia River basin snowfall, International Journal of Climatology, 20: 131-149.
McGowan, H.A. and A.P. Sturman 1993. Synoptic and local effects on the climate of the Waimate area, South Canterbury, Weather and Climate, 13: 22-33.
McGowan, H.A. and A.P. Sturman 1996a. Interacting multi-scale wind systems within an alpine basin, Lake Tekapo, New Zealand, Meteorology and Atmospheric Physics, 58: 165-177.
McGowan, H.A. and A.P. Sturman 1996b. Regional and local scale characteristics of fohn wind events over the South Island of New Zealand, Meteorology and Atmospheric Physics, 58: 151-164.
McKee, T.B. and R.D. O’Neal 1989. The role of valley geometry and energy budget in the formation of nocturnal valley winds, Journal of Applied Meteorology, 28: 445-456.
McNider, R.T. 1982. A note on velocity fluctuations in drainage flows, Journal of Atmospheric Sciences, 39: 1658-1650.
Meister, R. 1987. Wind systems and snow transport in alpine topography, In: B. Salm and H. Gubler (eds.), Avalanche Formation, Movement and Effects, International Association of Hydrological Sciences Publication No. 162, pp. 265-267.
Meyers, M.P., P. J. Demott, and W.R. Cotton 1995. A comparison of seeded and nonseeded orographic cloud simulations with an explicit cloud model. Journal of Applied Meteorology, 34: 834–846.
Miller, J.F. 1982. Precipitation evaluation on hydrology, In: E.J. Plate (ed.) Engineering Meteorology, pp. 371-428, Amsterdam: Elservier.
Miller, K.A. 2000. Pacific salmon fisheries: climate, information and adaptation in a conflict-ridden context, Climatic Change, 45: 36-61.
Miniscloux, F., J.D. Creutin, and S. Anquetin 2001. Geostatistical analysis of orographic rainbands. Journal of Applied Meteorology, 40: 1835–1854.
Mizuno, K. 1998. Succession processes of alpine vegetation in response to glacial fluctuations of Tyndall Glaciers, Mt. Kenya, Kenya Arctic, Antarctic, and Alpine Research, 30: 207340-348.
Nappo, C.J., K. Shankar-Rao, and J.A. Herwethe 1989. Pullutant transport and diffusion in katabatic flw, Journal of Applied Meteorology, 28: 617-625.
NAST (National Assessment Synthesis Team 2001. Climate Change Impacts on the United States: The Potential Consequences of Climate Variability and Change, Report for the US Global Change Research Program, Cambridge UK: Cambridge University Press.

78 Draft: Chap. 4 Mt. Climate by A. Bach for Mountains and People
Neff, W.D. and C.W. King 1989. The accumulation and pooling of drainage flows in a large basin, Journal of Applied Meteorology, 28: 518-529.
Neilson, R.P. and R.J. Drapek 1998. Potentially complex bioshere responses to transient global warming, Global Change Biology, 4: 505-521.
Neiman, P.J., F. M. Ralph, R.L. Weber, T. Uttal, L.B. Nance, D.H. Levinson, 2001. Observations of nonclassical frontal propagation and frontally forced gravity waves Adjacent to Steep Topography. Monthly Weather Review, 129: 2633–2659.
Neiman, P.J., F.M. Ralph, A.B. White, D.E. Kingsmill, P.O.G. Persson, 2002. The statistical relationship between upslope flow and rainfall in California's Coastal Mountains: Observations during CALJET. Monthly Weather Review, 130: 1468–1492.
NRCS (Natural Resources Conservation Service) 1997. Snow Surveys and Water Supply Forecasting, United States Department of Agriculture, Agriculture Information Bulletin 536.
Nullet, D. and M. McGranaghan 1988. Rainfall enhancement over the Hawaiian Islands, Journal of Climatology, 1: 837-839.
Ohmura, A. 1991. New precipitation and accumulation maps for Greenland, Journal of Glaciology, 37: 140-148.
Østrem, G. and M. Brugman 1991. Glacier Mass-Balance Measurements, National Hydrology Research Institute Science Report No. 4, Environment Canada.
Papadopoulos, K.H. and C.G. Helmis 1999. Evening and morning transition of katabatic flows, Boundary-Layer Meteorology, 92: 195-227.
Parmesan, C. 1996. Climate and species’ range, Nature, 382: 765-766.
Pedgley, D.E. 1971. Some weather patterns in Snowdonia, Weather, 26: 412-444.
Pellatt, M.G., M. J. Smith, R. W. Mathewes, I. R. Walker, and S.L. Palmer 2000. Holocene treeline climate change in the subalpine zone near Stoyoma Mountain, Cascade Mountains, southwestern British Columbia, Canada, Arctic, Antarctic, and Alpine Research, 32: 73-83.
Pelto, M. 1996. Annual net balance of North Cascade Glaciers, 1984-1994. Journal of Glaciology, 42: 3-9.
Penman, H.L. 1963. Vegetation and Hydrology, Commonwealth Bureau of Soils Technical Communication #53, Rarnham Royal Bucks, England, Commonwealth Agricultural Bureaux.
Pepin, N. and M. Losleben 2002. Climate change in the Colorado Rocky Mountains: free air versus surface temperature trends, International Journal of Climatology, 22: 311-329

79 Draft: Chap. 4 Mt. Climate by A. Bach for Mountains and People
Peterson, D.H., R.E. Smith, M.D. Dettinger, D.R. Cayan, and L. Riddle. 2000. An organized signal in snowmelt runoff over the Western United States. Water Resources Research 36: 421-432.
Peterson, D.L. 1998. Climate, limiting factors and environmental change in high-altitude forests of western North America, Climatic Variability and Extremes: The Impacts on Forests, M. Beniston and J.L. Innes (eds.), Heidelberg: Springer-Verlag, pp. 191-208.
Peterson, D.W., D.L. Peterson 2001. Mountain hemlock growth responds to climatic variability at annual and decadal time scales, Ecology, 82: 3330–3345.Petit et al. 1999. Climate and atmospheric history of the past 420,000 years from the Vostok ice core, Antarctica, Nature, 399: 429-436.
Pettre, P. 1982. On the problem of violent valley winds, Journal of Atmospheric Sciences, 39: 542-544.
Pichler, H. and R. Steinacker 1987. On the synoptics and dynamics of orographically induced cyclones in the Mediterranean, Meteorological and Atmospheric Physics, 36: 108-117.
Plüss, C. and A. Ohmura, 1997. Longwave radiation on snow-covered mountainous surfaces. Journal of Applied Meteorology, 36: 818–824.
Porch, W.H., R.B. Fritz, R.L. Coulter, and P.H. Gudiksen 1989. Tributary, valley, and sidewall air flow interactions in deep valley, Journal of Applied Meteorology, 28: 578-589.
Rabus, B.T. and K.A. Echelmeyer 1998. The mass balance of McCall Glacier, Brooks Range, Alaska, U.S.A.; its regional relevance and implications for climate change in the Arctic, Journal of Glaciology, 44: 333-351.
Ramachandran, G., K.V. Rao, and K. Krishna 1980. An observational study of the boundary-layer winds in the exit region of a mountain gap, Journal of Applied Meteorology, 19: 881-888.
Ramage, C. S. and T.A. Schroeder 1999. Trade wind rainfall atop Mount Waialeale, Kauai, Monthly Weather Review, 127: 2217–2226.
Rango, A., J. Martinec, A.T.C. Chang, J.L. Foster, and V. van Katwijk 1989. Average water equivalent of snow in a mountain basin using microwave and visible satellite data, IEEE Transactions of Geoscience and Remote Sensing, 27: 740-745.
Rao, G.V., and S. Erdogan 1989. The atmospheric heat source over the Bolivian Plateau for a mean January, Boundary-Layer Meteorology, 46: 13-33.
Raymond, D.J. and M.H. Wilkening 1980. Mountain induced convection under fair weather conditions, Journal of Atmospheric Sciences, 37: 2693-2706.

80 Draft: Chap. 4 Mt. Climate by A. Bach for Mountains and People
Rebetez, M. 1995. Seasonal relationships between temperature, precipitation and snow cover in a mountainous region, Theoretical and Applied Climatology, 54: 99-106.
Rebetez, M., R. Lugon, and P.A. Baeriswyl 1997. Climate change and debris flows in high mountain regions: the case study of the Ritigraben torrent (Swiss Alps), Climatic Change, 36: 371-389.
Reid, S.J. 1996. Pressure gradients and winds in Cook Strait, Weather and Forecasting, 11: 476-488.
Reid, S.J. 1997. Modelling of channelled winds in the high wind areas of New Zealand, Weather and Climate, 17: 3-22.
Reid S.J. and R. Turner 1997. Wind storms, Tephra, 16: 24-32.
Reinking, R.F., J.B. Snider, J.L. Coen 2000. Influences of storm-embedded orographic gravity waves on cloud liquid water and precipitation. Journal of Applied Meteorology, 39: 733–759. Reiter, E.R. and M.Tang 1984. Plateau effects on diurnal circulation patterns, Monthly Weather Review, 112: 638-651.
Revell, C.G. 1984. Annual and Diurnal Variation of Thunderstorms in New Zealand and Outlying Islands, Miscellaneous Publication 170, Wellington: New Zealand Meteorological Service.
Reynolds, D.W. 1996. The effects of mountain lee waves on the transport of liquid propane-generated ice crystals. Journal of Applied Meteorology,. 35: 1435–1456.
Richard, E., P. Mascart, and E.C. Nickerson 1989. On the role of surface friction in downslope windstorms, Journal of Applied Meteorology, 28: 241-251.
Richner, H. and P.D. Phillips 1984. A comparison of temperature from mountaintops and the free atmosphere- their diurnal variation and mean difference, Monthly Weather Review, 112: 1328-1340.
Ring, S.L. 1991. Snow-drift modeling and control, In: A.H. Perry and L.J. Symons (eds.) Highway Meteorology, London: E & FN Spon., pp. 77-90.
Roberts, M.R. and F.S. Gilliam 1995. Patterns and mechanisms of plant diversity in forested ecosystems: Implications for forest management, Ecological Applications, 5: 969-977.
Robinson, P.J. 1997. Climate change and hydropower generation, International Journal of Climatology, 17: 983-996.
Robinson, D.A. and A. Frei 2000. Seasonal variability of Northern Hemisphere snow extent using visible satellite data, The Professional Geographer, 52: 307-315.

81 Draft: Chap. 4 Mt. Climate by A. Bach for Mountains and People
Rochefort, R.M., R.L. Little, A. Woodward, and D.L. Peterson 1994. Changes in subalpine tree distribution in western North America: A review of climate and other factors, The Holocene, 4: 89-100.
Romero, R., S. Alonso, E.C. Nickerson, C. Ramis 1995. The influence of vegetation on the development and structure of mountain waves. Journal of Applied Meteorology,. 34: 2230–2242.
Rowe, H.D., Dunbar, R.B., Mucciarone, D.A., Seltzer, G.O., Baker, P.A., and S. Fritz 2002. Insolation, moisture balance and climate change on the South American Altiplano since the last glacial maximum, Climatic Change, 52: 175-199.
Runeckles, V.C. and S.V. Krupa 1994. The impact of UV-B Radiation and ozone on terrestrial vegetation, Environmental. Pollution, 83: 191-213.
Ryan, B.C. 1977. A mathematical model for diagnosis and prediction of surface winds in mountainous terrain, Journal of Applied Meteorology, 16: 571-584
Sassen, K. and H. Zhao 1993. Supercooled liquid water clouds in Utah winter mountain storms: cloud-seeding implications of a remote-sensing dataset, Journal of Applied Meteorology, 32: 1548–1558.
Saunders, I.R. and W.G. Bailey 1994. Radiation and energy budgets of alpine tundra environments of North America, Progress in Physical Geography, 18: 517-538.
Schaaf, C.L.B., J. Wurman, and R.M. Banta 1988. Thunderstorm-producing terrain features, Bulletin of the American Meteorological Society, 69: 272-277.
Schermerhorn, V.P. 1967. Relations between topography and annual precipitation in Western Oregon and Washington. Water Resources Research 3: 707-711.
Schmidli, J., C, Schmutz, C, Frei, H, Wanner, C, Schär 2002. Mesoscale precipitation variability in the region of the European Alps during the 20th century, International Journal of Climatology, 22: 1049-1074.
Schroeder, S.R. and J.P. McGuirk 1998. Widespread tropical atmospehric drying from 1979 ti 1995m Geophysical Research Letters, 25: 1301-1304.
Schultz, D. M., W. J. Steenburgh, R J. Trapp, J. Horel, D.E. Kingsmill, L.B. Dunn, W.D. Rust, L. Cheng, A. Bansemer, J. Cox, J. Daugherty, D.P. Jorgensen, J. Meitín, L. Showell, B.F. Smull, K. Tarp, M. Trainor 2002. Understanding Utah Winter storms: The Intermountain Precipitation Experiment. Bulletin of the American Meteorological Society, 83: 189–210.
Sevruk, B. 1986. Correction of precipitation measurements, In: B. Sevruk (ed.) Proceedings, International Workshop on the Correction of Precipitation Measurements, Instruments and
82 Draft: Chap. 4 Mt. Climate by A. Bach for Mountains and People
Observing Methods Report no. 24 (WMO/TD no. 104), pp. 13-23, Geneva: World Meteorological Organization.
Sevruk, B. 1989. Precipitation Measurement, WMO/IAHS/ETH Workshop on Precipitation Measurement, Zurich, Swiss Federal Institute of Technology.
Shrestha, A.B., Ca.P. Wake, P.A. Mayewski, and J.E. Dibb 1999. Maximum temperature trends in the Himalaya and its vicinity: An analysis based on temperature records from Nepal for the period 1971–94. Journal of Climate, 12: 2775–2786.
Sinclair, M. R. 1993. A diagnostic study of the extratropical precipitation resulting from Tropical Cyclone Bola, Monthly Weather Review, 121: 2690-2707.
Sinclair, M. R. 1994. A diagnostic model for estimating orographic precipitation. Journal of Applied Meteorology, 33: 1163–1175.
Sinclair, M.R., D.S. Wratt, R.D. Henderson, and W.R. Gray 1997. Factors affecting the distribution and spillover of precipitation in the Southern Alps of New Zealand—A Case Study. Journal of Applied Meteorology, 36: 428–442.
Smith, A.A. 1982. The Mount Washington Observatory- 50 years old, Bulletin of the American Meteorological Society, 63: 986-994.
Smith, R.B. 1979. The influence of mountains on the atmosphere, Advances in Geophysics, 21: 87-230.Smith, R.B. 1987. Aerial observations of the Yugoslavian bora, Journal of Atmospheric Sciences, 44: 269-297.
Stull, R.B. 1988. An Introduction to Boundary Layer Meteorology, Dordrecht: Kluwer Academic Publishers.
Sturman, A.P. 1987. Thermal influences on airflow in mountainous terrain, Progress in Physical Geography, 11: 183-206.
Sturman., A.P. and N.J. Tapper 1996. The Weather and Climate of Australia and New Zealand, Melbourne: Oxford University Press.Susong, D., D. Marks, and D. Garen 1999. Methods for developing time-series climate surfaces to drive topographically distributed energy- and water-balance models, Hydrological Processes, 13: 2003-2021.
Tabler, R.D. 1975. Predicting profiles of snowdrifts in topographic catchmets, Proceedings of the 43rd Western Snow Conference, pp. 87-97.
Tabony, R.C. 1985. The variation of surface temperature with altitude, Meteorological Magazine, 114: 37-48.
83 Draft: Chap. 4 Mt. Climate by A. Bach for Mountains and People
Tampieri, F. 1987. Separation features of boundary-layer flow over valleys, Boundary-Layer Meteorology, 40: 295-307.
Tang, M. and E.R. Reiter 1984. Plateau monsoons of the northern hemisphere: a comparison between North America and Tibet, Monthly Weather Review, 112: 617-637.
Tappenier, U. and A. Cernusca 1989. Canopy structure and light climate of different alpine plant communities, Theoretical and Applied Climatology, 40: 81-92.
Taylor, P.A., P.J. Mason, and E.F. Bradley 1987. Boundary-layer flow over low hills, Boundary-Layer Meteorology, 37: 107-132.
Taylor, P.A., R.I. Sykes and P.J. Mason 1989. On the parameterization of drag over small-scale topography in neutrally-stratified boundary layer flow, Boundary-Layer Meteorology, 48: 409-422.
Tesche, T.W. 1988. Numerical simulation of snow transport, deposition and redistribution, Proceedings of the Western Snow Conference 56th Annual Meeting, pp. 93-103.
Thompson, B.W. 1986. Small-scale katabatics and cold hollows, Weather,41: 146-153.Thompson, C.S., M.R. Sinclair and W.R. Gray 1997. Estimating long-term annual precipitation in a mountainous region from a diagnostic model, International Journal of Climatology, 17: 997-1007.
Thompson, W.F. 1990. Climate related landscapes in world mountains: Criteria and map, Zeitschrit fur Geomorphologie, Supplement, 78: 92pp.
Trenberth, K.E. 1999. Conceptual framework for changes of extremes of the hydrological cycle with climate change. Climatic Change, 42: 327-339.
Tucker, D.F. and N.A. Crook 1999. The generation of a mesoscale convective system from mountain convection. Monthly Weather Review, 127: 1259–1273.
Turner, H. 1980. Types of microclimate at high elevations, In: U. Benecke and M.R. Davis (eds.), Mountain Environments and Subalpine Tree Growth, Wellington Forest Research Institute, New Zealand Forest Service, pp. 21-26.
Uddstrom, M.J., J.A. McGregor, W.R. Gray, and J.W. Kidson 2001. A high-resolution analysis of cloud amount and type over complex topography. Journal of Applied Meteorology, 40: 16–33.
Vermeulen A.T., G.D. Wyers, F.G. Romer, N.F.M. van Leewen, N.F.M. Draaijers, and J.W. Erimim 1997. Fog deposition on a coniferous forest in the Netherlands, Atmospheric Environment, 31: 388-396.

84 Draft: Chap. 4 Mt. Climate by A. Bach for Mountains and People
Valko, P. 1980. Some empirical properties of solar radiation and related parameters, In: An Introduction to Meteorological Measurements and Data Handling for Solar Energy Applications, Chapter 8, DOE/ER-0084, U.S. Department of Energy.
Vergeiner, I. and E. Dreiseitl 1987. Valley winds and slope winds- observations and elementary thoughts, Meteorology and Atmospheric Physics, 36: 264-286.
Vosper, S.B. and D.J. Parker 2002. Some perspectives on wave clouds, Weather, 57: 3-7.
Walsh, K. 1994. On the influence of the Andes on the general circulation of the Southern Hemisphere. Journal of Climate, 7: 1019–1025.
Wang, G., Hobbs, N.T., Singer, F.J., Ojima, D.S., and B.C. Lubow 2002. Impacts of climate changes on elk population dynamics in Rocky Mountain National Park, Colorado, U.S.A., Climatic Change, 54: 205-223.
Wearne, L.J. and J. W. Morgan 2001. Recent forest encroachment into subalpine grasslands near Mount Hotham, Victoria, Australia Arctic, Antarctic, and Alpine Research, 33: 369-377.
Whalsley, J.L. P.A. Taylor, and J.R. Salmon 1989. Simple guidelines for estimatingwind speed variations due to small-scale topographic features- an update, Climatological Bulletin, 23: 3-14.
Whiteman, C.D. and T.B. KcKee 1978. Air pollution implications of inversion descent in mountain valleys, Atmospheric Environment, 2: 2151-2158.
Williams, S.H. and J.A. Lee 1995. Aeolian saltation transport rate: An example of the effect of sediment supply, Journal of Arid Environments, 30: 153-160
Willis, I. and J.M. Bonvin 1995. Climate change in mountain envirionments: Hydrological and resource implicaitons, Geography, 247-261.
Whipperman, F. 1984. Airflow over and in broad valleys: channeling and counter-current, Contributions to Atmospheric Physics, 57: 184-195.
Whiteman, C.D. 1990. Observations of thermally developed wind systems in mountainous terrain, In: W. Blumen (ed.) Atmospheric Processes over Complex Terrain, Meteorological Monograph 23(45), pp. 5-42, Boston: American Meteorological Society.
Woodbridge, G.L. D.G. Fox and R.W. Furman 1987. Airflow patterns over and around a large three-dimensional hill, Meteorology and Atmospheric Physics, 37: 259-270.
Wratt, D.S., R.N. Ridley, M.R. Sinclair, H. Larsen, S.M. Thompson, R. Henderson, G.L. Austin, S.G. Bradley, A. Auer, A.P. Sturman, I.F. Owens, B.B. Fitzharris, B.F. Ryan, and J.F. Gayet 1996. The New Zealand Southern Alps experiment, Bulletin of the American Meteorological Society, 77: 683-692.

85 Draft: Chap. 4 Mt. Climate by A. Bach for Mountains and People
Yoshino, M.M. 1973. Studies on wind-shaped trees: their classification, distribution nad significance as a climatic indicator, Climatological Notes, 12: 1-52.
Yoshino, M.M. 1984. Thermal belt and cold air drainage on the mountain slope and cold air lake in the basin at quiet, clear night, Geojournal, 8: 235-250.
Figure list
Fig. 4.1. Length of day light received at each latitude during summer (left) and winter (right) solstice in the northern hemisphere. (After Rumney 1968; p. 90)
Fig. 4.2. The general distribution of global atmospheric pressure systems and general circulation of the atmosphere. These winds dictate global climatic patterns associated with latitude. The general latitudinal climatic zones are shown along the right side of the diagram.
Fig. 4.3. Generalized profile showing the decrease of atmospheric pressure with altitude. (Adapted from several sources)
Fig. 4.4 The influence of the Olympic Mountains on the wind field and precipitation. The arrows are flow lines indicating wind direction. Distance between the flow lines indicates relative speed, the closer they are to one another the faster the wind in that region. Notice that the flow lines are evenly spaced over the Pacific Ocean. As they are deflected through the Strait of Juan de Fuca, the wind speed increases. Also notice that winds are funneled up the western valleys of the Olympics, concentrating moist air and increasing precipitation at the Hoh Rain Forest (3800 mm), while Sequim only receives 430 mm in the rain shadow. (Author)
Fig. 4.5. Spectral distribution of direct solar radiation at the top of the atmosphere and at sea level. Calculations are for clear skies with the sun directly overhead. Also shown is the spectral distribution of cloud light and sky light. The graph is plotted on a wave number scale in cm-1 that is the reciprocal of the wavelength and is directly proportional to the frequency of light, to allow display of the full spectrum (a wavelength plot has difficulty including the visible and infrared together). The total area under the upper curve is the solar constant, 2.0 cal. cm-2 min-1 (1365 W/m2). (After Gates and Janke 1966, p. 42)
Fig. 4.6. Spectral transmissivity of the atmosphere at 4,200 m (14,000 ft.) and at sea level for latitude 40˚N at summer and winter solstice. The attenuation shown here is for clear skies and is due entirely to ozone absorption. When the effects of dust, water vapor, and other impurities are included, the difference in transmissions between high and low elevations becomes considerably greater. (After Gates and Janke 1966, p. 45)

86 Draft: Chap. 4 Mt. Climate by A. Bach for Mountains and People
Fig. 4.7. Direct solar radiation (Cal. cm-2 hr-1) received on different slopes during clear weather at 50˚ N. lat. Three slopes are shown: north, south, and east-facing (west would be a mirror image of east), for summer and winter solstice and equinox (vernal is a mirror image of autumnal). The lefthand side of each diagram shows the distribution of solar energy on a horizontal surface (0˚ gradient) and is therefore identical for each set of 3 in the same column. The righthand side of each diagram represents a vertical wall (90˚ gradient). The top of each diagram shows sunrise and the bottom shows sunset. As can be seen, the north- and south-facing slopes experience a symmetrical distribution of energy, while the east and west reveal an asymmetrical distribution. Thus, on the east-facing slope during summer solstice the sun begins shining on a vertical cliff at about 4:00 a.m and highest intensity occurs At 8:00 a.m. By noon the cliff passes into shadow. The opposite would hold true for a west-facing wall: it would begin receiving the direct rays of the sun immediately past noon.The bottom row of diagrams illustrates a south-facing slope. During equinox days and nights are equal, so the distribution of energy is equal. During winter solstice the sun strikes south-facing slopes of all gradients at the same time (sunrise), but during summer the sun rises farther to the northeast, so some time elapses before it can shine on a south-facing slope. This difference in time increases with steeper slopes: for example, a 30˚ south-facing slope would receive the sun at about 5:00 a.m. and would pass into shadow at about 6:30 p.m., while a 60˚ south-facing slope would receive the sun at 6:30 a.m. (11/2 hrs. later) and the sun would set at 5:30 p.m. (1 hr. earlier). On a north-facing slope (top row of diagrams) during summer, slopes up to 60˚ receive the sun at the same time, but if the slope is greater than 60% the sun cannot shine on it at noon; hence the "neck" cut out of the righthand margin. Steep north-facing slopes at this latitude would only receive the sun early in the morning and late in the evening. During the winter solstice only north-facing slopes with gradients of less than 15˚ would receive any sun at all. (After Geiger 1965, p.374)
Fig. 4.8. Topo- and micro-climatic influences of slope and aspect on vegetation types. The northern hemisphere example is given where more solar receipt on south-facing slopes warms temperatures to where forest is replaced by grass. North-facing slopes are shaded and cooler with more soil moisture retention and thicker forests. On a larger scale, forests move down valleys following moisture and cooler temperatures created by cold air drainage. (After Kruckeberg 1991)
Fig. 4.9. Settlement in relation to noonday shadow areas during winter in the upper Rhône Valley, Switzerland. (From Garnett 1935, p. 602)
Fig. 4.10. View of an east-west valley near Davos, Switzerland, showing settlement and clearing on the sunny side (south-facing), while the shady side (north-facing) is left in forest. (Larry Price)
Fig. 4.11. Mean annual temperature with altitude in the southern Appalachian Mountains. Dots represent U.S. Weather Bureau First Order Stations in Tennessee and North Carolina. Temperatures were calculated for period 1921-1950. (Adapted from Dickson 1959, p. 353)
Fig. 4.12. Distribution of mean annual temperature (˚C) in a transect across the Mexican Meseta from Mazatlan to Veracruz. The temperature over the plateau at 3,000 m (10,000 ft.) is about

87 Draft: Chap. 4 Mt. Climate by A. Bach for Mountains and People
3˚C (5.4˚F) higher than over the coastal stations, owing to greater heating of the elevated land mass. (Adapted from Hastenrath 1968, p.123)
Fig. 4.13. Rice terraces on steep slopes in the Himalayas, near the upper limit for rice cultivation. Most are dry terraces; those in lower left are fed by a spring in the slope and are used for growing wet rice. A village is situated among the dry terraces in the upper part of the slope. The somewhat muted terraces to the right are apparently former terraces that have been abandoned. (Harold Uhlig, University of Giessen)
Fig. 4.14. Cross-section of an enclosed basin, Gstettneralm, in the Austrian Alps, showing a temperature inversion in early spring. Elevation of valley bottom is 1,270 m (4,165 ft.). Note increase in temperature (˚C) with elevation above valley floor, especially the rapid rise directly above the pass. This results from the colder air flowing into a lower valley at this point. (After Schmidt 1934, p. 347)
Fig. 4.15. Diurnal temperature range at different elevations on Mount Fuji, Japan. The difference between high and low altitudes is much more exaggerated in winter (left) than in summer (right). (After Yoshino 1975, p. 193)
Fig. 4.16. Vertical profile of soil and air temperatures (˚C) under clear skies on a well-drained alpine tundra surface at 3,580 m (11,740 ft.) in the White Mountains of California. Note the tremendous gradient occurring immediately above and below the soil surface. The slightly higher temperatures at a depth of 25-30 cm (10-12 in.) are a result of the previous day's heating and are out of phase with present surface conditions. (After Terjung et al. 1969a, p. 256)
Fig. 4.17. Daily and seasonal temperature distribution in a subarctic continental (a) and alpine tropical (b) climate. The opposite orientation of the isotherms reflects the fundamental differences in daily and seasonal temperature ranges in the two contrasting environments. The subarctic continental station (a) experiences a small daily temperature range (read vertically) but a large annual range (read horizontally). Conversely, the high altitude tropical station (b) experiences a much greater daily temperature range than the annual range. (Adapted from Troll 1958a, p. 11)
Fig. 4.18. Freeze-thaw regimes at different latitudes and altitudes. Frost-free days indicate the number of days when freezing did not occur, ice days are those when the temperature was continually below freezing, and frost alternation days are the days when both freezing and thawing occurred. Note that the greatest number of these occur in tropical mountains. (Adapted from Troll 1958a, pp. 12-13)
Fig. 4.19. Average annual absolute humidity (mass of water vapor per unit volume, g/m3) with elevation on the humid eastern and arid western side of the tropical Andes. Horizontal lines provide a measure of the annual range of the monthly means of absolute humidity. The extremes are largely a reflection of the wet and dry seasons. Profiles are calculated as a function of height, according to starting values at Lima and Amazonas, based on empirical formulas obtained from observations in the Alps. The tropical-station data indicate that the decrease in vapor density with height is less pronounced than in middle latitudes. (Adapted from Prohaska 1970, p. 3)
88 Draft: Chap. 4 Mt. Climate by A. Bach for Mountains and People
Fig. 4.20. Mean annual evaporation from reservoirs at different elevations in the Sierra Nevada of central California. (After Longacre and Blaney 1962, p. 42)
Fig. 4.21. Diagrammatic representation of daily changes in relative humidity with altitude on northand south-facing forested slopes during August in the mountains of northern Idaho. Dotted line represents the altitude where minimum relative humidities occur at different times during the twenty-four-hour cycle. Note that both the highest and lowest relative humidities occur in the valley bottoms, where the greatest temperature extremes are also found. (Adapted from Hayes 1941, p. 17)
Fig. 4.22. Annual average precipitation.
Fig. 4.23. Cross-section of atmosphere above the Santa Catalina Mountains near Tuscon, Arizona, on a summer day in 1965. Measurements were made by flying transects across the range in an instrument-equipped airplane. Profiles show changes in mixing ratio (a measure of humidity) and temperature (˚K) at the different altitudes before sunrise (6:15 AM) and after sunrise (10:41 AM). Note that considerable warming, increased humidity, and increased instability of the air, all develop after sunrise, especially on the south side of the range. This leads to convectional lifting, cloud formation, and localized precipitation over the mountains. (After Braham and Draginis 1960, pp. 2-3)
Fig. 4.24. Contribution of fog drip to precipitation during twenty-eight-week study period (October 1972 to April 1973) on the forested northeast slopes of Mauna Loa, Hawai’i. Numbers show precipitation totals in millimeters. Those in parentheses indicate fog drip. Percentages are the relative amounts contributed to the total by fog drip at each station. (After Juvik and Perreira 1974, p. 24)
Fig. 4.25. Relationship between the number of foggy or cloudy days and elevation in the mountains of Japan. (Dots represent data from weather stations at various altitudes.) The elevation of greatest cloudiness is 1,500-2000 m (5,000-6,000 ft.), where clouds develop almost daily, especially in August. This is caused by the inflow of cool marine air at these levels. The actual height of maximum cloudiness varies from one season to another and from one mountain range to another. (After Yoshino 1975, p. 205)
Fig. 4.26. Rime accumulation on newly constructed Palmer ski lift at 2,380 m (7,800 ft.) on the south side of Mount Hood, Oregon. The heavy rime resulted in discontinuation of lift construction until the following summer. (Bob McGown, December 1977)
Fig. 4.27. The effects of a precipitation gauge on surface wind-flow. In the first case (a) the wind may tend to speed up next to the gauge since it must travel farther to get around the obstacle. The lower illustrations (b and c) show that turbulence caused by surface roughness may result in upflow or downflow at the gauge orifice, depending on its location with respect to surrounding topography and wind direction. The lee-eddy created in each situation is a location of snow and dust deposition due to slow (reversed) wind speeds. (Adapted from Peck 1972b, p. 8)
89 Draft: Chap. 4 Mt. Climate by A. Bach for Mountains and People
Fig. 4.28. Generalized profiles of mean annual precipitation (cm) vs. elevation (m) in the tropics. The shaded area shows the zone of maximum precipitation. (Adapted from Lauer 1975)
Fig. 4.29. The "alpine desert" at 4,400 m (14,500 ft.) on Mount Kilimanjaro. View is toward the east from the saddle between Kibo and Mawenzi (pictured). (O. Hedberg, 1948, University of Uppsala)
Fig. 4.30. Influence of snowpack and glacier cover on runoff is illustrated by data from side-by-side basins of the same size, but different elevations. Water year (Oct. - Sept.) hydrographs showing mean (1938-1999) daily discharge for high elevation and low elevation subbasins of the Nooksack River, Washington. The high elevation, North Fork has a mean elevation of 1311 m, 6% glacier cover, and a mean annual discharge of 22.0 m3/s. The lower elevation, Soutth Fork has a mean elevation of 914 m, no glacier cover, and a mean annual discharge of 20.8 m3/s. (Daily discharge data from U.S.G.S, figure by author)
Fig. 4.31. Wind velocity with height above a tundra surface. Note how wind speed increases with distance above the ground, one reason why alpine plants grow so close to the ground. (From Warren-Wilson 1959, p. 416)
Fig. 4.32. Wind behavior in relation to microtopography in the Cairngorm Mountains, Scotland. The stippled area represents vegetation. Vertical scale is roughly equivalent to the horizontal. (a) Air movement across a grassy tussock. (b) The movement of air over a rock with a depression occupied by vegetation. (c) A wind-eroded bank. Note the eddies that develop to the lee of small obstacles: wind speed is greatly reduced in these areas and vegetation is better developed. (Adapted from Warren-Wilson 1959, pp. 417-18)
Fig. 4.33. Schematic representation of slope winds (open arrows) and mountain and valley winds (black arrows). (a) and (b) Day conditions. (c) and (d) Night conditions. (After Defant 1951, p. 665, and Hindman 1973, p. 199)
Fig. 4.34. Valley fog in the Coast Range of northern California beginning to dissipate as slope winds strengthen and the return flow develops in the center of the valley. Top photo taken at 9:58 A.M.; bottom photo taken at 10:07 A.m. (Edward E. Hindman, U. S. Navy)
Fig. 4.35. Graphic representation of slope and valley winds. The view on the left is looking upvalley at midday. Slope winds are rising along the slopes, while the valley wind and anti-wind are moving opposite each other, up and down the valley. The illustration on right provides a vertical cross-section of the same situation, viewed from the side. The valley wind and anti-wind essentially establish a small convection system. The regional gradient wind is shown blowing above the mountains. If the regional wind is very strong, of course, it may override and prevent development of the slope and valley winds. (Adapted from Buettner and Thyer 1965, p. 144)
Fig. 4.36. Idealized cross-section of wind movement in a valley with a glacier near its head. Glacier wind is shown moving downslope in a thin zone immediately next to the ice. Valley

90 Draft: Chap. 4 Mt. Climate by A. Bach for Mountains and People
wind blows upslope and rides over the glacier wind. At elevations above the mountains the regional gradient-wind may be blowing in still another direction. (After Geiger 1965, p. 414)
Fig. 4.37. Diagrammatic representation of typical late-afternoon weather conditions along the western slopes of the Colombian Andes, 5˚N Lat. The Andes provide a barrier to the prevailing easterly wind flow, allowing a thin layer of cool, moist Pacific air to move inland. This causes much cooler conditions and also transports moisture for the formation of clouds as it moves over the ridges. In the Cauca Valley, thunderstorms often result from air flowing down the slopes of the western Andes with enough velocity so that it is forced up the adjoining slopes of the central Andes. This produces a "hydraulic jump" that provides the impetus for cloud formation and thunderstorm activity. (After Lopez and Howell 1967, p. 31)
Fig. 4.38. "Waiting for a Chinook," by Charles M. Russell. This small watercolor was sent in a letter to Russell's employers in 1886 to announce the emaciated condition of their cattle. (Courtesy of Montana Stockgrowers Association)
Fig. 4.39. Diagrammatic representation of classical development of a foehn (chinook) wind. Temperatures at different locations are based on the assumption that air at the base of mountain on windward side is 10˚C (50˚F). By the time the air has undergone the various thermodynamic processes indicated in its journey across the mountains it reaches the base on the leeward side at 18.1˚C (64.6˚F). (Author)
Fig. 4.40. Lee waves resulting from air passing across a mountain barrier. Lee-wave clouds often form at the ridge of the waves. Rotors may develop nearer the ground in the immediate lee of the mountain. (Adapted from Scorer 1967, p. 93)
Fig. 4.41. Lee-wave clouds forming over the Front Range of the Colorado Rockies. View is toward the west, so wind is southwesterly (from left to right). (Robert Bumpas, National Center for Atmospheric Research)
Fig. 4.41. Multi-storied lee-wave clouds forming to the lee of the Front Range of the Colorado Rockies. Formation of lenticular clouds above one another in this fashion indicates different wave amplitudes and increasing instability of the air. (Robert Bumpas, National Center for Atmospheric Research)
Fig. 4.43. Satellite photo of the northwestern United States, showing extensive lee-wave cloud development from the lee of the Cascades in Washington and Oregon through the intermountain west of Idaho and Utah. Photo was taken 8 December 1977 from a weather satellite at an attitude of 4,320 km (2,700 mi.) at 40˚N. lat. and 140˚W long. Resolution, or size of features which may be identified, is 1.6 km (1 mi.). (National Oceanic and Atmospheric Administration)
Fig. 4.44. Photograph of a rotor along the east face of the Sierra Nevada, California. This powerful roll-like circulation of the air is operating beneath the flat, thin clouds. Dust is being lifted from the floor of Owens Valley to a height of 4,800 m (16,000 ft.). (Robert Symons, courtesy of R. S. Scorer)

91 Draft: Chap. 4 Mt. Climate by A. Bach for Mountains and People
Fig. 4.45. Air current over mountains, showing superposition of lee-wave trains. The mountain ridge (indicated by dashed line of mountain form) produces a certain wave pattern (dashed streamline) and the other mountain (solid line) produces a different wave pattern (continuous streamline). Together the mountains have the effect of creating an obstacle (indicated by the continuous line). In the upper diagram the wavelength is such that the wave trains cancel out; in the lower diagram the amplitude is doubled. Since the wavelength is determined by the flow of air across the ridge, the same air-stream could produce either large-amplitude lee waves or none at all, depending on its direction. (After Scorer 1967, p. 76)
Table 4.1. Average density of suspended particulate matter in the atmosphere with changing elevation (Landsberg 1962, p. 114).
Table 4.2. Average water-vapor content of air with elevation in the middle latitudes (Landsberg 1962, p. 110).
Table 4.3. Average daily global radiation totals (cal. cm-2 d-1) received on a horizontal surface at different elevations in the Austrian Alps. Data include diffuse and reflected energy as well as direct solar radiation (Geiger 1965, p. 444).
Table 4.4.Temperature conditions with elevation in the eastern Alps (after Geiger 1965, p. 444).
Table 4.5.Accumulation of rime deposits near Haldde Observatory, Norway. The larger amounts at Talviktoppen and Store Haldde are due to higher wind velocity and cloud frequency at these elevations (Kikler 1937, in Landsberg 1962, p. 186).
Table 4.6.Average annual precipitation at four ridge sites in a transect up the FrontRange of the Colorado Rockies during 1965-1970 (Barry 1973, p. 96).
Table 4.7. Mean monthly wind speeds during winter at selected mountain weather-stations, in order of decreasing velocity. Readings were taken above tree-line or in treeless areas but anemometers were located at various heights above the ground (after Judson 1965, p. 13).

92 Draft: Chap. 4 Mt. Climate by A. Bach for Mountains and People
Table 4.4.Mean Air Temperature Annual Number of
(˚C) Frost Continuous
Elevation Annual Frost-Free AlternationFrost
January July YearRange Days Days Days200 - 1.4 19.5 9.0 20.9 272 67 26400 - 2.5 18.3 8.0 20.8 267 97 1600 - 3.5 17.1 7.1 20.6 250 78 37Soo - 3.9 16.0 6.4 19.9 234 91 401,000 - 3.9 14.8 5.7 18.7 226 86 531,200 - 3.9 13.6 4.9 17.5 218 84 631,400 - 4.1 12.4 4.0 16.5 211 81 731,600 - 4.9 11.2 2.8 16.1 203 78 841,800 - 6.1 9.9 1.6 16.0 190 76 9921000 - 7.1 8.7 0.4 15.8 178 73 1142,200 - 8.2 7.2 -0.8 15.4 163 71 1312,400 - 9.2 5.9 -2.0 15.1 146 68 1512,600 -10.3 4.6 -3.3 14.9 125 66 1742,8W -11.3 3.2 -4.5 14.5 101 64 2003,000 -12.4 1.8 -5.7 14.2 71 62 232
Table 4.7Elevation Monthly Wind Speed (mph)
Location Nov. Dec. Jan. Feb. Mar.Apr.
Mount Fuiiyama, Japan 3,776 42 42 47 37 4334
Mount Washington, N.H. 1,909 25 36 39 49 4136
Jungfraujoch, Switzerland 3,575 27 29 25 24 2625
Niwot Ridge, Colo.3,749 21 25 26 24 ZZ 21Pic du Midi, France 2,860 15 19 20 17 20
17Sonnblkk, Austria 3,106 22 16 is is is 15Berthoud Pass, Colo. 3,621 is 15 17 17 16
17Mauna Loa, Hawai’i 3,399 is 12 19 15 13
10

93 Draft: Chap. 4 Mt. Climate by A. Bach for Mountains and People