mountain bicycle acceleration and braking factors · 2006-06-19 · intricate suspension components...
TRANSCRIPT
Mountain Bicycle Acceleration and Braking Factors R.F. Beck Casteel, Beck & Associates, Inc. San Diego, California [email protected] Abstract Many traffic collisions involve mountain bicycles. An important aspect of reconstructing these collisions is the braking and acceleration capability of the bicycle. Currently there are few published sources of acceleration, braking, and rolling resistance data for mountain bicycles. This project sought to fill this void by executing 116 acceleration, braking, and rolling resistance tests. A Stalker ATS radar unit was used for determining bicycle speed at 0.03-second intervals and at 0.016 kilometer-per-hour increments. These tests were documented with video and still cameras, as well as a total station. The average acceleration, braking, and rolling resistance rates for each of the tests are provided below in tabular format. Based on the technical specifications of the Stalker ATS radar unit, these rates are accurate to ±0.01g. For the tests on dirt trails, five mountain bicycles and one cyclo-cross bicycle were ridden on -2% and -11% slopes. A total of nine acceleration and two rolling resistance tests were completed on the -2% slope, while thirty-four braking tests were made on both the -2% and the -11% slopes. For the testing on pavement, five mountain bicycles, one cyclo-cross bicycle, and one road bicycle were ridden on -1% and +1% slopes. A total of fourteen rolling resistance, fifteen acceleration, and forty-two brake tests were made on both asphalt and Portland concrete. The results of these tests demonstrate the superiority of the front brake over the rear brake. These tests also indicated only slightly better braking on pavement than on dirt. The stopping ability of the rear brake is about 76% of the front
brake, and is about 65% of the front and rear brakes combined. Acceleration rates were found to be about 25% higher on pavement than on dirt. Résumé Plusieurs accidents de la circulation impliquent des vélos de montagne. Un aspect important de la reconstitution de ces accidents est la capacité de freinage et d’accélération des vélos. Présentement, il y a peu d’ouvrages de publication portant sur l’accélération, le freinage et la résistance au roulement des vélos de montagne. Le présent projet vise à combler cette lacune par le biais de 116 essais d’accélération, de freinage et de résistance au roulement. Un radar Stalker ATS a été utilisé pour déterminer la vitesse des vélos à des intervalles de 0,03 seconde avec une précision de 0,016 km/h (0.01 mph). On a documenté ces essais grâce à des caméras vidéo, à des appareil-photos et à une station totalisatrice. Les taux moyens d’accélération, de freinage et de résistance au roulement de chacun de ces essais sont fournis ci-dessous sous forme de tableau. Selon les exigences techniques du radar Stalker ATS, ces taux sont précis à ± 0,01 g. Pour les essais sur des pistes de terre battue, cinq vélos de montage et un vélo de cyclo-cross ont été utilisés sur des pentes de -2 % et de -11 %. Un total de neuf essais d’accélération et de deux essais de résistance au roulement ont été faits sur la pente de –2 %, alors que trente-quatre essais de freinage ont été effectués sur la pente de –2 % et sur la pente de –11 %. Pour les essais sur surface revêtue, cinq vélos de montagne, un vélo de cycle-cross et un vélo de ville ont été utilisés dans des pentes de –1 % et de +1 %. Un total de quatorze essais de résistance au roulement, de quinze essais d’accélération et de quarante-deux essais de freinage ont été effectués sur de l’asphalte et sur du ciment Portland. Les résultats de ces essais démontrent la supériorité des freins avant. Ces essais ont aussi démontré que le freinage sur une surface revêtue était seulement légèrement meilleur que sur la terre battue. La capacité de freinage des freins arrière se situe à environ 76 % de celle des
Proceedings of the Canadian Multidisciplinary Road Safety Conference XIV; June 27-30, 2004; Ottawa, Ontario Le compte rendu de la XIVe Conférence canadienne multidisciplinaire sur la sécurité routière; 27-30 juin 2004; Ottawa, Ontario
1
freins avant et à environ 65 % de celle des freins avant et arrière combinés. On a constaté que les taux d’accélération étaient environ 25 % supérieurs sur les surfaces revêtues. Introduction According to a National Highway Traffic Safety Administration study of traffic safety in 2001 (USDOT 20021), 728 bicyclists were killed in over 46,000 reported collisions in the United States. Eight times as many males were killed as females. The great majority of fatalities occurred as a result of bicyclist contact with the front-end of motorized vehicles. Fortunately, the annual number of fatalities and injuries has steadily declined over the past 30 years. During this same period of declining cyclist fatalities, the mountain bicycle has developed from the obscure downhill “clunker” into highly sophisticated machines, now often equipped with intricate suspension components and hydraulic disc brakes. The mountain bicycle is probably now the most popular single type of bicycle in the United States, accounting for about 57% of United States sales in 2001 (BPSA 20042). In this paper, the term “mountain bicycle” refers to a bicycle designed for off-road use, normally using tires that are wider than 38 millimeters, often with aggressive tread. Mountain bicycles also have relatively straight handlebars, unlike the drop bars found on road bicycles. Compared to road bicycles, mountain bicycles have higher bottom bracket shells, for better clearance over obstacles; this design element dates to the 1930s Schwinn Excelsior. Mountain bicycles also have slightly slacker head tube angles than road bicycles, which make them more stable over rough terrain. Road and mountain bicycle frame designs have steadily diverged as manufacturers have attempted to make mountain bicycles more durable for severe off-road use, while road bicycle development has been directed primarily at weight and aerodynamic
issues. Annual technological changes within the bicycle industry, especially for developments in suspension, make further definition of the term “mountain bicycle” a research project in its own right. Two important analytical components in collision reconstruction are acceleration and braking factors. Acceleration is the rate of change in velocity with respect to time, and can be positive or negative. This rate is divided into the gravitational constant of 9.807 meters per second2, resulting in an acceleration factor. In this paper, acceleration is a positive change in velocity with respect to time, while braking is a negative change in velocity with respect to time. The rates at which a vehicle can stop or accelerate are important for time-distance calculations. An understanding of bicycle braking rates is critical for evaluating collisions where the cyclist applied (or should have applied) brakes before impact. Understanding acceleration rates is also important for evaluating time-distance calculations when the bicyclist enters traffic from a stopped position. Although there currently is little published data on mountain bicycle acceleration and braking, United States federal regulations (16 C.F.R. Section 1512.5d3) require most bicycles to be capable of stopping within 4.6 meters at 24 kilometers per hour; for a rider weighing 68 kilograms, this equates to a braking factor of -0.50g. Given the increased popularity of mountain bicycles, it is necessary to continue to develop analytical tools for investigating and reconstructing mountain bicycle collisions. Even though these traffic safety statistics do not differentiate among bicycle types, a substantial number of mountain bicycles may be among those involved. Because of their durability, mountain bicycles are popular for use on roads. For a variety of reasons, the current knowledge base of collisions involving mountain bicycles is significantly less than that of road bicycles and motorcycles. Investigations and reconstructions of collisions involving mountain bicycles generally treat these vehicles in the same manner as road bicycles. To some extent this
Proceedings of the Canadian Multidisciplinary Road Safety Conference XIV; June 27-30, 2004; Ottawa, Ontario Le compte rendu de la XIVe Conférence canadienne multidisciplinaire sur la sécurité routière; 27-30 juin 2004; Ottawa, Ontario
2
treatment is warranted. Many mountain bicycle collisions with cars and other vehicles are similar to those involving road bicycles. However, the suspension and tire profile of the mountain bicycle are often substantially different from those of the road bicycle. The differences in handling characteristics between road and mountain bicycles are due mainly to the differences in suspension and tire profile. Because mountain bicycles handle differently than road bicycles, they also differ in acceleration and braking capabilities. Due to their lighter weight and narrower tires, road bicycles can be accelerated faster than mountain bicycles. However, the wider tires on mountain bicycles enable them to be stopped more quickly than road bicycles. A positive correlation is apparent between tire contact-patch size and stopping capability. Because of these differences between road and mountain bicycles, future research studies should focus on single-bicycle and bicycle-vehicle collisions involving both mountain and road bicycles. Rapid acceleration is an important skill in bicycling. A positive correlation exists between grade and acceleration skill. Acceleration skill is relatively unimportant in downhill riding, while the greatest level of acceleration skill is needed in uphill situations. Braking is also an important skill. A negative correlation exists between slope and braking skill, i.e., braking is relatively unimportant in uphill riding, while the greatest level of braking skill is needed in downhill situations. The importance of differentiating among the three types of braking (front, rear, and both) is that proper downhill braking technique is dependent upon which brakes the rider uses. As is the case with cars and motorcycles, weight will shift forward during bicycle braking, causing the front end to “dive” down, while the rear end will lift up slightly. The front tire will usually have a greater contact patch than the rear. Although several researchers have written about bicycle braking on roads (e.g., Forester4, Eubanks and Haight5), the current literature concerning
braking capabilities on dirt is rather limited. In addition, these published studies on braking are limited to road bicycles. Two of the few references to braking capabilities on dirt roads come from studies on motorized vehicles and trailers pulled by motorized vehicles (Proctor6 and Carr and Ross7, in Whitt and Wilson8), which provide a range of -0.30 to -0.40g for braking drag factors and a range of -0.14 to -0.30g for rolling resistance in loose sand. Although these studies are useful for understanding the difference in drag factors of loose sand and asphalt, trailers are not equivalent to mountain bicycles. By accounting for variability in tire type and inflation, another study determined a range for rolling resistance of -0.01 to -0.02g on pavement (Faria and Cavanagh 19789). Because bicycles have smaller contact-patches than motorcycles and cars, any reduction in contact at the rear tire will have a significant impact on the overall braking ability. Experienced riders realize that maintaining contact between the rear tire and the riding surface is especially difficult during descents on rough trails. Weight shift ensures that the rear tire cannot always maintain contact with the riding surface. Because the weight of the bicyclist usually shifts forward during downhill braking maneuvers, the front brake is far more efficient and effective than the rear. Eubanks and Haight5 found that the weight distribution on a bicycle during braking is 87.5% on the front wheel and 12.5% on the rear. A skilled rider learns to use enough front brake to reduce speed, without locking up the front wheel so quickly as to cause an unwanted launching over the handlebars; in cycling parlance this is known as an “endo”, end-over-end, or pitch-over. In an “endo” the bicycle rotates along the longitudinal axis at the front hub, with the rear wheel lifting up off the riding surface, rotating forward and over the front wheel, and usually ejecting the rider forward and downward. Forester4 found that a pitch-over requires an acceleration of about -0.67g. While relying on the front brake, skilled bicyclists also will slide rearwards off the saddle and position themselves just above the rear tire (Overend10). With the stomach slightly above the saddle, a
Proceedings of the Canadian Multidisciplinary Road Safety Conference XIV; June 27-30, 2004; Ottawa, Ontario Le compte rendu de la XIVe Conférence canadienne multidisciplinaire sur la sécurité routière; 27-30 juin 2004; Ottawa, Ontario
3
skilled rider now can extract greater breaking efficiency from the rear brake, and reduce the height of the center of mass. By shifting the center of mass downward and rearward, the rider will have greater overall braking ability, and less probability of an “endo.” The direct benefit of skilful braking is that downhill speeds can be safely increased. Because of the importance of proper downhill braking technique, this research project attempted to quantify the differences among the three basic techniques. The first, front brake only technique, involved the pulsating or intermittent locking up of the front wheel during braking. Rather than engage in complete lock up, a safer technique involves the rapid and repeated locking and unlocking the front wheel, especially over rough surfaces. By keeping the front wheel from locking up, the rider can maintain steering control. As with cars not equipped with anti-lock brakes (ABS), once the front wheels are locked up, the rider loses significant steering control. The second technique involves locking up the rear wheel, and counter-steering to maintain balance. From the start of brake application to final rest, the rear brake is actuated, causing the rear wheel to lock up. When the rear tire slides out to either side, the rider turns the handlebars in the same direction in an effort to maintain upright stability. The second technique differs from the first in the locking up of the braking wheel. And finally, the third technique, which uses both brakes together, but in the same fashion as they are used separately, is usually the most effective technique for reducing speed. The differences in these three techniques and their effectiveness on a variety of grades and surfaces are the main interest of this research project. Braking effectiveness is partly determined by the grade of the riding surface. In reconstructing collisions occurring on roads with steep grades, acceleration and braking rates are adjusted by simple methods (Casteel and Moss11). For example, a vehicle braking on an asphalt surface would have a drag factor in the range of -0.650 to -0.750g on
level ground. To adjust this range to account for a grade of -3.5%, subtract -0.035 (i.e., the grade divided by one hundred) from both the low- and high-end values. These adjustments reflect a drag factor range of -0.615 to -0.715g. The type of riding surface has an effect on acceleration and braking capabilities. On asphalt roadways that would normally have a drag factor of -0.70g between the roadway surface and a motor vehicle tire, Eubanks and Haight5 found that a bicycle tire has a drag factor ranging from -0.24 to -0.28g on the same surface, when both front and rear brakes are properly applied from a speed range of 16 to 40 kilometers per hour. Testing Procedures Two separate locations were used for testing acceleration and braking capabilities on both pavement and dirt. The two test locations were selected based on the good quality of the riding surfaces and the range of grades. The procedures for documenting these mountain bicycle tests focused on acquiring high quality information using a wide variety of equipment and riders. Location #1: Tests on Dirt The site for the tests on dirt was located in San Diego, California, at the west side of Mission Trails Regional Park, near the intersection of Colina Dorada and Calle De Vida (Figure 1). Because of its close proximity to urban life, this location is popular with hikers and bicyclists. Although the trails witness heavy use, most are hard-packed because of geological conditions. These tests occurred on two days. The first day was December 14th, 2002, from 9:00 AM to 12:30 PM. The weather conditions were dry and slightly overcast (Miramar Weather Station 21°/7° C, no precipitation). The second day was April 6th, 2003, from 9:30 AM to 10:00 AM. The weather conditions were dry and clear (Miramar Weather Station 18°/6° C, no precipitation).
Proceedings of the Canadian Multidisciplinary Road Safety Conference XIV; June 27-30, 2004; Ottawa, Ontario Le compte rendu de la XIVe Conférence canadienne multidisciplinaire sur la sécurité routière; 27-30 juin 2004; Ottawa, Ontario
4

Figure 1. Aerial photograph of testing areas. The basal geology and surface soil composition of a test area are two of the limiting factors in drag factor tests. The geology of the test areas consists of two deposits of Eocene origin: The Friars Formation of the La Jolla Group and The Stadium Conglomerate of the Poway Group (Kennedy and Peterson12). The Friars Formation is sandstone with layers of claystone. Lenses of smooth river-worn cobbles are common throughout the formation. The Stadium Conglomerate consists of river-worn cobbles embedded in dark yellowish-brown sandstone. Although boulders greater than 46 centimeters in diameter rarely occur, about 20 to 50% of the sandstone consists of cobbles. The surface of the two test areas has a mixture of loose sand, exposed sandstone, and smooth river-worn cobbles. In the 30-meter downhill section where the actual braking occurred, the slope ranged between -9.65 and -11.63%, with an average of -10.96% over the entire section (Figure 2). In the 30-meter flat section the slope ranged between -1.41 and -2.32%, with an average of -1.87% over the entire section (Figure 3). Despite the intermittent cobble outcrops in the test areas, the riders tended to brake in the smooth dirt portions of the trails. Location #2: Tests on Pavement The site for the tests on pavement was located in San Diego, California, south of the intersection of Rehco Road and Carroll Road. Rehco Road is
located in the Miramar area of San Diego. These tests occurred on March 29th, 2003, from 9:00 AM to 11:30 AM. The weather conditions were dry and clear (Montgomery Weather Station 26°/11° C, no precipitation). In the 30-meter pavement section where the actual tests occurred on Rehco Road, the slope ranged between -0.87 and -1.00%, with an average of -0.95% over the entire section. The asphalt roadway is comprised of slurry seal, and is bordered by Portland concrete gutters and sidewalks. The roadway is 13.34 meters wide, the gutters are 56 centimeters wide, and the sidewalks are 168 centimeters wide. The roadway has a crown of about 1.39%.
Figure 2. Diagram of Testing Area 1.
Figure 3. Diagram of Testing Area 2.
Proceedings of the Canadian Multidisciplinary Road Safety Conference XIV; June 27-30, 2004; Ottawa, Ontario Le compte rendu de la XIVe Conférence canadienne multidisciplinaire sur la sécurité routière; 27-30 juin 2004; Ottawa, Ontario
5
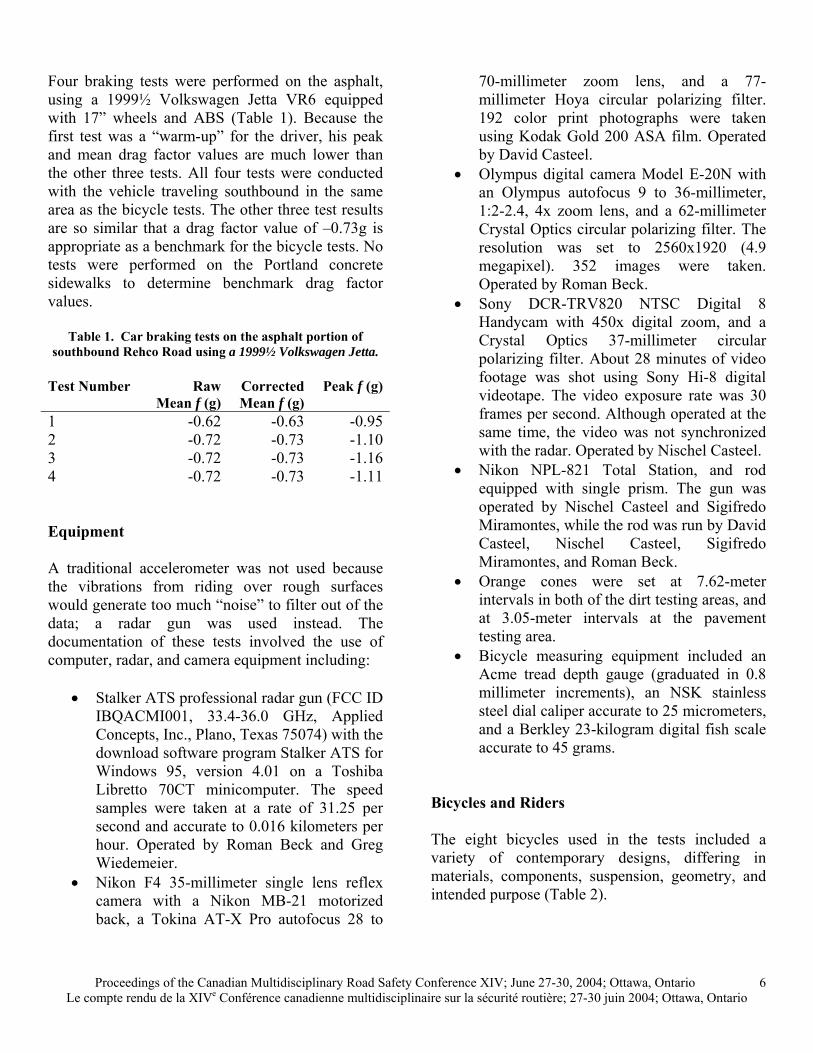
Four braking tests were performed on the asphalt, using a 1999½ Volkswagen Jetta VR6 equipped with 17” wheels and ABS (Table 1). Because the first test was a “warm-up” for the driver, his peak and mean drag factor values are much lower than the other three tests. All four tests were conducted with the vehicle traveling southbound in the same area as the bicycle tests. The other three test results are so similar that a drag factor value of –0.73g is appropriate as a benchmark for the bicycle tests. No tests were performed on the Portland concrete sidewalks to determine benchmark drag factor values.
Table 1. Car braking tests on the asphalt portion of southbound Rehco Road using a 1999½ Volkswagen Jetta.
Test Number Raw
Mean f (g) Corrected Mean f (g)
Peak f (g)
1 -0.62 -0.63 -0.952 -0.72 -0.73 -1.103 -0.72 -0.73 -1.164 -0.72 -0.73 -1.11 Equipment A traditional accelerometer was not used because the vibrations from riding over rough surfaces would generate too much “noise” to filter out of the data; a radar gun was used instead. The documentation of these tests involved the use of computer, radar, and camera equipment including:
• Stalker ATS professional radar gun (FCC ID IBQACMI001, 33.4-36.0 GHz, Applied Concepts, Inc., Plano, Texas 75074) with the download software program Stalker ATS for Windows 95, version 4.01 on a Toshiba Libretto 70CT minicomputer. The speed samples were taken at a rate of 31.25 per second and accurate to 0.016 kilometers per hour. Operated by Roman Beck and Greg Wiedemeier.
• Nikon F4 35-millimeter single lens reflex camera with a Nikon MB-21 motorized back, a Tokina AT-X Pro autofocus 28 to
70-millimeter zoom lens, and a 77-millimeter Hoya circular polarizing filter. 192 color print photographs were taken using Kodak Gold 200 ASA film. Operated by David Casteel.
• Olympus digital camera Model E-20N with an Olympus autofocus 9 to 36-millimeter, 1:2-2.4, 4x zoom lens, and a 62-millimeter Crystal Optics circular polarizing filter. The resolution was set to 2560x1920 (4.9 megapixel). 352 images were taken. Operated by Roman Beck.
• Sony DCR-TRV820 NTSC Digital 8 Handycam with 450x digital zoom, and a Crystal Optics 37-millimeter circular polarizing filter. About 28 minutes of video footage was shot using Sony Hi-8 digital videotape. The video exposure rate was 30 frames per second. Although operated at the same time, the video was not synchronized with the radar. Operated by Nischel Casteel.
• Nikon NPL-821 Total Station, and rod equipped with single prism. The gun was operated by Nischel Casteel and Sigifredo Miramontes, while the rod was run by David Casteel, Nischel Casteel, Sigifredo Miramontes, and Roman Beck.
• Orange cones were set at 7.62-meter intervals in both of the dirt testing areas, and at 3.05-meter intervals at the pavement testing area.
• Bicycle measuring equipment included an Acme tread depth gauge (graduated in 0.8 millimeter increments), an NSK stainless steel dial caliper accurate to 25 micrometers, and a Berkley 23-kilogram digital fish scale accurate to 45 grams.
Bicycles and Riders The eight bicycles used in the tests included a variety of contemporary designs, differing in materials, components, suspension, geometry, and intended purpose (Table 2).
Proceedings of the Canadian Multidisciplinary Road Safety Conference XIV; June 27-30, 2004; Ottawa, Ontario Le compte rendu de la XIVe Conférence canadienne multidisciplinaire sur la sécurité routière; 27-30 juin 2004; Ottawa, Ontario
6
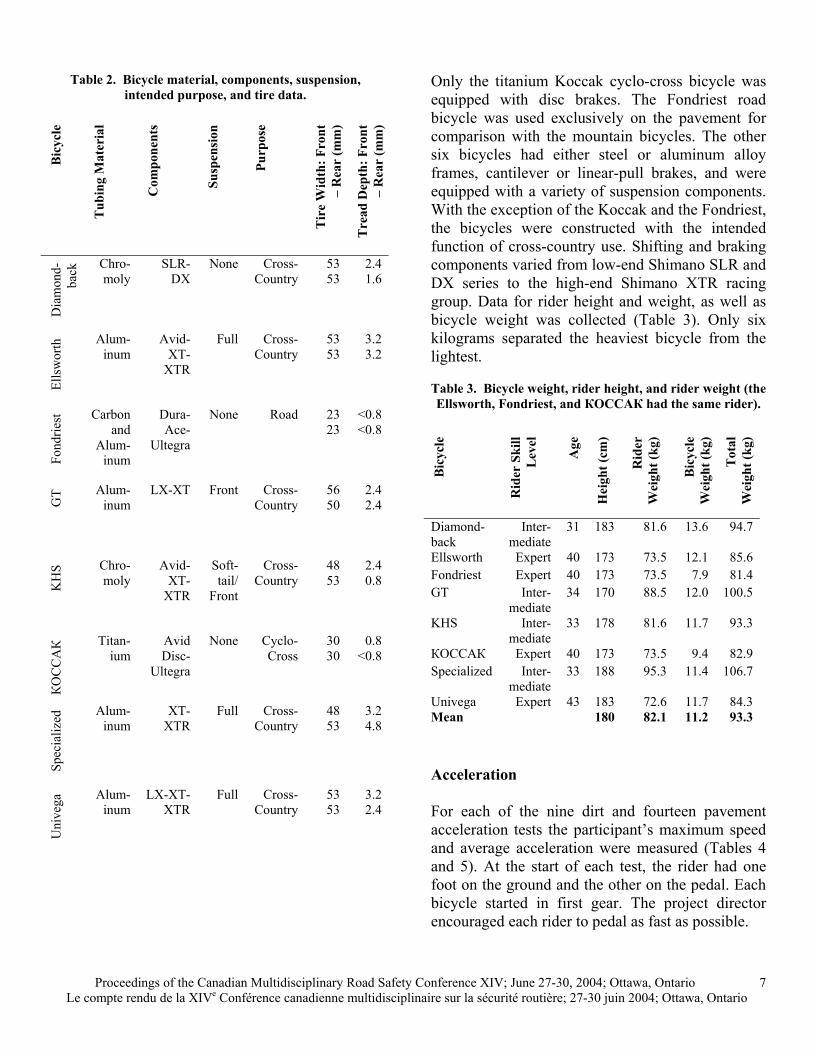
Table 2. Bicycle material, components, suspension, intended purpose, and tire data.
Bic
ycle
Tub
ing
Mat
eria
l
Com
pone
nts
Susp
ensi
on
Purp
ose
Tir
e W
idth
: Fro
nt
– R
ear
(mm
)
Tre
ad D
epth
: Fro
nt
– R
ear
(mm
)
Dia
mon
d-ba
ck Chro-
moly SLR-
DX None Cross-
Country 53 53
2.4 1.6
Ells
wor
th Alum-
inum Avid-
XT-XTR
Full Cross-Country
53 53
3.2 3.2
Fond
riest
Carbon and
Alum-inum
Dura-Ace-
Ultegra
None Road 23 23
<0.8 <0.8
GT Alum-
inum LX-XT Front Cross-
Country 56 50
2.4 2.4
KH
S Chro-moly
Avid-XT-
XTR
Soft-tail/
Front
Cross-Country
48 53
2.4 0.8
КОССАК
Titan-ium
Avid Disc-
Ultegra
None Cyclo-Cross
30 30
0.8 <0.8
Spec
ializ
ed Alum-
inum XT-
XTR Full Cross-
Country 48 53
3.2 4.8
Uni
vega
Alum-inum
LX-XT-XTR
Full Cross-Country
53 53
3.2 2.4
Only the titanium Koccak cyclo-cross bicycle was equipped with disc brakes. The Fondriest road bicycle was used exclusively on the pavement for comparison with the mountain bicycles. The other six bicycles had either steel or aluminum alloy frames, cantilever or linear-pull brakes, and were equipped with a variety of suspension components. With the exception of the Koccak and the Fondriest, the bicycles were constructed with the intended function of cross-country use. Shifting and braking components varied from low-end Shimano SLR and DX series to the high-end Shimano XTR racing group. Data for rider height and weight, as well as bicycle weight was collected (Table 3). Only six kilograms separated the heaviest bicycle from the lightest.
Table 3. Bicycle weight, rider height, and rider weight (the Ellsworth, Fondriest, and КОССАК had the same rider).
B
icyc
le
Rid
er S
kill
Lev
el
Age
Hei
ght (
cm)
Rid
er
Wei
ght (
kg)
Bic
ycle
W
eigh
t (kg
)
Tot
al
Wei
ght (
kg)
Diamond-back
Inter-mediate
31 183 81.6 13.6 94.7
Ellsworth Expert 40 173 73.5 12.1 85.6 Fondriest Expert 40 173 73.5 7.9 81.4 GT Inter-
mediate 34 170 88.5 12.0 100.5
KHS Inter-mediate
33 178 81.6 11.7 93.3
КОССАК Expert 40 173 73.5 9.4 82.9 Specialized Inter-
mediate 33 188 95.3 11.4 106.7
Univega Expert 43 183 72.6 11.7 84.3 Mean 180 82.1 11.2 93.3 Acceleration For each of the nine dirt and fourteen pavement acceleration tests the participant’s maximum speed and average acceleration were measured (Tables 4 and 5). At the start of each test, the rider had one foot on the ground and the other on the pedal. Each bicycle started in first gear. The project director encouraged each rider to pedal as fast as possible.
Proceedings of the Canadian Multidisciplinary Road Safety Conference XIV; June 27-30, 2004; Ottawa, Ontario Le compte rendu de la XIVe Conférence canadienne multidisciplinaire sur la sécurité routière; 27-30 juin 2004; Ottawa, Ontario
7
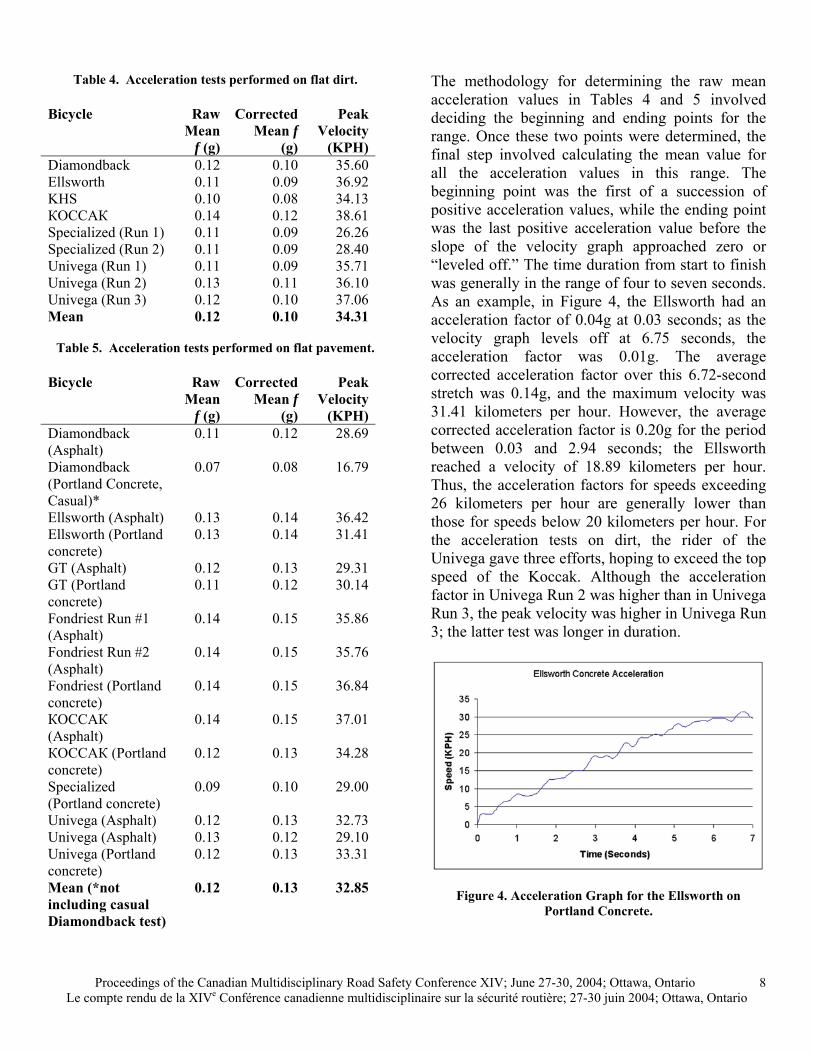
Table 4. Acceleration tests performed on flat dirt. Bicycle Raw
Mean f (g)
Corrected Mean f
(g)
Peak Velocity
(KPH)Diamondback 0.12 0.10 35.60Ellsworth 0.11 0.09 36.92KHS 0.10 0.08 34.13КОССАК 0.14 0.12 38.61Specialized (Run 1) 0.11 0.09 26.26Specialized (Run 2) 0.11 0.09 28.40Univega (Run 1) 0.11 0.09 35.71Univega (Run 2) 0.13 0.11 36.10Univega (Run 3) 0.12 0.10 37.06Mean 0.12 0.10 34.31
Table 5. Acceleration tests performed on flat pavement.
Bicycle Raw
Mean f (g)
Corrected Mean f
(g)
Peak Velocity
(KPH)Diamondback (Asphalt)
0.11 0.12 28.69
Diamondback (Portland Concrete, Casual)*
0.07 0.08 16.79
Ellsworth (Asphalt) 0.13 0.14 36.42Ellsworth (Portland concrete)
0.13 0.14 31.41
GT (Asphalt) 0.12 0.13 29.31GT (Portland concrete)
0.11 0.12 30.14
Fondriest Run #1 (Asphalt)
0.14 0.15 35.86
Fondriest Run #2 (Asphalt)
0.14 0.15 35.76
Fondriest (Portland concrete)
0.14 0.15 36.84
КОССАК (Asphalt)
0.14 0.15 37.01
КОССАК (Portland concrete)
0.12 0.13 34.28
Specialized (Portland concrete)
0.09 0.10 29.00
Univega (Asphalt) 0.12 0.13 32.73Univega (Asphalt) 0.13 0.12 29.10Univega (Portland concrete)
0.12 0.13 33.31
Mean (*not including casual Diamondback test)
0.12 0.13 32.85
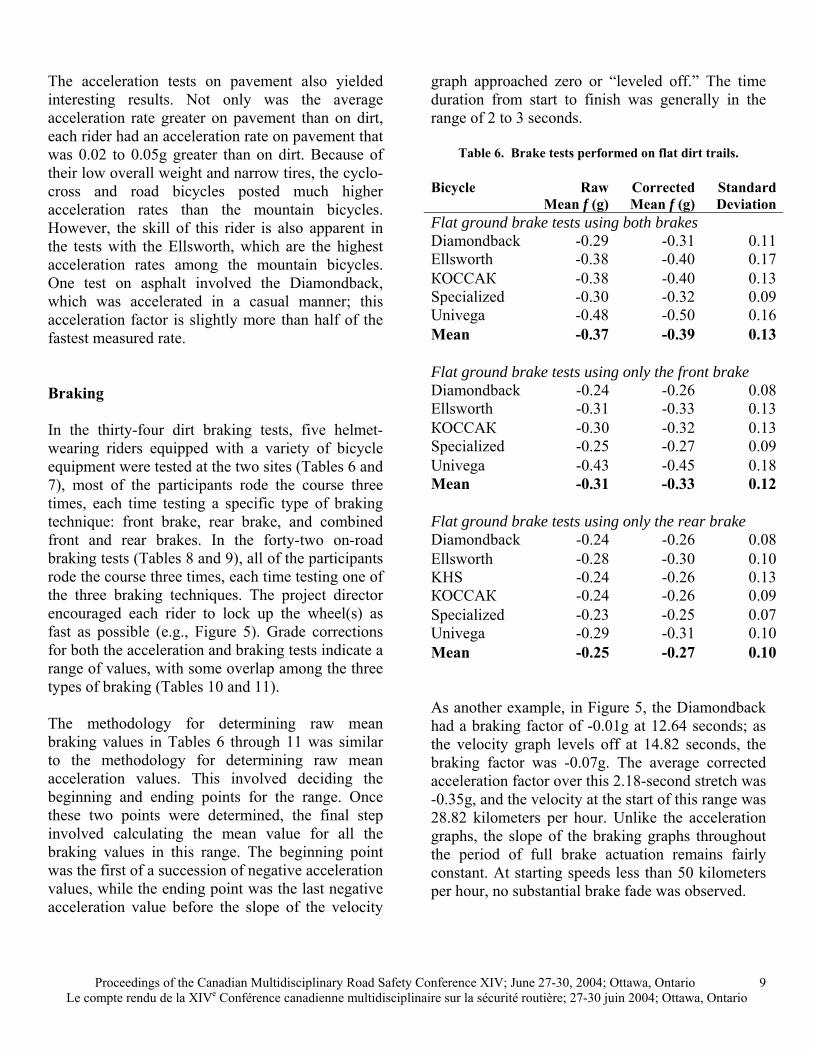
The methodology for determining the raw mean acceleration values in Tables 4 and 5 involved deciding the beginning and ending points for the range. Once these two points were determined, the final step involved calculating the mean value for all the acceleration values in this range. The beginning point was the first of a succession of positive acceleration values, while the ending point was the last positive acceleration value before the slope of the velocity graph approached zero or “leveled off.” The time duration from start to finish was generally in the range of four to seven seconds. As an example, in Figure 4, the Ellsworth had an acceleration factor of 0.04g at 0.03 seconds; as the velocity graph levels off at 6.75 seconds, the acceleration factor was 0.01g. The average corrected acceleration factor over this 6.72-second stretch was 0.14g, and the maximum velocity was 31.41 kilometers per hour. However, the average corrected acceleration factor is 0.20g for the period between 0.03 and 2.94 seconds; the Ellsworth reached a velocity of 18.89 kilometers per hour. Thus, the acceleration factors for speeds exceeding 26 kilometers per hour are generally lower than those for speeds below 20 kilometers per hour. For the acceleration tests on dirt, the rider of the Univega gave three efforts, hoping to exceed the top speed of the Koccak. Although the acceleration factor in Univega Run 2 was higher than in Univega Run 3, the peak velocity was higher in Univega Run 3; the latter test was longer in duration.
Figure 4. Acceleration Graph for the Ellsworth on Portland Concrete.
Proceedings of the Canadian Multidisciplinary Road Safety Conference XIV; June 27-30, 2004; Ottawa, Ontario Le compte rendu de la XIVe Conférence canadienne multidisciplinaire sur la sécurité routière; 27-30 juin 2004; Ottawa, Ontario
8
The acceleration tests on pavement also yielded interesting results. Not only was the average acceleration rate greater on pavement than on dirt, each rider had an acceleration rate on pavement that was 0.02 to 0.05g greater than on dirt. Because of their low overall weight and narrow tires, the cyclo- cross and road bicycles posted much higher acceleration rates than the mountain bicycles. However, the skill of this rider is also apparent in the tests with the Ellsworth, which are the highest acceleration rates among the mountain bicycles. One test on asphalt involved the Diamondback, which was accelerated in a casual manner; this acceleration factor is slightly more than half of the fastest measured rate. Braking In the thirty-four dirt braking tests, five helmet-wearing riders equipped with a variety of bicycle equipment were tested at the two sites (Tables 6 and 7), most of the participants rode the course three times, each time testing a specific type of braking technique: front brake, rear brake, and combined front and rear brakes. In the forty-two on-road braking tests (Tables 8 and 9), all of the participants rode the course three times, each time testing one of the three braking techniques. The project director encouraged each rider to lock up the wheel(s) as fast as possible (e.g., Figure 5). Grade corrections for both the acceleration and braking tests indicate a range of values, with some overlap among the three types of braking (Tables 10 and 11). The methodology for determining raw mean braking values in Tables 6 through 11 was similar to the methodology for determining raw mean acceleration values. This involved deciding the beginning and ending points for the range. Once these two points were determined, the final step involved calculating the mean value for all the braking values in this range. The beginning point was the first of a succession of negative acceleration values, while the ending point was the last negative acceleration value before the slope of the velocity
graph approached zero or “leveled off.” The time duration from start to finish was generally in the range of 2 to 3 seconds.
Table 6. Brake tests performed on flat dirt trails. Bicycle Raw
Mean f (g) Corrected Mean f (g)
Standard Deviation
Flat ground brake tests using both brakes Diamondback -0.29 -0.31 0.11Ellsworth -0.38 -0.40 0.17КОССАК -0.38 -0.40 0.13Specialized -0.30 -0.32 0.09Univega -0.48 -0.50 0.16Mean -0.37 -0.39 0.13 Flat ground brake tests using only the front brake Diamondback -0.24 -0.26 0.08Ellsworth -0.31 -0.33 0.13КОССАК -0.30 -0.32 0.13Specialized -0.25 -0.27 0.09Univega -0.43 -0.45 0.18Mean -0.31 -0.33 0.12 Flat ground brake tests using only the rear brake Diamondback -0.24 -0.26 0.08Ellsworth -0.28 -0.30 0.10KHS -0.24 -0.26 0.13КОССАК -0.24 -0.26 0.09Specialized -0.23 -0.25 0.07Univega -0.29 -0.31 0.10Mean -0.25 -0.27 0.10 As another example, in Figure 5, the Diamondback had a braking factor of -0.01g at 12.64 seconds; as the velocity graph levels off at 14.82 seconds, the braking factor was -0.07g. The average corrected acceleration factor over this 2.18-second stretch was -0.35g, and the velocity at the start of this range was 28.82 kilometers per hour. Unlike the acceleration graphs, the slope of the braking graphs throughout the period of full brake actuation remains fairly constant. At starting speeds less than 50 kilometers per hour, no substantial brake fade was observed.
Proceedings of the Canadian Multidisciplinary Road Safety Conference XIV; June 27-30, 2004; Ottawa, Ontario Le compte rendu de la XIVe Conférence canadienne multidisciplinaire sur la sécurité routière; 27-30 juin 2004; Ottawa, Ontario
9
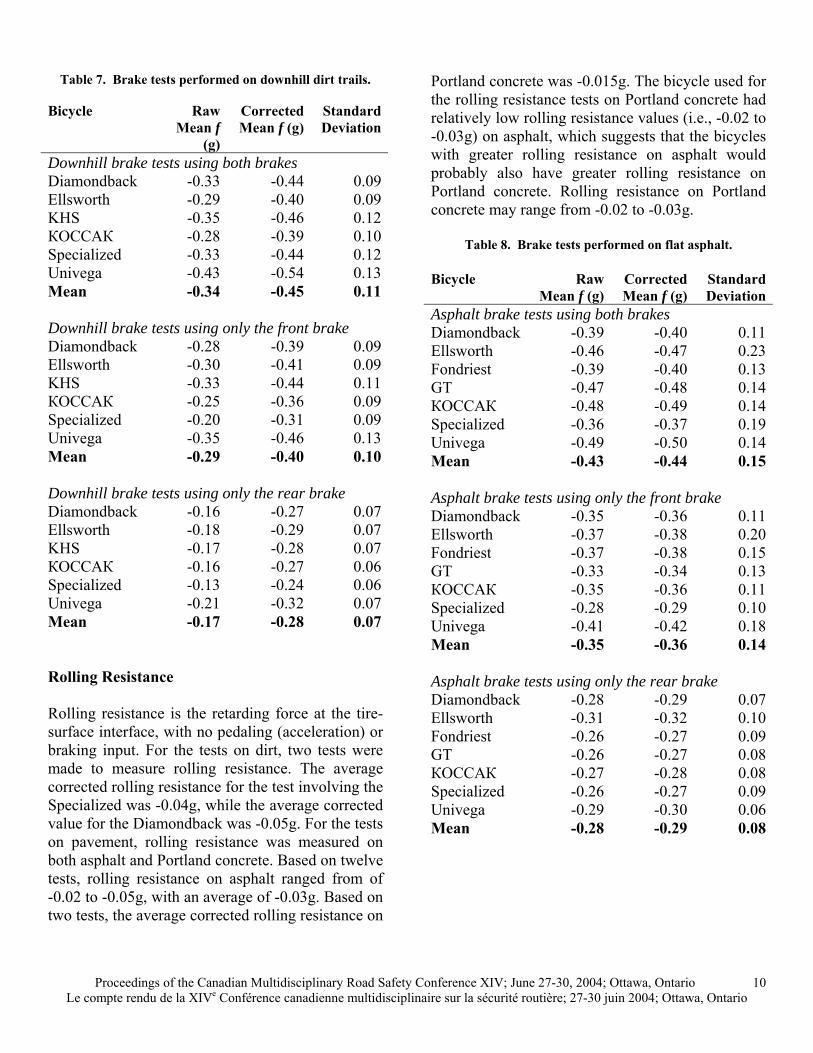
Table 7. Brake tests performed on downhill dirt trails. Bicycle Raw
Mean f (g)
Corrected Mean f (g)
Standard Deviation
Downhill brake tests using both brakes Diamondback -0.33 -0.44 0.09Ellsworth -0.29 -0.40 0.09KHS -0.35 -0.46 0.12КОССАК -0.28 -0.39 0.10Specialized -0.33 -0.44 0.12Univega -0.43 -0.54 0.13Mean -0.34 -0.45 0.11 Downhill brake tests using only the front brake Diamondback -0.28 -0.39 0.09Ellsworth -0.30 -0.41 0.09KHS -0.33 -0.44 0.11КОССАК -0.25 -0.36 0.09Specialized -0.20 -0.31 0.09Univega -0.35 -0.46 0.13Mean -0.29 -0.40 0.10 Downhill brake tests using only the rear brake Diamondback -0.16 -0.27 0.07Ellsworth -0.18 -0.29 0.07KHS -0.17 -0.28 0.07КОССАК -0.16 -0.27 0.06Specialized -0.13 -0.24 0.06Univega -0.21 -0.32 0.07Mean -0.17 -0.28 0.07 Rolling Resistance Rolling resistance is the retarding force at the tire-surface interface, with no pedaling (acceleration) or braking input. For the tests on dirt, two tests were made to measure rolling resistance. The average corrected rolling resistance for the test involving the Specialized was -0.04g, while the average corrected value for the Diamondback was -0.05g. For the tests on pavement, rolling resistance was measured on both asphalt and Portland concrete. Based on twelve tests, rolling resistance on asphalt ranged from of -0.02 to -0.05g, with an average of -0.03g. Based on two tests, the average corrected rolling resistance on
Portland concrete was -0.015g. The bicycle used for the rolling resistance tests on Portland concrete had relatively low rolling resistance values (i.e., -0.02 to -0.03g) on asphalt, which suggests that the bicycles with greater rolling resistance on asphalt would probably also have greater rolling resistance on Portland concrete. Rolling resistance on Portland concrete may range from -0.02 to -0.03g.
Table 8. Brake tests performed on flat asphalt. Bicycle Raw
Mean f (g) Corrected Mean f (g)
Standard Deviation
Asphalt brake tests using both brakes Diamondback -0.39 -0.40 0.11Ellsworth -0.46 -0.47 0.23Fondriest -0.39 -0.40 0.13GT -0.47 -0.48 0.14КОССАК -0.48 -0.49 0.14Specialized -0.36 -0.37 0.19Univega -0.49 -0.50 0.14Mean -0.43 -0.44 0.15 Asphalt brake tests using only the front brake Diamondback -0.35 -0.36 0.11Ellsworth -0.37 -0.38 0.20Fondriest -0.37 -0.38 0.15GT -0.33 -0.34 0.13КОССАК -0.35 -0.36 0.11Specialized -0.28 -0.29 0.10Univega -0.41 -0.42 0.18Mean -0.35 -0.36 0.14 Asphalt brake tests using only the rear brake Diamondback -0.28 -0.29 0.07Ellsworth -0.31 -0.32 0.10Fondriest -0.26 -0.27 0.09GT -0.26 -0.27 0.08КОССАК -0.27 -0.28 0.08Specialized -0.26 -0.27 0.09Univega -0.29 -0.30 0.06Mean -0.28 -0.29 0.08
Proceedings of the Canadian Multidisciplinary Road Safety Conference XIV; June 27-30, 2004; Ottawa, Ontario Le compte rendu de la XIVe Conférence canadienne multidisciplinaire sur la sécurité routière; 27-30 juin 2004; Ottawa, Ontario
10
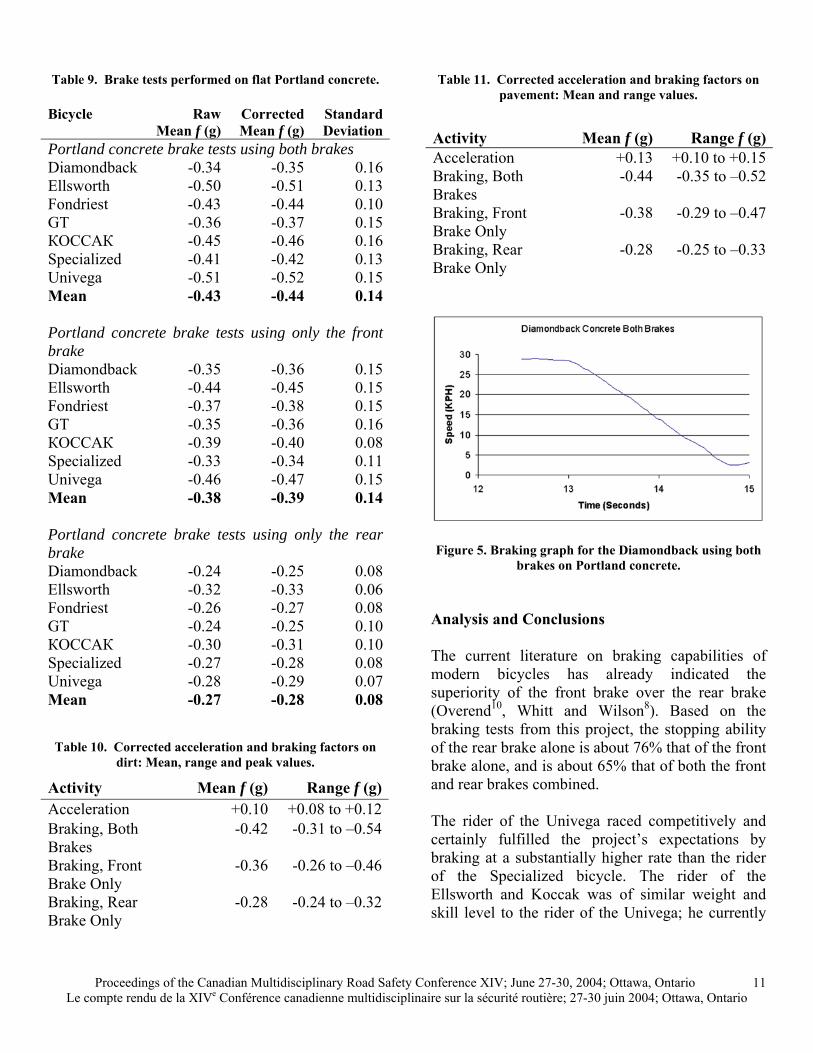
Table 9. Brake tests performed on flat Portland concrete. Bicycle Raw
Mean f (g) Corrected Mean f (g)
Standard Deviation
Portland concrete brake tests using both brakes Diamondback -0.34 -0.35 0.16Ellsworth -0.50 -0.51 0.13Fondriest -0.43 -0.44 0.10GT -0.36 -0.37 0.15КОССАК -0.45 -0.46 0.16Specialized -0.41 -0.42 0.13Univega -0.51 -0.52 0.15Mean -0.43 -0.44 0.14 Portland concrete brake tests using only the front brake Diamondback -0.35 -0.36 0.15Ellsworth -0.44 -0.45 0.15Fondriest -0.37 -0.38 0.15GT -0.35 -0.36 0.16КОССАК -0.39 -0.40 0.08Specialized -0.33 -0.34 0.11Univega -0.46 -0.47 0.15Mean -0.38 -0.39 0.14 Portland concrete brake tests using only the rear brake Diamondback -0.24 -0.25 0.08Ellsworth -0.32 -0.33 0.06Fondriest -0.26 -0.27 0.08GT -0.24 -0.25 0.10КОССАК -0.30 -0.31 0.10Specialized -0.27 -0.28 0.08Univega -0.28 -0.29 0.07Mean -0.27 -0.28 0.08
Table 10. Corrected acceleration and braking factors on dirt: Mean, range and peak values.
Table 11. Corrected acceleration and braking factors on pavement: Mean and range values.
Activity Mean f (g) Range f (g)Acceleration +0.13 +0.10 to +0.15Braking, Both Brakes
-0.44 -0.35 to –0.52
Braking, Front Brake Only
-0.38 -0.29 to –0.47
Braking, Rear Brake Only
-0.28 -0.25 to –0.33
Figure 5. Braking graph for the Diamondback using both
brakes on Portland concrete. Analysis and Conclusions The current literature on braking capabilities of modern bicycles has already indicated the superiority of the front brake over the rear brake (Overend10, Whitt and Wilson8). Based on the braking tests from this project, the stopping ability of the rear brake alone is about 76% that of the front brake alone, and is about 65% that of both the front and rear brakes combined. Activity Mean f (g) Range f (g)
Acceleration +0.10 +0.08 to +0.12Braking, Both Brakes
-0.42 -0.31 to –0.54
Braking, Front Brake Only
-0.36 -0.26 to –0.46
Braking, Rear Brake Only
-0.28 -0.24 to –0.32
The rider of the Univega raced competitively and certainly fulfilled the project’s expectations by braking at a substantially higher rate than the rider of the Specialized bicycle. The rider of the Ellsworth and Koccak was of similar weight and skill level to the rider of the Univega; he currently
Proceedings of the Canadian Multidisciplinary Road Safety Conference XIV; June 27-30, 2004; Ottawa, Ontario Le compte rendu de la XIVe Conférence canadienne multidisciplinaire sur la sécurité routière; 27-30 juin 2004; Ottawa, Ontario
11
races in the San Diego cyclo-cross circuit. Because the Koccak is substantially lighter than the Ellsworth, the Koccak had greater acceleration, especially on dirt. The “V”-brake-equipped Ellsworth outperformed the Avid disc-brake-equipped Koccak in all but one brake test; the reasons for this difference perhaps are related to the weight and/or suspension of the Ellsworth. Two other possibilities for this difference may be the relative narrowness of the Koccak tires or the geometry of the Koccak frame. The riders of the Diamondback and KHS were of similar weight. Because the Diamondback was completely rigid (no front or rear suspension), it outperformed the KHS in the acceleration tests. However, the suspension in the KHS was probably the primary factor in its superiority over the Diamondback in all the brake tests. Because of energy absorption, suspension often hampers acceleration, yet generally improves braking. The rider of the Specialized was the only true “Clydesdale” (over 91 kilograms) in the test group and outweighed the other riders by approximately seven kilograms. He posted the lowest drag factor results in the single (front-only and rear-only) brake tests. His test using both brakes was near the mean. The single brake tests may not have been adequate, or the rider may have felt more comfortable using both brakes. Rider weight was probably not an issue for this disparity in braking, but probably was the main reason why he had the lowest acceleration rate. Despite the substantial difference in grade between the two test areas, the standard method for adjusting the acceleration and brake factors created an acceptable level of overlap between the two ranges for each set of brake tests. For example, the calibrated range for the downhill brake tests using only the rear brake had a range of -0.24 to -0.32g, while the flat ground tests with only the rear brake had a range of -0.25 to -0.31g. The overlap between these two ranges is acceptable enough to justify the use of the standard method of grade adjustment.
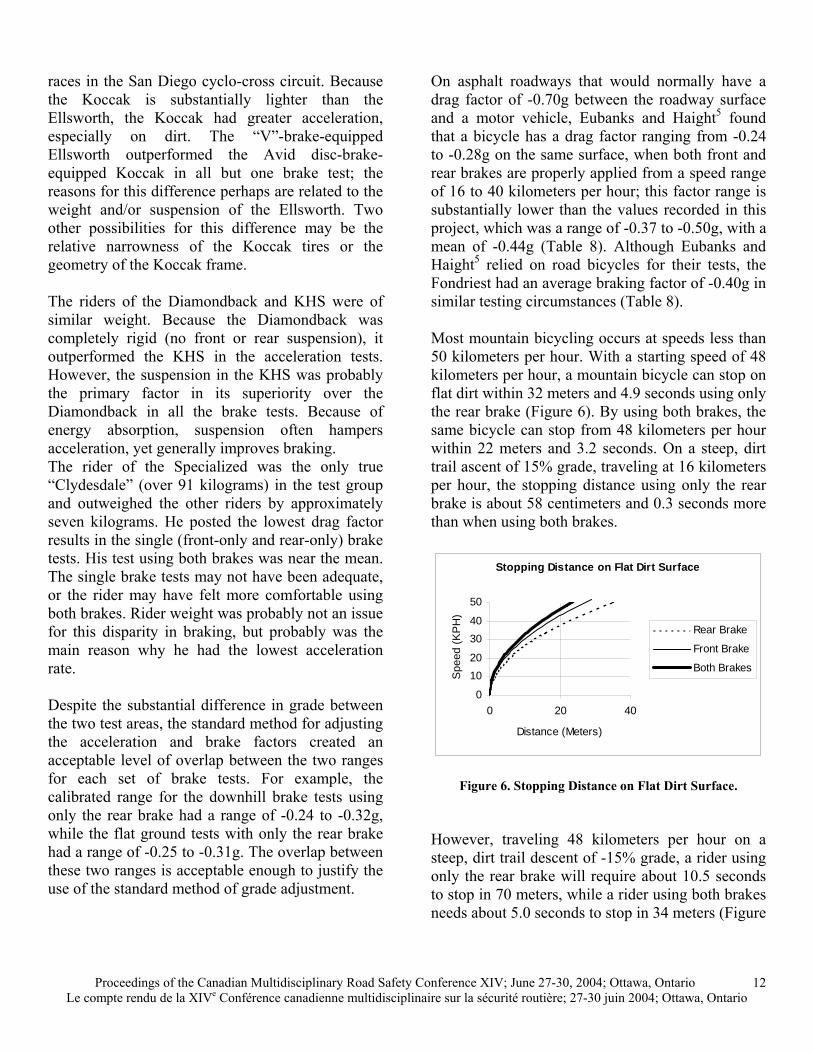
On asphalt roadways that would normally have a drag factor of -0.70g between the roadway surface and a motor vehicle, Eubanks and Haight5 found that a bicycle has a drag factor ranging from -0.24 to -0.28g on the same surface, when both front and rear brakes are properly applied from a speed range of 16 to 40 kilometers per hour; this factor range is substantially lower than the values recorded in this project, which was a range of -0.37 to -0.50g, with a mean of -0.44g (Table 8). Although Eubanks and Haight5 relied on road bicycles for their tests, the Fondriest had an average braking factor of -0.40g in similar testing circumstances (Table 8). Most mountain bicycling occurs at speeds less than 50 kilometers per hour. With a starting speed of 48 kilometers per hour, a mountain bicycle can stop on flat dirt within 32 meters and 4.9 seconds using only the rear brake (Figure 6). By using both brakes, the same bicycle can stop from 48 kilometers per hour within 22 meters and 3.2 seconds. On a steep, dirt trail ascent of 15% grade, traveling at 16 kilometers per hour, the stopping distance using only the rear brake is about 58 centimeters and 0.3 seconds more than when using both brakes.
Stopping Distance on Flat Dirt Surface
0
1020
3040
50
0 20 40
Distance (Meters)
Spe
ed (K
PH
)
Rear Brake
Front Brake
Both Brakes
Figure 6. Stopping Distance on Flat Dirt Surface. However, traveling 48 kilometers per hour on a steep, dirt trail descent of -15% grade, a rider using only the rear brake will require about 10.5 seconds to stop in 70 meters, while a rider using both brakes needs about 5.0 seconds to stop in 34 meters (Figure
Proceedings of the Canadian Multidisciplinary Road Safety Conference XIV; June 27-30, 2004; Ottawa, Ontario Le compte rendu de la XIVe Conférence canadienne multidisciplinaire sur la sécurité routière; 27-30 juin 2004; Ottawa, Ontario
12
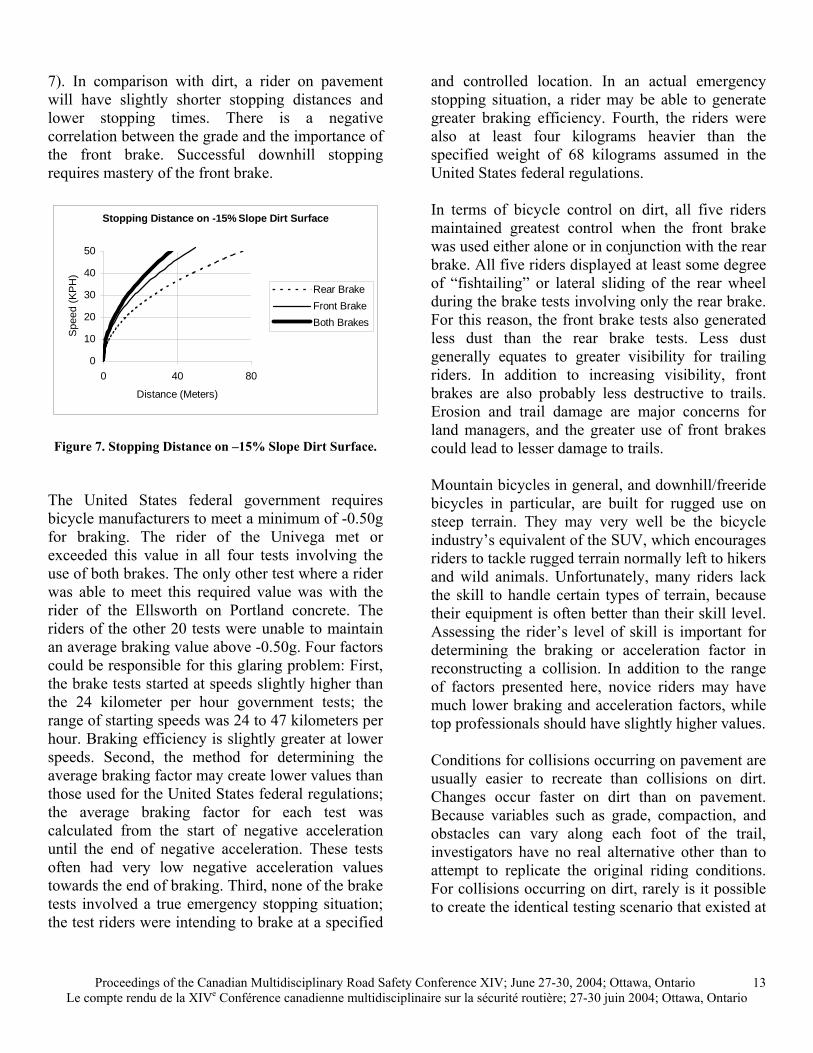
7). In comparison with dirt, a rider on pavement will have slightly shorter stopping distances and lower stopping times. There is a negative correlation between the grade and the importance of the front brake. Successful downhill stopping requires mastery of the front brake.
Stopping Distance on -15% Slope Dirt Surface
0
10
20
30
40
50
0 40 80
Distance (Meters)
Spe
ed (K
PH
)
Rear BrakeFront BrakeBoth Brakes
Figure 7. Stopping Distance on –15% Slope Dirt Surface.
The United States federal government requires bicycle manufacturers to meet a minimum of -0.50g for braking. The rider of the Univega met or exceeded this value in all four tests involving the use of both brakes. The only other test where a rider was able to meet this required value was with the rider of the Ellsworth on Portland concrete. The riders of the other 20 tests were unable to maintain an average braking value above -0.50g. Four factors could be responsible for this glaring problem: First, the brake tests started at speeds slightly higher than the 24 kilometer per hour government tests; the range of starting speeds was 24 to 47 kilometers per hour. Braking efficiency is slightly greater at lower speeds. Second, the method for determining the average braking factor may create lower values than those used for the United States federal regulations; the average braking factor for each test was calculated from the start of negative acceleration until the end of negative acceleration. These tests often had very low negative acceleration values towards the end of braking. Third, none of the brake tests involved a true emergency stopping situation; the test riders were intending to brake at a specified
and controlled location. In an actual emergency stopping situation, a rider may be able to generate greater braking efficiency. Fourth, the riders were also at least four kilograms heavier than the specified weight of 68 kilograms assumed in the United States federal regulations. In terms of bicycle control on dirt, all five riders maintained greatest control when the front brake was used either alone or in conjunction with the rear brake. All five riders displayed at least some degree of “fishtailing” or lateral sliding of the rear wheel during the brake tests involving only the rear brake. For this reason, the front brake tests also generated less dust than the rear brake tests. Less dust generally equates to greater visibility for trailing riders. In addition to increasing visibility, front brakes are also probably less destructive to trails. Erosion and trail damage are major concerns for land managers, and the greater use of front brakes could lead to lesser damage to trails. Mountain bicycles in general, and downhill/freeride bicycles in particular, are built for rugged use on steep terrain. They may very well be the bicycle industry’s equivalent of the SUV, which encourages riders to tackle rugged terrain normally left to hikers and wild animals. Unfortunately, many riders lack the skill to handle certain types of terrain, because their equipment is often better than their skill level. Assessing the rider’s level of skill is important for determining the braking or acceleration factor in reconstructing a collision. In addition to the range of factors presented here, novice riders may have much lower braking and acceleration factors, while top professionals should have slightly higher values. Conditions for collisions occurring on pavement are usually easier to recreate than collisions on dirt. Changes occur faster on dirt than on pavement. Because variables such as grade, compaction, and obstacles can vary along each foot of the trail, investigators have no real alternative other than to attempt to replicate the original riding conditions. For collisions occurring on dirt, rarely is it possible to create the identical testing scenario that existed at
Proceedings of the Canadian Multidisciplinary Road Safety Conference XIV; June 27-30, 2004; Ottawa, Ontario Le compte rendu de la XIVe Conférence canadienne multidisciplinaire sur la sécurité routière; 27-30 juin 2004; Ottawa, Ontario
13
the time of the collision. Unfortunately, trails can substantially change within days after a collision, e.g., a rare thunderstorm appeared two days after the first set of tests on dirt, eradicating our tire marks. In an ideal world where the investigator can duplicate the actual trail conditions, the following items and conditions would exist:
• Actual mountain bicycle involved in collision, otherwise an exemplar
• Test rider of same sex, height, weight and skill level
• Similar weather and lighting conditions • Actual section of trail where collision
occurred, preferably unmodified Because of the small sample size and the limited types of bicycles and surfaces, the project director has planned future tests involving a wider variety of bicycles and surfaces. Information on braking capabilities in wet conditions also would be useful. Further research is necessary to determine rolling resistance values; the tests conducted so far have not isolated rolling resistance from other forces such as wind. This project will contribute to a better understanding of bicycle acceleration and braking capabilities, providing investigators the necessary tools to investigate and reconstruct mountain bicycle collisions. Acknowledgments Many individuals contributed to the success of this research project. The riders included George Adrian, Andrew Humpherys, Team JT, and Greg Wiedemeier. The field crew included David Casteel, Nischel Casteel, and Sigifredo Miramontes. Video editing and production work was completed by John Munoa (Trinity 2.4 Build 3087), Alan Maddison (AVI and Quicktime production), Adam Antaloczy (DVD production), and Ryan Andrews (Adobe Photoshop 7.0 de-interlacing). Videos, photographs, and data are available at the web site, http://www.beckforensics.com
References 1. USDOT; Traffic Safety Facts 2001: A Compilation of Motor Vehicle Crash Data from the Fatality Analysis Reporting System and the General Estimates System; United States Department of Transportation National Highway Traffic Safety Administration; Washington, DC; 2002 2. 16 C.F.R. Section 1512.5d; Code of Federal Regulations, Title 16, Chapter II (Consumer Product Safety Commission), Section 1512.5d 3. Bicycle Products Suppliers Association 2001 Year End Statistical Report; posted on the Internet at http://www.bpsa.org; 2004 4. Forester J; Effective Cycling, 6th Edition; MIT Press, Cambridge, Massachusetts; pp. 36, 205-207; 1993 5. Eubanks J and Haight WR; Accident Reconstruction for Bicycle-involved Traffic Collisions; Texas A&M Pedestrian/ Bicycle Accident Reconstruction Course; pp. 4-5; 1991 6. Proctor, CE (ed); Kempe’s Engineer’s Year Book, vol. 2; Morgan, London; pp. 320-321; 1962 7. Carr GM and Ross MJ; The MIRA single-wheel rolling resistance trailers; Motor Industries Research Associates; Nuneaton, England; 1966 8. Whitt FR and Wilson DG; Bicycling Science, Second Edition; MIT Press, Cambridge; pp. 198-200; 1982 9. Faria IE and Cavanagh PR; The Physiology and Biomechanics of Cycling; John Wiley & Sons, New York; pp. 65-70; 1978 10. Overend N with Pavelka E; Mountain Bike Like A Champion; Rodale Press, Emmaus, Pennsylvania; pp. 45-46; 1999
Proceedings of the Canadian Multidisciplinary Road Safety Conference XIV; June 27-30, 2004; Ottawa, Ontario Le compte rendu de la XIVe Conférence canadienne multidisciplinaire sur la sécurité routière; 27-30 juin 2004; Ottawa, Ontario
14
11. Casteel DA and Moss SD; Basic Collision Analysis and Scene Documentation; David L. Moss Publications, San Diego, California; pp. 4-5; 1982 12. Kennedy MP and Peterson GL; Geology of the San Diego Metropolitan Area, California: Section B, Eastern San Diego Metropolitan Area; California Division of Mines and Geology Bulletin 200, Sacramento, California; pp. 47-48; 1975
Proceedings of the Canadian Multidisciplinary Road Safety Conference XIV; June 27-30, 2004; Ottawa, Ontario Le compte rendu de la XIVe Conférence canadienne multidisciplinaire sur la sécurité routière; 27-30 juin 2004; Ottawa, Ontario
15