motorists’ attitudes to using atis at highway-rail ...€™ attitudes to using atis ... survey...
TRANSCRIPT

Motorists’ Attitudes to Using ATISat Highway-Rail Intersections
Dawn C. KrahnAyman Smadi
Upper Great Plains Transportation InstituteNorth Dakota State University
Fargo, North Dakota
May 1999

ABSTRACT
Highway-Rail Intersections (HRIs) confront urban areas with several safety and
congestion problems. The Fargo-Moorhead area for instance, is divided by a major rail line
which experiences approximately 70 trains a day. Delays at HRIs of up to 10 minutes can cause
traffic problems for many people who either utilize services or work in the downtown area. In
addition, the blockage of a rail crossing when a train is present may hinder the effective
movement of emergency vehicles. High-cost solutions to separate rail lines from surface roads
are infeasible in many areas. However, ITS can offer cost-effective solutions by redirecting
traffic away from blocked HRIs. The system would detect a train and estimate approximate
delays at affected HRIs. Real-time information may be displayed on electronic signs (such as
CMSs). Motorists can then decide whether to continue on their original routes or divert to
different routes to avoid the HRIs.
The operational and cost effectiveness of the ITS solution will depend on the extent of
motorist participation, i.e., percentage of drivers who would change their route. Therefore, a
survey was developed to assess motorist attitudes toward delays at HRIs and their acceptance of
the application of ITS to provide information about HRI delays. The survey was conducted as
part of a case study in the Fargo-Moorhead area. Over 1,500 surveys were distributed and 535
returned, a 36 percent response rate. The survey was augmented with a focus group to discuss
preferences for alternative ATIS methods and information.
The survey results revealed that the majority of the motorists in the study area see
significant problems at HRIs in need of solutions. The results also indicated motorists would
react favorably to having information provided to them through ATIS.

TABLE OF CONTENTS
CHAPTER 1. INTRODUCTION . . . . . . . . . . . . . . . . . . . . . . . . . . . . . . . . . . . . . . . . . . . . . . . . . . . . . . . 1Background . . . . . . . . . . . . . . . . . . . . . . . . . . . . . . . . . . . . . . . . . . . . . . . . . . . . . . . . . . . . . . . . . . 1Description of the Problem . . . . . . . . . . . . . . . . . . . . . . . . . . . . . . . . . . . . . . . . . . . . . . . . . . . . . . 1Description of the Study Area . . . . . . . . . . . . . . . . . . . . . . . . . . . . . . . . . . . . . . . . . . . . . . . . . . . 2Application of ITS Technologies . . . . . . . . . . . . . . . . . . . . . . . . . . . . . . . . . . . . . . . . . . . . . . . . . 3Importance of Research . . . . . . . . . . . . . . . . . . . . . . . . . . . . . . . . . . . . . . . . . . . . . . . . . . . . . . . . 4Format and Objectives of the Study . . . . . . . . . . . . . . . . . . . . . . . . . . . . . . . . . . . . . . . . . . . . . . . 4Organization . . . . . . . . . . . . . . . . . . . . . . . . . . . . . . . . . . . . . . . . . . . . . . . . . . . . . . . . . . . . . . . . . 5
CHAPTER 2. LITERATURE REVIEW . . . . . . . . . . . . . . . . . . . . . . . . . . . . . . . . . . . . . . . . . . . . . . . . . 6Assessing Consumer Response to ATIS . . . . . . . . . . . . . . . . . . . . . . . . . . . . . . . . . . . . . . . . . . . . 6California Bay Area Commuters . . . . . . . . . . . . . . . . . . . . . . . . . . . . . . . . . . . . . . . . . . . . . . . . . 7Washington D.C. Area Motorists . . . . . . . . . . . . . . . . . . . . . . . . . . . . . . . . . . . . . . . . . . . . . . . . . 8User Acceptance of ATIS Products and Services . . . . . . . . . . . . . . . . . . . . . . . . . . . . . . . . . . . . . 9Presenting Descriptive Information in Variable Message Signing . . . . . . . . . . . . . . . . . . . . . . . . 9
CHAPTER 3. MAIL-BACK SURVEY METHODOLOGY . . . . . . . . . . . . . . . . . . . . . . . . . . . . . . . . . 11Objectives of the Mail-Back Survey . . . . . . . . . . . . . . . . . . . . . . . . . . . . . . . . . . . . . . . . . . . . . . 11Mail-Back Survey Design and Format . . . . . . . . . . . . . . . . . . . . . . . . . . . . . . . . . . . . . . . . . . . . 12Targeted Motorist Sample . . . . . . . . . . . . . . . . . . . . . . . . . . . . . . . . . . . . . . . . . . . . . . . . . . . . . 14
CHAPTER 4. FOCUS GROUP METHODOLOGY . . . . . . . . . . . . . . . . . . . . . . . . . . . . . . . . . . . . . . . 16Objectives of the Focus Groups . . . . . . . . . . . . . . . . . . . . . . . . . . . . . . . . . . . . . . . . . . . . . . . . . 16Identifying Participants . . . . . . . . . . . . . . . . . . . . . . . . . . . . . . . . . . . . . . . . . . . . . . . . . . . . . . . . 17Focus Groups Format . . . . . . . . . . . . . . . . . . . . . . . . . . . . . . . . . . . . . . . . . . . . . . . . . . . . . . . . . 18
CHAPTER 5. RESULTS OF THE MAIL-BACK SURVEY . . . . . . . . . . . . . . . . . . . . . . . . . . . . . . . . . 20Drivers . . . . . . . . . . . . . . . . . . . . . . . . . . . . . . . . . . . . . . . . . . . . . . . . . . . . . . . . . . . . . . . . . . . . 20Significance of Delay . . . . . . . . . . . . . . . . . . . . . . . . . . . . . . . . . . . . . . . . . . . . . . . . . . . . . . . . . 21Benefits of ATIS . . . . . . . . . . . . . . . . . . . . . . . . . . . . . . . . . . . . . . . . . . . . . . . . . . . . . . . . . . . . . 27Association Between Drivers’ Experiences, Attitudes and Benefits . . . . . . . . . . . . . . . . . . . . . 29Male Versus Female Drivers . . . . . . . . . . . . . . . . . . . . . . . . . . . . . . . . . . . . . . . . . . . . . . . . . . . 33Fargo Versus Moorhead Drivers . . . . . . . . . . . . . . . . . . . . . . . . . . . . . . . . . . . . . . . . . . . . . . . . . 34
CHAPTER 6. FOCUS GROUP RESULTS . . . . . . . . . . . . . . . . . . . . . . . . . . . . . . . . . . . . . . . . . . . . . . 37Follow-Up to Mail Back Survey . . . . . . . . . . . . . . . . . . . . . . . . . . . . . . . . . . . . . . . . . . . . . . . . . 37Importance of Improvements . . . . . . . . . . . . . . . . . . . . . . . . . . . . . . . . . . . . . . . . . . . . . . . . . . . 38Types of ATIS Methods and Information That Would be Useful . . . . . . . . . . . . . . . . . . . . . . . 39Placement of Signs in the Network . . . . . . . . . . . . . . . . . . . . . . . . . . . . . . . . . . . . . . . . . . . . . . . 43
CHAPTER 7. CONCLUSIONS AND RECOMMENDATIONS . . . . . . . . . . . . . . . . . . . . . . . . . . . . . 44Conclusions . . . . . . . . . . . . . . . . . . . . . . . . . . . . . . . . . . . . . . . . . . . . . . . . . . . . . . . . . . . . . . . . . 44Recommendations . . . . . . . . . . . . . . . . . . . . . . . . . . . . . . . . . . . . . . . . . . . . . . . . . . . . . . . . . . . . 45
REFERENCES . . . . . . . . . . . . . . . . . . . . . . . . . . . . . . . . . . . . . . . . . . . . . . . . . . . . . . . . . . . . . . . . . . . . . 46

APPENDIX A. Mail-back Questionnaire Frequency Distribution . . . . . . . . . . . . . . . . . . . . . . . . . . . . . 47
APPENDIX B. Survey Distribution and Response Rates . . . . . . . . . . . . . . . . . . . . . . . . . . . . . . . . . . . . 54
APPENDIX C. Mail-back Survey Comments . . . . . . . . . . . . . . . . . . . . . . . . . . . . . . . . . . . . . . . . . . . . . 57

LIST OF TABLES
Table 5-1. Drivers Avoid HRIs . . . . . . . . . . . . . . . . . . . . . . . . . . . . . . . . . . . . . . . . . . . . . . . . . . . . 23Table 5-2. Categorization of Written Comments . . . . . . . . . . . . . . . . . . . . . . . . . . . . . . . . . . . . . . 26Table 5-3. Relationship Between Drivers Willingness To Turn And Questions
on Attitudes and Experiences . . . . . . . . . . . . . . . . . . . . . . . . . . . . . . . . . . . . . . . . . . . . 30Table 5-4. Correlation Between Drivers’ Attitudes and Drivers That Turn . . . . . . . . . . . . . . . . . . 32Table 5-5. Differences Between Fargo And Moorhead Personal Drivers. . . . . . . . . . . . . . . . . . . . 35Table 5-6. Differences Between Fargo And Moorhead Business Drivers. . . . . . . . . . . . . . . . . . . . 36Table 6-1. How Likely Are Focus Group Participants To Turn . . . . . . . . . . . . . . . . . . . . . . . . . . . 38
LIST OF FIGURES
Figure 5-1. How Long Do You Usually Wait? . . . . . . . . . . . . . . . . . . . . . . . . . . . . . . . . . . . . . . . . . 22Figure 5-2. Should Something Be Done? . . . . . . . . . . . . . . . . . . . . . . . . . . . . . . . . . . . . . . . . . . . . . 24Figure 5-3. How Would The Message Sign Help You? . . . . . . . . . . . . . . . . . . . . . . . . . . . . . . . . . . 27Figure 5-4. Would You Turn Given The Following Wait Times? . . . . . . . . . . . . . . . . . . . . . . . . . . 28Figure 6-1. Changeable Message Sign With Length of Delay . . . . . . . . . . . . . . . . . . . . . . . . . . . . . 39Figure 6-2. Train Warning Sign With Flashing Lights . . . . . . . . . . . . . . . . . . . . . . . . . . . . . . . . . . 40Figure 6-3. Changeable Message Sign With Alternative Routes . . . . . . . . . . . . . . . . . . . . . . . . . . . 41Figure 6-4. In-Vehicle Device . . . . . . . . . . . . . . . . . . . . . . . . . . . . . . . . . . . . . . . . . . . . . . . . . . . . . 42

CHAPTER 1. INTRODUCTION
The purpose of this study is to determine motorists’ preferences and attitudes toward
using advanced traveler information systems (ATIS) at highway-rail intersections (HRIs).
Intelligent Transportation systems which include real-time information for motorists can provide
cost-effective solutions to reducing delay and congestion, as well as improving traffic safety at
highway-rail intersections.
Background
Since transportation budgets in many urban areas are very limited, high cost solutions to
separate rail lines from surface roads (i.e., building underpasses or overpasses) may be infeasible
in many areas. As an alternative, Intelligent Transportation System (ITS) may provide cost-
effective solutions to the problems associated with HRIs. The three ITS components include
train detection, advanced traveler information systems, and advanced traffic signal systems.
Before these new technologies are planned and implemented, it is important to understand user
preferences and attitudes toward using these systems and to incorporate these considerations into
the system design.
Description of the Problem
HRIs confront urban areas with several challenges, which include safety and congestion.
Many small and medium size metropolitan areas, especially in the Midwest region, were
established along rail lines. As they grew around these lines, in the absence of proper land use
policy, these cities became literally divided across the rail lines. Further, that continued growth
has increased traffic levels to overwhelm existing capacity (infrastructure and traffic controls),
especially at HRIs. At the same time, there has been more concentration of rail traffic along

2
fewer lines due to rail abandonments that has further complicated these problems. The railroads’
use of unit trains that exceed one mile in length continues to increase which results in delays
exceeding 10 minutes in some locations, depending on the operating speeds.
There are several problems associated with HRIs such as delays, congestion, disruption of
traffic flow and traffic safety. These problems affect the surface streets leading to and parallel to
the rail lines as spill backs could build quickly due to longer trains and high traffic levels.
Although crashes at rail-highway crossings may not seem very high, they still receive a strong
public and political focus. In addition to auto-train collisions however, unsafe maneuvers by
drivers in the HRI area (i.e., making a U-turn, or trying to squeeze into limited space) result in
more incidents. Motorists are often frustrated by the lack of information on train lengths and the
expected wait time, which often leads to unsafe driving behavior. In addition, the blockage of a
rail crossing when a train is present may hinder effective movement of emergency vehicles.
Description of the Study Area
The Fargo-Moorhead Metropolitan area has a population of just under 150,000 and
encompasses the cities of Fargo and West Fargo, ND and the cities of Moorhead and Dilworth,
MN. There are two major rail lines operated by the Burlington Northern and Santa Fe (BNSF)
that basically divide the area in an east-west direction. The major rail line runs parallel to the
Main Avenue corridor across several north-south streets. Most of the problems are in the
downtown area which additionally experiences inadequate street layout and traffic controls,
further aggravating traffic problems.

3
There are no plans for HRI grade separation for the downtown area in the short to
medium-term. As the metropolitan area continues to grow, traffic congestion and delays
(especially during peak periods) will only get worse. These problems are increasingly receiving
greater attention from motorists and decision makers. As a result, alternative methods to
improve traffic conditions around HRIs such as using ITS, may have a high priority on the
political agenda.
Application of ITS Technologies
The proposed ITS measures will include a train detection system and an advanced
traveler information system (ATIS). Information about the presence, location, and length of a
train is conveyed to a processing point that will in turn send out information to motorists with
approximate delay times and/or information on alternative routes. In addition, an Advanced
Signal Control System would facilitate the movement of diverted motorists to encourage the use
of alternative routes by adopting favorable signal timing plans. The ATIS could use changeable
message signs (CMSs) to deliver the information to motorists at key locations in the corridor
allowing them adequate time to take alternative routes.
Most motorists in the metropolitan area are unfamiliar with ITS technologies. In order
for them to support these concepts, they must be introduced to these systems and be involved
early on in the process of developing and designing alternative ITS systems. It is important to
identify how the motorists would react to this information and the format and methods used in
delivering that information.

4
Importance of Research
Research on understanding users acceptance of ATIS and the underlying factors for
forming that acceptance is still in developmental stages given the short experience with ITS. In
addition, most of the existing studies were conducted in larger urban areas (e.g., Boston) and
dealt with pre-trip travel information services or advisory information. These studies have
generally found only a small portion of motorists (15-20%) actually change their travel routes
based on advisory information. As a result, there is some reluctance about the use of CMSs as a
method of delivering information to motorists en-route.
Theoretically, traffic flow principles support the argument that motorists typically select
routes that minimize their travel times (if they are aware of such routes). However, motorists
choice of a route is usually based on their ‘perceived’ levels of service (such as travel time)
which can vary from the route’s actual levels of service. So it is important to assess motorists
attitudes toward delays associated with HRIs and their potential responses to ATIS.
This study is unique in two aspects: 1) it examines a specific application of information,
i.e., the presence of a train and expected delays at various locations within a corridor and 2) it is
conducted in a relatively small urban area where motorists are familiar with most routes,
including alternative routes, so traveler safety is not a major concern.
Format and Objectives of the Study
The survey was conducted as part of a case study in the Fargo-Moorhead metropolitan
area. The purpose of the survey was to determine the driving public’s attitudes on two main
issues: 1)their perception of the problem with delays at rail crossings and 2) how valuable ITS

5
technologies will be to them in addressing these problems. In order to collect this information
from the users, a survey tool was developed which was augmented with a focus group.
A mail-back questionnaire was developed to determine the user’s perception of the
problem and to provide an assessment of the potential benefits of an ITS solution. A mail-back
format was chosen because it allowed information to be collected from a wide cross section of
the affected driving public. In addition, this format was chosen because the questions could be
fairly straightforward as they relate primarily to the drivers’ experiences and attitudes toward rail
crossings. In order to get an assessment of their attitudes toward ITS solutions in general, one
example of an ITS solution using a CMS was presented as part of the survey. Subsequently,
questions were asked about the potential usefulness of this example ATIS solution.
The purpose of the focus group was to gather additional insights on possible design
alternatives for the ATIS solutions. Many drivers are not familiar with this technology and thus
need to be educated on the applicable options. Therefore, a focus group format was used to
inform the drivers of the alternative methods of ATIS as well as determine which factors affect
the usefulness of various information delivery systems.
Organization
This thesis will begin with a review and discussion of previous related studies which is
provided Chapter 2. Chapter 3 will discuss the methodology used for the mail-back survey.
Chapter 4 will provide the methodology used for the focus groups. The results of the mail-back
survey and focus group will then be presented separately in Chapters 5 and 6 respectively. The
conclusions and recommendations for both the mail-back survey and the focus group will be
presented in Chapter 7.

6
CHAPTER 2. LITERATURE REVIEW
One of the key components to the intelligent transportation infrastructure for this study is
the advanced traveler information systems (ATIS). ATIS can provide real-time information to
motorists that will allow them to respond to the existence of a train at the HRI. It is difficult to
know how the motorists will respond or react to this information. Several studies have been
performed in order to understand the effects that ATIS can have on travel behavior. However,
most of these existing studies were conducted in larger urban areas where ATIS was used to
inform motorists of recurrent congestion or traffic accidents. Thus, this is one of the first studies
performed to understand the users’ attitudes and benefits from ATIS in a relatively small urban
area for a specific application. The following sections provide a brief description of several
studies reviewed to understand the effects ATIS could have on predicted or actual travel
response.
Assessing Consumer Response to ATIS
In March 1997 a symposium was held to assess ATIS effects on travel behavior, travel
patterns and transportation system performance. This symposium involved reports by
representatives of five major ATIS projects on the observed and anticipated effects of their travel
behavior and the transportation network. The results of these studies showed the following(1):
• In a survey of 2,000 users of Boston’s SmarTraveler system, 14 percent of respondents
reported changing the time of departure and 12 percent reported changing their route.
• In a survey of commuters in the Seattle area, 29 to 36 percent of respondents indicated
that traffic messages frequently influence their commute choice.
7
• A survey conducted in the Orlando area as part of an ITS deployment planning study
showed that 20 percent of the respondents would divert from their regular route if a delay
of more than 15 minutes was expected.
These and other surveys and focus group research suggest that many commuters are
unable or unwilling to modify their regular commute habits. In some metropolitan areas,
geographic and topographic features limit the choice of commute routes. In other urban areas,
commuters are reluctant to divert from their customary commute route because they fear getting
lost or feel insecure in unfamiliar territory. Many symposium participants agreed that although
some commuters do act upon the information they receive, there does not appear to be enough of
them to affect the overall network performance.
California Bay Area Commuters
This study investigated the potential en-route traveler response to ATISs by using a
detailed survey of San Francisco Bay area commuters in the Golden Gate Bridge corridor. In
February of 1993, a total of 1,492 individuals were asked about a hypothetical situation of having
an in-vehicle ATIS device giving accurate delay information on the same trip. Twenty-seven
percent of travelers said they would switch to an alternative route when qualitative information is
provided to them. This number increases to 52 percent when quantitative real-time information
for the usual route is provided; 55 percent when predictive information for the usual route is
provided; 58 percent when delay information on the usual route and travel time on the best
alternative route is available; and 61 percent when prescriptive information to take the alternative
route is provided. (2)

8
The responses were based on what the travelers think about having an in-vehicle device
on their last experience with unexpected congestion on their usual route. The actual length of
delay for the majority of these respondents was over 15 minutes. Note that because of the size of
the community and the length of the typical delay, it is difficult to compare these results to a
smaller community where delays are shorter. In addition, the respondents in a smaller
community are much more familiar with the network and thus, much less worried about getting
lost.
Washington D.C. Area Motorists
A survey of more than 500 motorists in the Washington D.C. area was carried out to
assess motorists’ attitudes toward CMSs and in particular, toward possible new kinds of
information that they might display. The study also evaluated if demographic variables have any
effect on motorists’ attitudes. This study asked motorists about their experiences with CMSs that
describe traffic conditions on the freeway. When asked how often the motorists are influenced
by CMSs, half of the survey respondents said often, 38 percent said occasionally and 13 percent
said not at all.(3) Respondents were found to be positively disposed to CMS messages that are
simple, reliable and useful. This study also found that demographic variables appear to have
very little influence on motorist attitudes toward CMSs. Key findings about the content of
variable message signs were as follows:(3)
• The primary concern of motorists is that the traffic information on CMSs be timely and
accurate.

9
• There is support for displaying alternative travel routes in the case of heavy congestion,
but motorists would be reluctant to use such routes for fear of getting lost or encountering
heavy congestion on the alternate route.
• Most motorists wanted to be informed of the delay time caused by congestion, but
opinions differed widely about the form of such estimates.
User Acceptance of ATIS Products and Services
A report prepared by Charles River Associates Incorporated summarizes information
from twelve focus groups that were used to appraise the potential customer acceptance for key
ITS products and services directed at individual consumers. One of the products discussed, in-
vehicle dynamic navigation system, provides some guidance to user preferences about traffic
delays. The study found that real time information about traffic delays – particularly those of a
non-recurrent nature – do have additional value to travelers.(4) However, the existing methods
used to relay this information, such as radio traffic reports, have inherent deficiencies in terms of
timeliness, specificity, and geographical coverage. Focus group participants acknowledged they
were more excited about enhanced up-to-the-minute delay information than they were about
route guidance information. This finding reflected the user’s confidence in their own local
knowledge and abilities to navigate around hold-ups if they have accurate information about the
nature and extent of the problem.
Presenting Descriptive Information in Variable Message Signing
This study in the Netherlands evaluated the effects of presenting descriptive types of
information on variable message signs on route choice and driving behavior. Using driving
simulators, 36 male drivers had to choose between a normal route to a fixed destination, which

10
could have congestion of varying levels, and an alternative route. Information was presented on:
a) length of congestion, b) delays relative to normal travel times, and c) travel times. The
following conclusions were reached (5):
• Providing descriptive information on CMSs results in diversion rates that increase sharply
with levels of congestion, so that they offer a high potential for optimizing traffic streams
to capacities on the intended and alternate routes.
• Reliability of information is much more important when information is provided in terms
of congested miles rather than in delay or travel time estimates. In other words, when
information is given in travel times or delays, divergence is much less affected by the
reliability of the information.
• Driving speed is increased slightly when the CMS indicates congestion on the normal
route.

11
CHAPTER 3. MAIL-BACK SURVEY METHODOLOGY
Objectives of the Mail-Back Survey
The first purpose of the mail-back survey was to determine how significant the problem
of waiting for trains is for area motorists. Several objectives were set to determine the drivers’
current experiences with waiting for or avoiding trains as well as their attitudes toward waiting.
These objectives included determining the following:
• how often the drivers were stopped during a typical week
• how long they typically wait for a train to pass
• what are the traffic conditions most often like in the HRI area
• how often does the driver avoid being stopped by a train, either by planning to use
alternative routes with grade-separated crossings or by turning when they are en-route and
realize an at-grade crossing is blocked.
• how frustrated is the driver with waiting
• does the driver feel the problem is serious enough that some type of improvements should
be made.
The second purpose of the mail-back survey was to determine if drivers felt they would
benefit from information provided to them by the ATIS. Many drivers in the Fargo-Moorhead
area are not familiar with ATIS solutions. Therefore, one proposed ATIS solution using a
changeable message sign was presented to obtain a general idea if ATIS would be valuable to
them. Drivers could benefit from train information in two ways: 1) avoid blocked HRIs to
reduce their travel times and delays, and 2) reduce their frustrations by informing them of
expected delays (peace of mind). The decision to take action and turn in order to divert to an
12
alternative route is based on many factors but mostly the length of delay. Therefore, the
objective was to determine how likely the drivers were to take action based on various wait time
intervals. This objective has important implications in assessing the benefits of the ITS system.
In addition to the two purposes described above, several questions were used to determine
driver and delayed trip characteristics which included: age, gender, employment status, miles
driven per day, trips through downtown per week, and delayed trip purpose. These
characteristics were obtained to see if there is a relationship between the driver’s characteristics
and the driver’s attitudes or the usefulness of the proposed ITS solution.
Mail-Back Survey Design and Format
The mail-back questionnaire was used to collect information from a wide cross-section of
affected motorists. The questionnaire was designed with sixteen closed ended questions and one
open-ended question to allow people to provide input of additional issues that were important to
them. All 17 questions were placed double sided on one 17" by 11'” size sheet and then folded
into a book format so that all four pages of the questionnaire were contained on one sheet of
paper. The questionnaire consisted of:
• Cover letter: brief description of the study, introduction to HRIs delays/safety
concerns, graphical description of ITS application, and contact for further
information.
• Driver/trip characteristics: employment, type of vehicle, average miles driven per
week, age, gender, and willingness to participate in a focus group.
• Driver experience with HRIs: weekly frequency driving in the HRI area, weekly
frequency of stopping at HRI, average wait when stopped at HRI, traffic

13
conditions at HRI while waiting, the type of trip when stopped at HRI, frequency
of avoiding HRIs, and turning away once a train is in sight.
• Driver attitude toward waiting: frustration with waiting at HRI and whether
something should be done to alleviate traffic problems at HRIs.
• Potential value of ITS solutions: how helpful is the information about HRI
blockage.
• Willingness to turn given information on expected delays (1-3 minutes, 4-6
minutes, 7-9 minutes, and over 10 minutes)
A Likert scale was used for many of the questions regarding attitudes and perceived
benefits of the ITS technologies. The Likert scale is a widely used rating scale that requires the
respondents to indicate a degree of agreement or disagreement with each of a series of statements
about the stimulus objects (6). Typically, each question has five response categories, ranging
from “strongly agree” to “strongly disagree”.
Prior to mailing the survey, the questionnaire was pretested to identify any problems in
the questions, clarity of responses, and time requirements to fill out the survey. Three classes at
the College of Business at North Dakota State University (NDSU) were used for pretesting. The
students were also instructed to mark any questions that were not clear to them. In addition,
transportation professionals from the F-M metropolitan area and NDSU faculty in marketing
reviewed the survey and provided valuable comments. As a result, several questions and
response categories were revised.

14
Targeted Motorist Sample
The target population for this study consisted of drivers who utilized the downtown
Fargo-Moorhead area. Nonprobability sampling of the target population was used to determine
the proportion of the sample that gives various responses or expresses various attitudes to waiting
for trains to pass at HRIs. Two distinct categories of drivers were surveyed 1) personal vehicle
drivers who utilize their vehicle to get to or from work, and or for social, recreational and
personal business, and 2) drivers who use their vehicle for business related reasons such as fire,
police, ambulance drivers, UPS and mail delivery personnel, and utility service personnel. The
personal vehicle driver’s group consisted of three subcategories: downtown area employers, the
general public using the downtown area and drivers held waiting at the HRIs. During December
1997 and January 1998, about 1500 questionnaires were distributed to personal vehicle drivers
and business-related drivers who drove in downtown Fargo-Moorhead .
The most effective method for distributing questionnaires was through the downtown
Fargo and Moorhead employers, relying heavily on personal contact between the study team and
the employer and between the employer and the employees. Many employers seemed very
interested in helping because of their familiarity with HRI problems. A total of 47 business
assisted in the distribution of surveys. Personal vehicle driver surveys were distributed to 19
business in Fargo and 13 businesses in Moorhead. In addition, 15 businesses agreed to distribute
surveys to business related drivers in both Fargo and Moorhead. Appendix B shows a list of the
individual businesses that were contacted.
Although most of the personal vehicle drivers’ surveys were distributed through their
employers, some surveys were also distributed to the general public in the downtown area.

15
Copies of the survey were placed at the front desk of the Fargo Public Library so that interested
people could take one. Additionally, surveys were distributed on two separate occasions to
shoppers at the Moorhead Center Mall. A limited number of surveys were also distributed at the
railroad crossing to vehicles held waiting for the train. However, this method was least practical
due to weather restrictions, the irregularity of train intervals, and the labor intensity required to
distribute surveys to a large number of vehicles in a short time period. In addition, surveys were
also distributed to transportation professionals and public officials at several meetings where
transportation topics were discussed.
In order to further people’s awareness of the project, the news media was contacted and
informed about the potential benefits of implementing new technologies to reduce driver
frustration and delay at the at-grade HRIs. An article appeared in the local Fargo-Moorhead
newspaper just prior to the distribution of the survey discussing HRI problems. This article, and
a TV news story which ran several months before the survey, helped inform the public about the
project. This advance knowledge about the project assisted in making people more interested in
completing the questionnaire and probably contributed to higher response rates.

16
CHAPTER 4. FOCUS GROUP METHODOLOGY
Objectives of the Focus Groups
The purpose of the focus group was to gather more in-depth information from the users
about the types of information that they are most interested in receiving, methods of delivery, and
other details related to the ATIS system design. This information can be used in developing more
effective ATIS solutions for the community
The first objective of the focus group was to inform participants about how the ITS
technologies will be used in order to provide information about the trains to the drivers. Also,
the participants needed to be informed of the various ATIS technology options that can be used
to provide information to the motorists. Many people are not familiar with these technologies,
and it is therefore difficult to obtain the information from them without first educating them. It
was also important to establish a common knowledge base among all participants.
The second objective was to determine if the focus group participants would validate the
key findings of the mail-back survey. Therefore, it was important to understand how and why
this is a significant issue for the participants. In addition, it was important to determine if these
participants felt they would benefit from ATIS after they were more informed about the proposed
ITS system.
The third objective was to determine the participants’ preferences for types of delivery
methods as well as their reasons for choosing these methods. Some examples of types of ATIS
methods include CMS, permanent train warning signs with a flashing light, or in-vehicle
navigation devices.
17
The last objective was to determine the types of information that would be most useful,
such as warning of an oncoming train, approximate length of delay, or an alternative grade-
separated route. It was also important to determine the factors which impact the usefulness of the
information such as wait time, traffic conditions on intended route, trip purpose, familiarity with
the routes, length of trip, etc.
Identifying Participants
The mail-back surveys contained a question asking for volunteers who would be willing
to participate in focus groups in the second stage of the study. Over 100 personal and business
related drivers provided their names and phone numbers. After, determining a date and time that
would work best for people and providing a light dinner as incentive, twelve of the volunteers
agreed to participate in the focus group meeting.
A majority of the volunteers’ addresses were found in the local phone directory. The
remaining addresses were obtained by calling the participants. Approximately 20 of these
volunteers were called to determine if a daytime or evening meeting would be more convenient
for them. In addition, a focus group expert was consulted on days of the week and times of the
day they have found to attract the most participants. It was decided that the meeting would be
held on a Tuesday evening between 6:00 and 8:00 p.m.
Typically focus group participants are provided a monetary incentive to participate. For
this focus group meeting, it was decided to provide a light dinner (sandwiches and salads) rather
than a monetary incentive. Therefore it was determined that invitations needed to be given to all
volunteers in order to have enough people for discussion groups of 8 to 12 people. An invitation
letter, an RSVP form and a return envelope were sent to all volunteers.

18
Focus Groups Format
The focus group meeting was held at NDSU’s campus because it is located close to
downtown Fargo-Moorhead and most people in the area are familiar with this facility. The
meeting began with an introduction of the study research team and the participants. Each
participant was asked to provide reasons why the blocked HRIs are a problem for them.
Participants were then informed about problems and potential ATIS solutions at HRIs through:
• A video presentation demonstrating traffic flow and safety problems at a
downtown Fargo HRI.
• A description of how ITS technologies can be used to detect the train, coordinate
traffic signals and provide information to drivers.
• A demonstration of the projected improved traffic conditions when ATIS is
implemented using animated traffic simulation model results (TRAF-CORSIM)
(7). This simulation model clearly showed current traffic flow conditions, as well
as the projected traffic flow after ITS improvements are made.
• Various examples of electronic signs with alternative types of information through
a slide presentation. Information was also provided on the various types of ATIS
technology delivery methods that could be used, such as CMS, in-vehicle
navigation, or warning signals to provide information to the drivers.
Participants were then involved in a discussion about possible ATIS solutions through:
• A discussion on their preferences for types of ATIS delivery methods (warning
sign with flashing light, flashing beacon with train icon, variable message signs,
in-vehicle device).

19
• Discussion on their preferences for types of information (train at rail crossing,
length of delay, closest alternative route).
• Discussion on the placement of signs in the system.
At the completion of the focus group meeting, participants were asked to fill out a
questionnaire about their preferences for alternative ATIS methods and information.
20
CHAPTER 5. RESULTS OF THE MAIL-BACK SURVEY
Out of the 1502 surveys distributed, a total of 535 questionnaires were returned, which
represents a 36 percent response rate. It is important to add that a lower response rate was
obtained from the largest employer in Moorhead which was provided with 300 surveys.
Therefore, if the surveys for this employer were eliminated from the total, the overall response
rate would be 46 percent. Typically mail-back surveys produce response rates between 10 and 20
percent. This higher than normal response rate for a mail-back survey might indicate that people
in the Fargo-Moorhead area have a significant interest in this issue. Out of the 535
questionnaires, 392 were from personal vehicle drivers and 143 were from business related
drivers.
Results of the survey were analyzed using Excel spreadsheets and a statistical computer
program, SAS. The analysis examined the results of the personal vehicle drivers and the
business related drivers. A few of the questions regarding driver characteristics were different
for these two groups; therefore, the analysis was kept separate. In almost all cases, the subgroups
were kept separate for surveys distributed in Fargo versus those distributed in Moorhead, except
for business related drivers that served both areas. Appendix A contains a summary frequency
distribution of the personal and business driver’s questionnaire.
Drivers
About 86 percent of the personal vehicle drivers work full time. Of the total returns, 73
percent of the personal vehicle drivers are delayed at the rail crossing during their trip to or from
work in the downtown area. The three largest categories of delayed trips for business related
21
drivers are: emergency services (40%), providing transportation for customers (24%), and
providing service for customers such as realtors (18%). About 55 percent of the personal vehicle
returns and 80 percent of the business related drivers consisted of male drivers. The driver age
ranged from less than 20 to over 60 years old, with a mean age of approximately 39 years old.
Significance of Delay
Survey responses indicated HRI problems were viewed as a significant issue for drivers
in the downtown area. Numerous written comments were provided by the respondents which
reinforced the impression that reducing delay at the HRIs was important for them.
The first factor used in determining the significance of this issue for the driving public
was the driver’s experiences with rail crossing delays. The drivers’ current experiences were
primarily measured by the frequency of rail crossing delays, typical length of wait, and their
propensity to avoid routes with rail crossing delays.
The largest percentage of personal vehicle drivers, 56 percent, are typically delayed
between 1 and 4 times per week. The second and third largest groups include personal vehicle
drivers that wait between 5 and 9 times per week (20%), and those that are seldom stopped
(15%). Business related drivers tend to drive through the downtown area more often and thus,
tend to be delayed more often than personal vehicle drivers (38 percent are also typically delayed
between 1 and 4 times; 20 percent are delayed between 5 and 9 times; and 22 percent are delayed
between 10 and 19 times per week).

22
The distribution for typical length of wait at the rail crossings is shown in Figure 5-1.
The majority, 51 percent of personal vehicle drivers and 55 percent of business drivers, perceive
their wait to be between 4 and 6 minutes. About 17 percent of personal drivers and 22 percent of
business drivers, perceive their wait to be between 7 and 9 minutes.
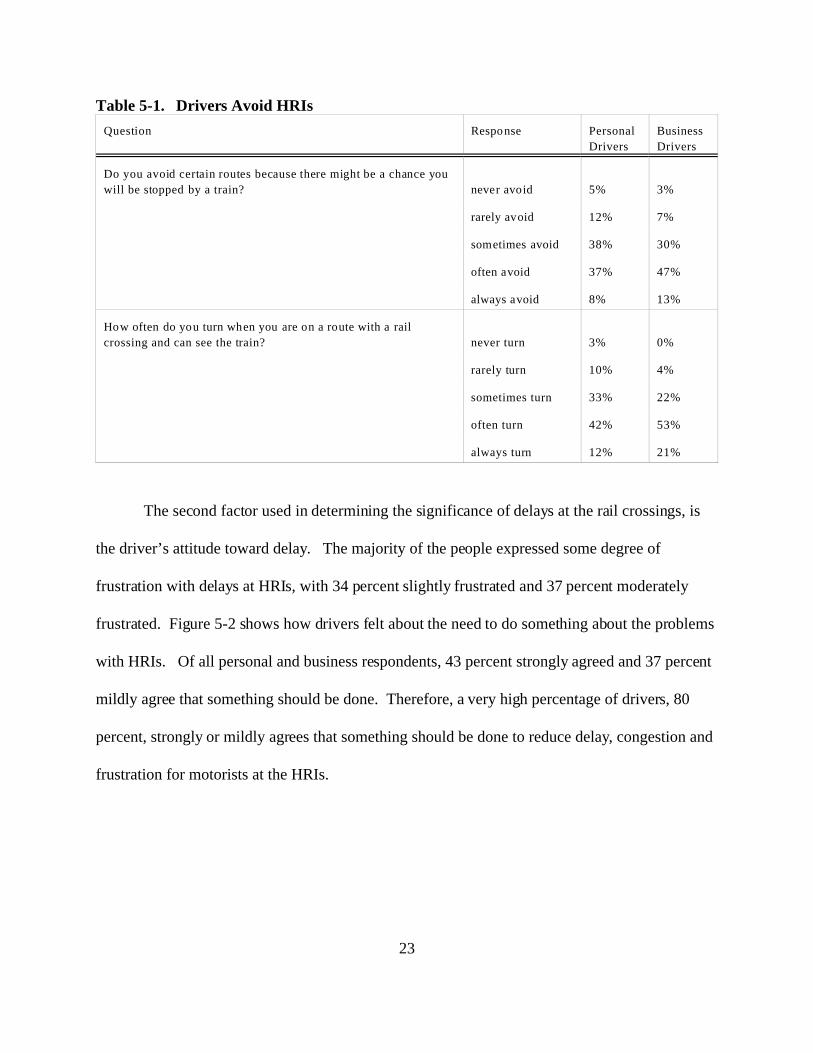
When drivers were asked if they avoid certain routes with at-grade HRIs because there is
a chance that they may be stopped by a train, 37 percent of personal and 47 percent of business
drivers said they would often avoid certain routes with HRIs. In addition, many drivers are
turning when they get close to the HRI and can either see or hear the train. Table 5-1 shows how
drivers typically avoid routes with rail crossings or maneuver around blocked HRIs.
23
Table 5-1. Drivers Avoid HRIs
Question Response Personal
Drivers
Business
Drivers
Do you avoid certain routes because there might be a chance you
will be stopped by a train? never avoid 5% 3%
rarely avoid 12% 7%
sometimes avoid 38% 30%
often avoid 37% 47%
always avoid 8% 13%
How often do you turn when you are on a route with a rail
crossing and can see the train? never turn 3% 0%
rarely turn 10% 4%
sometimes turn 33% 22%
often turn 42% 53%
always turn 12% 21%
The second factor used in determining the significance of delays at the rail crossings, is
the driver’s attitude toward delay. The majority of the people expressed some degree of
frustration with delays at HRIs, with 34 percent slightly frustrated and 37 percent moderately
frustrated. Figure 5-2 shows how drivers felt about the need to do something about the problems
with HRIs. Of all personal and business respondents, 43 percent strongly agreed and 37 percent
mildly agree that something should be done. Therefore, a very high percentage of drivers, 80
percent, strongly or mildly agrees that something should be done to reduce delay, congestion and
frustration for motorists at the HRIs.

24
The third factor used in determining the significance of this issue was the written
comments. Survey respondents were asked to comment on the rail crossing issues or on any
traffic issues in general in the Fargo - Moorhead area. A significant amount, 179 or 33% of the
total respondents provided comments. This high percentage, as well as the content of the
comments, indicate that delay and traffic problems at railroad crossings are an important issue for
many people in this area. The individual personal vehicle and business related drivers’
comments are shown in Appendix C. Here are a few examples of motorists’ comments relating
to the importance of this issue:
• “The trains are a real issue with our decision to push the relocation of our
downtown Fargo business.”
• “I believe signs would definitely help with the traffic downtown and would help
to choose alternative routes.”

25
• “I’m glad someone is working to solve this problem. I am sometimes late for
work because of trains – a major annoyance.”
• “I am glad to see a study being done to try and fix or help this situation. I think it
has been a problem for a very long time.”
• “Fire and medical emergencies do not allow us to wait for trains if at all
possible!”
The respondents’ comments provided very valuable insight into specific rail crossing
issues as well as general traffic issues. The many comments were categorized into groups by
looking for recurring themes. In addition to the comments themselves, this categorization
provides some insight into the significance of the issues being raised in the individual comments.
For example, 12 people provided comments about traffic conditions and signal coordination
issues at the rail crossings. Even though coordination of signals was not addressed in the survey,
many people would like to see improvements in this area. The categories and the number of
comments are shown in Table 5-2.

26
Table 5-2. Categorization of Written Comments
Personal
Business
Rail Crossing Issues/Concerns
1. Railroad crossing needs to be addressed/Message sign is a good idea 44
2. Trains are especially a problem during peak times 14
3. Traffic problem issues at railroad crossings 12
4. Concerns about alternative routes 29
5. Railroad tracks should be relocated 5
6. Train horns are a problem 8
7. Other railroad comments 38
8. Rail crossings are not a concern/Message sign will not help 19
Other Traffic Related Issues In The Fargo-Moorhead Area
1. Improvements to signals or turning lanes 14
2. Specific corridor problems 12
3. Maintenance and other issues 15
Total 210
*Note that several people provided comments on more than one category, therefore, the total isslightly higher than the total number of people providing comments.

27
Benefits of ATIS
The second main purpose of the mail-back survey was to determine if drivers felt that
they would benefit from having information about the closed crossing. Two main questions
were asked using an example blocked HRI, in which motorists would be informed about the
length of delay through a CMS. Responses for these two questions were very similar for
personal and business drivers.
The first question was designed to first see if people would benefit by either simply
having information about the train delay or by taking action and turning in order to divert to an
alternative route. Figure 5-3 shows that 97 percent of the personal and business respondents feel
they would benefit in some way from ITS improvements. Four percent of the drivers felt they
would benefit from knowing the train was present, but would probably not take action.
However, 46 and 27 percent of respondents might or definitely would divert to an alternative
route (a total of 73 percent).

28
When asked more specifically if drivers would benefit by taking action and diverting to
an alternative route, for various delay time intervals, both personal and business drivers had very
similar responses. Figure 5-4 shows that for a 4 to 6 minute wait, 43 percent of all drivers might
or definitely would stay and 43 percent might or definitely would turn. For wait times over 6
minutes, the majority of drivers feel they would turn. In the 7 to 9 minute wait category, 84
percent either might or definitely would turn, and in the 10 to 12 minute category, 93 percent
either might or definitely would turn.

29
Association Between Drivers’ Experiences, Attitudes and Benefits
Several associations were found between those drivers who are willing to turn in the 4 to
6 minute category and their experiences and attitudes. Stronger associations were probably
found in the 4 to 6 minute range because such a large percentage of drivers are either not willing
to turn in the 1 to 3 minute category or are willing to turn in the 7 to 9 and 10 to 12 minute
categories. In addition, the 4 to 6 minute range is a primary concern because it was considered
the typical wait time.
A chi square test was performed to determine the statistical relationship between
frequencies of responses to questions. The chi square value was calculated using equation 5-1
(Elzey, 1971). The chi square value is compared to the critical chi square for degrees of freedom
of (number of rows - 1)(number of columns - 1), and P = .01. If the chi square value is greater
than the critical chi square, the null hypothesis is rejected, and the association between
frequencies of responses to questions is significant.
Equation (5-1)
where
O = observed frequency
E = expected frequency determined by

30
Several hypotheses were made at the outset of the study to examine conditions between
drivers experiences and attitudes and how they would benefit from the ITS solution. Table 5-3
shows the questions that were tested for a positive relationship to the driver’s willingness to turn
in the 4 to 6 minute interval. The resulting chi square and associated probabilities between
responses are also shown.
Table 5-3. Relationship Between Drivers Willingness To Turn And Questions On AttitudesAnd Experiences
Association to: Given a 4 - 6 minute wait, do you
think you would stay on your intended route or turn
and take an alternative route?
Personal Drivers Business Drivers
Question
Chi
Square
P Chi
Square
P
How many times do you stop at HRIs? 24.33 .08 15.74 .47
How many minutes do you usually wait? 22.24 .14 24.14 .09
How heavy is the traffic as you approach the HRI? 22.39 .13 18.58 .29
What is your attitude toward waiting? 62.25 .00 24.19 .08
Do you avoid routes with HRIs? 48.05 .00 33.07 .01
Do you currently turn when you can see the HRI is
blocked?
97.87 .00 48.38 .00
Do you think something should be done to improve
conditions at HRIs?
8.50 .39 22.89 .12
Critical Chi Square 37.57 .01 37.57 .01
*Shaded areas indicate significant relationships between the driver’s willingness to turn in the 4 to 6 minute interval
and the stated question.
After inspecting the data a positive association was found between the personal driver’s
frustration and willingness to turn given a 4 to 6 minute wait. This is evidenced by a chi square
of 62.25 which is significantly higher than the critical chi square of 37.57. This substantiates that

31
these two variables are highly related for the personal drivers. For example, Table 5-4 indicates
that of the personal drivers that are not at all frustrated with waiting, 26 percent might or
definitely would turn given a 4 to 6 minute wait. Meanwhile, of the personal drivers that are
extremely frustrated with waiting, 62 percent might or definitely would turn given a 4 to 6
minute wait. However, the chi square test did not support similar relationships for the business
drivers.
It was expected that there would also be a positive association between people who think
something should be done to improve conditions and people who are more likely to benefit from
ATIS by turning in the 4 to 6 minute category. However, the chi square test did not show these
two variables to be highly related. This may be because such a significant number of drivers
believe something should be done, even among drivers that are less likely to turn in the 4 to 6
minute interval.

32
Table 5-4. Correlation Between Drivers’ Attitudes and Drivers That Turn
Proportion of drivers that might or definitely
would turn for 4 to 6 minute wait
Attitude Questions Response Personal
Drivers
Business
Drivers
What is your attitude towards waiting for trains to pass at
railroad crossings? not at all frustrated 26% 33%
slightly frustrated 28% 60%
moderately frustrated 46% 51%
very frustrated 47% 57%
extremely frustrated 62% 88%
Do you avoid routes with HRIs? never avoid 25% 50%
rarely avoid 25% 50%
sometimes avoid 30% 42%
often avoid 49% 61%
always avoid 61% 68%
How often do you currently turn? never turn 0% 0%
rarely turn 16% 0%
sometimes turn 28% 35%
often turn 50% 55%
always turn 56% 90%
The chi square test also showed that personal and business drivers who avoid routes with
HRIs are more likely to benefit from a changeable message sign. For example, of personal
drivers that always avoid routes with at-grade HRIs, 61% feel they might or definitely would
turn. In contrast, of personal drivers that rarely avoid routes with at-grade crossings, only 24%
feel they might or definitely would turn given a 4 to 6 minute wait. As expected there is a very
strong relationship between drivers that currently turn and drivers that are willing to turn when
information is provided to them through ATIS.

33
It is interesting to note that no significant association was found between the frequency or
length of typical wait and the likelihood that the drivers will turn and take an alternative route.
Male Versus Female Drivers
A few differences were found in the responses between the male and female personal
vehicle drivers. Differences in responses by gender for the personal vehicle drivers are only
included in the following discussion because business related drivers were predominately male
(80%). Male drivers tend to feel they experience train delays more often. For example, 23
percent of males versus 18 percent of females wait between 5 and 9 times per week and 8 percent
of males versus 3 percent of females wait between 10 and 14 times per week.
Male drivers also responded that they would turn and take an alternative route more often
than females. This can be shown by the amount of drivers that would turn given information
about a 4 to 6 minute wait (43 percent of male drivers versus 34 percent of female drivers believe
they might or definitely would turn in this category). It is interesting that although more male
drivers are willing to take action, a higher percentage of female drivers (82 %) than male drivers
(78%) believe that something should be done to improve conditions at the HRIs.

34
Fargo Versus Moorhead Drivers
There are a few differences between the experiences and attitudes of the Moorhead
drivers and the Fargo drivers. Moorhead drivers tend to stop slightly more often, believe the
traffic is heavier, and feel more strongly about the need to improve conditions at the HRI. In
addition, drivers in Moorhead tend to turn slightly more often when they encounter a blocked
HRI. The shaded areas in Tables 5-5 and 5-6 show where the experiences are more frequent and
the attitudes are stronger about HRIs, for Moorhead drivers. This finding makes sense because
the city of Moorhead has fewer grade-separated routes than the city of Fargo.
It is interesting to note that while there were some differences in the attitudes and
experiences between Moorhead and Fargo drivers, the percent of drivers that will benefit from
the ATIS are almost the same. The following responses were found to the question asking
drivers if they would benefit from ATIS, given a 4 to 6 minute wait.
• 21 percent of Fargo drivers and 19 percent of Moorhead personal drivers might turn.
• 18 percent of Fargo drivers and 16 percent of Moorhead personal drivers would definitely
turn.
• 29 percent of Fargo drivers and 20 percent of Moorhead business drivers might turn.
• 31 percent of Fargo drivers and 37 percent of Moorhead business drivers would definitely
turn.

35
Table 5-5. Differences Between Fargo And Moorhead Personal Drivers.
Question Percent Frequency
Fargo Moorhead Difference
How many times do you stop at an HRI?
seldom 15 14 1
1 to 4 times per week 62 44 18
5 to 9 times per week 16 28 -12
10 to 14 times per week 6 11 -5
15 to 20 times per week 2 3 -1
over 20 times per week 0 0 0
How heavy is the traffic when you approach an HRI?
not heavy at all 7 4 3
slightly heavy 30 19 11
moderately heavy 47 56 -9
very heavy 13 18 -5
extremely heavy 0 2 -2
Do you think something should be done to reduce delay and
frustration at the HRIs?
strongly agree 38 55 -17
mildly agree 40 30 10
neither agree nor disagree 13 9 4
mildly disagree 4 3 1
strongly disagree 5 3 2
When you are on a route with a blocked HRI, how often do you
turn?
never 3 3 0
rarely 12 1 11
sometimes 31 39 -8
often 40 46 -6
always 13 11 2

36
Table 5-6. Differences Between Fargo And Moorhead Business Drivers.
Question Percent Frequency
Fargo Moorhead Difference
How many times do you stop at an HRI?
seldom 10 3 7
1 to 4 times per week 43 20 23
5 to 9 times per week 24 23 1
10 to 19 times per week 19 31 -12
20 to 29 times per week 2 17 -15
30 to 40 times per week 2 3 -1
over 40 0 3 -3
How heavy is the traffic when you approach an HRI?
not heavy at all 5 0 5
slightly heavy 31 20 11
moderately heavy 64 66 -2
very heavy 0 14 -14
extremely heavy 0 0 0
Do you think something should be done to reduce delay and frustration
at the HRIs?
strongly agree 40 51 -11
mildly agree 33 37 -4
neither agree nor disagree 21 3 18
mildly disagree 2 0 2
strongly disagree 2 9 -7
When you are on a route with a blocked HRI, how often do you turn?
never 0 0 0
rarely 5 3 2
sometimes 24 17 7
often 50 60 -10
always 21 20 1

37
CHAPTER 6. FOCUS GROUP RESULTS
A focus group was conducted with 12 participants to discuss ATIS delivery methods and
types of information that would be most useful. Approximately half of the participants were
business drivers and half were personal vehicle drivers. The drivers ages ranged from 20 to over
60. All but one driver was male. The participants were extremely ready to talk and give their
opinion on the ATIS methods that were presented to them.
Follow-Up to Mail Back Survey
The drivers were shown a traffic simulation model which demonstrated the traffic
conditions at the railroad crossing before and after ITS improvements were made. The
simulation was shown for a total of five minutes. After the simulation, the participants were
asked to fill out a questionnaire asking how likely they would be to turn given the fact they
would be provided with the information on the five minute train delay. This question was asked
to see how differently they answered when comparing it to a similar question on the mail-back
survey. The question on the mail-back survey asked about the likelihood of turning assuming a
changeable message sign shows a 4 to 6 minute wait. Table 6-1 shows how the same 12
participants answered the duplicate questions. In the mail-back survey, 34 percent of the
participants felt they might or definitely would turn. Whereas, after watching the simulation, 84
percent of the participants felt they might or definitely would turn. These results show that
people felt they were much more likely to turn after they watched the simulation. This could be
due to the fact that 5 minutes feels much longer when you actually experience it versus simply
reading the interval on a questionnaire.

38
Table 6-1. How Likely Are Focus Group Participants To Turn
How likely are you to turn? Mail-Back Survey
4 to 6 minute wait
Focus Group
5 minute simulation
Definitely Stay 17% 0%
Might Stay 33% 17%
Not Sure 17% 0%
Might Turn 17% 42%
Definitely Turn 17% 42%
Importance of Improvements
The participants stressed the importance of improving conditions at the rail crossings
especially for those who work in the downtown area. The main reasons stated for wanting
improvements included delays, traffic problems, and safety. The participants were especially
cognizant of the cost of building additional underpasses and felt that providing a lower cost
alternative such as ITS was much more preferable in most cases.
The participants have developed their own methods to avoid having to sit and wait for the
trains. Some of these methods include: knowing the approximate schedules during the work day
so they can plan their day around the trains; watching the speed of the trains in order to determine
about how long the delay will be; watching or listening for the trains as they get close to the
crossings and then trying to turn; and taking alternative routes to avoid the chance of being
stopped altogether.

39
Types of ATIS Methods and Information That Would be Useful
The participants were shown various examples of types of ATIS methods and information
that could be provided to them. The most preferred ATIS delivery method and type of
information discussed by the group was a changeable message sign that would display the length
of delay in a simple format. Figure 6-1 shows the example shown to the participants that
displays the delay information. The participants felt that information on length of delay would
help: drivers make smarter decisions in taking alternative routes, reduce driver frustration, reduce
unsafe maneuvers and accidents, and reduce travel time which would increase productivity.
Figure 6-1. Changeable Message Sign With Length Of Delay.

40
The participants discussed two other methods that they felt would also be somewhat
helpful. One method could consist of a flashing light attached to a permanent train warning sign.
This method would simply inform drivers that a train is passing through and the crossing is
currently blocked. The flashing light had some appeal because it is simple and is a lower cost
alternative to the changeable message sign. This method would be helpful for drivers who travel
through downtown frequently and could then consider rerouting their trip. Figure 6-2 shows the
example shown to the participants that uses the flashing light on a permanent train warning sign.
Figure 6-2. Train Warning Sign With Flashing Lights

41
A changeable message sign with information on alternative routes was also found to have
some merit. Fargo-Moorhead is an area with significant growth and has many visitors from
surrounding communities. Thus, it would be good to provide these people who are not as
familiar with the area with information on alternative routes. However, providing information on
alternative routes would require additional changeable and fixed signs in order to effectively
guide visitors. Therefore, the participants felt this may not be the most efficient use of resources
due to the additional cost of providing this information. In addition, in order to improve traffic
conditions, not all drivers will need to turn and take an alternative route. Figure 6-3 shows the
example shown to the participants that displays information on alternative routes.
Figure 6-3. Changeable Message Sign With Alternative Route.

42
The participants were somewhat less interested in having the information provided to
them through an in-vehicle device. Perhaps this was because they would need to pay for the
device and they are even less familiar with in-vehicle technology. Figure 6-4 shows the example
on an in-vehicle device shown to the participants. This device does not specifically show
information on a train, however, it was explained to the participants that this type of information
could be presented in a number of ways in the vehicle.
Figure 6-4. In-Vehicle Device.

43
Placement of Signs in the Network
Participants felt the signs should be placed in the busiest traffic corridors. The number of
signs will depend on the cost efficiency and thus, it is probably not cost effective to place them in
all corridors. The participants indicated that signs should be placed several blocks away from the
crossing to allow motorists enough time to turn and take an alternative route. It would not be
helpful to place the sign where the driver can already see the train. All participants felt the signs
should be connected to the traffic signal because they would be easier to notice.
44
CHAPTER 7. CONCLUSIONS AND RECOMMENDATIONS
Conclusions
The results of this survey process indicate that waiting for trains at HRIs is a serious
concern for most drivers in the downtown areas. These findings further demonstrate that
motorists in this medium sized community will clearly benefit from having information provided
to them through some type of ATIS. The first indicator of the driver’s concern was the interest
the study team received from the downtown employers in assisting with the survey as well as the
higher than normal response rate for the mail-back survey. People seemed genuinely interested
in participating in a study which could help make some improvements to this problem.
The mail-back survey showed that the average driver is stopped at least once per week,
and waits between four and six minutes for a train to pass. Drivers seem to be so frustrated with
waiting for trains that they are willing to use various methods to avoid being stopped. The mail-
back survey indicates that 74 percent of the business-related drivers either often or always try to
turn when they get close to the crossing and can see the train coming through. Emergency
personnel stated that they are concerned about the number of unsafe maneuvers that they see at
the crossings. Drivers have indicated that they are generally frustrated with waiting, and in fact,
80 percent of all drivers either mildly or strongly agree that something should be done to reduce
delay, congestion and frustration for motorists at the HRIs.
A significant number of drivers believe they would benefit in some way from having
information provided to them about the presence or length of a train delay. Results from the
mail-back survey indicate that in general, 97 percent of the people would either benefit by simply
having their expectations managed or by actually taking action and turning to take an alternate

45
route. The results further indicate that enough people are willing to turn in the 4 to 6 minute
interval which could impact the overall system performance. Once delays become longer than 6
minutes, almost all drivers are willing to take alternative routes to avoid the wait at HRIs.
The focus group participants indicated that receiving information about the length of the
train delay is as important as knowing the train is present. This information would help them
make smarter decisions about taking alternative routes, reduce their frustration while waiting,
and help reduce unsafe maneuvers and accidents. This information will also help reduce their
travel time which is especially important for the many people who are driving either to or from
work or who are traveling for business related purposes.
Recommendations
The findings of this study can be used to support the implementation of an ITS system.
The information can be used by the decision makers of the City of Moorhead ITS project in
determining if and what kind of information about the trains should be provided to the motorists.
This information can also be utilized for future cost benefit studies in order to help justify the
costs of implementation. Benefits can be quantified from the predicted travel time savings from
those drivers that feel they are willing to take an alternative route. In addition, operating cost
savings will be realized by those drivers. One benefit that is difficult to quantify, but should not
be overlooked, is the ability of ATIS to manage the drivers expectations.
Once the ATIS is implemented in the Fargo-Moorhead area, another survey similar to this
study should be performed to determine how drivers would actually respond to the system once it
is complete. This information can then be used to determine the actual benefits that are realized
by the motorists and whether the system is meeting the user needs.

46
REFERENCES
1) Orski, Kenneth C., Assessing Consumer Response to Advanced Traveler Information Systems: Symposium Summary, Institute of Transportation Engineers, October 1997.
2) Polydoropoulou, Amalia, and Moshe Ben-Akiva, Asad Khattak, and Geoffrey Lauprete,Modeling Revealed and Stated En-Route Travel Response to Advanced Traveler InformationSystems, Transportation Research Record 1537, TRB, National Research Council, Washington,D.C., 1996.
3) Benson, G. Brien, Motorist Attitudes About Content of Variable-Message Signs,Transportation Research Record 1550, TRB, National Research Council, Washington, D.C.,1996.
4) User Acceptance of ATIS Products and Services: A report of qualitative research., preparedby Charles River Associates Incorporated for US Department of Transportation systems JointProgram Office & Volpe National Transportation Systems Center, January 1997.
5) Janssen, Wiel, and Richard Van der Horst, Presenting Descriptive Information in VariableMessage Signing, Transportation Research Record 1403, TRB, National Research Council,Washington, D.C., 1993.
6) Malhotra, Naresh K., Marketing Research An Applied Orientation, Prentice Hall, EnglewoodCliffs, New Jersey, 1993.
7) Schulz, Lance Allen, Application of ITS at Railroad Grade Crossings, Upper Great PlainsTransportation Institute, North Dakota State University, Fargo, North Dakota, 1998.
8) Dillman, Don A., Mail and Telephone Surveys The Total Design Method, John Wiley & Sons,Inc., 1978. 9) Rama, Pirkko and Juha Luoma, Driver Acceptance of Weather-Controlled Road Signs andDisplays, Transportation Research Record 1573, TRB, National Research Council, Washington,D.C., 1997.
10) Campbell, John L., Rhonda A. Kinghorn and Barry H. Kantowitz, Driver Acceptance OfSystem Features in an Advanced Traveler Information System (ATIS), Battelle, Human FactorsTransportation Center, Seattle, WA.

47
APPENDIX A
Mail-back Questionnaire Frequency Distribution

48
Mail-Back Questionnaire: Personal Vehicle Driver ResponsesPercent Frequency
Officials Total
Response and Personal
Question Choices Fargo Moorhead Tranps. Drivers
1. During an average week, about how often do you drive through seldom 1 1 0 1
downtown Fargo or Moorhead 1 to 4 9 10 0 8
5 to 9 8 15 12 10
10 to 14 38 25 30 34
15 to 20 29 27 33 29
over 20 16 22 24 18
2. During an average week, about how many times do you have seldom stopped 15 14 12 15
to stop and wait for a train? 1 to 4 62 44 48 56
5 to 9 16 28 36 20
10 to 14 6 11 0 7
15 to 20 2 3 3 2
over 20 0 0 0 0
3. About how many minutes do you usually wait at a rail crossing? seldom stopped 6 2 9 5
1 to 3 21 12 27 19
4 to 6 51 56 42 51
7 to 9 17 18 15 17
10 to 12 3 11 6 5
over 12 2 0 0 1
4. How heavy is the traffic on the streets when you typically not heavy at all 7 4 12 7
approach a rail crossing? slightly heavy 30 19 27 27
moderately heavy 47 56 45 49
very heavy 13 18 15 14
extrememly heavy 0 2 0 1
5. What type of trip are you most often making when you are work 76 66 70 73
stopped for a train at a rail crossing? shopping 6 8 9 7
school 1 1 6 1
social/recreation 5 10 3 6
personal business 7 11 6 8
other 0 2 3 1
seldom stopped 4 1 0 3
6. Which of the following best describes your attitude towards not frustrated 12 10 3 11
waiting for trains to pass at rail crossings? slightly frustrated 33 32 36 33
moderately frustrated 35 31 33 34
very frustrated 13 17 21 15
extrememly frustrated 6 9 6 7
7. Do you avoid certain routes because there might be a chance never 7 2 0 5
you will be stopped by a train? rarely 14 8 9 12
sometimes 35 49 27 38
often 36 33 52 37
always 8 8 12 8
8. When you are on route with a rail crossing and can see a train never 3 3 0 3
passing through, how often to you turn and take an rarely 12 1 12 10
alternate route? sometimes 31 39 33 33
often 40 46 45 42
always 13 11 9 12

49
9. In general, do you think something should be done to reduce strongly agree 38 55 52 43
driver delay and to reduce driver frustration at rail crossings? mildly agree 40 30 24 36
neither agree nordisagee
13 9 18 12
mildly disagree 4 3 0 3
strongly disagree 5 3 6 5
10. How do you think the message sign would help you? not help 3 5 0 4
good to know but stay 5 4 9 5
might stay 5 5 3 5
not sure 13 13 15 13
might turn 47 49 39 47
definitely turn 27 23 33 27
11a. Given a 1 - 3 minute wait, do you think you would stay on definitely stay 58 65 58 59
your intended route or turn and take an alternate route? might stay 33 23 33 30
not sure 2 4 0 2
might turn 4 1 6 3
definitely turn 1 3 3 2
11b. Given a 4 - 6 minute wait, do you think you would stay on definitely stay 11 13 6 11
your intended route or turn and take an alternate route? might stay 35 39 45 36
not sure 12 8 9 11
might turn 21 19 6 20
definitely turn 18 16 33 19
11c. Given a 7 - 9 minute wait, do you think you would stay on definitely stay 2 1 0 2
your intended route or turn and take an alternate route? might stay 2 9 0 4
not sure 5 10 18 7
might turn 21 15 15 19
definitely turn 67 57 67 65
11d. Given a 10 - 12 minute wait, do you think you would stay on definitely stay 1 1 0 1
your intended route or turn and take an alternate route? might stay 2 1 0 1
not sure 0 2 3 1
might turn 5 8 9 6
definitely turn 88 82 88 87
12. What is your age? Less than 20 0 0 0 0
20 - 29 21 15 15 19
30 - 39 27 28 18 27
40 - 49 28 28 45 29
50 - 59 17 18 9 17
over 60 5 10 12 7
13. What is your gender? Male 51 61 64 55
Female 49 38 36 45
14. Which of the following categories best describes your employed full time 88 78 91 86
employment status? employed part time 7 9 3 7
working at home for pay 0 1 0 1
looking for work 0 0 0 0
homemaker 1 1 0 1
student 1 2 3 2
retired 2 8 3 3
other 0 0 0 0

50
15. On an average weekday about how far do you drive? 1 - 4 miles per day 12 8 9 10
5 - 9 miles per day 31 29 21 30
10 - 14 miles per day 24 13 18 21
15 - 19 miles per day 11 12 21 12
20 - 24 miles per day 7 10 15 8
over 25 miles per day 14 28 15 18
16. Would you be willing to participate in an hour-long session to unable to participate 77 70 61 74
discuss the types of improvements that could be made? able to participate 14 26 24 18
Number of respondents in subgroups 266 93 33 392

51
Mail-Back Questionnaire: Business Related Driver ResponsesPercent Frequency
Both Total
Response Fargo & Business
Question Choices Moorhead Fargo Moorhead Drivers
1. During an average week, about how often do you drive through seldom 0 2 0 1
downtown Fargo or Moorhead 1 to 4 8 7 0 6
5 to 9 6 10 6 7
10 to 19 29 17 17 22
20 to 29 9 29 11 15
30 to 40 5 12 17 10
over 40 44 24 49 39
2. During an average week, about how many times do you have seldom stopped 11 10 3 8
to stop and wait for a train? 1 to 4 44 43 20 38
5 to 9 15 24 23 20
10 to 19 18 19 31 22
20 to 29 8 2 17 8
30 to 40 2 2 3 2
over 40 3 0 3 2
3. About how many minutes do you usually wait at a rail crossing? seldom stopped 5 2 3 4
1 to 3 14 26 14 17
4 to 6 59 50 54 55
7 to 9 21 21 26 22
10 to 12 2 0 3 1
over 12 0 0 0 0
4. How heavy is the traffic on the streets when you typically not heavy at all 9 5 0 6
approach a rail crossing? slightly heavy 20 31 20 23
moderately heavy 56 64 66 61
very heavy 11 0 14 8
extrememly heavy 3 0 0 1
5. What type of trip are you most often making when you are product deliveries 0 2 0 1
stopped for a train at a rail crossing? mail deliveries 2 2 0 1
service for customers 26 10 14 18
providing transportation 44 5 9 24
repair/maintenance 0 2 9 3
emergency services 23 55 54 40
other 5 19 14 11
seldom stopped 2 2 0 1
6. Which of the following best describes your attitude towards not frustrated 9 5 3 6
waiting for trains to pass at rail crossings? slightly frustrated 35 48 17 34
moderately frustrated 42 36 57 44
very frustrated 9 5 17 10
extrememly frustrated 5 7 6 6
7. Do you avoid certain routes because there might be a chance never 3 5 0 3
you will be stopped by a train? rarely 8 10 3 7
sometimes 26 26 43 30
often 47 50 43 47
always 17 10 11 13
8. When you are on route with a rail crossing and can see a train never 0 0 0 0
passing through, how often to you turn and take an rarely 5 5 3 4
alternate route? sometimes 23 24 17 22
often 52 50 60 53
always 21 21 20 21

52
9. In general, do you think something should be done to reduce strongly agree 39 40 51 43
driver delay and to reduce driver frustration at rail crossings? mildly agree 39 33 37 37
neither agree nor disagee 17 21 3 15
mildly disagree 2 2 0 1
strongly disagree 3 2 9 4
10. How do you think the message sign would help you? not help 0 2 0 1
good to know but stay 3 2 3 3
might stay 9 7 9 8
not sure 21 14 6 15
might turn 45 36 49 43
definitely turn 18 38 34 28
11a. Given a 1 - 3 minute wait, do you think you would stay on definitely stay 44 36 34 39
your intended route or turn and take an alternate route? might stay 41 52 49 46
not sure 6 0 3 4
might turn 5 2 3 4
definitely turn 3 10 9 6
11b. Given a 4 - 6 minute wait, do you think you would stay on definitely stay 5 2 6 4
your intended route or turn and take an alternate route? might stay 30 26 26 28
not sure 5 10 11 8
might turn 20 29 20 22
definitely turn 33 31 37 34
11c. Given a 7 - 9 minute wait, do you think you would stay on definitely stay 2 0 0 1
your intended route or turn and take an alternate route? might stay 3 5 3 4
not sure 8 2 6 6
might turn 15 17 17 16
definitely turn 65 74 74 70
11d. Given a 10 - 12 minute wait, do you think you would stay on definitely stay 0 0 0 0
your intended route or turn and take an alternate route? might stay 5 0 0 2
not sure 0 0 0 0
might turn 3 10 6 6
definitely turn 86 88 94 89
12. What type of buisness do you work for? Hospital/Medical office 8 2 0 4
Community (fire, police) 18 74 89 52
Manuf./Construction 0 0 0 0
Public Utility 0 2 6 2
Transportation provider 44 0 0 20
Real Estate/Finance 20 5 0 10
Mail or Product Delivery 0 0 0 0
Other 11 17 6 11
13. What type of vehicle do you use for business related trips? Passenger Car 32 62 71 50
Van 15 2 0 8
Bus 23 0 0 10
Light Truck 23 7 9 15
Heavy Truck 8 29 20 17
14. On an average weekday about how far do you drive for 1 - 4 miles per day 2 5 6 4
business? 5 - 9 miles per day 5 10 11 8
10 to 14 miles per day 5 10 3 6
15 to 19 miles per day 5 7 6 6
20 to 24 miles per day 9 7 6 8
over 25 miles per day 76 62 69 70
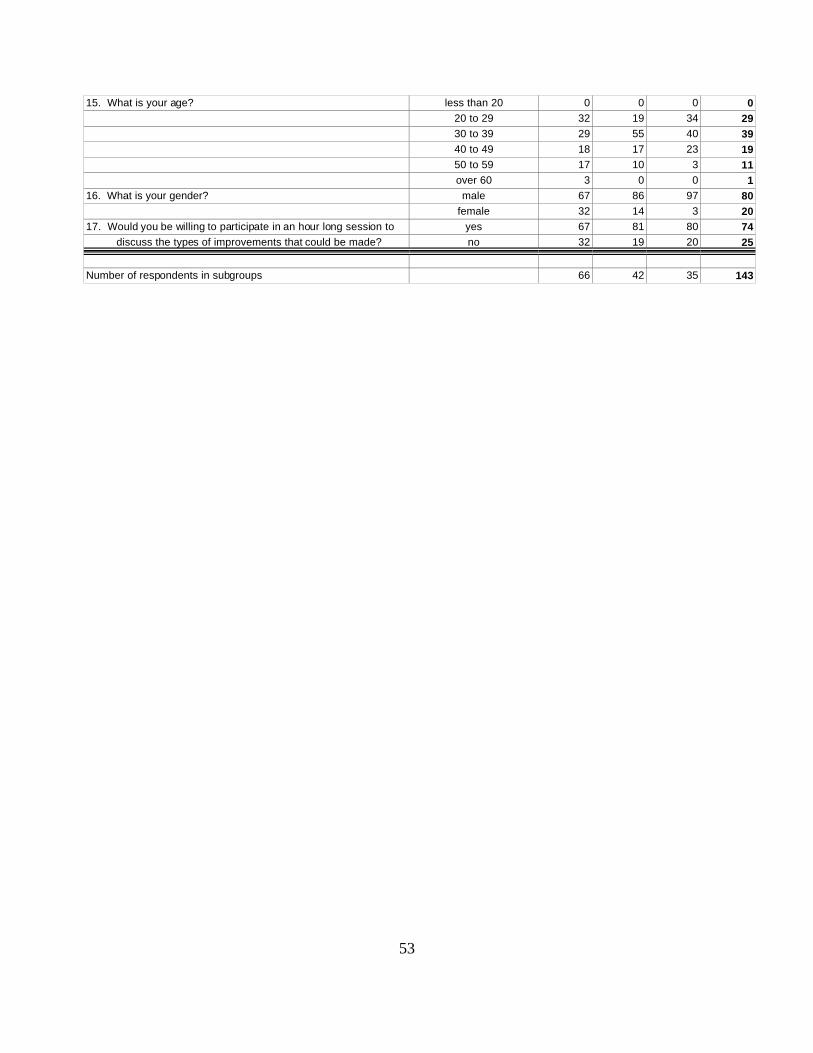
53
15. What is your age? less than 20 0 0 0 0
20 to 29 32 19 34 29
30 to 39 29 55 40 39
40 to 49 18 17 23 19
50 to 59 17 10 3 11
over 60 3 0 0 1
16. What is your gender? male 67 86 97 80
female 32 14 3 20
17. Would you be willing to participate in an hour long session to yes 67 81 80 74
discuss the types of improvements that could be made? no 32 19 20 25
Number of respondents in subgroups 66 42 35 143
54
APPENDIX B
Survey Distribution and Response Rates

55
Personal Vehicle Driver's Survey Distribution and Response Rate
Name Address Surveys Surveys Response Distributed Returned Rate
I. Fargo Personal Vehicle DriversEmployers
1 hearland trust company 120 8th st S
2 united way/community resources 219 7st S
3 neuropsychiatric research institute 700 1st ave S
4 precision marketing 15 8th st S
5 mexican village restaurant 814 main ave
6 fargo park district 701 main ave
7 northwest bank 406 main
8 mid american steel 92 NP avenue
9 gate city federal 500 2nd ave N
10 the forum 101 5th st N
11 prairie public television 207 5th st N
12 professional management associates 109 1/2 broadway
13 dain bosworth inc 74 broadway
14 state bank of fargo 51 broadway
15 merrill lynch 51 broadway
16 smith barney 23 broadway
17 northern school supply np ave and 8th st
18 dawson insurance 721 1st ave
19 ITS meeting (NavTech employees)
449
General Public/ Other
20 fargo public library 102 3rd st N
21 4th ave railcrossing 4th ave
130
Total Fargo Personal Vehicle Drivers 579 266 46%
II. Moorhead Personal Vehicle DriversEmployers
1 city of moorhead 500 center ave
2 moorhead insurance 501 main
3 state farm insurance 725 center avenue4 viking bank 1001 center ave
5 moorhead chamber of commerce 725 center avenue6 farmer's insurance group 19 4st S
7 american federal bank 602 center ave
8 bluecross blue shield 813 center ave
9 minnesota technology 725 center avenue10 first bank 403 center ave
11 edward jones 725 center avenue12 norwest bank 730 center ave
13 american crystal sugar co. 2500 11st N
General Public/ Other
14 moorhead center mall 500 center ave
15 moorhead city council 500 center ave
16 technical transportation committee
110
Total Moorhead Personal Vehicle Drivers 494 126 26%
Total Personal Vehicle Drivers 1073 392 37%

56
Business Related Driver's Survey Distribution and Response Rate
Name Address Surveys Surveys Response Distributed Returned Rate
I. Fargo and Moorhead Business Related Drivers
1 fire department - fargo 637 northern pacific ave
2 fire department - moorhead 1120 1st ave N
3 police department - fargo 222 4th st N
4 police department - moorhead 915 9th ave N
5 post office - fargo 657 2nd ave N
6 post office - moorhead 119 5th st S
7 fargo-moorhead ambulance 1101 1st ave S
8 ups 3901 12th ave N
9 corporate courier dispatch group 1130 40th st NW
10 doyle's yellow checker cab
11 all occasion limo
12 nsp 2302 great northern drive
13 metro area transit 502 northern pacific ave
14 city of moorhead transit drivers
15 park co. realtors 28 10th st N
Total Business Related Drivers 429 143 33%
Total Personal and Business Drivers 1502 535 36%

57
APPENDIX C
Mail-Back Survey Comments

58
Personal Vehicle Drivers' Comments (Manila Survey)# Code Grp
A. Rail Crossing Issues/Concerns
1. Railroad crossing needs to be addressed/Message sign idea is good.2 E 1 Message board is good idea. When riding my bicycle, I have an alternate underpass route to use when I
hear or see a train approaching my at-grade crossing. Question #15- only drive on weekends (use alternatetransportation during week)
18 E 1 The trains are a real issue with our decision to push the relocation of our downtown Fargo business locationat 23 Broadway.
20 E 1 Thank you - This is an important issue and needs to be addressed.
38 E 1 Question #10: It would be good to know how long I would wait, I might take an alternate route.
56 1 No comments- just frustrated!
75 E 1 Yes keep up the efficiency of Traffic Circulation esp at the RR tracks- signs of anticipated delay make bigsense vx. an overpass etc. !
96 TS 1 I would rather see money spent on manage ctr. rather than underpass.
100 E 1 This is an area that needs to be addressed! Thanks for looking into it!
107 E 1 I have learned to avoid using any roads that have train crossing- so while I travel though downtown- I use2nd street, 10th, and University a great deal.
117 E 1 Please move ahead on some of the above improvements.
118 E 1 Glad this is being addressed. Very frustrating.
128 Q 1 It's really annoying to wait for a train to get out of Village Green, and then wait for the same train a 2nd timeto get to work uptown Mhd!!
133 E 1 Fargo is better than Moorhead- more alternate routes but still can be frustrating.
141 E 1 I feel something needs to be done here in Fargo/Moorhead to reduce the train problem.
154 E 1 Good luck! I hope your work will help to make improvements. They are needed!
166 F 1 It is noticeably getting worse.
179 F 1 Question #6- Depends on situation/timing of trip…… If there were a device showing the approximate timeremaining to wait, I would be encouraged not to turn and go another route - would definitely wait if under 5minutes.
207 E 1 I am sorry that I am unable to attend, but I feel that the message signs are an excellent idea and wouldgreatly improve the downtown area.
241 E 1 Yes because I work right by railroad tracks and I've been late for work because of train and my lunch timehas been more then once delayed for at least 10 min. and only have half hour lunch.
259 Y 1 I get frustrated with trains, however, if my wait is 2-5 min., I can deal with it. I once had to wait 16 min. Icould not turn around. This problem needs to be addressed.
275 G 1 This is a good idea- a step in the right direction.
288 E 1 I'll give you credit for trying.
302 G 1 I like the idea about information signs because there is enough under passes to take alternate routes.
308 E 1 I believe the signs would definitely help with the traffic downtown and would help to choose alternative routes.
323 E 1 Yes, I am a school bus driver for the Moorhead Public School Dist. This will mean I have undoubtedlyskewed your results. I appreciate the questionnaire.
334 E 1 I'm glad someone is working to solve this problem. I am sometimes late for work because of trains- a majorannoyance.
347 F1 1 I am very glad to see a study being done to try and fix or help this situation. I think it has been a problem fora very long time.
364 F1 1 I don't drive up-town that often but when I do 9 out of 10 times I wait for a train. Very Frustrating!!!
380 F1 1 There definitely needs to be something done to alleviate some of the congestion at crossings in FM Area. There are getting to be too many trains at too many different times.
381 F1 1 I think your ideas are great and hopefully your ideas will make a lot of sense to other people.
389 F1 1 No. But it is about time that these things are brought to attention.
121A E 1 I think addressing train delays like this is great!12C E 1 I like the idea of having signs to show amount of minutes your wait will be.
93A E 1 I believe trains should be the number 1 transportation concern for Fargo Moorhead due to traffic and safetyissues.
Subtotal 34

59
2. Trains are especially a problem during peak times.37 E 2 Trains should not go through town between 7:00 am and 8:00 am and 4:30 pm - 5:30 pm. They always go
through during the middle of rush hour.55 Q 2 Try going through town at hours other that 7:30-8:00, noon hour, and 4:30-5:00.62 B 2 Traffic from South Fargo (32nd St.S., University Drive) to the Downtown area is very heavy and slow going to
work at 7:40 am and home at 5:00 pm.72 E 2 8:00 am and 12:00 pm seem to be when I most often get caught by a train.92 E 2 Should be run only at night.109 E 2 I often have to wait for trains going to or from work at 8 am and 5 pm. Maybe consider rescheduling trains to
run at off-peak hours? (even just a few minutes difference would help a lot of people).122 E 2 Is there any reason why the train schedules can't be changed or adjusted to avoid peak traffic times. It
seems that the trains are always blocking traffic during peak times like 8 am, 12 noon, 5 pm. I am animpatient person who hates to wait for trains.
132 E 2 Questions #3- In most cases, I'll take another route so I don't have to wait. Question #6- Depends on thetime of day. I'm extremely frustrated if I must wait around 8:00 am or 5:00 pm.
183 F 2 Just a thought about train traffic and their routes, It seems as though trains typically pass through downtownduring morning, noon, and evening rush hours. Could train schedules be altered to avoid these times?
222 E 2 The trains could cooperate and stay out of downtown during morning and aft. rush hour and from 12:00 -1:00 noon weekdays. 7 am to 8 am, 4:30 to 5:30 pm
296 E 2 Is there any way to change the schedule of the trains so they don't come through at 5 pm? Rush hour traffic.12B 2 It is very important for me to be at work at 7 am. Sometimes I am stopped by a train just off of Main Ave and
I don't reach my destination until 7:10-7:15, after I wait for a train. 354A E 2 It seems as the Fargo- Moorhead is right in the middle of the coal train schedule. 354B E 2 The grains going east that are full and the trains that are empty going west seem to pass thru F-M at the
noon hour which is the time of day when I do most of my running around. 354C E 2 It seems that this schedule could be altered slightly so these long trains could pass thru F-M at a different
time, because F-M is the biggest metro area along their route. Subtotal 13
3. Traffic problem issues at railroad crossings33 E 3 Put notice to drivers before turn proceeds into street blocked by existing train. Diagram: More notice or sign
to intersection before being "locked" into "dead end street" so choice could be made before turning intoblocked street.
149 E 3 Please also consider safety issues. There are certain RR x'ings that can be a dangerous traffic situation. The road just doesn't allow enough room for the traffic that is waiting to cross
168 F 3 In downtown due to short road segments traffic can get backed up in several directions and affect cars thatdo not need to cross the railroad to get to their destination.
244 E 3 Stop signs (near train crossings) are very frustrating when they prevent you from leaving the corner but letparallel traffic through.
250 E 3 The present system not allowing you to cross Main Avenue when a train is running is ridiculous. Somepeople from 1st or 2nd Ave So heading North want to get on Main Avenue to go West but the light stays reduntil the train is gone.
282 Y 3 Another problem are cars that want to turn at RR crossings tend to backup traffic when a train is passingthru. turning lanes would help on those roads to keep traffic following without delays.
285 E 3 Stop lights are set poorly. If you are making a left turn on Main heading North, you are stuck until the train isgone because the lights never change. Flashing Red or 3 minute maximum would be better.
12A E 3 Turning onto Broadway from Main Ave is difficult as a train is passing through town. Too many cars attemptto turn and some are left out in the middle of Main Ave. Also the turning lanes on Main Ave have becomecongested.
176A F 3 I think one of the dangerous aspects is when traffic backs up along main routes and blocks cross traffic. Also when cars are parked on RR tracks during a red light.
370A F1 3 An issue not listed here is when traffic stops at a stop light for a train that is on tracks across from thestoplight - the autos sit thru green lights because of the train and approach to the rails across the intersectionis full of other autos.
370B F1 3 People cannot turn right or left as they cannot get to the intersection. SEE DRAWING.390A E 3 By the time a train has passed, traffic congestion around the RR crossing area is highly unmanageable and
disorderly.
390B E 3 Having a white signal lamp on the traffic control lights is helpful but does not prevent me from being stuck ata red light which denies me access to an alternate route to avoid the train.
390D E 3 Question #4- Extremely heavy when a train is passing. Crossing areas become very congested andunmanageable. Cars behave unpredictably as they seek last minute escapes from the delay caused bypassing trains.
390E E 3 Traffic is often backed up by passing trains. Traffic is often backed up so much it impedes driveways andother intersections.
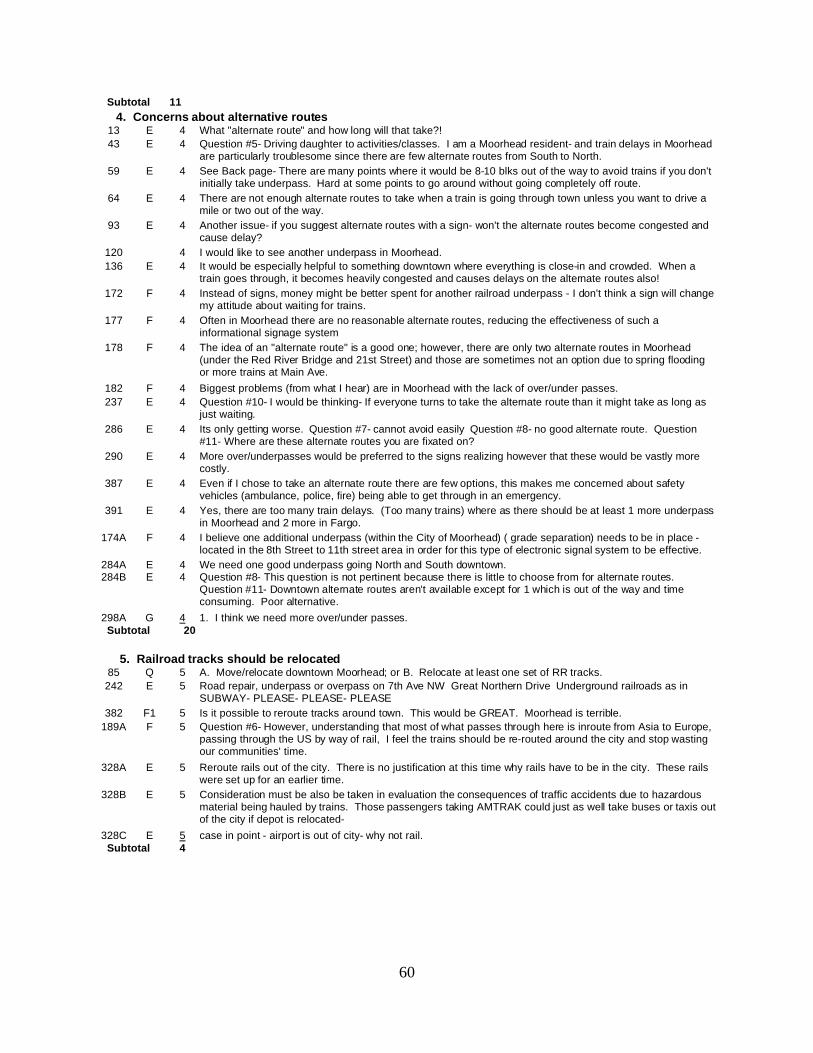
60
Subtotal 11
4. Concerns about alternative routes13 E 4 What "alternate route" and how long will that take?!
43 E 4 Question #5- Driving daughter to activities/classes. I am a Moorhead resident- and train delays in Moorheadare particularly troublesome since there are few alternate routes from South to North.
59 E 4 See Back page- There are many points where it would be 8-10 blks out of the way to avoid trains if you don'tinitially take underpass. Hard at some points to go around without going completely off route.
64 E 4 There are not enough alternate routes to take when a train is going through town unless you want to drive amile or two out of the way.
93 E 4 Another issue- if you suggest alternate routes with a sign- won't the alternate routes become congested andcause delay?
120 4 I would like to see another underpass in Moorhead.
136 E 4 It would be especially helpful to something downtown where everything is close-in and crowded. When atrain goes through, it becomes heavily congested and causes delays on the alternate routes also!
172 F 4 Instead of signs, money might be better spent for another railroad underpass - I don't think a sign will changemy attitude about waiting for trains.
177 F 4 Often in Moorhead there are no reasonable alternate routes, reducing the effectiveness of such ainformational signage system
178 F 4 The idea of an "alternate route" is a good one; however, there are only two alternate routes in Moorhead(under the Red River Bridge and 21st Street) and those are sometimes not an option due to spring floodingor more trains at Main Ave.
182 F 4 Biggest problems (from what I hear) are in Moorhead with the lack of over/under passes.
237 E 4 Question #10- I would be thinking- If everyone turns to take the alternate route than it might take as long asjust waiting.
286 E 4 Its only getting worse. Question #7- cannot avoid easily Question #8- no good alternate route. Question#11- Where are these alternate routes you are fixated on?
290 E 4 More over/underpasses would be preferred to the signs realizing however that these would be vastly morecostly.
387 E 4 Even if I chose to take an alternate route there are few options, this makes me concerned about safetyvehicles (ambulance, police, fire) being able to get through in an emergency.
391 E 4 Yes, there are too many train delays. (Too many trains) where as there should be at least 1 more underpassin Moorhead and 2 more in Fargo.
174A F 4 I believe one additional underpass (within the City of Moorhead) ( grade separation) needs to be in place -located in the 8th Street to 11th street area in order for this type of electronic signal system to be effective.
284A E 4 We need one good underpass going North and South downtown.284B E 4 Question #8- This question is not pertinent because there is little to choose from for alternate routes.
Question #11- Downtown alternate routes aren't available except for 1 which is out of the way and timeconsuming. Poor alternative.
298A G 4 1. I think we need more over/under passes. Subtotal 20
5. Railroad tracks should be relocated85 Q 5 A. Move/relocate downtown Moorhead; or B. Relocate at least one set of RR tracks.
242 E 5 Road repair, underpass or overpass on 7th Ave NW Great Northern Drive Underground railroads as inSUBWAY- PLEASE- PLEASE- PLEASE
382 F1 5 Is it possible to reroute tracks around town. This would be GREAT. Moorhead is terrible.
189A F 5 Question #6- However, understanding that most of what passes through here is inroute from Asia to Europe,passing through the US by way of rail, I feel the trains should be re-routed around the city and stop wastingour communities' time.
328A E 5 Reroute rails out of the city. There is no justification at this time why rails have to be in the city. These railswere set up for an earlier time.
328B E 5 Consideration must be also be taken in evaluation the consequences of traffic accidents due to hazardousmaterial being hauled by trains. Those passengers taking AMTRAK could just as well take buses or taxis outof the city if depot is relocated-
328C E 5 case in point - airport is out of city- why not rail. Subtotal 4

61
6. Train horns are a problem34 E 6 Another issue is the train horn. Is it necessary to be so loud and to blow so frequently.41 E 6 The train horns have affected my hearing.257 Y 6 For me…… more initiating than crossing delays is! loud train whistles- noise could be reduced by muting the
whistle or limit to one per crossing……320 E 6 Would do most anything to cut down of the noise pollution resulting from excessive load and to frequent use
of air horn, whistle etc. and they go thru the cities.342 F1 6 Do they have to blast their air horn at every intersection.353 F1 6 I don't like the "bumpy" RR crossings and I am extremely annoyed by the shrill - ear shattering train whistles!
390C E 6 The train horns are painfully loud. I am sure they are sometimes harmfully loud. I am not alone in objectingstrongly to this. Question #4- most of the time. Then crossing, even empty, does slow normal trafficsomewhat.
89A Q 6 Stopping time/waiting for trains is secondary- the primary problem associated with trains, especially inMoorhead, is the NOISE POLLUTION! If you can eliminate the need for trains to blow whistle at everyintersection, then you've improved our community
Subtotal 8
7. Other railroad crossing or survey comments1 E 7 I will wait for a train when I don't have anything going on. However, if I am in a hurry I probably spend more
time trying to avoid a train than actually waiting
14 E 7 Question #7- Sometimes it is not possible or feasible.
45 E 7 Not as bad as Dilworth!
48 E 7 Question #2- usually take underpass routes
51 E 7 Question #6- depends on my schedule
58 E 7 Mostly depends on how rushed you are.
81 Q 7 My frustration comes from when the train is stopped blocking the intersection. There has to be other placesfor this.
124 Q 7 If possible; trains should not stop across major intersection within city limits.
143 E 7 I think at all railroad crossings should have a crossing bar that goes down when train is coming!
159 E 7 These questions about the sign don't address how long it will take to get back to another route……
163 F 7 I realize the trains are here to stay, But the length of train should be addressed.
170 F 7 Question #10- I would need to know what direction the train was heading.
200 E 7 Underpasses for railroad they flood out during rain storm and winter become icy hazards
229 E 7 I usually choose my routes to use underpasses.
240 Y 7 Have felt cost prohibits changing train problems, so we just have to always use alternate routes if we are ona time schedule.
274 Y 7 Some trains are pretty slow- more speed would be acceptable.
278 Y 7 The trains are too long.
309 G 7 I don't travel through downtown often enough to fee qualified to give my opinion.
326 E 7 The BN line is worse for blocking.
330 E 7 I usually seek a route that includes an underpass to avoid waiting.
337 G 7 My answers are relative to how late I am in getting somewhere.
344 F1 7 railroad crossing on Clay county 26 & 18 needs lights
373 F1 7 It's really bad when you have to wait for 3 trains at 1 stop. I have had this happen to me a couple of times inMhd.
378 F1 7 I work at American Crystal Sugar. I live near Barnesville and I have 58 miles round trip. I use the Moorhead21st St underpass or it would be nightmare. I don't use the other crossings unless its necessary.
379 F1 7 Question #4 is foolish- If a train is passing at 3:00 pm- Traffic is usually heavy (weekdays with Friday theworst) I work a rotating shift schedule so I see the 12:50 am trains when traffic is not heavy.
383 F1 7 Question 10 was difficult to answer. If a train was coming and everyone tried to advance, we would end upwith the same net result at one end or the other.
386 E 7 This is the 1st survey I've seen and underpasses in Fargo to avoid delays have been taken.
174B F 7 Question #2- I plan my route- use existing underpasses.189C F 7 Question #10- Moorhead intersections are too close it simply wouldn't matter. Maybe which way the train is
going.
Subtotal 29

62
8. Railroad crossings are NOT a concern/Message sign will NOT help90 Q 8 People who become frustrated with the trains, should realize the benefits that the railroad brings to a
community.105 E 8 I wait longer and become more frustrated waiting for trains in Moorhead. Railroads are a very important part
of our economy. As long as they don't stop or are slowing down in front of me- I'm okay with them.147 E 8 Trains are essential and they have been here a long time. If you don't have the patience to wait for a train-
go a couple of blocks out of your way to an underpass214 Y 8 I do use underpasses frequently to avoid possible trains and the possibilities of trains dictates my routes. I
have lived in the F-M area for 35 yrs so it has become a habit to avoid trains.263 E 8 Question #10 I think a message sign would only produce congestion on side streets. Also: Fargo built up
around the railroads; perhaps people should think of that before they get upset that the railroad runs rightthrough the middle of town.
317 E 8 I love living in a town with trains. They are the commerce of our country!345 F1 8 I believe there is more whining in Moorhead than actual problem. Cross the tracks when there is no train.
(Plan ahead)357 F1 8 The traffic flows well. The underpass on each end of Moorhead keeps the traffic moving.360 G 8 The railroad was here before the cities!15B E 8 The roads & signage around town (Fgo-Mhd) are pretty good and I much prefer Fargo-Mhd traffic to
Minneapolis, etc. 189B F 8 Diagram- This will not take care of the problem. This example is a 'cough drop remedy' makes you feel good
but you're still sick. The problem is too many trains in and through our area not completing or taking on ourarea's business.
189D F 8 Question #11- If it is the path I need to take, it is the path I need to take. Driving all around the city will takefull waiting time or more. Taking alternate routes is not the answer in Moorhead. (Maybe in Minneapolis.)
289A E 8 Trains are important part of our transportation system especially in rural communities. If we are going tokeep trains in ND we need to be more patient and supportive of the great role they take in providingtransportation for ag products, etc.
289B E 8 We should be thankful every time we see a train. They represent a good economy and progress. Theyshould always have the right of way
319A E 8 Be patient as you would at any red/green lighted intersection. The people who cross the rail- tracks shouldrealize it is the same as most intersections of crosstraffic! !! Most importantly, the railroads were hereFIRST!!!
319B E 8 P.S. I have no connection nor business monetary interest in the railroads- other than paying taxes.332A E 8 A sign would be ugly and expensive (like previous page- yuk!) and if in a hurry folks turn around. Trains are
no big deal- adult and mature drivers can't wait- then they shouldn't drive. It's a privilege not a right. 332B E 8 We go to damn fast in this very short life. Let's stop Drunk Driving Huh!89B Q 8 In my opinion, "waiting signs" are a waste of time and money.94A E 8 1. The rails should become our dominant means of transportation- They are the most energy efficient. 2.
Auto Speed Limits in Fargo are too variable and subjective. 3. Traffic law enforcement needs to beimproved.
94B E 8 4. Rails are not a traffic or noise problem- the 4 wheel drive utility auto is worse. Subtotal 16
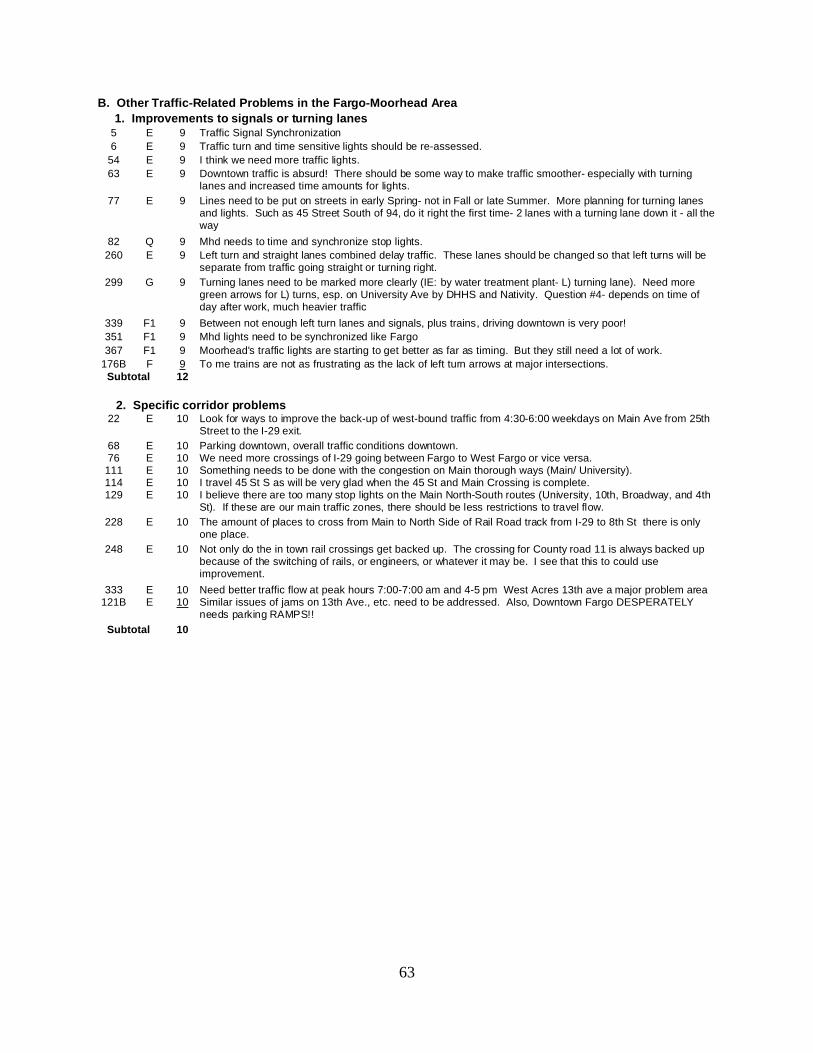
63
B. Other Traffic-Related Problems in the Fargo-Moorhead Area
1. Improvements to signals or turning lanes5 E 9 Traffic Signal Synchronization
6 E 9 Traffic turn and time sensitive lights should be re-assessed.
54 E 9 I think we need more traffic lights.
63 E 9 Downtown traffic is absurd! There should be some way to make traffic smoother- especially with turninglanes and increased time amounts for lights.
77 E 9 Lines need to be put on streets in early Spring- not in Fall or late Summer. More planning for turning lanesand lights. Such as 45 Street South of 94, do it right the first time- 2 lanes with a turning lane down it - all theway
82 Q 9 Mhd needs to time and synchronize stop lights.
260 E 9 Left turn and straight lanes combined delay traffic. These lanes should be changed so that left turns will beseparate from traffic going straight or turning right.
299 G 9 Turning lanes need to be marked more clearly (IE: by water treatment plant- L) turning lane). Need moregreen arrows for L) turns, esp. on University Ave by DHHS and Nativity. Question #4- depends on time ofday after work, much heavier traffic
339 F1 9 Between not enough left turn lanes and signals, plus trains, driving downtown is very poor!
351 F1 9 Mhd lights need to be synchronized like Fargo
367 F1 9 Moorhead's traffic lights are starting to get better as far as timing. But they still need a lot of work.
176B F 9 To me trains are not as frustrating as the lack of left turn arrows at major intersections. Subtotal 12
2. Specific corridor problems22 E 10 Look for ways to improve the back-up of west-bound traffic from 4:30-6:00 weekdays on Main Ave from 25th
Street to the I-29 exit.
68 E 10 Parking downtown, overall traffic conditions downtown.76 E 10 We need more crossings of I-29 going between Fargo to West Fargo or vice versa.111 E 10 Something needs to be done with the congestion on Main thorough ways (Main/ University).114 E 10 I travel 45 St S as will be very glad when the 45 St and Main Crossing is complete.129 E 10 I believe there are too many stop lights on the Main North-South routes (University, 10th, Broadway, and 4th
St). If these are our main traffic zones, there should be less restrictions to travel flow.
228 E 10 The amount of places to cross from Main to North Side of Rail Road track from I-29 to 8th St there is onlyone place.
248 E 10 Not only do the in town rail crossings get backed up. The crossing for County road 11 is always backed upbecause of the switching of rails, or engineers, or whatever it may be. I see that this to could useimprovement.
333 E 10 Need better traffic flow at peak hours 7:00-7:00 am and 4-5 pm West Acres 13th ave a major problem area121B E 10 Similar issues of jams on 13th Ave., etc. need to be addressed. Also, Downtown Fargo DESPERATELY
needs parking RAMPS!!
Subtotal 10
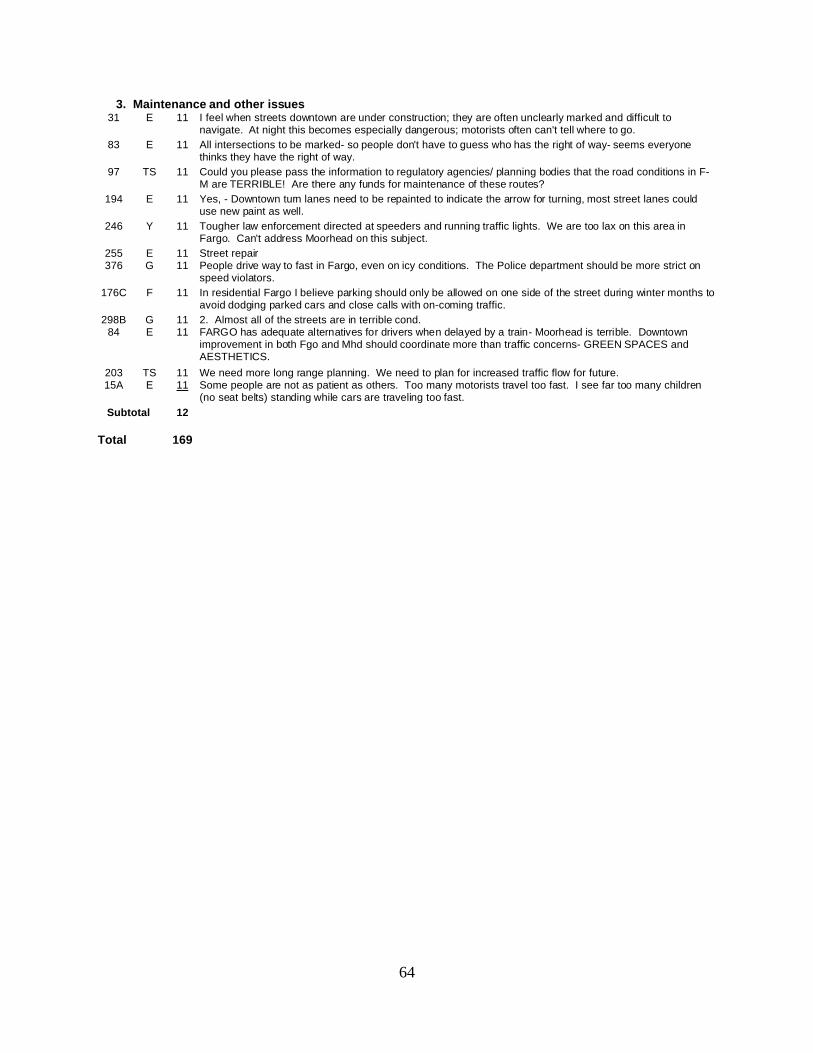
64
3. Maintenance and other issues31 E 11 I feel when streets downtown are under construction; they are often unclearly marked and difficult to
navigate. At night this becomes especially dangerous; motorists often can't tell where to go.
83 E 11 All intersections to be marked- so people don't have to guess who has the right of way- seems everyonethinks they have the right of way.
97 TS 11 Could you please pass the information to regulatory agencies/ planning bodies that the road conditions in F-M are TERRIBLE! Are there any funds for maintenance of these routes?
194 E 11 Yes, - Downtown turn lanes need to be repainted to indicate the arrow for turning, most street lanes coulduse new paint as well.
246 Y 11 Tougher law enforcement directed at speeders and running traffic lights. We are too lax on this area inFargo. Can't address Moorhead on this subject.
255 E 11 Street repair376 G 11 People drive way to fast in Fargo, even on icy conditions. The Police department should be more strict on
speed violators.
176C F 11 In residential Fargo I believe parking should only be allowed on one side of the street during winter months toavoid dodging parked cars and close calls with on-coming traffic.
298B G 11 2. Almost all of the streets are in terrible cond.84 E 11 FARGO has adequate alternatives for drivers when delayed by a train- Moorhead is terrible. Downtown
improvement in both Fgo and Mhd should coordinate more than traffic concerns- GREEN SPACES andAESTHETICS.
203 TS 11 We need more long range planning. We need to plan for increased traffic flow for future.15A E 11 Some people are not as patient as others. Too many motorists travel too fast. I see far too many children
(no seat belts) standing while cars are traveling too fast.
Subtotal 12
Total 169

65
Business Related Drivers' Comments (Green Survey)# Code Grp
A. Rail Crossing Issues/Concerns
1. Railroad crossing needs to be addressed/Message sign idea is good.1018 1 The area where I have the most difficulty with RR crossings is downtown Moorhead.
1022 1 Nice to know someone is checking into the problems. Also, the downtown railroad crossings are far toorough.
1025 1 Fargo isn't too bad, however it would be nice to know wait time. Moorhead is impossible. You must eithertake the 3rd St underpass, or drive 11/2 to 2 miles to where 1st Ave N meets Hwy 10. With the meterrunning (in Taxi) this can cause problems
1027 1 Some sort of sign or flashing light- like the one at Broadway and Main in Fargo would be nice to tell if atrain is coming- especially for emergency response times.
1028 1 I drive cab and depending on the amount of time and traffic at the train crossing, is what I base mydecision on, whether to turn onto a different route or not. The signs would greatly help.
1043 1 What a good idea.
1065 1 I think you have good ideas. I don't want to see the train industry hurt in all this. They provide a goodmeans of transportation of people's good, & people have fought hard to keep them in service. You have agood alternative.
1085 A 1 On Main Ave, at signal lights for East/West traffic, when a train is coming, a bright white light flashes. Thistells me a train is coming, I adjust my route. It would help with a time frame as to how long to wait.
1091 B 1 Fire and medical emergencies do not allow us to wait for trains if at all possible!
1104 A 1 In my line of work, a sign that tells the amount of time before the crossing is blocked would be morehelpful.
Subtotal 10
2. Trains are especially a problem during peak times.1052 2 Too many trains at 5:00 pm and there is already enough traffic.
Subtotal 1
3. Traffic problem and safety issues at railroad crossings1142A A 3 I am concerned about the safety aspect of people taking alternate routes and driving in an unsafe manner
at the crossing to get to that route.
1142B A 3 i.e. u-turns, wrong lane usage, shortcuts through parking lots, backing up in their lane, using rail frontageroads. (I've seen them all!)
Subtotal 1
4. Concerns about alternative routes1021 4 There should be another underpass in Moorhead. If we have a call N & E of the tracks between Center
and Main Aves, we have to go all the way to 3 St to get under the train, then backtrack up to 13 blocks tocontinue on our call.
1023 4 Fargo is not as bad as Moorhead for rail traffic. Only access in Moorhead are on opposite sides of town.
1024 4 Anything other than rerouting of trains or street traffic will be a patch at best. Sooner or later these by-passes will have to be made. I see no reason to use a band-aid now and waste that much money. I wouldgo ahead and plan over/under passes.
1046 4 How can you take an alternate route when there is not one for a mile away out of your way.
1081 A 4 Too long of stretch from Univ. Drive to 25th for a cross over or cross under.
1116 B 4 An underpass is needed somewhere in the middle of Moorhead.
1117 B 4 I feel a underpass at 11th St is essential. Often time police, fire, or ambulance is delayed because of thedistance and time to reach 4th St or 21st St when a train is blocking south access from Moorhead fire andP.D.
1122 B 4 I like the idea of the signs, that is if they are working. It would be nice if there was another overpass inMoorhead for emergency situations.
1132 B 4 It would be helpful to have more underpasses at busy crossings.
Subtotal 9
5. Railroad tracks should be relocated1100 B 5 Its long overdue that the trains are diverted around the city limits. Snow buildup on crossing is dangerous,
and causes damage to vehicles.
Subtotal 1

66
7. Other railroad crossing or survey com ments1001 7 If the trains weren't quite so long or had to switch in congested areas everything would be o.k.
1015 7 If the train would all travel about 30 miles an hour, this would really help. Some travel very slow whichreally holds us up a long time.
1021 7 The train tracks downtown are very rough.
1032 7 Fix it now and do it right- delay will just end up costing more $
1080 A 7 Better planning to avoid a wait of 7-10 mins for an eastbound train- only to have to wait 5-10 mins on overfor a westbound!
1082 A 7 Moorhead has a bigger problem with delays than Fargo.
1099 B 7 Why do trains only go slow when we really have to get to the other side in a hurry?
1102A B 7 Snow and ice build up at RR crossings is very bad and unacceptable 14th street is the worst. I have seencar parts which have been ripped off vehicles at these crossings. Usually impossible to travel 10 mph overcrossing in the winter.
1102B B 7 Requests by law enforcement to have crossing plowed seem to be ignored.1130 A 7 Sometimes I wish I had a L.A.W. rocket M72 when waiting on trains.
Subtotal 9
8. Railroad crossings are NOT a concern/Message sign w ill NOT help1039 8 I do not see the need nor justification to spend a lot of dollars to build bridges over the tracks. Trains are
running routine business as are the rest of us.
1055 8 BNSF won't do anything.
1077 A 8 The waits I have encountered in downtown Fargo and Moorhead because of train traffic have been minimaland I don't not see it being a big problem.
Subtotal 3
B. Other Traffic-Related Problems in the Fargo-Moorhead Area
1. Improvements to signals or turning lanes1126 A 9 Traffic could be improved more by having smart stop lights and/or better timed lights.
1035 9 Make the traffic lights in city standard left turn on arrow protected on some goes to green and slows turnwhen traffic permits on some turn on arrow only on some no green on some.
Subtotal 2
2. Specific corridor problems1059 10 27th St should be a one way heading south from Main due to the danger of cars trying to sneak across
Main to 27St N.
1109 A 10 Please, widen 13th ave S (from 25th ST to 45th ST SW and add frontage roads like South University).
Subtotal 2
3. Maintenance and other issues1021 11 Resurface 7 Ave N between 25 St and 10 St.
1062 11 Fix the bumpy streets
1075 A 11 I feel alternate routes are already available- 2nd St- University, 10th St. However I strongly feel alternatesare needed for pedestrians- especially downtown elderly folks in winter season.
Subtotal 3
Total 41

67
Railroad Crossing Survey Subgroup Codes
Fargo Moorhead
Personal Vehicle Drivers
Employees E F
American Crystal Sugar Employees F1
Public Offic ials P Q
Transportation Proffessionals T S
General Public at Rail Crossing G H
General Public Other X Y
Business Related Drivers
Serve mostly one area A B
Service is provided for both areas no codes used