motor skill control and learning in aiming sports: a
TRANSCRIPT

MOTOR SKILL CONTROL AND LEARNING IN AIMING SPORTS:
A PSYCHOPHYSIOLOGICAL ACCOUNT OF THE NEURAL EFFICIENCY
AND QUIET EYE PHENOMENA
by
GERMANO GALLICCHIO
A thesis submitted to the University of Birmingham for the degree of
DOCTOR OF PHILOSOPHY
School of Sport, Exercise & Rehabilitation Sciences
College of Life and Environmental Sciences
The University of Birmingham
October 2018

University of Birmingham Research Archive
e-theses repository This unpublished thesis/dissertation is copyright of the author and/or third parties. The intellectual property rights of the author or third parties in respect of this work are as defined by The Copyright Designs and Patents Act 1988 or as modified by any successor legislation. Any use made of information contained in this thesis/dissertation must be in accordance with that legislation and must be properly acknowledged. Further distribution or reproduction in any format is prohibited without the permission of the copyright holder.

ABSTRACT
This thesis aimed to increase our understanding of the psychophysiological correlates of
superior motor performance in target sports by providing an integrated account of the models
of neural efficiency (Hatfield & Hillman, 2001) and quiet eye (Vickers, 2007). To this end, I
conducted a series of four studies adopting a multi-measure approach to record brain activity
– using electroencephalography (EEG) – eye movements – using electrooculography (EOG)
– and movement kinematics – using motion sensors – in a golf putting task. The findings of
these studies led me to propose an integrated neural efficiency-quiet eye model arguing that
superior motor performance is achieved through refinement of cortical activity – reflected in
regional gating of alpha oscillations – whereby movement-related information processing is
promoted and at the same time insulated from other psychomotor processes that are unrelated
with, or detrimental to, fine motor control. The findings of my studies indicate that visual
perception is inhibited during the final stages of preparation for action, and suggest that the
quiet eye phenomenon reflects a general psychomotor quiescence that facilitates clean and
smooth movements. This thesis demonstrates the utility of psychophysiology in human
movement science and builds some methodological and conceptual foundations for
interdisciplinary research on the correlates of superior motor performance.

ACKNOWLEDGEMENTS
Working on this thesis has been a great pleasure. I loved every moment, every struggle, every
achievement. To Chris Ring, thank you for your excellent supervision. I have learned
immensely from you and, I am sure, I will continue to learn more from you. I am proud to be
your student. To Andy Cooke, thank you for your collaboration and for being a model to
follow in academia. To my parents / Ai miei genitori, non sarei mai arrivato così lontano
senza di voi. Grazie per il vostro supporto incondizionato. To those who supported my
efforts, challenged me to grow, inspired me to do better and achieve more – you know who
you are – thank you. You are all very dear to my heart.

LIST OF PAPERS
This thesis includes the following journal articles:
Gallicchio, G., Cooke, A., & Ring, C. (2017). Practice makes efficient: Cortical alpha
oscillations are associated with improved golf putting performance. Sport, Exercise &
Performance Psychology, 6(1), 89-102. https://dx.doi.org/10.1037%2Fspy0000077
Gallicchio, G., Cooke, A., & Ring, C. (2018). Assessing ocular activity during performance
of motor skills using electrooculography. Psychophysiology, 55(7), e13070.
https://doi.org/10.1111/psyp.13070
Gallicchio, G., & Ring, C. (2018). Don’t look, don’t think, just do it! Towards an
understanding of alpha gating in a discrete aiming task. Psychophysiology. e13298.
https://doi.org/10.1111/psyp.13298
Gallicchio, G., & Ring, C. (2018). The quiet eye effect: A test of the visual and postural-
kinematic hypotheses. Manuscript submitted for publication.
Data from this thesis were included in abstracts presented at the following conferences:
Gallicchio, G., Cooke, A., Kavussanu, M., & Ring, C. (2017, July). Eye quietness and quiet
eye in expert and novice golf performance: An electrooculographic analysis. Poster
presented at the 14th World Congress of the International Society of Sport
Psychology (ISSP), Seville, Spain.
Gallicchio, G., Cooke, A., & Ring, C. (2016, March). Suppression of left temporal cortical
activity mediates improvements in golf putting: A neural signature of expertise in

precision sports? Presented at the British Association of Sport and Exercise Sciences
(BASES) Student Conference, Bangor, UK.
Gallicchio, G., Cooke, A., & Ring, C. (2017, May). Practice makes efficient: Effects of golf
practice on brain activity. In C. Ring (Session chair), The neural underpinnings of
motor skill acquisition: An electroencephalographic perspective. Symposium
conducted at the 7th Annual Meeting of Expertise and Skill Acquisition Network
(ESAN), Coventry, UK.
Gallicchio, G., Cooke, A., & Ring, C. (2017, October). Quiet eye and eye quietness:
Electrooculographic methods to examine ocular activity in motor control tasks. Poster
presented at the 57th Annual Meeting of the Society for Psychophysiological
Research (SPR), Vienna, Austria. http://epapers.bham.ac.uk/3091/
CONTENTS
Page
CHAPTER ONE General Introduction
Neural Efficiency
Quiet Eye
Summary and Limitations of Literature
Aims of Thesis and Outline of Empirical Chapters
References
1
2
5
8
13
14
CHAPTER TWO Practice makes efficient: Cortical alpha oscillations are
associated with improved golf putting performance
Abstract
Introduction
Method
Results
Discussion
References
21
21
22
26
32
40
47
CHAPTER THREE Don’t look, don’t think, just do it! Towards an
understanding of alpha gating in a discrete aiming task
Abstract
Introduction
Method
Results
Discussion
References
54
54
55
58
69
77
85
CHAPTER FOUR Assessing ocular activity during performance of motor
skills using electrooculography
Abstract
Introduction
Method
Results
Discussion
References
90
90
91
97
103
111
119

CHAPTER FIVE The quiet eye effect: A test of the visual and postural-
kinematic hypotheses
Abstract
Introduction
Method
Results
Discussion
References
125
125
126
130
138
146
154
CHAPTER SIX General Discussion
Summary of Findings
Neural Efficiency and Quiet Eye Revisited
Limitations and Future Directions
Practical Implications for Athletes
General Conclusion
References
161
161
164
169
172
173
178
SUPPLEMENTAL MATERIAL 169

LIST OF FIGURES
Page
2.1
(A) Scalp maps representing alpha power (10·log10(µV²)) averaged
across participants, as a function of session (test, retest), time (–3 to
+1 s), and channel. (B) Alpha power (10·log10(µV²)) averaged across
participants, as a function of session (test, retest) and time (–3 to +1 s)
in the six regions. Error bars represent the standard error of the mean.
34
2.2 Left / right temporal:frontal alpha ISPC and imISPC averaged across
participants as a function of session (test, retest) and time (–3 to +1 s).
Error bars represent the standard error of the mean.
35
2.3 (A) Scalp maps representing Pearson's correlations conducted on the
inter-session change scores between the number of holed putts and
alpha power, as a function of time (–3 to +1 s) and channel. (B) Time-
frequency plots representing Pearson's correlations conducted on the
inter-session change scores between the left temporal alpha power
(10·log10(µV²)) and the number of holed putts, as a function of time
(–3 to +1 s) and frequency (0 to 32 Hz).
38
3.1 EEG epoching relative to the movements involved in the putting task.
(A) The participant stood upright in front of the ball and maintained
his gaze on the fixation cross located at eye-sight on the opposite wall.
(B) Cue onset: one of the LEDs turned on concomitantly to the
acoustic tone, informing the participant of the location of the target.
(C) At his own time, the participant positioned the putter head next to
the ball and prepared for the putt. (D) Backswing initiation: The
participant initiated the backswing. EEG alpha was examined from -3
to +1 s relative to this instant.
64
3.2 (A, B) Scalp maps of absolute alpha power in the 2 s prior to (A) cue
onset and (B) backswing initiation. (C) Scalp map of paired-sample t
values (df = 31) comparing pre-cue and pre-backswing alpha power.
Values of -2.04 and 2.04 correspond to p = .05 on a t distribution with
31. Statistical thresholding was applied using the maximum-statistic
permutation testing (Cohen, 2014; Nichols & Holmes, 2001)
controlling for multiple comparisons in the channel dimension with
alpha set at .01. Statistically significant channels are indicated by a
yellow-black markers and are surrounded by a solid contour line. (D,
E, F) Scatter plots showing (D) radial, (E) length, and (F) angle errors
66

as a function of relative alpha power at Oz in the 2 s prior to
backswing initiation along with Spearman's ρ and p values. (G, H, I)
Scalp maps of Spearman's ρ computed between relative alpha power
in the 2 s prior to backswing initiation and (G) radial error, (H) length
error, and (I) angle error. Statistical thresholding was applied using the
maximum-statistic permutation testing controlling for multiple
comparisons in the channel dimension with alpha set at .01: no
significant effects was revealed. All participants (n = 32) and only
trials from the baseline condition were included in these graphs.
3.3 Scalp maps of independent-sample t values comparing blocked versus
random groups, as a function of time and subset. Values of -2.04 and
2.04 correspond to p = .05 on a t distribution with 30 df. Positive
values indicate greater whereas negative values indicate smaller
relative alpha power for the blocked than the random group. Statistical
thresholding was computed using the maximum-statistic permutation
testing (Cohen, 2014; Nichols & Holmes, 2001) controlling for
multiple comparisons in the channel × time dimensions with alpha set
at .01: no significant effect was revealed.
75
4.1 (A) Horizontal and vertical (left and right eye) EOG signals. Voltages
(µV) are represented as function of time (s). Voltage increases
indicate eye movements to the left or upward; voltage decreases
indicate movements to the right or downward. Eye blinks are evident
in the vertical EOG signals. (B) Output of the QE algorithm with 60
and 20 µV thresholds. Thick colored lines indicate the quiet eye
period in its pre-movement initiation (QEpre) and post-movement
initiation (QEpost) components.
100
4.2 Eye quietness, i.e., HEOG-SD (µV), (panels A, B, and C) and its
variability across putts, i.e., SD HEOG-SD (µV), (panels D, E, and F)
as a function of time (s) from −4 to 2 s and either group (experts,
novices) or outcome (holed, missed). HEOG-SD is inversely related to
eye quietness: lower values indicate greater quietness. Panels A and D
show Group × Time effects. Error bars indicate between-subject SE.
Panels B and E show Outcome × Time effects for the experts. Panels
C and F show Outcome × Time effects for the novices. Error bars
indicate within-subject SE computed through normalization of the
outcome factor (Cousineau, 2005).
106
4.3 Durations (s) of total (QEtotal, panel A), pre-movement initiation
(QEpre, panel B), and post-movement initiation (QEpost, panel C) quiet
eye, as a function of threshold (µV and corresponding degrees of
109
visual angle). The solid and dashed lines represent mean durations,
respectively for experts and novices. The two colored bars above the
x-axis indicate r2 and p values associated with the independent-sample
t-tests conducted on group differences (df = 18). The shaded areas
represent the SE of each group’s means and were computed using
pooled estimates, hence corresponding with the independent-sample t-
tests (Pfister & Janczyk, 2013).
5.1 Voltage of the horizontal EOG channel as a function of time (0 s =
backswing initiation) for selected putts. Increases and decreases in
signal amplitude indicate saccades to the left and right, respectively,
whereas a flat signal indicates absence of eye saccades (i.e., fixations).
For each waveform, the grey line represents the original signal (low-
pass filtered at 30 Hz); the black line represents the same signal after
median filtering; orange and blue portions represent respectively QEpre
and QEpost durations identified with the 60 µV threshold; the red
vertical line indicates putter-ball impact.
133
5.2 Effect of threshold (5-150 µV) on quiet eye durations (s) in the ‘pre’
and ‘post’ phases (panel A). Trial-level (panel B) and participant-level
(panel C) analyses exploring the relation between quiet eye (s) and
eye quietness (%), occipital alpha power (%), movement duration (s),
and radial error (cm), as a function of thresholds (µV).
140
5.3 Eye quietness (HEOG-SD) as percentage change from the baseline
(i.e., cross-trial average activity in the 2 s prior to the onset of the
acoustic tone) as a function of time (i.e., 0.5-s non-overlapping
intervals from -3 to +1 s; 0 s = movement initiation). Smaller values
indicate less variability on the horizontal plane hence greater eye
quietness. Error bars indicate within-participant SE computed through
normalization of the outcome factor (Cousineau, 2005)
141
5.4 Trial-level (panel A) and participant-level (panel B) analyses
exploring the relation between EEG power (%) in the 1 s preceding
(-1 to 0 s) and following (0 to +1 s) backswing initiation and either
quiet eye (s) or eye quietness (%), as a function of frequency (Hz).
144

LIST OF TABLES
Page
2.1 Descriptive statistics of putting performance as a function of session
together with the results of the paired-sample t-tests.
32
3.1 Mean (SD) of performance measures of each group as change scores
from the baseline condition in each subset along with the results of
independent-sample t-tests. A negative change score indicates that
performance improved during the test compared to baseline.
72
4.1 Mean (SD) of quiet eye durations (QEtotal, QEpre, and QEpost), computed
with 60 and 20 µV threshold levels, and putting times (address and
swing times), with the results of the 2 Group (expert, novice) × 2
Outcome (holed, missed) mixed ANOVAs. Values were examined as
average (e.g., QEtotal) and standard deviation (e.g., SD QEtotal) across
putts.
104
4.2 Pearson’s correlations between quiet eye durations (QEpre and QEpost),
computed with 60 and 20 µV threshold levels, and eye quietness
(HEOG-SD), computed in different time intervals relative to
backswing initiation. The table shows only relevant comparisons (e.g.,
pre-movement initiation quiet eye with pre-movement initiation eye
quietness).
107
5.1 Trial-level analyses (i.e., average Spearman’s ρ and t values) and
participant-level analyses (i.e., Spearman’s ρ) of the relation between
quiet eye durations (QEpre and QEpost) and eye quietness (HEOG-SD)
in 8 0.5 time intervals from -3 to +1 s (0 s = backswing initiation).
139
5.2 Correlations between ocular activity (QEpre, QEpost, and HEOG-SD)
and occipital alpha power in 8 0.5 time intervals from -3 to +1 s (0 s =
backswing initiation). Spearman’s ρ is reported for the participant-level
correlations. Average ρ and t values are reported for the within-
participant correlations.
143

1
CHAPTER ONE
General Introduction
What determines superior motor performance? Researchers from the field of human
movement science have adopted various approaches to address this question. An approach
that has contributed greatly to the development of theoretical models is based on the analysis
of the activity of multiple biological systems during the performance of skilled movements,
such as those required in target sports (Tenenbaum & Eklund, 2007). Some researchers have
examined neural activity to uncover the mechanisms of mental concentration. Other
researchers have focused on eye movements to track visual attention. These ‘neural’ and
‘ocular’ branches have provided extraordinarily detailed descriptions of the correlates of
motor performance, the former culminating with the discovery of the neural efficiency
phenomenon (Hatfield & Hillman, 2001) and the latter with the discovery of the quiet eye
phenomenon (Vickers, 1996, 2007). Crucially, these neural and ocular branches have grown
separately from each other, developing distinct research methods and procedures. To date,
there has been very little contact between these two branches, mostly consisting in the
recognition of the incompatibility of the neural efficiency and quiet eye accounts of motor
performance (Mann, Wright, & Janelle, 2016).
This thesis adopts a multi-measure, psychophysiological approach designed to bring
together the neural efficiency and quiet eye phenomena into an integrated model of motor
control and learning. Here, golf putting is examined as a model for closed-loop aiming skills.
This is for various reasons. First, golf putting is complex enough to allow substantial
performance improvements with practice, founding the basis for longitudinal mechanistic
research. Second, the popularity of golf as sport grants access to a population of expert

2
individuals who, through years of consistent and deliberate practice, have developed
exceptional golf putting ability. Third, differently from other non-sport laboratory-based
motor tasks, golf putting has high ecological validity as it is representative of a purposeful
action. Finally, the relative postural stillness before and during the execution of the golf putt
allows researchers to examine small amplitude physiological signals, such as those generated
by the brain and the eyes, that would otherwise be overshadowed by the production of large
body movements.
This chapter introduces the concepts of neural efficiency and quiet eye and reviews
research that led to the discovery of these phenomena. The following section stresses the
need for an integrated neural efficiency-quiet eye account and highlights the utility of
psychophysiology to this end. The final part of this chapter provides aims and rationales for
the research studies described in the following empirical chapters of this thesis.
Neural Efficiency
Researchers who are interested in the mental processes underlying superior motor
performance have relied predominantly on electroencephalography (EEG). The EEG records
time-varying voltages from an array of electrodes applied to the scalp of an individual. The
electrical activity that can be measured by the EEG is largely due to post-synaptic potentials
that are synchronous within regional neuronal populations of the cerebral cortex (Nunez &
Srinivasan, 2006). Rhythmic fluctuations of these potentials generate electro-magnetic
activity oscillating at various frequencies – commonly known as brain rhythms – which have
distinct neurophysiological properties and which are associated with distinct cognitive
processes (Buzsáki, 2006). Among these brain rhythms, alpha – oscillating at a frequency
around 10 Hz – has attracted considerable attention from researchers due to its proposed

3
inhibitory function and ubiquitous dominance across the entire cerebral cortex (Klimesch,
Sauseng, & Hanslmayr, 2007; Klimesch, 2012). Alpha power – the magnitude of alpha
oscillations – can be examined as an indirect marker of regional cortical activation: higher
power in a specific region of the cortex reflects inhibition of neuronal excitability in that
region (Romei, Gross, & Thut, 2010; Sauseng, Klimesch, Gerloff, & Hummel, 2009).
One of the first documented studies of alpha in target sports was conducted by
Hatfield, Landers, Ray, and Daniels (1982) who examined the EEG of 15 elite rifle
marksmen as they performed 40 shots to a 50-foot distant target. Hatfield et al. (1982) found
that alpha power increased in the left-temporal region in the 7.5 s preceding shooting,
compared to a resting baseline. Due to the involvement of the left-temporal region with
language processing, this finding was interpreted as decreased reliance on verbal / analytic
processes. In the intervening years following this pioneering study the literature on EEG and
target sports has grown considerably (for reviews of studies see Cooke, 2013; Hatfield,
Haufler, Hung, & Spalding, 2004).
Around two decades later, Hatfield and Hillman (2001) published an influential report
reviewing about ten studies of EEG alpha power in target sports including rifle shooting,
archery, and golf putting. Crucially, Hatfield and Hillman (2001) made sense of the wealth of
study findings by framing the extant knowledge within the concept of psychomotor
efficiency. Efficiency was described as an adaptive process to repeated physical and mental
challenges – such as those inherent to target sports – consisting in the maximization of the
ratio between outcome and effort. According to this model, one could achieve greater
efficiency in three ways: by increasing the outcome while decreasing the effort, by increasing
the outcome while maintaining the same effort, or by maintaining the outcome while
decreasing the effort. In their review, Hatfield and Hillman (2001) highlight how differences
in expertise can be explained as a function of greater efficiency: through extended practice,

4
the psychomotor processes responsible for the execution of a certain skill are refined through
pruning of unnecessary activity. As a result of this process, individuals perform better while
concomitantly diminishing their psychomotor effort. The concept of improved efficiency
applies to the somatic level – for example, as improved coordination of agonist and
antagonist muscles – as well as to the neural level – for example, as improved movement
outcome with decreased neural activity. EEG alpha was the ideal candidate to study neural
efficiency due to its role of neural quietening and cognitive relaxation, as described in the
then state-of-the-art ‘idling’ model of brain activity (Pfurtscheller et al., 1996).
Since its introduction, the concept of neural efficiency was able to explain multiple
EEG alpha findings (for a review of studies and interpretation in light of the neural efficiency
concept see Hatfield et al., 2004 and Hatfield & Kerick, 2007). For example, Haufler,
Spalding, Santa Maria, and Hatfield (2000) tested expert and novice rifle marksmen at a
simulated 50-foot rifle shooting task. Haufler et al. (2000) found that, compared to novices,
experts performed better while exhibiting greater EEG alpha power in regions of the left (but
not right) hemisphere, in the 6 s preceding shooting. Another example is the study by Kerick,
Douglass, and Hatfield (2004) that tested novice pistol shooters before and after a training
period of 12-14 weeks. Kerick et al. (2004) observed that participants improved their
performance by increasing the percentage of target hits as a function of practice time. The
analysis of EEG alpha power revealed that left (but not right) temporal alpha power increased
from pre to post training. The findings of Haufler et al. (2000) and Kerick et al. (2004)
strengthened those of earlier studies regarding the deactivation of the left-temporal region of
the cerebral cortex during superior motor performance (e.g., Hatfield et al., 1982). Taken
together, these findings implied that improved performance was achieved with less cortical
activation and, therefore, fit very well within the neural efficiency model.

5
Later findings, however, seemed to challenge the predictions of neural efficiency by
indicating that, during superior motor performance, some cortical activity is enhanced rather
than inhibited. For example, Babiloni et al. (2008) recorded the EEG from expert golfers
performing golf putts to a 2.1-m distant hole. Babiloni et al. (2008) found that alpha power
recorded from frontal and central regions decreased as function of time in the 4 s preceding
the putt, indicating increased cortical activation. Importantly, they also found that compared
to missed putts, holed putts were preceded by lower alpha power. Another such example is
provided by the study by Cooke et al. (2014) that tested expert and novice golfers as they
putted golf balls to a 2.4-m distant hole. Cooke et al. (2014) reported that, compared to
novices, experts exhibited a greater reduction of alpha power for frontal and central regions
prior to putting. Additionally, alpha power was lower ahead of holed than missed putts for the
same regions. Taken together, the findings of Babiloni et al. (2008) and Cooke et al. (2014)
provided evidence that skill proficiency was achieved with greater – and not less – cortical
activation, in stark opposition with the concept of neural efficiency.
In order to reconcile the divergent results of decreased and increased cortical
activation in target sports, the neural efficiency model needs to be revised in light of recent
findings. A later section of this chapter argues for an extension of this model (which is
presented fully in the General Discussion, Chapter 6) that can potentially take into account
the full breadth of the findings of greater alpha power in some regions and lower alpha power
in some other regions of the cerebral cortex.
Quiet Eye
The main function of the eyes is to acquire images of the outer world and transfer them to the
brain to permit the generation of a percept informing our actions (Walls, 1962). In essence,

6
ocular activity can be abridged into placing or maintaining an image of interest within the
fovea, a small region placed at centre of the retina corresponding to less than 2° of the visual
field. Due to the fact that the fovea exhibits the largest ratio of optic fibres per photoreceptors
within the retina, images that fall into this area are processed in a privileged way by the visual
regions of the brain (Guyton & Hall, 2006). Saccades (i.e., movements of the eyes), fixations
(i.e., relative stillness of the eyes), and pursuit movements (i.e., slow movements of the eyes
to track a moving object) revolve around orienting and keeping the eyes aligned with an
object of interest (Krauzlis, Goffart, & Hafed, 2017). On this basis, shifts of the gaze can be
monitored to infer the time-varying allocation of attentional focus onto spatial locations
within the visual field (Posner, 1980). Researchers interested in the visuo-spatial attentional
processes occurring during the execution of aiming tasks have relied predominantly on
camera-based pupil-reflection methods to track eye movements.
The first analysis of eye movements in target sports dates back to Vickers (1992) who
used camera-based eye tracking to monitor duration and spatial location of ocular fixations
during the golf putt. Vickers (1992) found that, compared to less-skilled counterparts, skilled
golfers made fewer fixations of longer duration on critical locations of the visual scene –
particularly on the ball – before, during, and after the execution of the putt. Vickers (1992)
interpreted this finding as evidence that movement proficiency was characterized by a
maximization of the time spent focusing on critical elements related with the execution of the
skill. A milestone for subsequent research was the definition of the ‘quiet eye’ period as the
final ocular fixation on a critical location for the execution of a certain motor skill (e.g., the
ball in golf putting), starting prior to movement initiation (Vickers, 1996).
Following this seminal research, a large number of studies have used eye-tracking
methods to measure quiet eye duration in various sports and other fine motor skills (e.g.,
surgery), as a function of expertise and performance (for reviews of studies see Lebeau et al.,

7
2016; Mann, Williams, Ward, & Janelle, 2007; Rienhoff, Tirp, Strauß, Baker, & Schorer,
2016; Vickers, 2007; Wilson, Causer, & Vickers, 2015). These studies have provided a very
consistent picture whereby, compared to novices, experts exhibit a longer quiet eye duration.
For example, Walters-Symons, Wilson, and Vine (2017) studied the eye movements of
experienced and novice golfers as they performed golf putts. Walters-Symons et al. (2017)
observed a longer quiet eye duration for experienced than novice golfers. Other studies found
that better performance is accompanied by a longer quiet eye. For example, Wilson and
Pearcy (2009) co-examined quiet eye duration and golf putting outcome (holed or missed) in
a sample of experienced golfers. Wilson and Pearcy (2009) found that, compared to missed
putts, holed putts were characterized by a longer quiet eye duration. The association of long
quiet eye with superior performance has been replicated in so many studies that researchers
have reached an almost unanimous consensus on the authenticity of the relation between long
quiet eye and superior performance. Some researchers have ventured beyond descriptive
research into the designing of training programmes aimed to improve performance by
teaching individuals to produce a longer quiet eye (for a review of studies and methods of
quiet eye training see Vine, Moore, & Wilson, 2014). This exciting application has already
produced promising results and is likely to become increasingly popular in the next years.
Despite the consensus on the existence of the quiet eye-performance effect and the
promising expectations of quiet eye training, there is an ongoing, major debate on the
mechanism(s) by which a long quiet eye confers performance advantages. Informed by the
findings of experimental manipulations aimed to alter the quiet eye phenomenon, researchers
have proposed various mechanisms (for a comprehensive review see Gonzalez et al., 2017a).
Common to most of these mechanisms is the almost undisputed thesis that visual processing
plays a major role in determining the quiet eye-performance effect (Vickers, 2012). However,
to date there is no direct empirical evidence that visual processing is enhanced during the

8
quiet eye period. In order to improve our understanding of this phenomenon, researchers have
advocated more mechanistic research testing the predictions derived from the mechanistic
accounts that have been put forward to explain the quiet eye-performance effect (Causer,
2016; Williams, 2016; Wilson, Wood, & Vine, 2016).
The next section of this chapter includes a discussion on potential methodological
drawbacks that have held back progress on the mechanistic understanding of the quiet eye
phenomenon. Crucially, it presents a theoretical controversy, labelled the ‘efficiency
paradox’ that highlights the incompatibility between the quiet eye and the neural efficiency
accounts of superior motor performance. Finally, it proposes a method to solve this paradox.
Summary and Limitations of Literature
Scientists interested in understanding the biological correlates of superior motor performance
have predominantly studied the neural and ocular activity that accompanies the execution of
motor skills. Research that focused on the neural correlates have been heavily influenced by
the model of neural efficiency (Hatfield & Hillman, 2001), whereas research that focused on
the ocular correlates can be framed almost entirely within the model of quiet eye (Vickers,
2007).
The neural efficiency model links superior motor performance with decreased activity
in regions of the brain involved with cognitive processes that are deemed irrelevant for
precise motor control (Hatfield & Hillman, 2001). This model has received mixed support by
empirical studies of EEG alpha power in target sports. On the one hand, various studies have
supported the neural efficiency model by reporting greater alpha power (i.e., diminished
neural activity) in experts compared to novices (e.g., Haufler et al., 2000) and following than
preceding extended skill practice (e.g., Kerick et al., 2004). On the other hand, the findings of

9
other EEG studies challenged the neural efficiency model by reporting lower alpha power
(i.e., elevated neural activity) in experts compared to novices (e.g., Cooke et al., 2014) and
ahead of successful than unsuccessful performance (e.g., Babiloni et al., 2008; Cooke et al.,
2014). An extension of the neural efficiency model should take into account that some neural
activity is inhibited while, concomitantly, some other neural activity is enhanced.
For this purpose, the gating-by-inhibition model of alpha activity (Jensen & Mazaheri,
2010) provides a useful theoretical framework for the analysis of alpha power in multiple
regions of the cortex. This model is based on the notion that alpha indicates regional
inhibition of the cortex: elevated alpha power indicates increased inhibition whereas
diminished alpha power indicates greater release from inhibition (Klimesch, Sauseng, &
Hanslmayr, 2007; Klimesch, 2012). Importantly, the alpha gating model contends that
cortical processing is diverted away from regions exhibiting greater alpha power and routed
towards regions exhibiting lower alpha power (Jensen & Mazaheri, 2010). While the exact
mechanisms governing the generation of alpha activity and its propagation across the brain
tissues are still debated, it is generally accepted that regional distribution of alpha oscillations
within the cortex is influenced by thalamo-cortical and cortico-cortical interactions
(Klimesch, 2012). For example, a shift of focus from visual to acoustic processing is
associated with an in increase in alpha power in the occipital regions involved with visual
processing, whereas a shift from acoustic to visual processing is associated with a decrease in
the same regions (e.g., Foxe, Simpson, Ahlfors, 1998; Mazaheri et al., 2014).
The adoption of the gating-by-inhibition framework within the neural efficiency
model of superior motor performance can help make sense of the complex, often divergent,
regional patterns of alpha power observed in expert and novice performers. Namely, neural
efficiency can be re-defined as the extent by which neural processes that are functional to the
task at hand are enhanced while those that are irrelevant for task performance, or even

10
detrimental, are inhibited. Regions that are inhibited should exhibit relatively greater alpha
power whereas regions that are active should exhibit relatively lower alpha power.
The quiet eye model associates superior motor performance with longer ocular
fixations on locations that are relevant to task performance (Vickers, 2007). A compelling
body of research has demonstrated the validity of the quiet eye model for a variety of sports
(Lebeau et al., 2016). There are minimal doubts on the existence of the quiet eye
phenomenon, however, there is a major debate on the mechanisms accounting for the quiet
eye-performance effect (e.g., Wilson, Wood, & Vine, 2016).
The uncertainty surrounding the mechanisms may be due to a number of factors. First,
most research has measured the quiet eye period by aggregating the duration of the fixation in
the period before movement initiation, during movement execution, and even after movement
completion into one compound measure (Vickers, 2007). Although it is sensible to aggregate
these periods as they refer to the same ocular fixation – hence, a single attentional focus unit
– the lack of distinction makes it difficult to relate this compound measure with the different
stages of movement execution. For example, it is hard to conceive that the quiet eye period
recorded after movement initiation has anything to do with the planning of movement
parameters such as force and direction. It is more plausible that, after movement initiation,
other processes, such as online control or postural quiescence, play a more important role.
For the sake of interpretability, mechanistic research on the quiet eye phenomenon should
examine pre and post-movement initiation quiet eye periods separately.
Second, the definition of a quiet eye period appears ambiguous because, even during a
fixation, the eyes are never completely still. In fact, small high-frequency movements occur
constantly during fixations to make sure that the retinal image does not dissipate (Krauzlis et
al., 2017). For this reason, the selection of a threshold criterion below which the eyes are
deemed quiet sounds arbitrary (Williams, 2016). An alternative and complementary approach

11
is to measure the amount of eye quietness and observe its changes as a function of time,
relative to different phases of the movement. The development of an ‘eye quietness’ index
can provide a totally new perspective on the study of ocular activity occurring during the
execution of motor skills and, therefore, has to potential to improve mechanistic
understanding of the quiet eye.
Third, the almost exclusive reliance on camera-based eye tracking to score the quiet
eye period has contributed to the isolation of the quiet eye literature from related fields that
examined superior motor performance using alternative methods. For example, if the quiet
eye reflects mental processes, a critical research question would be to examine what happens
in the brain during the quiet eye period. Unfortunately, the technical difficulty to co-record
and synchronize measurements of ocular and brain activity has held back progress on this
matter. While researchers have advocated that a multi-measure approach would be highly
beneficial to the debate on the mechanisms of the quiet eye (Causer, 2016; Williams, 2016;
Wilson et al., 2016) only a handful of studies have managed to do so (Janelle et al., 2000;
Mann, Coombes, Mousseau, & Janelle, 2011; Moore, Vine, Cooke, Ring, & Wilson, 2012).
Considered separately, the models of neural efficiency and quiet eye explain well how
individuals can achieve superior motor performance. However, the predictions of each model
are in sharp contrast with each other. Namely, if the concept of efficiency applied to eye
movements in precision sports, one could deduct that, compared to novices, experts should
require less – and not more – time focusing on critical spatial locations of the visual scene. As
Foulsham (2016) notes, longer fixations generally indicate more difficult or less efficient
information processing: for example, dyslexic individuals need longer ocular fixations
compared to non-dyslexic individuals. The ‘efficiency paradox’, formally described by Mann
et al. (2016), constitutes a substantive theoretical challenge for the quiet eye model and,

12
moreover, it highlights the relative isolation of quiet eye research from other related fields
interested in motor expertise.
In a response to Mann et al. (2016), Vickers (2016) argued that the thesis that experts
process visual information more quickly than novices is illusory, citing quiet eye findings as
proof of her argument. However, this argument does little to solve the efficiency paradox as
no independent (non-quiet eye) evidence is provided. The need for a new model that
reconciles the divergences between the neural efficiency and quiet eye phenomena is
necessary if we wish to advance our understanding of what determines superior motor
performance in target sports. A solution of the efficiency paradox requires the adoption of a
multi-measure approach where indices of neural and ocular activity are combined and
examined concomitantly. To this end, psychophysiology can provide methods for the
objective, unobtrusive, and simultaneous registration of activity from multiple biological
systems during the execution of movements. Specifically, on the one hand, patterns of brain
activity can be examined by recording EEG alpha power, and visual processing can be
inferred by analysing the activity of the visual areas of the brain (e.g., Loze et al. 2001;
Janelle et al., 2000). On the other hand, ocular activity in target sports can be recorded
through electrooculography (EOG), a technique that measures changes in the electro-
magnetic potentials produced by eye movements (Gonzalez et al., 2017b; Mann et al., 2011).
Interestingly, EEG studies typically include EOG recordings. This is due to the fact the
electrical activity generated by the cerebral cortex is orders of magnitude smaller than that
generated by eye movements. Typically, EEG researchers consider the EOG signal an
artefact and use it almost exclusively to de-noise the EEG signal. A paradigm shift for the
integrated analysis of neural and ocular activity is the acknowledgement that the EOG
encompasses meaningful information about eye movements and that this information can be
extremely valuable to understanding psychomotor processes. Accordingly, bridging the
13
‘neural’ and the ‘ocular’ branches of research in superior motor performance requires the
development of procedures to exploit the complexity of integrated EEG and EOG signals.
Aims of Thesis and Outline of Empirical Chapters
The overarching aim of this thesis is to provide an integrated account of the neural efficiency
and quiet eye model in target sports, by using psychophysiological methods. My thesis has
four aims. The first aim is to evaluate the utility of the gating-by-inhibition model for the
interpretation of changes in regional EEG alpha induced by practice of a closed-loop aiming
skill. This aim is addressed in the empirical study described in Chapter Two. In this study, the
EEG was recorded from recreational golfers before and after a practice period of
approximately 1 week including three sessions. Changes in regional alpha power were
explored as mediators of performance improvements as a function of time.
The second aim is to test the explanatory power of the model of neural efficiency as
alpha gating by manipulating the need to re-parameterize movement features, such as force
and direction, across the repeated execution of a motor skill. This aim is addressed in the
empirical study described in Chapter Three. In this study, recreational golfers putted golf
balls to the same target in a blocked design whereas others putted to a target varying
randomly on each trial in terms of distance and extent, while their EEG was recorded. This
study examined whether the need to re-parameterize features of the movement affected neural
efficiency defined as the extent and intensity of alpha gating.
The third aim is to develop analytic procedures based on the EOG signal to examine
eye movements during the execution of a motor skill. This aim is addressed in the empirical
study described in Chapter Four. In this study the EOG was used to score the quiet eye period

14
separately for the pre and post-movement initiation phases and using multiple thresholds.
Importantly, this study presents a novel index to measure eye quietness as a function of time.
The fourth aim is to triangulate measures of neural activity, ocular activity, and
movement kinematics while recreational golfers performed golf putts to a target. This aim is
addressed in the empirical study described in Chapter Five. This study exploits the methods
developed in the preceding empirical chapters to test two main mechanisms deemed
responsible for the quiet eye phenomenon.
Chapter Six summarizes the findings described in each of the previous empirical
chapters and integrates them into a model combining the neural efficiency and quiet eye
accounts of superior motor performance. Then, it highlights the limitations of this model and
suggests directions for future research. Finally, it presents practical applications that can be
useful for athletes to improve their performance.
References
Babiloni, C., Del Percio, C., Iacoboni, M., Infarinato, F., Lizio, R., Marzano, N., ... & Eusebi,
F. (2008). Golf putt outcomes are predicted by sensorimotor cerebral EEG rhythms.
The Journal of physiology, 586(1), 131-139.
http://dx.doi.org/10.1113/jphysiol.2007.141630
Buzsaki, G. (2006). Rhythms of the Brain. Oxford University Press.
Causer, J. (2016). The future of quiet eye research—Comment on Vickers. Current Issues in
Sport Science, 1, 1–4. https://doi.org/10.15203/CISS_2016.103
Cooke, A. (2013). Readying the head and steadying the heart: A review of cortical and
cardiac studies of preparation for action in sport. International Review of Sport and
Exercise Psychology, 6, 122–138. https://doi.org/10.1080/1750984X.2012.724438

15
Cooke, A., Kavussanu, M., Gallicchio, G., Willoughby, A., McIntyre, D., & Ring, C. (2014).
Preparation for action: Psychophysiological activity preceding a motor skill as a
function of expertise, performance outcome, and psychological pressure.
Psychophysiology, 51(4), 374–384. https://doi.org/10.1111/psyp.12182
Foxe, J. J., Simpson, G. V., & Ahlfors, S. P. (1998). Parieto-occipital ∼10 Hz activity reflects
anticipatory state of visual attention mechanisms. Neuroreport, 9(17), 3929-3933.
Foulsham, T. (2016). Functions of a quiet and un-quiet eye in natural tasks – comment on
Vickers. Current Issues in Sport Science, 1, 106.
https://doi.org/10.15203/CISS_2016.106
Gonzalez, C. C., Causer, J., Miall, R. C., Grey, M. J., Humphreys, G., & Williams, A. M.
(2017a). Identifying the causal mechanisms of the quiet eye. European Journal of
Sport Science, 17(1), 74–84. https://doi.org/10.1080/17461391.2015.1075595
Gonzalez, C. C., Causer, J., Grey, M. J., Humphreys, G. W., Miall, R. C., & Williams, A. M.
(2017b). Exploring the quiet eye in archery using field-and laboratory-based tasks.
Experimental brain research, 235(9), 2843-2855.
https://dx.doi.org/10.1007%2Fs00221-017-4988-2
Guyton, A. C., & Hall, J. E. (2006). Textbook of medical physiology (11th Ed.). Philadelphia,
PA: Elsevier Inc.
Hatfield, B. D., Haufler, A. J., Hung, T. M., & Spalding, T. W. (2004).
Electroencephalographic studies of skilled psychomotor performance. Journal of
Clinical Neurophysiology, 21, 144-156. http://dx.doi.org/10.1097/00004691-
200405000-00003
Hatfield, B. D., & Hillman, C. H. (2001). The psychophysiology of sport: A mechanistic
understanding of the psychology of superior performance. In R. N. Singer, H. A.

16
Hausenblas, & C. M. Janelle (Eds.), Handbook of sport psychology (2nd ed., pp. 362-
386). New York: Wiley.
Hatfield, B. D., & Kerick, S. E. (2007). The psychology of superior sport performance: A
cognitive and affective neuroscience perspective. In G. Tenenbaum & R.C. Eklund
(Eds.), Handbook of sport psychology (3rd ed., pp. 84–109). New York, NY: John
Wiley & Sons, Inc.
Hatfield, B. D., Landers, D. M., Ray, W. J. & Daniels, F. S. (1982) An
electroencephalographic study of elite rifle shooters. American Marksmen, 7, 6-8.
Haufler, A. J., Spalding, T. W., Santa Maria, D. L., & Hatfield, B. D. (2000). Neuro-
cognitive activity during a self-paced visuospatial task: comparative EEG profiles in
marksmen and novice shooters. Biological Psychology, 53(2), 131-160.
http://dx.doi.org/10.1016/S0301-0511(00)00047-8
Janelle, C. M., Hillman, C. H., Apparies, R. J., Murray, N. P., Meili, L., Fallon, E. A., &
Hatfield, B. D. (2000). Expertise differences in cortical activation and gaze behavior
during rifle shooting. Journal of Sport and Exercise psychology, 22, 167-182.
https://doi.org/10.1123/jsep.22.2.167
Jensen, O., & Mazaheri, A. (2010). Shaping functional architecture by oscillatory alpha
activity: gating by inhibition. Frontiers in Human Neuroscience, 4, 1-8.
http://dx.doi.org/10.3389/fnhum.2010.00186
Kerick, S. E., Douglass, L. W., & Hatfield, B. D. (2004). Cerebral cortical adaptations
associated with visuomotor practice. Medicine and Science in Sports and Exercise,
36(1), 118-129. http://dx.doi.org/10.1249/01.MSS.0000106176.31784.D4
Klimesch, W. (2012). Alpha-band oscillations, attention, and controlled access to stored
information. Trends in Cognitive Sciences, 16, 606-617.
http://dx.doi.org/10.1016/j.tics.2012.10.007

17
Klimesch, W., Sauseng, P., & Hanslmayr, S. (2007). EEG alpha oscillations: the inhibition–
timing hypothesis. Brain Research Reviews, 53(1), 63-88.
http://dx.doi.org/10.1016/j.brainresrev.2006.06.003
Krauzlis, R. J., Goffart, L., & Hafed, Z. M. (2017). Neuronal control of fixation and
fixational eye movements. Philosophical Transactions of the Royal Society B,
372(1718), 1-12. https://doi.org/10.1098/rstb.2016.0205
Lebeau, J. C., Liu, S., Sáenz-Moncaleano, C., Sanduvete-Chaves, S., Chacón-Moscoso, S.,
Becker, B. J., & Tenenbaum, G. (2016). Quiet eye and performance in sport: A meta-
analysis. Journal of Sport and Exercise Psychology, 38(5), 441-457.
https://doi.org/10.1123/jsep.2015-0123
Loze, G. M., Collins, D., & Holmes, P. S. (2001). Pre-shot EEG alpha-power reactivity
during expert air-pistol shooting: a comparison of best and worst shots. Journal of
sports sciences, 19(9), 727-733. https://doi.org/10.1080/02640410152475856
Mann, D. T., Coombes, S. A., Mousseau, M. B., & Janelle, C. M. (2011). Quiet eye and the
bereitschaftspotential: Visuomotor mechanisms of expert motor performance.
Cognitive Processing, 12(3), 223-234. https://doi.org/10.1007/s10339-011-0398-8
Mann, D. T., Williams, A. M., Ward, P., & Janelle, C. M. (2007). Perceptual-cognitive
expertise in sport: A meta-analysis. Journal of Sport and Exercise Psychology, 29(4),
457-478. https://doi.org/10.1123/jsep.29.4.457
Mann, D. T., Wright, A., & Janelle, C. M. (2016). Quiet eye: The efficiency paradox –
comment on Vickers. Current Issues in Sport Science, 1, 1-4.
https://doi.org/10.15203/CISS_2016.111
Mazaheri, A., van Schouwenburg, M. R., Dimitrijevic, A., Denys, D., Cools, R., & Jensen, O.
(2014). Region-specific modulations in oscillatory alpha activity serve to facilitate

18
processing in the visual and auditory modalities. Neuroimage, 87, 356-362.
https://doi.org/10.1016/j.neuroimage.2013.10.052
Moore, L. J., Vine, S. J., Cooke, A., Ring, C., & Wilson, M. R. (2012). Quiet eye training
expedites motor learning and aids performance under heightened anxiety: The roles of
response programming and external attention. Psychophysiology, 49(7), 1005-1015.
https://doi.org/10.1111/j.1469-8986.2012.01379.x
Nunez, P. L., & Srinivasan, R. (2006). Electric fields of the brain: the neurophysics of EEG.
Oxford University Press, USA.
Pfurtscheller, G., Stancak Jr, A., & Neuper, C. (1996). Event-related synchronization (ERS)
in the alpha band—an electrophysiological correlate of cortical idling: a review.
International journal of psychophysiology, 24(1-2), 39-46.
https://doi.org/10.1016/S0167-8760(96)00066-9
Posner, M. I. (1980). Orienting of attention. Quarterly journal of experimental psychology,
32(1), 3-25. https://doi.org/10.1080/00335558008248231
Rienhoff, R., Tirp, J., Strauß, B., Baker, J., & Schorer, J. (2016). The ‘quiet eye’ and motor
performance: a systematic review based on Newell’s constraints-led model. Sports
Medicine, 46(4), 589-603. https://doi.org/10.1007/s40279-015-0442-4
Romei, V., Gross, J., & Thut, G. (2010). On the role of prestimulus alpha rhythms over
occipito-parietal areas in visual input regulation: correlation or causation? Journal of
Neuroscience, 30(25), 8692-8697. https://doi.org/10.1523/JNEUROSCI.0160-
10.2010
Sauseng, P., Klimesch, W., Gerloff, C., & Hummel, F. C. (2009). Spontaneous locally
restricted EEG alpha activity determines cortical excitability in the motor cortex.
Neuropsychologia, 47(1), 284-288.
https://doi.org/10.1016/j.neuropsychologia.2008.07.021

19
Tenenbaum, G., & Eklund, R. C. (Eds.) (2007). Handbook of sport psychology. John Wiley
& Sons.
Vickers, J. N. (1992). Gaze control in putting. Perception, 21(1), 117-132.
https://doi.org/10.1068/p210117
Vickers, J. N. (1996). Visual control when aiming at a far target. Journal of Experimental
Psychology: Human Perception and Performance, 22(2), 342.
https://doi.org/10.1037/0096-1523.22.2.342
Vickers, J. N. (2007). Perception, cognition, and decision training: The quiet eye in action.
Champaign, IL: Human Kinetics.
Vickers, J. N. (2012). Neuroscience of the quiet eye in golf putting. International Journal of
Golf Science, 1(1), 2-9. https://doi.org/10.1123/ijgs.1.1.2
Vickers, J. N. (2016). The quiet Eye: Reply to sixteen commentaries. Current Issues in Sport
Science, 1. https://doi.org/10.15203/CISS_2016.118
Vine, S. J., Moore, L. J., & Wilson, M. R. (2014). Quiet eye training: The acquisition,
refinement and resilient performance of targeting skills. European Journal of Sport
Science, 14 (Suppl. 1), S235-242. https://doi.org/10.1080/17461391.2012.683815
Walters-Symons, R. M., Wilson, M. R., & Vine, S. J. (2017). The quiet eye supports error
recovery in golf putting. Psychology of Sport and Exercise, 31, 21-27.
https://doi.org/10.1016/j.psychsport.2017.03.012
Williams, A. M. (2016). Quiet eye vs. noisy brain: The eye like the brain is always active—
Comment on Vickers. Current Issues in Sport Science, 1, 1–3.
https://doi.org/10.15203/CISS_2016.116
Wilson, M. R., Causer, J., & Vickers, J. N. (2015). Aiming for excellence. In J. Baker, & D.
Farrow (Eds.), Routledge handbook of sport expertise. New York, NY: Routledge.

20
Wilson, M. R., & Pearcy, R. C. (2009). Visuomotor control of straight and breaking golf
putts. Perceptual and Motor Skills, 109(2), 555-562.
https://doi.org/10.2466%2Fpms.109.2.555-562
Wilson, M. R., Wood, G. W., & Vine, S. J. (2016). Say it quietly, but we still do not know
how quiet eye training works—Comment on Vickers. Current Issues in Sport Science,
1, 1–3. https://doi.org/10.15203/CISS_2016.117
Walls, G. L. (1962). The evolutionary history of eye movements. Vision Research, 2(1-4),
69-80. https://doi.org/10.1016/0042-6989(62)90064-0

21
CHAPTER TWO
Practice makes efficient: Cortical alpha oscillations are associated with improved golf
putting performance
Abstract
Practice of a motor skill results in improved performance and decreased movement
awareness. The psychomotor efficiency hypothesis proposes that the development of motor
expertise through practice is accompanied by physiological refinements whereby irrelevant
processes are suppressed and relevant processes are enhanced. The present study employed a
test-retest design to evaluate the presence of greater neurophysiological efficiency with
practice and mediation analyses to identify the factors accounting for performance
improvements, in a golf putting task. Putting performance, movement-specific conscious
processing, electroencephalographic (EEG) alpha power and alpha connectivity were
measured from 12 right-handed recreational golfers (age: M = 21 years; handicap: M = 23)
before and after three practice sessions. As expected, performance improved and conscious
processing decreased with training. Mediation analyses revealed that improvements in
performance were partly attributable to increased regional gating of alpha power and reduced
cross-regional alpha connectivity. However, changes in conscious processing were not
associated with performance improvements. Increased efficiency was manifested at the
neurophysiological level as selective inhibition and functional isolation of task-irrelevant
cortical regions (temporal regions) and concomitant functional activation of task-relevant
regions (central regions). These findings provide preliminary evidence for the development of
greater psychomotor efficiency with practice in a precision aiming task.

22
Introduction
Practice of a motor skill typically results in improved movement execution and performance.
According to the psychomotor efficiency hypothesis (Hatfield & Hillman, 2001), such
improvements are accompanied by the suppression of task-irrelevant processes (e.g.,
diverting resources away from cortical regions that have limited relevance for the task) and
the enhancement of task-relevant processes (e.g., redirecting resources to the most important
cortical regions for task-performance). At the neurophysiological level, a compelling body of
research has found indirect support for this hypothesis by revealing that, while performing
precision skills such as golf putting, shooting, and archery, expert athletes manifest greater
neural efficiency than novices (for review see Cooke, 2013; Hatfield et al., 2004). By
adopting a test-retest design, the aim of the current study was to test the psychomotor
efficiency hypothesis. Specifically, we examined (a) whether practice of a motor skill over
time leads to neurophysiological adaptations compatible with increased psychomotor
efficiency, and (b) whether such adaptations account for improvements in movement
performance.
Most research relating to neural efficiency in precision sports has examined
electroencephalographic (EEG) activity in preparation for action and during movement
execution. The EEG measures time-varying changes in voltages from an array of scalp
electrodes and reflects post-synaptic potentials in the pyramidal neurons of the cerebral
cortex (Nunez & Srinivasan, 2006). The interplay of these potentials generates oscillations at
different frequencies, including alpha oscillations (around 8-12 Hz), which are thought to
play a major role in shaping the functional architecture of the cortex due to their proposed
inhibitory function (Klimesch, 2012). Specifically, the magnitude of alpha oscillations – i.e.,
alpha power – can influence regional activation in the cortex through a gating mechanism

23
whereby resources are diverted away from regions showing higher alpha power (i.e., more
inhibition) and towards regions showing lower alpha power (i.e., lower inhibition) (Jensen &
Mazaheri, 2010).
The study of alpha oscillations in precision sports has revealed that experts display
higher alpha power over the temporal regions (e.g., Haufler et al., 2000; Janelle et al., 2000)
and lower alpha power over the central regions (e.g., Cooke et al., 2014) of the cortex
compared to novices while preparing for movement execution. Additionally, experts and
novices show different time dynamics of alpha power. For example, Cooke et al. (2014)
observed a biphasic pattern of alpha oscillations that was stronger for experts than novices:
alpha power showed an initial increase followed by a sudden drop in the last second
preceding movement initiation. Taken together these findings suggest the presence of a
pattern of cortical activity across the scalp where the timely inhibition of some cortical
regions (e.g., temporal) and the lack of inhibition of other regions (e.g., central) can be
related to the development of motor expertise.
Complementing the study of the regional and temporal dynamics of alpha power, a
few studies have examined the functional connectivity among alpha oscillations across
different regions of the cortex. Alpha connectivity between two regions represents the extent
to which the alpha activity of those regions is functionally connected (i.e., frequency-specific
cortico-cortical communication between different regions). Based on the assumption that
alpha reflects inhibition (Klimesch, 2012), alpha connectivity indicates the strength of the
functional connection between the inhibition of one region and the inhibition of another
region. For example, greater alpha connectivity could be interpreted to reflect two regions
engaging in similar and consistent inhibition, whereas lower connectivity may indicate
distinct inhibition profiles.
Research in precision sports has revealed that, compared to novices, experts display

24
lower left temporal:frontal alpha connectivity, reflecting a functional disconnection between
alpha oscillations of the left temporal region and alpha oscillations of the frontal region (e.g.,
Gallicchio et al., 2016). Building upon the notion that the left temporal and the frontal regions
are involved in language and movement planning respectively, reduced left temporal:frontal
alpha connectivity has been interpreted as a marker of the selective inhibition of the left-
hemisphere and decreased cognitive/verbal interference during preparation for movement
execution (Deeny et al., 2003).
More recently, a series of studies has associated left temporal:frontal alpha
connectivity with the propensity to consciously monitor and control one's movements – i.e.,
movement-specific conscious processing – during golf putting (Gallicchio et al., 2016; Zhu et
al., 2011). Three lines of evidence support these views. First, lower left temporal:frontal
alpha connectivity in preparation for putting as well as lower putting-related conscious
processing were found for expert golfers compared to novices (Gallicchio et al., 2016).
Second, individuals who were dispositionally less prone to engage in conscious processing
displayed lower left temporal:frontal alpha connectivity prior to putting compared to
individuals more prone to engage in conscious processing (Zhu et al., 2011). Third, novice
golfers who were trained implicitly, which was associated with lower conscious processing,
showed decreased left temporal:frontal alpha connectivity when putting compared to novice
golfers who were trained explicitly (Zhu et al., 2011).
Taken together, these findings suggest that decreased left temporal:frontal alpha
connectivity and decreased movement-specific conscious processing are features of expertise.
This is in line with classic theories of motor skill learning that argue that the development of
motor expertise is accompanied by a gradual withdrawal of cognitive analysis and decreased
awareness of one's movements (e.g., Fitts & Posner, 1967). These theories suggest that,
following extensive practice, individuals can progress from a cognitive stage, characterized

25
by deliberate and conscious analysis of movement, to an autonomous stage, characterized by
automatic control of movement.
While the extant literature argues for greater neural efficiency as expertise develops,
some potential limitations still need to be overcome. First, the putative link between expertise
and neural efficiency is mostly based on expert-novice differences seen in cross-sectional
designs. These findings do not provide a direct test of the hypothesis that practice leads to
greater neural efficiency because of the unfeasibility of randomly allocating participants to
either the expert or the novice group. For example, it could be that, irrespectively of practice,
individuals who show greater neural efficiency are more likely to become experts compared
to individuals who show lower neural efficiency. To date, only two studies have examined
the effects of practice on neural efficiency using a longitudinal design (Kerick et al., 2004;
Landers et al., 1994). These studies found that performance improvements in archery
(Landers et al., 1994) and pistol shooting (Kerick et al., 2004) after three months of training
were associated with increased alpha power over the left temporal region of the cortex.
However, they did not examine any practice-induced changes in cortical connectivity.
Second, no study to date has examined the neurophysiological factors accounting for the
development of expertise. Within-subject mediation analyses (Judd, Kenny & McClelland,
2001) can be used to examine changes in neural efficiency as a function of performance
improvements and thereby shed some light on the mechanisms responsible for the
improvements associated with practice.
Third, most studies have employed global measures of performance (e.g., hits versus
misses, distance from the target) that can potentially obscure the individual contribution of
distinct parameters involved in movement planning and execution. For example, the
movement of a golf ball putted on a flat surface can be conceptualized as a vector having a
certain direction and force. Indeed, there is good evidence that there are different neuronal
26
populations that respond selectively to changes in movement direction and force (e.g., Riehle
& Requin, 1995). Accordingly, the examination of angle and length errors, respectively
associated with movement direction and force, can provide more refined measures of
performance that may be differentially sensitive to changes in neural efficiency.
The present exploratory study was designed to address these limitations. Our aims
were threefold. First, to describe the neurophysiological adaptations that accompany the
development of expertise through practice. Second, to identify neurophysiological mediators
that account for changes in performance and movement-specific conscious processing with
practice. Third, to evaluate the differential impact of movement direction and force planning
on neurophysiological activity. Data were collected in the context of a study designed to
examine the efficacy of a neurofeedback training protocol on golf putting performance (Ring
et al., 2015). Here we report new analyses that were conducted on the data of the control
group who underwent putting training sessions while receiving sham neurofeedback (i.e.,
who did not receive genuine feedback of cortical activity). We expected that performance
would improve with practice and that these improvements would be mediated by increased
regional gating of alpha power, reduced cross-regional alpha connectivity, as well as reduced
movement-specific conscious processing, in accord with the predictions of the psychomotor
efficiency hypothesis.
Method
Participants
Twelve right-handed male recreational golfers took part in this study (age: M = 21.00,
SD = 2.52 years). The participants reported a mean golf experience of 4.63 years (SD = 2.89)
and a mean golf handicap of 23.33 (SD = 4.62). All participants provided informed consent.

27
Putting task
Golf balls (diameter 4.7 cm) were putted on an artificial flat putting surface (Turftiles)
to a hole (diameter 10.8 cm) at a distance of 2.4 m, using a blade-style putter (length 90 cm).
The participants were instructed to get each ball “ideally in the hole, but if unsuccessful, to
make them finish as close to the hole as possible.”
Training
In each 1-hour training session participants practiced putting. Participants wore a cap
with one frontal scalp electrode and reference and ground electrodes placed on the left and
right mastoids respectively. They were instructed to try to regulate the pitch of a tone by
changing their brain activity while preparing for putting and then to putt the ball when the
tone was silenced. Specifically, they would stand over the ball and hear the pitch of a tone
increase and decrease, and occasionally go silent for 1.5 seconds, which was a cue to putt. In
reality, the tone was independent of their brain activity (i.e., sham neurofeedback), and was
yoked to an experimental participant who received genuine neurofeedback: thus the sham
feedback participants acted as controls in Ring et al. (2015). Each training session comprised
twelve 5-minute blocks.
Procedure
A test-retest design was employed, with participants visiting the laboratory on five
different days: putting task on day 1 (i.e., test); training on days 2-4; putting task on day 5
(i.e., retest). On average, the test-retest interval was 8.17 (SD = 5.24) days and the final
training session to retest session interval was 2.00 (SD = 2.59) days. In the test and retest
sessions, participants were instrumented for EEG recording, instructed, then completed 20
familiarisation putts followed by 50 test putts. In each of the three training sessions
separating the test and retest sessions, participants completed a mean of 181.25 (SD = 52.25)
practice putts. Thus, the total number of putts in training was 543.75 (SD = 127.01). The

28
study protocol was approved by the local research ethics committee.
EEG Recording
In the test and retest sessions 32 active electrodes were positioned on the scalp,
according to the 10-20 system, at: Fp1, Fp2, AF3, AF4, F7, F3, Fz, F4, F8, FC5, FC1, FC2,
FC6, T7, C3, Cz, C4, T8, CP5, CP1, CP2, CP6, P7, P3, Pz, P4, P8, PO3, PO4, O1, Oz, O2. In
addition, four active electrodes were placed at the bottom and at the outer canthus of both
eyes. Common mode sense and driven right leg electrodes were used to enhance the common
mode rejection ratio of the signal. The signal was amplified and digitized at 512 Hz with 24-
bit resolution, using the ActiveTwo recording system (Biosemi, Netherlands). Signals were
down-sampled offline to 256 Hz, 1-35 Hz band-pass filtered (FIR, order 512), and re-
referenced to the average of all EEG channels. Channels with bad signals were removed and
interpolated prior to averaging. Non-neural activity was minimized using the Artifact
Subspace Reconstruction plugin for EEGLAB (Delorme & Makeig, 2004). Epochs were
extracted from –3.25 to +1.25 s relative to the initiation of the backswing, which was
triggered when the putter head broke the beam of an optical sensor interfaced with the
ActiveTwo recording system.
Time-frequency decomposition was performed through short-time Fast Fourier
Transform (FFT) on 33 overlapping segments each of the duration of 0.5 s and linearly
spaced with centre points ranging from –3 to +1 s. Prior to FFT, each segment was also
Hanning-windowed to taper both ends to 0 and then 0-padded to reach 2 s duration. This
procedure generated complex-valued FFT coefficients in the time-frequency plane with a
precision of 0.125 s and 0.5 Hz. Six Regions Of Interest (ROIs) were identified: left temporal
(FC5, T7, CP5), left central (FC1, C3, CP1), frontal (F3, Fz, F4), right central (FC2, C4,
CP2), right temporal (FC6, T8, CP6), and occipital (O1, Oz, O2). Signal processing was
performed using the EEGLAB toolbox (Delorme & Makeig, 2004) and MATLAB

29
(MathWorks, USA).
Measures
Putting performance. The number of holed putts out of 50 was recorded in the test
and retest sessions. Additionally, three performance errors – radial (cm), angle (degrees), and
length (cm) errors (Supplemental Material of Chapter Two, Figure S1) – were computed for
each putt using a camera system (Neumann & Thomas, 2008) and averaged (geometric mean)
to yield measures for the test and retest sessions.
Alpha power. Power (µV²) was computed in the time-frequency plane separately for
each channel and trial (i.e., putt) as the product between each FFT coefficient and its complex
conjugate (i.e., equivalent to amplitude squared). Importantly, no baseline was employed.
Instead, skewness and inter-individual differences in the power density distributions were
dealt with by employing a median-scaled transformation: each participant’s values were
scaled by their median and then log-transformed (10·log10). This procedure meant that
power was normally distributed with a mean of zero for each participant, without altering
within-subject relations. Power was then averaged across time (–3 to –2 s, –2 to –1 s, –1 to 0
s,0 to +1 s, where zero represents initiation of the backswing), channels (ROIs), putts, and
frequency (10-12 Hz) to yield estimates of alpha oscillatory power in each session (test,
retest). Alpha is typically around 8-12 Hz, however, we focused on the upper portion of this
range, (i.e. 10-12 Hz) on the basis of spectral features that were evident in the current data
(see Supplemental Material of Chapter Two, Figure S4).
Alpha connectivity. Inter Site Phase Clustering (ISPC) was computed as the length of
the complex-valued resultant of cross-trial clustering of unitary complex vectors having as
angle the phase difference between channel pairs for each point of the time-frequency plane
(M.X. Cohen, 2014; Lachaux et al., 1999). ISPC measures the phase lag consistency across
trials (i.e., putts) between two channels independently from their power and reflects the

30
functional connectivity between the oscillatory activity of two underlying cortical regions,
with values ranging from 0 (no connectivity) to 1 (perfect connectivity). The impact of
volume conduction on connectivity was examined by taking the absolute imaginary part of
the Inter Site Phase Clustering (imISPC) (cf. Nolte et al., 2004). Like ISPC, imISPC reflects
functional connectivity with values ranging from 0 to 1, however, imISPC is insensitive to
instantaneous connectivity (i.e., 0- or π- lagged) and therefore values are much smaller than
ISPC. No baselines were used. Instead, to normalize their density distributions, ISPC and
imISPC were Fisher Z-transformed (inverse hyperbolic tangent); values could range then
from 0 to ∞. Values were then averaged (arithmetic mean) across time (–3 to –2 s, –2 to –1 s,
–1 to 0 s, 0 to +1 s), channel (ROI) pairs, and frequency (10-12 Hz) to yield estimates of
alpha connectivity in each session (test, retest).
Conscious processing. Self-reported conscious processing was measured immediately
after completing the putting task in the test and retest sessions using a putting-specific version
(Cooke et al., 2011; Vine et al.,2013) of the conscious motor processing sub-scale of the
Movement Specific Reinvestment Scale (Orrell, Masters, & Eves, 2009). This scale consists
of six items scored on a 5-point Likert scale (1 = never, 3 = sometimes, 5 = always) related to
the feeling of awareness of the kinematics involved in execution of the putt and thoughts
about putt outcome. The six items were averaged to generate a single scale score. Past
research (Cooke et al., 2011; Vine et al., 2013) has established the reliability (α = .81-.88)
and validity of the putting-specific version of the conscious motor processing sub-scale of the
Movement Specific Reinvestment Scale.
Statistical Analyses
Performance and conscious processing. Changes from test to retest in putting
performance and conscious processing were examined by paired-sample t-tests. Within each
session the relation between the number of holed putts and the three performance errors was

31
examined through Pearson's correlations.
Alpha power and connectivity. Power was subjected to a 2 Session (test, retest) × 6
ROI (left temporal, left central, frontal, right central, right temporal, and occipital) × 4 Time
(–3 to –2, –2 to –1, –1 to 0, 0 to +1 s) ANOVA. In addition, contrast analyses were
performed to examine changes in power over time. ISPC and imISPC were each subjected to
2 Session × 4 Time ANOVAs, conducted separately on each of two ROI pairs (left
temporal:frontal, right temporal:frontal), chosen on the basis of previous literature (Deeny et
al., 2003, 2009; Gallicchio et al., 2016; Zhu et al., 2011). The multivariate solution was
reported in the ANOVAs where appropriate (Vasey & Thayer, 1988). Significant main
effects were interrogated using post hoc testing. Partial eta-squared (η²p) and r² are reported
as measures of effect size: values of .02, .13, and .26 were taken to reflect small, medium,
and large effects, respectively (J. Cohen, 1992).
Mediation. Mediation analyses were conducted to test whether changes across
sessions in the number of holed putts could be accounted for by changes in performance
errors, conscious processing, alpha power, and alpha connectivity. We also tested whether
changes in conscious processing could be attributed to changes in alpha power and
connectivity. We used the procedure described by Judd et al. (2001) for repeated-measures
designs: multiple regression was used to predict the test to retest change in the dependent
variable based on the test to retest change in the potential mediator variable, while controlling
for its mean-centred sum. Full mediation can be inferred when the regression coefficient
associated with the change in the mediator variable is significant (i.e., p < .05), and partial
mediation is inferred when the coefficient associated with the intercept is also significant.
The following strategy was adopted to reduce the likelihood of type-I errors: we first assessed
whether the change in the number of holed putts was mediated by changes in any of the
potential mediator variables, and only if this was the case were mediation analyses conducted

32
on the changes in the performance errors and conscious processing.
Results
Putting performance
Overall, every putting performance measure improved with training from test to re-
test (Table 2.1). However, there were considerable individual differences: not all participants
improved equally and in fact a few got worse (Supplemental Material of Chapter Two, Figure
S2). The number of holed putts was highly negatively correlated with the three performance
errors (rs = –.77 to –.92, ps < .003), with angle error the highest (Supplemental Material of
Chapter Two, Table S1).
Table 2.1. Descriptive statistics of putting performance as a function of session together with
the results of the paired-sample t-tests.
Test
M (SD)
Retest
M (SD) t(11) p r²
holed putts (0-50) 12.17 (2.39) 16.25 (2.97) 2.18 .05 .301
radial error (cm) 10.95 (1.59) 8.05 (1.23) 2.26 .04 .317
angle error (degrees) 1.39 (0.12) 1.17 (0.14) 1.74 .11 .215
length error (cm) 8.80 (1.27) 6.42 (0.95) 2.22 .05 .310
Alpha power
The 2 Session × 6 ROI × 4 Time ANOVA conducted on EEG power revealed a large
main effect of ROI, F(5,7) = 105.49, p < .001, η²p = .987. Post-hoc Scheffé tests indicated (p
< .001) that power was higher in the occipital than left/right temporal and frontal regions,
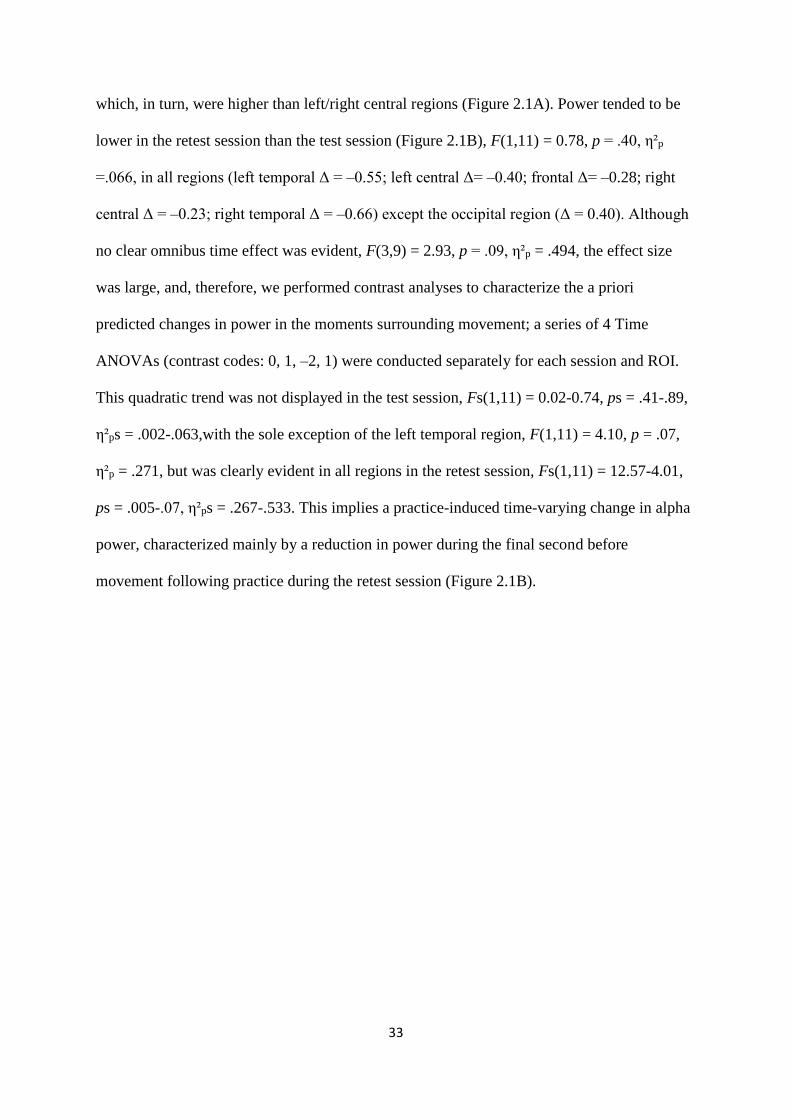
33
which, in turn, were higher than left/right central regions (Figure 2.1A). Power tended to be
lower in the retest session than the test session (Figure 2.1B), F(1,11) = 0.78, p = .40, η²p
=.066, in all regions (left temporal Δ = –0.55; left central Δ= –0.40; frontal Δ= –0.28; right
central Δ = –0.23; right temporal Δ = –0.66) except the occipital region (Δ = 0.40). Although
no clear omnibus time effect was evident, F(3,9) = 2.93, p = .09, η²p = .494, the effect size
was large, and, therefore, we performed contrast analyses to characterize the a priori
predicted changes in power in the moments surrounding movement; a series of 4 Time
ANOVAs (contrast codes: 0, 1, –2, 1) were conducted separately for each session and ROI.
This quadratic trend was not displayed in the test session, Fs(1,11) = 0.02-0.74, ps = .41-.89,
η²ps = .002-.063,with the sole exception of the left temporal region, F(1,11) = 4.10, p = .07,
η²p = .271, but was clearly evident in all regions in the retest session, Fs(1,11) = 12.57-4.01,
ps = .005-.07, η²ps = .267-.533. This implies a practice-induced time-varying change in alpha
power, characterized mainly by a reduction in power during the final second before
movement following practice during the retest session (Figure 2.1B).

34
Figure 2.1. (A) Scalp maps representing alpha power (10·log10(µV²)) averaged across
participants, as a function of session (test, retest), time (–3 to +1 s), and channel. (B) Alpha
power (10·log10(µV²)) averaged across participants, as a function of session (test, retest) and
time (–3 to +1 s) in the six regions. Error bars represent the standard error of the mean.
Alpha connectivity

35
The 2 Session × 4 Time ANOVAs on the left temporal:frontal connectivity indices
(Figure 2.2) revealed no main effects for session (ISPC: Δ = 0.01, F(1,11) = 1.02, p = .34, η²p
= .085; imISPC: Δ = –0.004, F(1,11) = 0.35, p = .57, η²p = .031) or time (ISPC: F(3,9) =
0.77, p = .54, η²p = .203; imISPC, F(3,9) = 3.46, p = .06, η²p = .536). Similarly, no effects
emerged with right temporal:frontal connectivity (Figure 2.2) as a function of session (ISPC:
Δ = 0.01, F(1,11) = 0.75, p = .41, η²p = .064; imISPC: Δ = 0.008, F(1,11) = 2.512, p = .14, η²p
= .186) and time (ISPC: F(3,9) = 0.63, p = .61, η²p = .174; imISPC: F(3,9) = 0.69, p = .58, η²p
= .187). No session by time interactions emerged. Finally, the results from all ROI pairs are
reported in the Supplemental Material of Chapter Two (Figure S5) for interested readers.
Figure 2.2. Left / right temporal:frontal alpha ISPC and imISPC averaged across participants
as a function of session (test, retest) and time (–3 to +1 s). Error bars represent the standard
error of the mean.

36
Conscious processing
Overall conscious processing decreased from test (M = 3.88, SD = 0.20) to retest (M =
3.36, SD = 0.24), t(11) = 2.59, p = .03, r² = .378. Again, there were large individual
differences in the extent of this change, with four participants opposing the trend by reporting
the same or greater conscious processing after training (Supplemental Material of Chapter
Two, Figure S3).
Mediators of the change in putting performance
Putting performance improved with practice. On average, participants holed 4.08
more balls (i.e., an 8.2% improvement) in the retest session compared to the test session. Judd
et al.’s (2001) regression-based within-subject mediation analyses indicated that this
improvement was fully mediated by the reduction in angle error from test to retest (b = –9.82,
p = .008); the intercept (a = 1.89, p = .21) indicated that, had angle error not changed from
test to retest, the improvement would have been reduced to only 1.89 additional holed putts,
which represents a non-significant change in performance. Neither radial error (b = –0.88, p =
.06) nor length error (b = –0.81, p = .17) mediated performance improvement. Further,
conscious processing did not mediate the change in performance (b = –1.23, p = .70).
In terms of alpha power, the improvement in putting performance was partially
mediated by the change in left temporal power in the seconds surrounding backswing
initiation (–1 to 0 s: b = 2.46, p = .04; 0 to 1 s: b = 2.07, p = .04; see Figure 2.3). Since power
tended to decrease with practice (Figure 2.1B), smaller reductions in left temporal power
from test to retest were associated with larger improvements in performance. Based on the
associated intercepts (–1 to 0 s: a = 6.07, p = .005; 0 to 1 s: a = 5.04, p = .01), this means that
an individual who increased their left temporal power from test to retest in the second before
backswing initiation would be predicted to hole at least two more putts whereas someone
who increased power from test to retest in the second after initiation would be predicted to

37
hole at least one more putt. Furthermore, left temporal power within the –1 to 0 s interval also
partially mediated the reduction in angle (b = –0.19, p = .03) but not radial (b = –1.72, p =
.06) or length (b = –1.33, p = .09) errors (Supplemental Material of Chapter Two, Figure S6).

38
Figure 2.3. (A) Scalp maps representing Pearson's correlations conducted on the inter-session change scores between the number of holed putts
and alpha power, as a function of time (–3 to +1 s) and channel. (B) Time-frequency plots representing Pearson's correlations conducted on the
inter-session change scores between the left temporal alpha power (10·log10(µV²)) and the number of holed putts, as a function of time (–3 to +1
s) and frequency (0 to 32 Hz).

39
In terms of alpha connectivity, putting performance was partially mediated by the inter-
session change in left temporal:frontal ISPC within the –2 to –1 s interval (b = –120.60, p = .01).
Since ISPC tended to increase with practice (Figure 2.2), smaller increases in left
temporal:frontal connectivity from test to retest were associated with larger improvements in
putting performance. Based on the intercept (a = 5.88, p = .004), performance would be
predicted to improve by at least two more holed putts if left temporal:frontal ISPC decreased
within this time interval. The same analysis conducted on imISPC also revealed a negative
relation, (b = –53.02, p = .28). Furthermore, left temporal:frontal ISPC within the –2 to –1 s
interval also partially mediated the reduction in angle (b = 6.35, p = .05), but not radial (b =
56.97, p = .13) and length (b = 35.52, p = .28) errors.
Right temporal:frontal ISPC and imISPC did not mediate the improvement in putting
performance (ps = .19-.93). Lastly, mediation analyses on all ROI pairs (Supplemental Material
of Chapter Two, Figure S7A, B) indicated that the relation between smaller increases in left
temporal:frontal ISPC and greater performance improvement extended to a network linking the
left temporal region to the other cortical regions.
Mediators of the change in conscious processing
On average, participants reported less conscious processing (Δ = –0.52) from test to
retest. This reduction in conscious processing was fully mediated (a = –0.34, p = .09) by the
change in left temporal:frontal ISPC within the –2 to –1 s interval (b = –11.87, p = .03), whereby
decreases in conscious processing were associated with increases in ISPC. Finally, the mediation
analyses involving all ROI pairs (Supplemental Material of Chapter Two, Figure S7C, D)
showed that changes in conscious processing were related to changes in connectivity across a
broad network of cortical regions.

40
Discussion
Performance improved from test to retest. That retention was assessed a couple of days after the
end of training provided evidence for motor learning (e.g., Salmoni, Schmidt & Walter, 1984).
The primary aim of this exploratory study was to identify the neurophysiological factors that
mediate changes in motor performance with practice. Improvements in golf putting performance
from before (test) to after (retest) completing three training sessions were mediated by EEG
alpha power and alpha connectivity in preparation for putting but not by self-reported conscious
processing.
Alpha power
Spectral analyses revealed a distinct 10-12 Hz peak compatible with the alpha rhythm
(see Supplemental Material of Chapter Two, Figure S4), and therefore activity within this
frequency range was interpreted as reflecting cortical alpha oscillations. Alpha activity was
displayed across the different regions of the cortex in a focal pattern: power was lowest over the
central regions, medium over the temporal regions, and highest over the occipital region. In line
with the gating-by-inhibition hypothesis (Jensen & Mazaheri, 2010) the observed regional
pattern suggests that neuronal resources were taken away from occipital and temporal regions
(i.e., highest inhibition) and diverted towards the central regions (i.e., lowest inhibition) during
movement preparation. This focal pattern, which was evident in both test and retest sessions,
could reflect the prior practice history of our participants, who were all experienced golfers, and
therefore had already developed a degree of psychomotor efficiency related to the putting
movement.
Efficiency-based changes in alpha power due to training can be inferred from our

41
mediation analyses. Importantly, they suggested that participants who were able to sustain a
relatively higher power in the temporal regions from test to retest in the seconds surrounding
movement improved their putting performance the most. This effect was localized to the left
(and to a lesser extent, the right) temporal region and can be interpreted in terms of alpha gating:
increased inhibition in regions not directly involved in putting-relevant processing is beneficial
to putting. That this effect was absent in the occipital region is most likely because occipital
inhibition was already the strongest among the regions examined and tended to strengthen
further with training. In other words, likely there was a ceiling effect for occipital alpha, whereby
further increases did not benefit performance.
It is also worth noting that while a relatively higher level of temporal alpha power was
beneficial, practice also prompted a decrease in power, especially at the frontal region, in the
final second preceding movement. This quadratic trend for time-varying alpha power in the retest
session could be interpreted as reflecting the timely allocation of resources to putting-relevant
processing (Cooke et al., 2015). Indeed, this quadratic pattern is consistent with previous
research and has been associated with expertise and successful performance in experts (Babiloni
et al., 2008; Cooke et al., 2014). However, as this quadratic decrease in alpha power at retest did
not mediate changes in performance, the inhibition of irrelevant cortical regions seems to have
been more important for performance improvement than the timely activation of relevant ones.
This remains a topic for future research, which may consider variables such as task and
experience as potential moderators of any effects.
Alpha connectivity
Functional connectivity was examined between the temporal and frontal regions using
two indices based on the consistency of cross-regional phase lag across trials: ISPC and imISPC.

42
The latter is a conservative version of the former that is not biased by volume conduction. The
fact that 10-12 Hz imISPC was non-zero (Figure 2.2) indicated the likely presence of genuine
alpha connectivity. Neither connectivity index changed across the time intervals or from test to
retest. However, mediation analyses suggested that greater improvements in performance from
test to retest were achieved by participants displaying relatively lower left temporal:frontal
connectivity a couple of seconds before putt initiation. Low left temporal:frontal alpha
connectivity has been associated with expertise and successful putting performance in experts
(Babiloni et al., 2011; Gallicchio et al., 2016). At the neurophysiological level, lower
connectivity represents a stronger disconnection between the two signals – i.e., left temporal
alpha and frontal alpha – provided that the two signals are not projections of the same source
generator because of volume conduction within the head.
The additional analyses performed on a wider network of regions (Supplemental Material
of Chapter Two, Figure S7) revealed that performance improvements were not exclusively
associated with a stronger disconnection of alpha activity between left temporal and frontal
regions. Rather, it is evident that improved performance was associated with a functional
isolation of left temporal alpha from many other regional alpha activities. Taken together, these
analyses provide preliminary support for our hypothesis that improvements in performance with
practice would be mediated by reduced connectivity (i.e., less cortico-cortical communication)
between alpha oscillations in the left temporal region and other regions of the cortex, including
the frontal region (cf., Deeny et al., 2003; Gallicchio et al., 2016; Zhu et al., 2011).
Conscious processing
Movement-specific conscious processing decreased and performance improved with
practice, in line with the classic theories of motor skill learning (e.g., Fitts & Posner, 1967).

43
However, mediation analyses did not support the putative link between decreased conscious
processing and performance improvement. Similarly, Malhotra et al. (2015) also found no
relation between improvements in putting performance and changes in conscious processing with
training. It should be noted that these two null findings reflect the absence of a linear relation;
however, our analyses indicate a curvilinear relationship: participants who reported a moderate
decrease in conscious processing improved more than those who reported a large decrease, no
change, and even a small increase in conscious processing (Supplemental Material of Chapter
Two, Figure S8). It has been increasingly recognized that conscious processing does not always
negatively impact performance but can foster performance improvements in experts (Toner &
Moran, 2014) and novices (Malhotra et al., 2015). Given these findings it would be fruitful for
future research to seek to identify optimal levels of conscious processing as a function of factors
such as task, expertise and personality. Such research should also consider sub-components of
conscious processing, for instance, distinguishing conscious monitoring and conscious control
(Toner & Moran, 2011), particularly when they are about to putt, which should be able to paint a
better picture of what individuals attend to in the moments before movement initiation.
Mediation analyses suggested that decreases in conscious processing from test to retest were
associated with increases in alpha connectivity across a network involving all cortical regions
examined (Supplemental Material of Chapter Two, Figure S7). Higher connectivity represents a
stronger connection between the alpha oscillations, and therefore suggests that decreased
movement-specific conscious processing or awareness of one’s movements is associated with
multiple cortical regions engaging in similar and consistent inhibition (cf. Baars, 2002). This
interpretation awaits confirmation.
Performance errors

44
The analyses of the three performance metrics – i.e., radial, angle, and length errors –
revealed that improvements in the number of holed putts with practice was largely due to
reductions in angle error rather than radial or length errors. This finding suggests that a more
precise alignment of the putter head with the ball at the moment of impact is more beneficial to
putting outcome than appropriate impact velocity (Cooke et al., 2010). Additionally, all of the
significant associations observed between EEG activity and putting performance errors were
found for angle error, suggesting that programming of movement direction is better reflected in
alpha activity than movement force. Although there is evidence that movement direction and
force are selectively coded by different neuronal populations (e.g., Riehle & Requin, 1995),
future research is needed to clarify the relationship between alpha oscillations, on the one hand,
and programming of movement parameters, on the other hand.
Limitations and future research
The current study yielded some novel and important findings regarding the causal
relations among practice, cortical efficiency, conscious processing and performance. However,
their interpretation should be considered in light of potential limitations. First, although the
putting task was completed under ecologically valid conditions, the training cannot be
considered a form of discovery learning because participants received sham neurofeedback.
Moreover, we did not employ a control group who did not receive any form of neurofeedback.
We cannot determine the impact of the current training protocol and therefore future research
should consider replicating our findings using other forms of training, including discovery
learning, and appropriate control groups.
Second, we refrained from interpreting activity in different cortical regions in terms of
specific cognitive processes because we did not measure nor manipulate cognition directly. We

45
acknowledge that the presence of a certain regional activation makes some cognitive processes
more likely to be involved than others, however, we avoided reverse inference (Poldrack, 2006)
and postponed interpretation. Indeed, it would be worth studying the relation between regional
activation and cognitive processes using experimental designs where cognition is manipulated
(rather than simply measured) in the context of precision aiming.
Third, the use of spectral decomposition on (inherently non-stationary) EEG signals
implies that power is likely to be greater than 0 at any unfiltered frequency, irrespectively of the
presence of actual neural generators oscillating at that frequency. The distinct 10-12 Hz power
peak in the group-averaged frequency plots (see Supplemental Material of Chapter Two, Figure
S4) supported the likely presence of cortical oscillations within this frequency band. However,
the use of a fixed range did not account for individual variations. Future studies could
individually adjust these ranges to obtain greater specificity and sensitivity (cf. Klimesch, 1999).
Fourth, we considered measures of alpha as candidates to mediate the main effect of
session on performance despite having non-significant main effects themselves. This strategy is
in line with current guidelines recommending that mediation only requires the existence of an
effect to be mediated (i.e., change in performance) for that effect to be indirectly influenced by
the mediator variables (e.g., alpha power) (Preacher & Hayes, 2004). Our approach satisfies
these criteria, nonetheless, we did not manipulate any of the mediator variables, and therefore the
outcome variable (i.e., performance) may have influenced the mediatior variables (Cooke et al.,
2015). It would be useful to replicate these analyses in larger samples with more statistical power
where the mediators are manipulated independently of the outcome variables, using, for instance,
brain stimulation or neurofeedback training.
Fifth, the greater relative importance of the angle error over radial and length errors is

46
potentially biased by the presence of an actual hole, which may have influenced our performance
measurements, particularly in regards to length error. For example, balls can be redirected by the
hole (e.g., a lip out) and most balls that dropped into the hole would otherwise have rolled past
the hole had the hole not been present, introducing variability that cannot be accounted for by the
measurements. Future studies could use a mark on the mat instead of a hole to overcome this
limitation.
Finally, we only tested experienced golfers that arguably lay somewhere between the
cognitive and the autonomous stage of learning (cf. Fitts & Posner, 1967). Given that the
particular stage of learning that the individual is in may moderate the adaptations in alpha gating
and connectivity with training, future research could examine these learning-related adaptations
in novices and experts as well as experienced individuals.
Conclusions
This exploratory study provides preliminary evidence that practice of a motor skill leads
to neurophysiological adaptations compatible with the psychomotor efficiency hypothesis
(Hatfield & Hillman, 2001). Efficiency was manifested as selective inhibition and functional
isolation of task-irrelevant cortical regions and concomitant functional activation of task-relevant
regions. Our findings suggest that processing in broadly central regions (cf., Andersen & Buneo,
2002; Desmurget et al., 2009) is more important than processing in temporal regions (cf., Kerick
et al., 2001) while performing a precision aiming task, such as golf putting. These findings imply
that larger improvements in precision aiming performance with practice may be achieved by
employing training protocols that foster suppression of task-irrelevant processes.

47
References
Andersen, R. A., & Buneo, C. A. (2002). Intentional maps in posterior parietal cortex. Annual
review of neuroscience, 25(1), 189-220.
http://dx.doi.org/10.1146/annurev.neuro.25.112701.142922
Baars, B. J. (2002). The conscious access hypothesis: origins and recent evidence. Trends in
cognitive sciences, 6(1), 47-52. http://dx.doi.org/10.1016/S1364-6613(00)01819-2
Babiloni, C., Del Percio, C., Iacoboni, M., Infarinato, F., Lizio, R., Marzano, N., ... & Eusebi, F.
(2008). Golf putt outcomes are predicted by sensorimotor cerebral EEG rhythms. The
Journal of physiology, 586(1), 131-139. http://dx.doi.org/10.1113/jphysiol.2007.141630
Babiloni, C., Infarinato, F., Marzano, N., Iacoboni, M., Dassù, F., Soricelli, A., . . . Del Percio,
C. (2011). Intra-hemispheric functional coupling of alpha rhythms is related to golfer’s
performance: A coherence EEG study. International Journal of Psychophysiology, 82,
260–268. http://dx.doi.org/10.1016/j.ijpsycho.2011.09.008
Cohen, J. (1992). A power primer. Psychological Bulletin, 112, 155-159.
http://dx.doi.org/10.1037/0033-2909.112.1.155
Cohen, M. X. (2014). Analyzing neural time series data: Theory and practice. Cambridge, MA:
MIT Press.
Cooke, A. (2013). Readying the head and steadying the heart: A review of cortical and cardiac
studies of preparation for action in sport. International Review of Sport & Exercise
Psychology, 6, 122-138. http://dx.doi.org/10.1080/1750984X.2012.724438
Cooke, A., Gallicchio, G., Kavussanu, M., Willoughby, A., McIntyre, D., & Ring, C. (2015).
Premovement high-alpha power is modulated by previous movement errors: Indirect

48
evidence to endorse high-alpha power as a marker of resource allocation during motor
programming. Psychophysiology, 52, 977-981. http://dx.doi.org/10.1111/psyp.12414
Cooke, A., Kavussanu, M., Gallicchio, G., Willoughby, A., McIntyre, D., & Ring, C. (2014).
Preparation for action: Psychophysiological activity preceding a motor skill as a function
of expertise, performance outcome, and psychological pressure. Psychophysiology, 51,
374-384. http://dx.doi.org/10.1111/psyp.12182
Cooke, A., Kavussanu, M., McIntyre, D., Boardley, I.D., & Ring, C. (2011). Effects of
competitive pressure on expert performance: underlying psychological, physiological,
and kinematic mechanisms. Psychophysiology, 48, 1146-1156.
http://dx.doi.org/10.1111/j.1469-8986.2011.01175.x
Cooke, A., Kavussanu, M.,McIntyre, D., & Ring, C. (2010). Psychological, muscular and
kinematic factors mediate performance under pressure. Psychophysiology, 47, 1109-
1118. http://dx.doi.org/10.1111/j.1469-8986.2010.01021.x
Deeny, S. P., Hillman, C. H., Janelle, C. M., & Hatfield, B. D. (2003). Cortico-cortical
communication and superior performance in skilled marksmen: an EEG coherence
analysis. Journal of Sport and Exercise Psychology, 25, 188-204.
http://psycnet.apa.org/psycinfo/2003-05573-006
Deeny, S. P., Haufler, A. J., Saffer, M., & Hatfield, B. D. (2009). Electroencephalographic
coherence during visuomotor performance: a comparison of cortico-cortical
communication in experts and novices. Journal of Motor Behavior, 41, 106-116.
http://dx.doi.org/10.3200/JMBR.41.2.106-116
Delorme, A., & Makeig, S. (2004). EEGLAB: an open source toolbox for analysis of single trial
EEG dynamics including independent component analysis. Journal of Neuroscience

49
Methods, 134, 9-21. http://dx.doi.org/10.1016/j.jneumeth.2003.10.009
Desmurget, M., Reilly, K. T., Richard, N., Szathmari, A., Mottolese, C., & Sirigu, A. (2009).
Movement intention after parietal cortex stimulation in humans. Science, 324(5928), 811-
813. http://dx.doi.org/10.1126/science.1169896
Fitts, P. M., & Posner, M. I. (1967). Human performance. Belmont, CA: Brooks/Cole.
Gallicchio, G., Cooke, A., & Ring, C. (2016). Lower left temporal-frontal connectivity
characterizes expert and accurate performance: High-alpha T7-Fz connectivity as a
marker of conscious processing during movement. Sport, Exercise & Performance
Psychology, 5(1), 14-24. http://dx.doi.org/10.1037/spy0000055
Hatfield, B. D., Haufler, A. J., Hung, T. M., & Spalding, T. W. (2004). Electroencephalographic
studies of skilled psychomotor performance. Journal of Clinical Neurophysiology, 21,
144-156. http://dx.doi.org/10.1097/00004691-200405000-00003
Hatfield, B. D., & Hillman, C. H. (2001). The psychophysiology of sport: A mechanistic
understanding of the psychology of superior performance. In R. N. Singer, H. A.
Hausenblas, & C. M. Janelle (Eds.), Handbook of sport psychology (2nd ed., pp. 362-
386). New York: Wiley.
Haufler, A. J., Spalding, T. W., Santa Maria, D. L., & Hatfield, B. D. (2000). Neuro-cognitive
activity during a self-paced visuospatial task: comparative EEG profiles in marksmen and
novice shooters. Biological Psychology, 53(2), 131-160. http://dx.doi.org/10.1016/S0301-
0511(00)00047-8
Janelle, C. M., Hillman, C. H., Apparies, R. J., Murray, N. P., Meili, L., Fallon, E. A., &
Hatfield, B. D. (2000). Expertise differences in cortical activation and gaze behavior
during rifle shooting. Journal of Sport and Exercise psychology, 22, 167-182.

50
https://doi.org/10.1123/jsep.22.2.167
Jensen, O., & Mazaheri, A. (2010). Shaping functional architecture by oscillatory alpha activity:
gating by inhibition. Frontiers in Human Neuroscience, 4, 1-8.
http://dx.doi.org/10.3389/fnhum.2010.00186
Judd, C. M., Kenny, D. A., & McClelland, G. H. (2001). Estimating and testing mediation and
moderation in within-subject designs. Psychological Methods, 6(2), 115-134.
http://dx.doi.org/10.1037/1082-989X.6.2.115
Kerick, S. E., Douglass, L. W., & Hatfield, B. D. (2004). Cerebral cortical adaptations associated
with visuomotor practice. Medicine and Science in Sports and Exercise, 36(1), 118-129.
http://dx.doi.org/10.1249/01.MSS.0000106176.31784.D4
Kerick, S. E., McDowell, K., Hung, T. M., Santa Maria, D. L., Spalding, T. W., & Hatfield, B.
D. (2001). The role of the left temporal region under the cognitive motor demands of
shooting in skilled marksmen. Biological Psychology, 58(3), 263-277.
http://dx.doi.org/10.1016/S0301-0511(01)00116-8
Klimesch, W. (1999). EEG alpha and theta oscillations reflect cognitive and memory
performance: a review and analysis. Brain Research Reviews, 29, 169-195.
http://dx.doi.org/10.1016/S0165-0173(98)00056-3
Klimesch, W. (2012). Alpha-band oscillations, attention, and controlled access to stored
information. Trends in Cognitive Sciences, 16, 606-617.
http://dx.doi.org/10.1016/j.tics.2012.10.007
Landers, D. M., Han, M., Salazar, W., Petruzzello, S. J., Kubitz, K. A., & Gannon, T. L. (1994).
Effect of learning on electroencephalographic patterns in novice archers. International
Journal of Sport Psychology, 22, 56-71.

51
Lachaux, J. P., Rodriguez, E., Martinerie, J., & Varela, F. J. (1999). Measuring phase synchrony
in brain signals. Human Brain Mapping, 8, 194-208.
http://dx.doi.org/10.1002/(SICI)1097-0193(1999)8:4%3C194::AID-
HBM4%3E3.0.CO;2-C
Malhotra, N., Poolton, J. M., Wilson, M. R., Omuro, S., & Masters, R. S. (2015). Dimensions of
movement specific reinvestment in practice of a golf putting task. Psychology of Sport
and Exercise, 18, 1-8. http://dx.doi.org/10.1016/j.psychsport.2014.11.008
Neumann, D. L., & Thomas, P. R. (2008). A camera-based scoring system for evaluating
performance accuracy during a golf putting task. Behavior Research Methods, 40(3),
892-897. http://dx.doi.org/10.3758/BRM.40.3.892
Nolte, G., Bai, O., Wheaton, L., Mari, Z., Vorbach, S., & Hallett, M. (2004). Identifying true
brain interaction from EEG data using the imaginary part of coherency. Clinical
Neurophysiology, 115(10), 2292-2307. http://dx.doi.org/10.1016/j.clinph.2004.04.029
Nunez, P. L., & Srinivasan, R. (2006). Electric fields of the brain: the neurophysics of EEG.
Oxford University Press, USA.
Orrell, A. J., Masters, R. S. W., & Eves, F. F. (2009). Reinvestment and movement disruption
following stroke. Neurorehabilitation and Neural Repair, 23, 177–183.
http://dx.doi.org/10.1177/1545968308317752
Poldrack, R. A. (2006). Can cognitive processes be inferred from neuroimaging data? Trends in
Cognitive Sciences, 10(2), 59-63. http://dx.doi.org/10.1016/j.tics.2005.12.004
Preacher, K.J. & Hayes, A.F. (2004). SPSS and SAS procedures for estimating indirect effects in
simple mediation models. Behavior Research Methods, Instruments Computers, 36, 717-
731. http://dx.doi.org/10.3758/BF03206553

52
Riehle, A., & Requin, J. (1995). Neuronal correlates of the specification of movement direction
and force in four cortical areas of the monkey. Behavioural Brain Research, 70, 1-13.
http://dx.doi.org/10.1016/0166-4328(94)00180-N
Ring, C., Cooke, A., Kavussanu, M., McIntyre, D.B., & Masters, R.S.W. (2015). Investigating
the efficacy of neurofeedback training for expediting expertise and excellence in sport.
Psychology of Sport & Exercise, 16(1), 118-127.
http://dx.doi.org/10.1016/j.psychsport.2014.08.005
Salmoni, A. W., Schmidt, R. A. & Walter, C. B. (1984). Knowledge of results and motor
learning: a review and critical appraisal. Psychological Bulletin, 95, 335-386.
10.1037/0033-2909.95.3.355 http://dx.doi.org/10.1037/0033-2909.95.3.355
Toner, J., & Moran, A. (2011). The effects of conscious processing on golf putting proficiency
and kinematics. Journal of Sports Sciences, 29(7), 673-683.
http://dx.doi.org/10.1080/02640414.2011.553964
Toner, J., & Moran, A. (2015). In praise of conscious awareness: a new framework for the
investigation of “continuous improvement” in expert athletes. Frontiers in Psychology, 5,
1-5. http://dx.doi.org/10.3389/fpsyg.2014.00769
Vasey, M. W., & Thayer, J. F. (1987). The continuing problem of false positives in repeated
measures ANOVA in psychophysiology: A multivariate solution. Psychophysiology, 24,
479-486. http://dx.doi.org/10.1111/j.1469-8986.1987.tb00324.x
Vine, S.J., Moore, L.J., Cooke, A., Ring, C., & Wilson, M.R. (2013). Quiet eye training: a means
to implicit motor learning. International Journal of Sport Psychology, 44, 367-386.
Zhu, F. F., Poolton, J. M., Wilson, M. R., Maxwell, J. P., & Masters, R. S. W. (2011). Neural co-
activation as a yardstick of implicit motor learning and the propensity for conscious

53
control of movement. Biological Psychology, 87, 66-73.
http://dx.doi.org/10.1016/j.biopsycho.2011.02.004

54
CHAPTER THREE
Don’t look, don’t think, just do it! Towards an understanding of alpha gating in a discrete
aiming task
Abstract
Prior to and during movement, oscillatory alpha activity gates cognitive resources towards motor
areas of the cortex by inhibiting neuronal excitability in non-motor areas. The present study
examined the effect of manipulating target variability on this alpha gating phenomenon. Using a
baseline-test-retention design, we measured EEG alpha power, performance accuracy and task
difficulty in 32 recreational golfers as they putted golf balls (20 per target) to one central target
(baseline, retention) and four targets of different directions and extents (manipulation). For
participants in the random group (n = 16) target location varied with each repetition in a random
fashion whereas for participants in the blocked group (n = 16) it was kept constant within blocks.
Regional analyses revealed a focal pattern of lower central alpha and higher occipital and
temporal alpha. This topography was specific to preparation for movement and was associated
with performance: smallest performance errors were preceded by decreased central combined
with increased occipital alpha. The random group performed worse than the blocked group and
found the task more difficult. Importantly, left temporal alpha prior to movement onset was
lower for the random group than the blocked group. No group differences were found at baseline
or retention. Our study proved that alpha gating can be altered by manipulating inter-trial
variability and thereby demonstrated the utility of the alpha gating model. Our findings

55
underscore the importance of inhibiting occipital and left temporal areas when performing
movements, and provide further evidence that alpha gating reflects neural efficiency during
motor tasks.
Introduction
The willful and repeated execution of an action induces a series of psychomotor adaptations
consistent with increased efficiency (Brener, 1986). At the neurophysiological level, the brain
becomes better at discriminating processes that are functional to optimal execution from those
that are not; with repetition, the former are enhanced and the latter suppressed (Hatfield &
Hillman, 2001; Hatfield, 2018). The execution of an action is characterized by a distinctive
spatiotemporal pattern in the electroencephalogram (EEG), involving oscillatory activity within
the alpha frequency (i.e., around 10 Hz) band. Specifically, prior to and during movement, alpha
decreases over motor areas of the cortex while concurrently increasing over non-motor areas
(Neuper & Pfurtscheller, 2001; Pfurtscheller, 1992). The function of alpha is to exert inhibitory
control across the cerebral cortex whereby higher alpha indicates stronger neuronal inhibition
and less alpha indicates greater release from inhibition (Klimesch, Sauseng, & Hanslmayr, 2007;
Klimesch, 2012). Based on this evidence, the gating-by-inhibition model (Jensen & Mazaheri,
2010) proposes that neuronal excitability is diverted away from regions showing higher alpha
power (i.e., greater inhibition) and routed towards regions showing lower alpha power (i.e., less
inhibition). Consequently, the alpha gating model describes a mechanism that explains how the
brain accomplishes the activation of motor areas alongside the inhibition of non-motor areas to
achieve psychomotor efficiency.

56
Research on skilled motor performance requiring precise motor control, such as target
sports like golf putting and gun shooting, has revealed temporal and spatial dynamics of the
alpha rhythm that account for inter- and intra-individual variations in performance and expertise
(for review of studies see Cooke, 2013; Hatfield, Haufler, Hung, & Spalding, 2004). Two recent
studies have explored the utility of the alpha gating model as framework to study the
phenomenon of psychomotor efficiency. First, Gallicchio, Finkenzeller, Sattlecker, Lindinger,
and Hoedlmoser (2016) examined alpha in a biathlon shooting task. They analyzed the
topography of alpha in the second preceding each shot and described a focal pattern of
simultaneous lower alpha in the central regions and higher alpha in temporal and occipital
regions. Importantly, this pattern was associated with performance: lower central alpha and
higher temporal alpha preceded improved shooting accuracy. Gallicchio and colleagues
interpreted their findings as evidence that stronger alpha gating redirected neural resources more
efficiently towards processes that supported performance and away from those unrelated to
performance. Second, Gallicchio, Cooke, and Ring (2017) examined changes in alpha gating
before and after practice of a golf putting task. They recorded alpha from recreational golfers as
they putted balls to a hole before and after three training sessions. Their findings confirmed a
shift in the topographical pattern that was consistent with the gating of resources away from
temporal and occipital regions and towards central regions following motor learning.
Importantly, they found that the largest improvements in performance following practice were
associated with increased alpha power (indicative of greater inhibition) over the temporal
regions.
The abovementioned studies provide preliminary evidence that a movement-related alpha
gate is associated with motor performance and that its intensification – higher alpha in

57
movement-unrelated regions (i.e., temporal and occipital) and lower alpha in movement-related
regions (i.e., central) – can reflect improvements in psychomotor efficiency with practice.
Accordingly, practicing a skill under conditions that strengthen the gating phenomenon may be
expected to improve motor performance. However, there is currently no evidence that the
movement-related alpha gate can be modulated by the structure of the practice conditions. The
present study was designed to fill this gap in our understanding of the alpha-gating phenomenon
and represents the first attempt to manipulate the strength of the alpha gate by varying the nature
of the practice schedule. Specifically, we manipulated the trial-by-trial variability of the target in
a golf putting task and compared the effects of variable practice and blocked practice (cf. Porter
& Magill, 2010) on alpha oscillations. For some individuals the location of the target varied with
each repetition in a random fashion whereas for others it was kept constant within blocks of
consecutive repetitions.
Repeating a movement under a schedule of random variability increases cognitive load
during motor preparation by requiring that parameters, such as force and direction, are re-
specified for each movement (Lee & Magill, 1985) and by fostering comparisons of these
parameters among the different movements (Shea & Morgan, 1979). If alpha gating reflects
improved neural efficiency acquired through repetition, then random variability across
repetitions should curb the development of psychomotor efficiency and interfere with the focal
distribution of alpha across the cortex.
The aims of the present study were threefold. Our first study aim was to confirm the
existence of the movement-related alpha gating phenomenon and establish its behavioral
relevance. Specifically, we expected to see a regional pattern of lower alpha power over central
regions and higher alpha power over temporal and occipital regions that was specific to motor

58
preparation. Furthermore, we expected that a stronger gate (i.e., higher alpha power over non-
motor areas and lower alpha power over motor areas) would be associated with better task
performance.
Our second study aim was to examine the impact of target variability on motor
performance, task difficulty, mental effort, and alpha gating. We hypothesized that, compared to
blocked repetition, random repetition would result in worse performance, greater perceived
difficulty and effort, and a weaker alpha gate (reflected in blunted enhancement of task-relevant
central regions and/or suppression of task-irrelevant temporal and occipital regions).
Our third study aim was to evaluate the extent of any carry-over effect of practicing a skill
under a random repetition condition when reverting back to a blocked repetition condition. Based
on theories of motor learning arguing for enhanced performance following practice under a
random, compared to a blocked, schedule (e.g., Schmidt, 1975), we expected that random
practice compared to blocked practice would produce better performance and a stronger alpha
gate (indicative of increased neural efficiency) at a blocked retention test.
Method
Participants
Thirty-two right-handed male recreational golfers were randomly allocated to a blocked
practice group (age: M = 19.94, SD = 2.29 years; number of golf putting practice events in the
last 12 months: M = 13.06, SD = 16.25) or to a random practice group (age: M = 20.25, SD =
1.81 years; number of golf putting practice events in the last 12 months: M = 11.06, SD = 9.01).
None had a formal golf handicap. Participants were asked to refrain from alcohol, caffeine and

59
nicotine 3 hours prior to testing, and were compensated with £10 and research credits. All
provided signed consent to take part in the study. The study protocol was approved by the local
research ethics committee.
Putting task
Participants putted golf balls (diameter 4.7 cm) with a blade-style putter (length = 91 cm)
to a series of five targets — adhesive paper markers (diameter = 0.6 cm) — positioned on a flat
putting surface (Turftiles, length 5 m, width 1.5 m; Stimpmeter value: 2.27 m). One central target
was at a distance of 2 m and in straight line from the putting position. The four peripheral targets
varied in terms of distance (far, near) and side (left, right). The two far and the two near targets
were at distances of 2.5 and 1.5 m from the starting position, respectively. The two left and the
two right targets were 0.15 m perpendicular to the line drawn from the ball to the middle target.
The putting setup is illustrated in the Supplemental Material of Chapter Three (Appendix 1).
Participants were instructed to putt at their own pace (i.e., with no time pressure) and as
accurately as possible in order to “get the final position of the ball as close as possible to the
target”. Prior to each putt, participants were instructed to stand in a relaxed position and
maintain their gaze on a fixation cross placed at eye-sight on the facing wall (c. 1.5 m away),
until an acoustic tone (duration: 200 ms; frequency: 1200 Hz) prompted them to look at a
stimulus box. The box was positioned on the putting surface 15 cm away from to the ball. The
box informed them about the location of the upcoming target by illuminating one of five light
emitting diodes (LEDs) for the duration of the trial. The arrangement of the five LEDs
represented the spatial location of the targets on the putting surface. The tones and LEDs, which
served as cue stimuli, were controlled by an Arduino Micro board (Arduino, Italy) interfaced
with a computer running MATLAB (MathWorks, USA).

60
Procedure
Participants attended one 2-hour session. After briefing and instrumentation for
physiological recording they performed 10 familiarization putts: one putt to each target; this
sequence was repeated twice. Then, participants completed the putting task. They putted 120
balls in three conditions: baseline, 1 block of 20 putts; test, 4 blocks of 20 putts; and retention, 1
block of 20 putts. After each block, participants completed some self-report measures assessing
task difficulty and mental effort (see below for details).
In the baseline and retention conditions, the target was always the middle target. In the
test condition, the target varied among the four peripheral targets, in either a blocked or random
fashion according to group allocation. For participants in the blocked group, each putting block
included only one of the four peripheral targets (i.e., 20 consecutive putts to the same target), and
the sequence of blocks was randomized. For participants in the random group, each block
included a pseudo-random sequence of the four peripheral targets; namely, all four targets were
presented within each set of four consecutive putts, with the constraint that the same target could
not be presented twice in a row. After each putt the experimenter took a photograph of the target
area using a ceiling-mounted camera, repositioned the ball on the starting position, and then
pressed a key to initiate the next trial. The time between the onset of the audiovisual cue and
backswing initiation was 7.08 s (SD = 2.66 s) with a minimum of 3.04 s. The time between
consecutive putts was 25.6 s (SD = 16.8 s) and the time between consecutive blocks was
approximately 2 min. Upon completion of the putting task the participant was debriefed and
paid.
2.4 Physiological signals
Thirty-two active electrodes were positioned on the scalp at Fp1, Fp2, AF3, AF4, F7, F3,

61
Fz, F4, F8, FC5, FC1, FC2, FC6, T7, C3, Cz, C4, T8, CP5, CP1, CP2, CP6, P7, P3, Pz, P4, P8,
PO3, PO4, O1, Oz, O2 (10-20 system, Jasper, 1958) to record the EEG. Two active electrodes
were positioned on each mastoid. Four active electrodes were placed at the outer canthus and
below each eye to record horizontal and vertical EOG. And finally, two electrodes were placed
on the right clavicle and left lower ribs to record the ECG (chest-configuration lead-II montage).
All channels were recorded in monopolar. Common mode sense and driven right leg electrodes
were used to enhance the common mode rejection ratio of the signal. The signal was amplified
and digitized at 2048 Hz with 24-bit resolution, with no online filter, using the ActiveTwo
recording system (Biosemi, Netherlands).
Digital triggers were sent to the BioSemi system to identify the onset of the audiovisual
cue onset and backswing initiation, identified by the putter head moved away and thereby
breaking from an infrared beam controlled by a digital switch (E18-D80NK). In addition,
vibrations from putter-ball impact were recorded using a piezo sensor (MiniSense 100) attached
to the back of the putter head and interfaced with the BioSemi system as an external analog
channel. Offline, a bespoke MATLAB script identified the timing of cue, backswing, and impact
events for each putt.
All physiological channels were referenced to the mastoids, down-sampled to 512 Hz,
and band-pass filtered 0.1-40 Hz (Finite Impulse Response, filter order = 2^15. Epochs were cut
from -3.5 to +1.5 s relative to backswing initiation and cue and then voltages were centered
within each epoch (i.e., the epoch mean was subtracted to each data point in that epoch). Epochs
were visually inspected and those showing movement artefacts were discarded (these trials were
also discarded from other non-EEG analyses). The number of backswing-centered epochs that
were retained was 19.84 (SD = 0.37, minimum = 19) for the baseline condition, 79.25 (SD =

62
2.66, minimum = 65) for the test condition, and 19.91 (SD = 0.30, minimum = 19) for retention.
The number of cue-centered epochs that were retained was 19.88 (SD = 0.34, minimum = 19) for
the baseline condition, 79.21 (SD = 2.66, minimum = 65) for the test condition, and 19.91 (SD =
0.30, minimum = 19) for retention. No bad channels were identified. Independent Component
Analysis (ICA) weights were obtained through the Runica Infomax algorithm (Makeig et al.,
1996) running on EEG, EOG, and ECG signals (i.e., 38 channels yielding same number of
independent components) that, prior to ICA, were down-sampled to 256 Hz, 2-40 Hz band-pass
filtered (Finite Impulse Response, filter order = 1000), and concatenated across all conditions
within each participant. Then, ICA weights were applied to the 0.1-40 Hz filtered signals and the
components that presented obvious non-neural activity upon visual inspection (e.g., eye blinks,
horizontal eye movements, cardiac artefact, muscle / movement artefacts) were manually
rejected. On average 4.94 components (SD = 1.39) were rejected per participant. Finally, ECG
and EOG channels were discarded and the remaining thirty-two EEG channels were average-
referenced. These pre-processing steps were performed using EEGLAB functions (Delorme &
Makeig, 2004) for MATLAB.
Measures
Performance. Performance on each putt was scored as radial error (cm), length absolute
error (cm; hereafter “length error”), and angle absolute error (degrees; hereafter “angle error”). A
trial was discarded from any further analysis when the ball rolled off of the putting surface (this
occurred only once). A camera system with bespoke MATLAB scripts, inspired by Neumann
and Thomas (2008), was used to score performance (see Supplemental Material of Chapter
Three, Appendix 1).
Self-report. Task difficulty was measured by asking each participant to rate ‘How difficult

63
was it to get the ball to finish within 5 cm of the target(s)?’ on a Likert scale ranging from 1 (not
difficult at all) to 7 (extremely difficult). Mental effort was measured by asking each participant
to rate ‘How much mental effort did you exert while putting?’ on a Likert scale ranging from 1
(no effort at all) to 7 (extreme effort). Both items were rated after each block of 20 putts in
relation to the block of putts just completed.
Alpha power. Time-frequency decomposition was performed through short-time Fast
Fourier Transform (FFT) conducted on 65 overlapping windows, each of 1 s, with central points
ranging from -3 to 1, relative to backswing onset and cue onset (Figure 3.1). Prior to FFT, data
points in each window were Hanning tapered and 0-padded to reach 4 s. This procedure
generated complex-valued coefficients in the time-frequency plane with a precision of 0.06 s and
0.25 Hz, separately for each channel and trial. Signal amplitude was doubled for all positive
frequencies and alpha power was computed as the squared amplitude in the 8-12 Hz frequency
range.

64
Figure 3.1. EEG epoching relative to the movements involved in the putting task. (A) The
participant stood upright in front of the ball and maintained his gaze on the fixation cross located
at eye-sight on the opposite wall. (B) Cue onset: one of the LEDs turned on concomitantly to the
acoustic tone, informing the participant of the location of the target. (C) At his own time, the
participant positioned the putter head next to the ball and prepared for the putt. (D) Backswing
initiation: The participant initiated the backswing. EEG alpha was examined from -3 to +1 s
relative to this instant.

65
We computed two metrics of alpha power per trial. Absolute alpha power was computed
with no baseline correction; instead, skewness and between-subject differences in the power
density distribution were minimized through a median-scaled log transformation, whereby power
values of each participant were scaled by the median of all values within that participant, and
then subjected to a 10·log10 transformation (cf. Gallicchio et al., 2016b). Absolute alpha power
was computed for both types of epoch—time-locked to backswing initiation and cue onset.
Relative alpha power was computed only for the epoch that was time-locked to backswing
initiation as percentage change from a baseline, identified as the two seconds preceding cue
onset (averaged across trials, separately per each condition) using the formula described in
Pfurtscheller and Lopes da Silva (1999): 𝑟𝑡,𝑝,𝑐 = 100 (𝑏𝑡,𝑝,𝑐 − 𝑐�̅�) 𝑐�̅�⁄ , where 𝑟𝑡,𝑝,𝑐 indicates
relative alpha power at time t, putt p, and condition c (i.e., baseline, test, retention), 𝑏𝑡,𝑝,𝑐
indicates alpha power time-locked to backswing initiation at time t, putt p, and condition c, and
𝑐�̅� indicates alpha power averaged across the data points within the 2 s preceding cue onset and
across putts in condition c. Six regions of interest (ROI) were identified based on inspection of
topographic maps (Figures 3.2A and 3.2B): frontal (F3, Fz, F4), left temporal (T7, F7, CP5), left
central (C3, CP1), right central (C4, CP2), right temporal (T8, F8, CP6), and occipital (O1, Oz,
O2). Values within each ROI were averaged. Signal processing was performed in MATLAB.

66
Figure 3.2 (A, B) Scalp maps of absolute alpha power in the 2 s prior to (A) cue onset and (B)
backswing initiation. (C) Scalp map of paired-sample t values (df = 31) comparing pre-cue and
pre-backswing alpha power. Values of -2.04 and 2.04 correspond to p = .05 on a t distribution
with 31. Statistical thresholding was applied using the maximum-statistic permutation testing
(Cohen, 2014; Nichols & Holmes, 2001) controlling for multiple comparisons in the channel
dimension with alpha set at .01. Statistically significant channels are indicated by a yellow-black
markers and are surrounded by a solid contour line. (D, E, F) Scatter plots showing (D) radial,
(E) length, and (F) angle errors as a function of relative alpha power at Oz in the 2 s prior to
backswing initiation along with Spearman's ρ and p values. (G, H, I) Scalp maps of Spearman's ρ
computed between relative alpha power in the 2 s prior to backswing initiation and (G) radial
error, (H) length error, and (I) angle error. Statistical thresholding was applied using the
maximum-statistic permutation testing controlling for multiple comparisons in the channel
dimension with alpha set at .01: no significant effects was revealed. All participants (n = 32) and
only trials from the baseline condition were included in these graphs.

67
Statistical Analyses
Alpha gating. A 6 ROI × 2 epoch type (cue, backswing) analysis of variance (ANOVA)
on absolute alpha power was conducted to evaluate the presence of regional effects of alpha
power consistent with the gating phenomenon and, by comparing the 2 s preceding cue onset
against the 2 s preceding backswing initiation, to determine whether this regional phenomenon
was specific to preparation for putting. Additionally, we explored regional effects through
nonparametric permutation testing. The multiple comparison problem (i.e., one test for each
channel) was solved through the “maximum statistic” method (Cohen, 2014; Nichols & Holmes,
2001) applied to the channel dimension. Namely, we compared paired-sample t values of each
channel with an empirical distribution of t values constructed in the following way. First, we
permuted the data by randomly swapping the ‘cue’ and ‘backswing’ labels within each
participant. Second, we ran a paired-sample t test separately for each channel. Third, we pooled
the t values across channels and stored the two most extreme values (i.e., minimum and
maximum). Fourth, we repeated this procedure 1000 times to create a distribution of 2000
minimum and maximum t values. Finally, we compared the non-permuted t value of each
channel with the empirical distribution of t values described above: we computed p values as the
proportion of the permutation t values that were more extreme than the t value of each channel.
Spearman’s rank correlations (ρ) explored the association between performance and
relative alpha power in the 2 s preceding backswing initiation. These analyses were conducted on
the putts from the baseline condition, pooling participants from both groups (n = 32). In addition,
we explored the topography of the alpha-performance correlation through permutation testing
corrected for multiple comparisons across the channel dimension. Namely, the ρ coefficient
obtained for each channel was compared with a distribution of the 2000 most extreme ρ

68
coefficients across channels (i.e., 1000 minimum and 1000 maximum) whereby at each
repetition participants were permuted for one of the two variables involved in the correlation.
Manipulation of target variability. These analyses evaluated the impact of the
manipulation of target variability on performance, self-report, and alpha power measures.
Independent-sample t-tests examined group differences in performance and self-report measures
of difficulty and mental effort (as change scores relative to baseline) on trials of the test
condition. Performance absolute scores are reported in the Supplemental Material of Chapter
Three (Appendix 2).
A 2 group × 6 ROI × 4 time × 4 subset ANOVA was conducted on relative alpha power
(i.e., as percentage change from the 2 s preceding cue onset). The time factor identified four 1-s
intervals from -3 to +1 relative to backswing initiation. The subset factor identified four 20-putt
sets, so that subset 1 included the first 5 putts struck to each target – these were consecutive putts
for the blocked but not the random group – subset 2 included the next 5 putts to each target, and
so on. Only trials from the test condition were included in these analyses. Additionally, we
explored the topography of group differences through permutation testing controlling for
multiple comparisons in the channel × time dimensions, separately for each subset. Namely,
independent-sample t values computed for each channel and each time were compared with a
distribution of the 2000 most extreme t values across channels and time (i.e., 1000 minimum and
1000 maximum) whereby group allocation was permuted across participants at each repetition.
Retention effects. These analyses examined the short-term persistence of effects
following the manipulation of target variability. Group differences in performance and self-
report measures of difficulty and mental effort (expressed as change scores relative to baseline)
were assessed through independent-sample t-tests. A 2 group × 6 ROI × 4 time ANOVA was

69
conducted on relative alpha power. Only trials from the retention condition were considered in
these analyses. Additionally, we explored the topography of group differences through
permutation testing controlling for multiple comparisons in the channel × time dimensions with
the same procedure described for the analyses of target variability.
2.6.4 Additional frequency bands. In order to evaluate the involvement of frequency
bands other than alpha we conducted the analyses described above in the theta (4-6 Hz) and beta
(15-25 Hz) frequency bands. In addition, to explore patterns within the broad alpha band, we
analyzed separately the lower (8-10 Hz) and upper (10-12 Hz) alpha sub-bands. These
supplementing analyses are reported in the Supplemental Material of Chapter Three (Appendix
4).
The multivariate solution was adopted where appropriate (Vasey & Thayer, 1987) and
Wilks’ lambda (λ) reported. Significant interactions were interrogated using post hoc t-tests and
polynomial trend analyses. Univariate partial eta-squared (ηp2) and r2 were reported as measures
of effect size, with values of .02, .13, and .26 reflecting small, medium, and large effects,
respectively (Cohen, 1992).
Results
Alpha gating
To address our first study aim we conducted analyses to ascertain the existence of the
movement-related alpha gating phenomenon and its behavioral relevance. The regional
distribution of absolute alpha power is shown as a function of epoch type in Figures 3.2A and
3.2B. The ROI × epoch type ANOVA yielded a main effect of ROI, F(5,27) = 157.95, p < .001,

70
λ = .033, ηp2 = .889, indicating that alpha power was highest for the occipital region, lower for
the left and right temporal and frontal regions, and lowest for the left and right central regions.
This effect was superseded by a ROI × epoch interaction, F(5,27) = 47.17, p < .001, λ = .103, ηp2
= .767: post hoc paired-sample t-tests revealed that alpha power decreased from pre-cue to pre-
backswing for the left central, right central, and frontal regions, ts(31) > 2.90, ps < .007, and
increased for the occipital region, t(31) = 7.50, p < .001. No differences emerged for left, t(31) =
0.70, p = .49, and right, t(31) = -0.84, p = .41, temporal regions. No main effect emerged for
epoch type, F(1,31) = 0.46, p = .50, ηp2 = .015. Channel-wise exploratory analyses conducted
through permutation testing revealed that, compared to the pre-cue period, pre-backswing alpha
power decreased for central channels (FC2, Cz, C4, CP1, CP2, P3, Pz, P4) and increased for
occipital (O1, Oz, O2) and left temporal (T7) channels (Figure 3.2C).
To rule out the existence of group differences at baseline, we conducted a 2 group × 6
ROI × 4 time ANOVA on relative alpha power (i.e., alpha power around backswing initiation as
percentage change from the 2 s preceding cue onset). The results of this analysis are reported
fully in the Supplemental Material of Chapter Three (Appendix 3), along with exploratory
channel-wise analyses of group differences through permutation testing. No group effects were
revealed at baseline.
Channel-wise Spearman’s correlations between relative alpha power and radial error
revealed that the participants who obtained lower radial error were those that showed the largest
increase in alpha power at Oz, ρ(30) = -.47, p = .007, and O1, ρ(30) = -.38, p = .04, compared to
the pre-cue onset period. Similar effects were revealed for length error (Oz: ρ(30) = -.47, p =
.008; O1: ρ(30) = -.36, p = .04). No effects were revealed for angle error. Figure 3.2 illustrates
the scatter plots of the relation between relative alpha power at Oz and radial error (panel D),

71
length error (panel E), and angle error (panel F). Figures 3.2G, 3.2H, and 3.2I show the
topography of these correlations together with the outcome of permutation testing corrected for
multiple comparisons. These analyses indicated that the findings reported above did not survive a
rigorous control of multiple testing. However, the exploration of multiple frequency bands (i.e.,
theta, lower alpha, upper alpha, and beta) indicated that these correlations emerged only for the
alpha band and particularly for the upper alpha sub-band (see Appendix 4 in the Supplemental
Material of Chapter Three).
Manipulation of target variability
To address our second study aim we conducted analyses to examine the impact of the
manipulation of target variability on performance, self-reported difficulty and mental effort, and
alpha gating.
Performance. Compared to baseline putts, radial error decreased for the blocked group
(M = -2.59, SD = 4.33 cm) and increased for the random group (M = 0.66, SD = 4.40 cm), which
produced a significant group difference in terminal distance from the target, t(30) = -2.11, p =
.04, r2 = .359. Length error decreased in both the blocked (M = -3.02, SD = 4.41 cm) and random
(M = -0.23, SD = 4.46 cm) groups, t(30) = -1.78, p = .09, r2 = .309. Angle error increased for
both the blocked (M = 0.22, SD = 0.43 degrees) and random (M = 0.52, SD = 0.48 degrees)
groups, t(30) = -1.90, p = .07, r2 = .328. Potential group differences in putting performance were
further explored through independent-sample t-tests conducted separately for each subset of
putts; where subset refers to the first, second, third, and fourth set of five putts struck to each
target (i.e., 20 putts per each subset). These analyses revealed that clear group differences in
extent-based errors emerged during the second subset of putts and that these differences faded
during the third and fourth subset of putts (Table 3.1).

72
Table 3.1. Mean (SD) of performance measures of each group as change scores from the baseline
condition in each subset along with the results of independent-sample t-tests. A negative change
score indicates that performance improved during the test compared to baseline.
Performance measure blocked random t(30) p r2
subset 1
Δ radial error (cm) 0.37 (6.78) 2.87 (5.51) -1.15 .26 .215
Δ length error (cm) 0.06 (7.37) 1.83 (5.74) -0.76 .46 .137
Δ angle error (degrees) 0.27 (0.62) 0.63 (0.61) -1.67 .11 .292
subset 2
Δ radial error (cm) -2.65 (3.59) 1.69 (3.47) -3.47 .002 .535
Δ length error (cm) -3.05 (3.89) 0.91 (3.47) -3.03 .01 .484
Δ angle error (degrees) 0.18 (0.43) 0.54 (0.46) -2.32 .03 .390
subset 3
Δ radial error (cm) -4.04 (5.24) -0.68 (5.37) -1.79 .08 .311
Δ length error (cm) -4.55 (5.3) -1.25 (5.23) -1.77 .09 .307
Δ angle error (degrees) 0.23 (0.48) 0.36 (0.49) -0.76 .46 .137
subset 4
Δ radial error (cm) -4.01 (4.99) -1.21 (6.04) -1.43 .16 .253
Δ length error (cm) -4.48 (5.07) -2.38 (6.25) -1.04 .31 .187
Δ angle error (degrees) 0.20 (0.56) 0.56 (0.61) -1.74 .09 .303

73
Self-report. Compared to the baseline condition, self-reported difficulty increased more
for the random group (M = 0.97, SD = 1.15) than the blocked group (M = 0.11, SD = 1.06), t(30)
= -2.20, p = .04, r2 = .373. No difference emerged for self-reported mental effort (blocked: M = -
0.39, SD = 0.71; random: M = -0.20, SD = 0.96), t(30) = -0.63, p = .54, r2 = .114.
Alpha power. The group × ROI × time × subset ANOVA on relative alpha power
revealed main effects for ROI, F(5,26) = 17.51, p < .001, λ = .229, ηp2 = .564, and time, F(3,28)
= 6.38, p = .002, λ = .594, ηp2 = .172. These effects were superseded by a ROI × time interaction,
F(15,16) = 3.34, p = .01, λ = .242, ηp2 = .285, revealing cubic temporal trends (i.e., increase,
decrease, increase) for the frontal, F(1,31) = 13.79, p = .001, ηp2 = .308, left central, F(1,31) =
13.75, p = .001, ηp2 = .307, right central, F(1,31) = 10.38, p = .003, ηp
2 = .251, and left temporal,
F(1,31) = 17.06, p < .001, ηp2 = .355, regions. Changes in the occipital region were best
described by a linear trend (i.e., decrease), F(1,31) = 17.56, p < .001, eta = .362. No temporal
trend emerged for the right temporal region. No main group effect was revealed, F(1,30) = 1.59,
p = .22, ηp2 = .050. However, the ANOVA analysis also revealed interactions for ROI × time ×
subset, F(45,1350) = 2.03, p < .001, ηp2 = .063, and group × ROI × time × subset, F(45,1350) =
1.49, p = .02, ηp2 = .047.
Post hoc independent sample t-tests revealed greater alpha power for the random
compared to the blocked group for selected channels and only for subsets 2 to 4 (Figure 3.3). For
subset 2, effects emerged from -3 to -2 s at FC5, t(30) = 2.07, p = .05, r2 = .353, from -2 to -1 s at
F7, t(30) = 2.08, p = .05, r2 = .355, and FC5, t(30) = 2.04, p = .05, r2 = .350, from -1 to 0 s at F7,
t(30) = 2.29, p = .03, r2 = .385, FC5, t(30) = 2.52, p = .02, r2 = .418, and T7, t(30) = 2.09, p =
.05, r2 = .356. For subset 3, effects emerged from -3 to -2 s at F7, t(30) = 2.62, p = .01, r2 = .432,
and FC5, t(30) = 2.27, p = .03, r2 = .383. For subset 4, effects emerged from -3 to -2 s at F7,

74
t(30) = 2.31, p = .03, r2 = .388, F3, t(30) = 2.27, p = .03, r2 = .383, and FC5, t(30) = 2.48, p =
.02, r2 = .412, from -2 to -1 s at F7, t(30) = 2.14, p = .04, r2 = .365, FC5, t(30) = 2.16, p = .04, r2
= .367, T7, t(30) = 2.05, p = .05, r2 = .350, and C4, t(30) = 2.06, p = .05, r2 = .352. Permutation
testing conducted to control for multiple comparisons in the channel × time dimensions indicated
that the findings reported above did not survive a rigorous statistical control (Figure 3.3). The
exploration of multiple frequency bands (theta, lower alpha, upper alpha, and beta) revealed that
the effects described above were not specific to the alpha frequency band although they appeared
especially distinctly for the upper alpha sub-band (see Appendix 4 in the Supplemental Material
of Chapter Three).

75
Figure 3.3. Scalp maps of independent-sample t values comparing blocked versus random
groups, as a function of time and subset. Values of -2.04 and 2.04 correspond to p = .05 on a t
distribution with 30 df. Positive values indicate greater whereas negative values indicate smaller
relative alpha power for the blocked than the random group. Statistical thresholding was
computed using the maximum-statistic permutation testing (Cohen, 2014; Nichols & Holmes,
2001) controlling for multiple comparisons in the channel × time dimensions with alpha set at
.01: no significant effect was revealed.

76
Retention effects
To address our third study aim we conducted analyses to explore the persistence of the
effects due to the manipulation of target variability in an immediate retention test with no target
variability
Performance. Performance at retention was better than baseline. However, no group
differences emerged for radial error (blocked: M = -3.97, SD = 5.62 cm; random: M = -2.14, SD
= 5.53 cm; t(30) = -0.93, p = .36, r2 = .167), length error (blocked: M = -3.82, SD = 5.37 cm;
random: M = -1.99, SD = 5.54 cm, t(30) = -0.95, p = .35, r2 = .171), or angle error (blocked: M =
-0.21, SD = 0.62 degrees; random: M = -0.11, SD = 0.40 degrees, t(30) = -0.57, p = .58, r2 =
.104).
Self-report. Compared to baseline, during the retention test self-reported difficulty
decreased similarly for the blocked (M = -0.88, SD = 1.20) and random (M = -0.56, SD = 1.41),
groups, t(30) = -0.67, p = .51, r2 = .121. Mental effort also decreased similarly from baseline to
retention for the blocked (M = -0.75, SD = 0.68) and random (M = -0.88, SD = 0.96) groups,
t(30) = 0.43, p = .67, r2 = .078.
Alpha power. The group × ROI × time ANOVA conducted on relative alpha power
revealed main effects for ROI, F(5,26) = 22.92, p < .001, λ = .185, ηp2 = .530, and time, F(3,28)
= 5.39, p = .01, λ = .634, ηp2 = .174. These main effects were superseded by a ROI × time
interaction, F(15,16) = 3.93, p = .01, λ = .213, ηp2 = .204, indicating that the time effect was best
described by a cubic trend (i.e., increase, decrease, increase) for the frontal, F(1,30) = 15.02, p =
.001, ηp2 = .334, right central, F(1,30) = 4.25, p = .05, ηp
2 = .124, left temporal, F(1,30) = 16.96,
p < .001, ηp2 = 361, and right temporal, F(1,30) = 5.74, p = .02, ηp
2 = .161, regions. Changes in
the occipital region were best described by a linear trend (i.e., decrease), F(1,30) = 16.76, p <

77
.001, ηp2 = .358. No trend was evident for the left central region. No main effect for group
emerged, F(1,30) = 2.62, p = .12, ηp2 = .080, or group interactions. Appendix 3 in the
Supplemental Material of Chapter Three illustrates scalp maps along with the outcome of
permutation testing conducted for group differences at retention. Appendix 4 in the
Supplemental Material of Chapter Three reports the analyses conducted on multiple frequency
bands (theta, lower alpha, upper alpha, and beta).
Discussion
This study investigated movement-related alpha gating in a golf putting task. Our first goal was
to establish the existence and behavioral relevance of a topographic pattern of alpha power
compatible with the gating phenomenon in preparation for movement execution. Our second
goal was to alter this gating phenomenon via an experimental manipulation of target variability
by comparing blocked versus random schedules of movement repetitions. Our final goal was to
evaluate the short-term persistence of functional adaptations induced by the manipulation of
target variability. The findings of this study are discussed below, separately with regard to each
goal.
Alpha gating
Regional analyses of alpha power in the 2 s preceding movement execution revealed a
focal pattern whereby alpha power was highest for the occipital region, intermediate for the
bilateral temporal and frontal regions, and lowest for the bilateral central regions (Figure 3.2).
Based on the proposed inhibitory function of cortical alpha (Klimesch et al., 2007; Klimesch,
2012) and the gating-by-inhibition model (Jensen & Mazaheri, 2010), our findings imply that

78
cognitive activity was clearly diverted away from processes performed in the occipital region,
and, to a lesser extent, the temporal and frontal regions, and instead routed towards processes
performed in the central regions. This finding provides further evidence of the existence of the
aiming movement-related alpha gating phenomenon (Gallicchio et al., 2016b; 2017).
That the focal pattern of alpha power was specific to movement preparation is supported
by analyses comparing the 2 s preceding movement initiation with the 2 s preceding cue onset
(i.e., the stimulus prompting participants to start their putting preparation). These analyses
revealed that, relative to the pre-cue period, alpha power increased in the occipital and left
temporal regions and decreased for the central and frontal regions (Figure 3.2C). No significant
change occurred in the right temporal region. In other words, the gating pattern became more
intense just before the start of movement execution. Our finding replicates that of Gallicchio et
al. (2016) who observed a focal topography of alpha power prior to rifle shooting but not at rest.
These findings help consolidate the argument that the alpha gating phenomenon observed in
motor tasks is specific to preparation for movement. The fact that a weaker alpha gating effect
was evident in the pre-cue periods (Figure 3.2A) may reflect a state of nascent preparation for
movement in the time between one repetition and the next (cf. Cooke et al., 2015). The
suppression of central alpha just before movement initiation is a well-known phenomenon in the
psychophysiological literature concerned with the study of movement and it is interpreted as
reflecting the activation of sensorimotor processes necessary for the execution of the movement
(Neuper & Pfurtscheller, 2001; Pfurtscheller, 1992).
Finally, we observed that the intensity of the alpha gate was associated with the accuracy
of the movement. Namely, participants with larger increases for occipital alpha performed better
in terms of smaller radial and length errors (Figures 3.2D and 3.2G). Moreover, the association

79
between performance and EEG power was evident only for the alpha frequency bands (see
Appendix 4 in the Supplemental Material of Chapter Three). This finding suggests that the
inhibition of the occipital region is functionally implicated in the performance of target-based
motor tasks. It is worth noting that, optimal programming of force and direction may rely on two
distinct neural patterns because the topographies showing the correlation of alpha power with
either length or angle errors appeared qualitatively different (Figures 3.2H and 3.2I).
Target variability
The most important purpose of the present study was to attempt to experimentally alter the
alpha gating phenomenon by manipulating trial-by-trial target variability. At the behavioral
level, individuals who putted to randomly varying targets within blocks reported greater task
difficulty than those who putted to the same target within blocks. Accordingly, compared to
baseline, performance during the scheduling manipulation declined for the random group (the
ball finished 2.6 cm farther from the target) and improved for the blocked group (the ball
finished 0.7 cm closer to the target). However, it should be noted that the self-reported measure
of mental effort was not different between the random group and blocked group.
Group differences in performance became particularly evident after participants had some
time to adapt to the constant or random repetition schedule. Specifically, the random and blocked
groups started to differ in the second subset of repetition, that is after they had putted the first 20
putts in their respective condition: 20 putts to a random sequence of the four peripheral targets,
for the random group, and five consecutive putts to the same target for each of the four
peripheral targets, for the blocked group. All indices of performance (i.e., radial, length, and
angle errors) indicated that the random group performed significantly worse than the blocked
group, with large effect sizes. It is interesting to note that for the blocked group, performance

80
improved steadily (i.e., radial error kept decreasing) across all repetition subsets, whereas, for the
random group, performance decreased during the first 2 subsets and started to improve during
the 2 final subsets (Table 3.1). The decline in movement accuracy when performing under the
randomly varying conditions has been previously observed in golf putting tasks (e.g., Porter &
Magill, 2010) and has been attributed to its greater cognitive load (Lee & Magill, 1985; Shea &
Morgan, 1979). Below we consider how the neurophysiological data recorded in the present
study can shed light on how the additional cognitive load might have interfered with the selective
allocation of resources to relevant processes and inhibiting irrelevant processes.
Alpha power followed a temporal trend that can be best described as an initial increase,
followed by a decrease (peaking at movement initiation), and a final increase (during movement
execution). This pattern has been previously interpreted as the timely allocation of resources to
motor preparation processes (Cooke et al., 2015). Importantly, the peak-to-trough pattern has
been found to be greater for experts than novices (Cooke et al., 2014) and associated with larger
performance improvements after training (Gallicchio et al., 2017).
Spatial analyses revealed that group differences were mostly localized to the left temporal
region. More specifically, compared to the blocked group, the random group showed a reduced
left temporal alpha activity across the 3 s preceding movement onset. Mirroring the results for
performance, group differences emerged after the participants had time to adapt to the
requirements of putting to either the same target or a randomly varying target (Figure 3.3).
Because alpha reflects regional inhibition (Klimesch et al., 2007; Klimesch, 2012), this finding
indicates that prior to movement initiation the left temporal regions was inhibited less for the
random group than the blocked group. Within the framework of the alpha gating-by-inhibition
model (Jensen & Mazaheri, 2010) this result can be interpreted as deficient gating of cognitive

81
resources across the cortex. In line with previous interpretations of the movement-related alpha
gating phenomenon (Gallicchio et al., 2016b, 2017), the weaker alpha gate observed for the
random group reflects less psychomotor efficiency (Hatfield & Hillman, 2001; Hatfield, 2018)
compared to the blocked group. These novel findings provide evidence that increased inhibition
of cortical regions that are not involved with movement seems to be more important than
increased activation of regions that are responsible for movement control. Indeed, Gallicchio et
al. (2017) found that larger improvements in putting performance were associated with stronger
inhibition of non-motor regions rather than greater activation of motor regions.
It is worth pointing out that the left temporal region appears to play a special role in the
control and learning of motor skills. Previous investigations have observed greater alpha power
(i.e., stronger inhibition) in the left temporal region as a function of expertise (Haufler, Spalding,
Santa Maria, & Hatfield, 2000), performance (Gallicchio et al., 2016b), and training (Gallicchio
et al., 2017; Kerick, Douglass, & Hatfield, 2004; Landers, Han, Salazar, Petruzzello, Kubitz, &
Gannon., 1994). Past studies have also found increased functional disconnection between the left
temporal region and other regions involved with movement as a function of expertise (Deeny,
Hillman, Janelle, & Hatfield, 2003), performance (Gallicchio, Cooke, & Ring, 2016), and
training (Gallicchio et al., 2017; Zhu, Poolton, Wilson, Maxwell, & Masters, 2011). Left
temporal activity in a movement tasks has been interpreted as cognitive/verbal interference
during motor preparation (Deeny et al., 2003) and reinvestment of declarative knowledge to
consciously monitor and control movements (Zhu et al., 2011). It is tempting to speculate that
verbal processes concerned with use of declarative knowledge may impair motor performance
and hold back progress in learning of a motor skill. However, due to the unfeasibility of mapping
one region to one cognitive function, we urge researchers to study the function of left temporal

82
alpha in motor tasks.
Retention effects
The evaluation of group differences at retention enabled us to test predictions derived from
motor learning theories that have argued for a learning advantage following variable practice
(Schmidt, 1975). Contrary to our expectations, no behavioral or neurophysiological differences
emerged at retention, when both groups putted repeatedly to the same central target. The lack of
effects could be attributed to the short duration of the putting practice: participants may have not
accumulated sufficient practice during one session of only 80 repetitions. The lack of effects may
also be attributed to the fact that the post-test assessment was a retention rather than a transfer
test (i.e., participants putted to the same target as baseline rather than to a different target). It is
also likely that the participants had a certain degree of neural efficiency at baseline (Figure 3.2):
the random variability practice posed a temporary challenge to this efficiency but then functional
activity reverted to its initial pattern once the challenge had been removed. These issues can be
addressed in future studies.
Limitations and directions for future research
The findings of the present study shed light on the neurophysiological mechanisms
underlying variable practice. However, in order to appreciate the applicability of our findings
and identify directions for future research, we need to acknowledge some study limitations. First,
the fact that, compared to the blocked group, the random group performed worse (i.e., made
larger errors) may have contributed to group differences in alpha gating. Namely, the production
of larger errors may have resulted in enhanced cognitive activity aimed at improving
performance on the next trial (Cooke et al., 2015).
Second, this study failed to find any retention effects after practicing under variable

83
conditions. Future research could adopt a longitudinal design to explore the impact of longer
trainings that could result in a more stable functional adaptation. It would be interesting to
examine whether repetition under a variable schedule leads eventually to performance
improvements and to identify the neurophysiological mechanisms explaining such an
improvement.
Third, most findings of this study regard activity detected by sensors located at the edge of
the spatial configuration examined. Due to our efforts in attenuating movement artefacts we have
interpreted these effects in terms of cortical activity. However, we cannot rule out that non-
neural activity, such as neck movements, has influenced our results. We recommend that future
research pays particular attention to this issue. As instance, researchers could record head
movements through accelerometers and identify the independent components that are statistically
related to this signal (cf. Daly, Billinger, Scherer, & Müller-Putz, 2013).
Finally, due to the compelling body of literature implicating the left temporal region in
motor control and learning (Deeny et al., 2003; Gallicchio et al., 2016a, 2016b, 2017; Haufler et
al., 2000; Kerick et al., 2004; Landers et al., 1994; Zhu et al., 2011), we recommend researchers
to address the pressing issue of explaining the functional role being played by this region in
movement tasks. For example, if inhibition of the left temporal region is linked to decreased
verbal activity (e.g., Zhu et al., 2011), then future studies could manipulate self-talk and look for
associated changes in neurophysiology.
Conclusions
The present study demonstrated the explanatory utility of the alpha gating model in motor
control research. We provided evidence of the existence of movement-related alpha gating and
its relevance for motor performance. We also demonstrated that this phenomenon can be

84
changed in an experimental setting by manipulating variability across repetitions of the
movement. The utility of a theoretical model, such as the alpha gating model, accounting for
improvement in motor performance opens interesting avenues for future applications to enhance
motor acquisition and evaluate the quality of training programs.
Our findings indicate that inhibition of occipital and temporal regions enhances
performance in a target-based motor task. Because these regions are involved with cognitive
processes, including visual perception and retrieval of declarative knowledge, we could speculate
that, once the spatial features of the target and movement parameters, such as force and direction,
have been internalized as a mental representation of an action plan, further rumination in terms
of visual processing and declarative thoughts may hinder rather than support performance.
Accordingly, our evidence-based recommendation to athletes at this stage would be: “don’t look,
don’t think, just do it!”

85
References
Brener, J. (1986). Behavioural efficiency: A biological link between informational and energetic
processes. In G. R. J. Hockey, A. W. K. Gaillard, & M. G. H. Coles (Eds.), Energetics
and human information processing (pp. 113-122). Dordrecht: Springer.
Cohen, J. (1992). A power primer. Psychological Bulletin, 112, 155–159.
https://doi.org/10.1037/0033-2909.112.1.155
Cohen, M. X. (2014). Analyzing neural time series data: theory and practice. MIT press.
Cooke, A. (2013). Readying the head and steadying the heart: A review of cortical and cardiac
studies of preparation for action in sport. International Review of Sport and Exercise
Psychology, 6, 122–138. http://dx.doi.org/10.1080/1750984X.2012.724438
Cooke, A., Gallicchio, G., Kavussanu, M., Willoughby, A., McIntyre, D., & Ring, C. (2015).
Pre-movement high-alpha power is modulated by previous movement errors: Indirect
evidence to endorse high-alpha power as a marker of resource allocation during motor
programming. Psychophysiology, 52(7), 977-981. https://doi.org/10.1111/psyp.12414
Cooke, A., Kavussanu, M., Gallicchio, G., Willoughby, A., McIntyre, D., & Ring, C. (2014).
Preparation for action: Psychophysiological activity preceding a motor skill as a function
of expertise, performance outcome, and psychological pressure. Psychophysiology, 51,
374-384. https://doi.org/10.1111/psyp.12182
Daly, I., Billinger, M., Scherer, R., & Müller-Putz, G. (2013). On the automated removal of
artifacts related to head movement from the EEG. IEEE Transactions on neural systems
and rehabilitation engineering, 21(3), 427-434.
https://doi.org/10.1109/TNSRE.2013.2254724

86
Deeny, S. P., Hillman, C. H., Janelle, C. M., & Hatfield, B. D. (2003). Cortico-cortical
communication and superior performance in skilled marksmen: An EEG coherence
analysis. Journal of Sport & Exercise Psychology, 25, 188–204
http://dx.doi.org/10.1123/jsep.25.2.188
Delorme, A., & Makeig, S. (2004). EEGLAB: An open source toolbox for analysis of single-trial
EEG dynamics including independent component analysis. Journal of Neuroscience
Methods, 134, 9–21. http://dx.doi.org/10.1016/j.jneumeth.2003.10.009
Gallicchio, G., Cooke, A., & Ring, C. (2017). Practice makes efficient: Cortical alpha
oscillations are associated with improved golf putting performance. Sport, Exercise &
Performance Psychology, 6(1), 89-102. https://dx.doi.org/10.1037%2Fspy0000077
Gallicchio, G., Cooke, A., & Ring, C. (2016a). Lower left temporal-frontal connectivity
characterizes expert and accurate performance: High-alpha T7-Fz connectivity as a
marker of conscious processing during movement. Sport, Exercise & Performance
Psychology, 5(1), 14-24. http://dx.doi.org/10.1037/spy0000055
Gallicchio, G., Finkenzeller, T., Sattlecker, G., Lindinger, S., & Hoedlmoser, K. (2016b).
Shooting under cardiovascular load: Electroencephalographic activity in preparation for
biathlon shooting. International Journal of Psychophysiology, 109, 92–99.
http://dx.doi.org/10.1016/j.ijpsycho.2016.09.004
Hatfield, B. D. (2018). Brain dynamics and motor behavior: A case for efficiency and refinement
for superior performance. Kinesiology Review, 7(1), 42-50.
https://doi.org/10.1123/kr.2017-0056
Hatfield, B. D., Haufler, A. J., Hung, T. M., & Spalding, T. W. (2004). Electroencephalographic
studies of skilled psychomotor performance. Journal of Clinical Neurophysiology, 21,

87
144–156. http://dx.doi.org/10.1097/00004691-200405000-00003
Hatfield, B. D., & Hillman, C. H. (2001). The psychophysiology of sport: A mechanistic
understanding of the psychology of superior performance. In R. N. Singer, H. A.
Hausenblas, & C. M. Janelle (Eds.), Handbook of sport psychology (2nd ed., pp. 362–
386). New York, NY: Wiley.
Haufler, A. J., Spalding, T. W., Santa Maria, D. L., & Hatfield, B. D. (2000). Neuro-cognitive
activity during a self-paced visuospatial task: Comparative EEG profiles in marksmen
and novice shooters. Biological Psychology, 53, 131–160.
http://dx.doi.org/10.1016/S0301-0511(00)00047-8
Jasper, H. H. (1958). The ten-twenty electrode system of the International Federation.
Electroencephalography and Clinical Neurophysiology, 17, 37–46.
Jensen, O., & Mazaheri, A. (2010). Shaping functional architecture by oscillatory alpha activity:
Gating by inhibition. Frontiers in Human Neuroscience, 4, 186.
http://dx.doi.org/10.3389/fnhum.2010.00186
Kerick, S. E., Douglass, L. W., & Hatfield, B. D. (2004). Cerebral cortical adaptations associated
with visuomotor practice. Medicine and Science in Sports and Exercise, 36, 118–129.
http://dx.doi.org/10.1249/01.MSS.0000106176.31784.D4
Klimesch, W. (2012). α-band oscillations, attention, and controlled access to stored information.
Trends in Cognitive Sciences, 16, 606–617. http://dx.doi.org/10.1016/j.tics.2012.10.007
Klimesch, W., Sauseng, P., & Hanslmayr, S. (2007). EEG alpha oscillations: the inhibition–
timing hypothesis. Brain Research Reviews, 53(1), 63-88.
http://dx.doi.org/10.1016/j.brainresrev.2006.06.003
Landers, D. M., Han, M., Salazar, W., Petruzzello, S. J., Kubitz, K. A., & Gannon, T. L. (1994).

88
Effect of learning on electroencephalographic patterns in novice archers. International
Journal of Sport Psychology, 22, 56–71.
Makeig, S., Bell, A.J., Jung, T.P., Sejnowski, T.J., 1996. Independent component analysis of
electroencephalographic data. In: D. Touretzky, M. Mozer, & M. Hasselmo (Eds.),
Advances in neural information processing systems (pp. 145–151). Cambridge, MA: MIT
Press.
Neumann, D. L., & Thomas, P. R. (2008). A camera-based scoring system for evaluating
performance accuracy during a golf putting task. Behavior Research Methods, 40, 892–
897. http://dx.doi.org/10.3758/BRM.40.3.892
Neuper, C., & Pfurtscheller, G. (2001). Event-related dynamics of cortical rhythms: frequency-
specific features and functional correlates. International Journal of Psychophysiology,
43(1), 41-58. https://doi.org/10.1016/S0167-8760(01)00178-7
Nichols, T. E., & Holmes, A. P. (2002). Nonparametric permutation tests for functional
neuroimaging: a primer with examples. Human Brain Mapping, 15(1), 1-25.
https://doi.org/10.1002/hbm.1058
Pfurtscheller, G. (1992). Event-related synchronization (ERS): an electrophysiological correlate
of cortical areas at rest. Clinical Neurophysiology, 83(1), 62-69.
https://doi.org/10.1016/0013-4694(92)90133-3
Pfurtscheller, G., & Da Silva, F. L. (1999). Event-related EEG/MEG synchronization and
desynchronization: basic principles. Clinical neurophysiology, 110(11), 1842-1857.
https://doi.org/10.1016/S1388-2457(99)00141-8
Porter, J. M., & Magill, R. A. (2010). Systematically increasing contextual interference is
beneficial for learning sport skills. Journal of Sports Sciences, 28(12), 1277-1285.

89
https://doi.org/10.1080/02640414.2010.502946
Schmidt, R. A. (1975). A schema theory of discrete motor skill learning. Psychological Review,
82(4), 225. http://dx.doi.org/10.1037/h0076770
Vasey, M. W., & Thayer, J. F. (1987). The continuing problem of false positives in repeated
measures ANOVA in psychophysiology: A multivariate solution. Psychophysiology, 24,
479–486. https://doi.org/10.1111/j.1469-8986.1987.tb00324.x
Zhu, F. F., Poolton, J. M., Wilson, M. R., Maxwell, J. P., & Masters, R. S. W. (2011). Neural
coactivation as a yardstick of implicit motor learning and the propensity for conscious
control of movement. Biological Psychology, 87, 66–73.
http://dx.doi.org/10.1016/j.biopsycho.2011.02.004

90
CHAPTER FOUR
Assessing ocular activity during performance of motor skills using electrooculography
Abstract
Eye-tracking research has revealed that, compared to novices, experts make longer ocular
fixations on the target of an action when performing motor skills, that is they have a longer quiet
eye. Remarkably, the reason why a longer quiet eye aids movement has yet to be established.
There is a need for interdisciplinary research and new measures to accelerate progress on the
mechanistic understanding of the phenomenon. With the aim to provide researchers with new
tools, we assessed the utility of electrooculography (EOG) to examine ocular activity while 10
experts and 10 novices putted golf balls. We measured quiet eye durations, distinguishing its pre-
and post-movement initiation components, and developed a novel time-varying index of ocular
activity, eye quietness, computed as the variability of the EOG in short time intervals: lower
values correspond with greater quietness. Finally, we measured movement durations using a
combination of infrared and sound sensors. Experts had longer post-movement initiation quiet
eye compared to novices; however, total and premovement quiet eye durations did not differ
between groups. Eye quietness was inversely correlated with quiet eye duration, and was greatest
immediately after movement initiation. Importantly, movement duration correlated positively
with post-movement initiation quiet eye and negatively with eye quietness shortly after
movement initiation. This study demonstrates the utility of assessing ocular activity during
performance of motor skills using EOG. Additionally, these findings provide evidence that

91
expert-novice differences in ocular activity may reflect differences in the kinematics (e.g.,
movement duration) of how experts and novices execute motor skills.
Introduction
The study of eye movements during performance of motor skills can yield important
information to understand how individuals control their actions. In a seminal study, Vickers
(1992) used camera-based eye-tracking to examine the gaze of 12 experienced golfers –
comprising five skilled golfers (mean handicap 6.2) and seven less skilled golfers (mean
handicap 14.1)1 – as they putted balls to a 3 m distant hole. Vickers found that, compared to the
less skilled golfers, skilled golfers made fewer and longer fixations on the ball prior to movement
initiation, during movement execution, and even after movement completion. In the intervening
25 years since this influential initial report of visual gaze control in putting, researchers have
used camera-based eye-tracking to examine individuals’ ocular activity, and especially their
quiet eye, during performance of motor skills.
The quiet eye is defined as the final ocular fixation on the target location (e.g., the ball in
golf putting), with onset occurring prior to initiation of a critical phase of the movement and
offset occurring when the gaze deviates from the target location (Vickers, 1996, 2007). A
compelling body of literature has reported that experts show longer quiet eye durations than
1 Golf handicap represents the number of strokes taken in relation to the number of
strokes expected to be taken to complete a round of golf. It indexes golfers' ability: the lower the
value, the better the player.

92
novices for a variety of motor skills, ranging from precision sports to surgery (for reviews see
Gonzalez, Causer, Miall, Grey, Humphreys, & Williams, 2017; Rienhoff, Tirp, Strauß, Baker, &
Schorer, 2016; Vickers, 2007; Wilson, Causer, & Vickers, 2015; for meta-analyses see Lebeau,
Liu, Sáenz-Moncaleano, Sanduvete-Chaves, Chacón-Moscoso, Becker, & Tenenbaum, 2016;
Mann, Williams, Ward, & Janelle, 2007). For instance, Walters-Symons, Wilson, and Vine
(2017) tested 18 experienced golfers (mean handicap 5.7) and 21 novices (no formal handicap),
as they putted balls to a 10 foot (i.e., 3 m) distant hole. They found that the experienced golfers
had longer quiet eye durations (M = 1.9 s) than the novices (M = 1.2 s). Due to the extensive
research, long quiet eye is currently considered a feature of expertise and is often cited along
classic models of skill acquisition (e.g., Fitts & Posner, 1967) whereby experts have greater
movement accuracy, consistency, automaticity, and efficiency than novices.
Despite the robustness of the quiet eye phenomenon in revealing differences between
expertise levels, there is no consensus on whether and how the quiet eye influences motor
performance (e.g., Causer, 2016; Williams, 2016; Wilson, Wood, & Vine, 2016). A number of
possible cognitive mechanisms have been proposed. The dominant hypothesis (Vickers, 1996)
contends that movement-related visual processing is enhanced and movement parameters, such
as force and direction, are programmed during the quiet eye period. Therefore, an extended quiet
eye period could lead to improved motor programming and, consequently, to enhanced motor
performance. Other hypotheses argue that a longer quiet eye duration allows inhibition of task-
irrelevant processing (Klostermann, Kredel, & Hossner, 2014) or promotes an external focus of
attention (Vine, Moore & Wilson, 2014), which has been associated with improved motor
performance (Wulf, 2013). An alternative hypothesis is that the quiet eye reflects psychomotor
quiescence. Accordingly, rather than eliciting cognitive benefits, the longer quiet eye of experts

93
could be associated with (or be a consequence of) the cleaner and more consistent movement
kinematics of expert compared to novice performers, such as a slower and more stable swing in
golf putting (Cooke et al., 2014; Delay et al., 1997; Sim & Kim, 2010).
None of the studies to date have provided unequivocal empirical evidence that a longer
quiet eye is directly associated with enhanced visual perception or cognitive processing, while
our newly suggested kinematic hypothesis has yet to be tested at all. To shed light on these
fundamental questions of why experts have a longer quiet eye than novices and why a longer
quiet eye aids performance, researchers have been encouraged to employ objective
psychophysiological measures to simultaneously assess cognitive, physiological and kinematic
variables (for review of research in sport psychophysiology, see Cooke, 2013; Hatfield, Haufler,
Hung, & Spalding, 2004). Unfortunately, the simultaneous assessment of eye-movements with
such psychophysiological and kinematic variables is a challenge for camera-based eye trackers;
the primary and often only technique used to assess ocular activity by previous quiet eye and
human performance research. Fortunately, an alternate psychophysiological tool used to record
eye movements exists. Electrooculography (EOG) measures time-varying changes in the electric
dipoles of the eyes, by recording voltage differences from electrodes placed close to the eyes
(Young & Sheena, 1975; Shackel, 1967). A goal of this study is to apply novel EOG methods to
quiet eye research and shed new light on the relationship between ocular activity and
performance. Some advantages of EOG for quiet eye researchers are as follows.
First, the eyes move at speeds up to 100 Hz (Krauzlis, Goffart, & Hafed, 2017).
Therefore, based on Nyquist-Shannon sampling theorem (Shannon, 1948), ocular activity should
be sampled at least at 200 Hz (corresponding to 1 data point every 5 ms) to prevent aliasing and
avoid temporal distortions (i.e., key features of the signal are missed or altered). Because typical

94
camera-based mobile eye-tracking systems sample data at 30 Hz, (i.e., 1 frame every 33 ms)
researchers have expressed the need for tools with greater temporal sensitivity than the ones used
to date (e.g., Causer, 2016; Gonzalez et al., 2017; Williams, 2016). Typical systems for
psychophysiological recording have a sampling frequency of 512 Hz (i.e., 1 voltage value every
2 ms) or higher. Accordingly, the EOG offers sufficient temporal precision to fully capture time-
varying ocular activity.2
Second, by definition, the quiet eye period can extend beyond movement initiation and
even beyond movement completion as long as the eyes are on the target (Vickers, 1996, 2007).
Because the preprogramming of movement parameters such as direction and force ends with
movement initiation, mechanistic studies of the quiet eye should benefit from distinguishing the
pre- and post-movement initiation components of the quiet eye period. Surprisingly, only a few
recent camera-based studies have reported these components in a golf putting task (Causer,
Hayes, Hooper, & Bennett, 2017; Vine, Lee, Moore, & Wilson, 2013; Walters-Symons, Wilson,
Klostermann, & Vine, 2017). Causer et al. (2017) found that for novice golfers (no formal
handicap), longer quiet eye durations were associated with better performance (lower radial
error) in both the pre- and post-movement initiation phases of the putt. Vine et al. (2013) found
that for experts (mean handicap 3.6) only the post-movement initiation component of the quiet
eye distinguished holed from missed putts (longer duration for holed putts). Finally, Walters-
2 The influence of sampling rate on ocular activity has been investigated by Helsen,
Starkes, Elliot, and Ricker (1998). They sampled ocular activity at 60 and 120 Hz using camera-
based eye-tracking while participants performed a finger movement task. They found that the
two sampling rates produced different results for saccade durations but not for fixation durations.

95
Symons et al. (2017) tested experienced golfers (mean handicap 6.4) and found that, compared to
shorter putts (4 feet, 1.2 m), longer putts (8 feet, 2.4 m) were associated with less accuracy and
longer post-movement initiation quiet eye durations. They also found no differences in pre-
movement initiation quiet eye durations between long and short putts. These findings cast doubt
on any quiet eye mechanism that concerns what happens before movement initiation, such as
improved preprogramming of movement parameters. By exploiting the multi-measure approach
favored in psychophysiology, EOG recordings can be supplemented with external transducers
(e.g., an infrared sensor) to detect movement initiation, such as the beginning of the backswing
in golf putting (e.g., Cooke, Kavussanu, McIntyre, & Ring, 2010), thereby ensuring that both
pre- and post-movement initiation components of the quiet eye can be easily explored.
Third, the eyes are not completely still during a fixation (e.g., Krauzlis et al., 2017).
Therefore, identifying a quiet eye period requires a threshold criterion to be applied. Because the
fovea corresponds to less than 2° of the visual field (Guyton & Hall, 2006), most quiet eye
studies have defined fixations in terms of when gaze remains within 3° or 1° of visual angle on
the target location (Gonzalez et al., 2017; Lebeau et al., 2016; Vickers, 2007). Because the
threshold influences the duration of the fixation, whereby stringent thresholds identify shorter
fixations, the impact of threshold choice on quiet eye durations has been recommended as a
research question to better understand the quiet eye phenomenon (Gonzalez et al., 2017). One of
the strengths of data processing in psychophysiology is that the signal can be scored repeatedly
and automatically using different settings, such as voltage thresholds in the EOG.
Fourth, the EOG allows researchers to examine the quiet eye phenomenon from a novel
perspective that is commonplace in psychophysiology, where signals are measured as a function
of time relative to a critical event. Accordingly, instead of defining quietness using a threshold

96
and measuring quiet eye duration (see previous point), researchers could quantify the amount of
eye quietness as a function of time relative to movement initiation (e.g., Webb & Obrist, 1970).
To date, only one study has used the EOG to examine the quiet eye in a golf putting task.
Mann, Coombes, Mousseau, and Janelle (2011) tested 10 skilled (mean handicap 1.2) and 10 less
skilled golfers (mean handicap 11.3) as they putted balls to a 12 foot (i.e., 3.7 m) distant hole.
They computed the quiet eye by applying a voltage threshold to the EOG signal and found that
the more skilled golfers had longer quiet eye durations (around 2.3 s) compared to the less
skilled golfers (around 2.1 s). However, they only scored the pre-movement initiation component
of the quiet eye, and not the potentially more important post-movement initiation component
(Vine et al., 2013; Walters-Symons, Wilson, Klostermann, & Vine, 2017). Furthermore, they
applied an atypical threshold criterion of 100 µV (corresponding to 5° of visual angle) to the
EOG signal; all other golf putting studies have employed a threshold of either 1° or 3° of visual
angle (for reviews see Gonzalez et al., 2017; Lebeau et al., 2016).
With the overarching goal of introducing psychophysiological methods to quiet eye
research, this study evaluated the utility of EOG in assessing ocular activity during performance
of motor skills. We conducted new analyses on a golf putting dataset with known expert-novice
and holed-missed differences for several psychophysiological indices (Cooke, Kavussanu,
Gallicchio, Willoughby, McIntyre, & Ring, 2014). Our primary aims were threefold. First, to
quantify both pre- and post-movement initiation components of the quiet eye using EOG.
Second, to develop a novel, time-varying measure of ocular activity in the form of eye quietness.
In line with the existing literature, we expected that quiet eye durations would be longer and eye
quietness greater in experts compared to novices and on holed putts compared to missed putts.
Third, we aimed to evaluate the validity of the eye quietness index by assessing its correlation

97
with quiet eye durations. We expected that the two measures would be highly negatively
correlated.
Our secondary aims were threefold. First to examine the impact of threshold level (e.g.,
1° or 3° of visual angle) on quiet eye duration. We expected that more stringent thresholds would
generate shorter quiet eye periods. Second, to determine the influence of expertise on the
consistency of indices of ocular activity and kinematics across putts. We expected greater
consistency in experts based on theoretical models arguing for decreased performance variability
as a function increased expertise and learning (e.g., Fitts & Posner, 1967). Finally, we examined
the relation between ocular activity (i.e., quiet eye durations, eye quietness) and swing duration.
This analysis provided the first test of our kinematic hypothesis of the relationship between quiet
eye and performance; namely that a longer quiet eye is associated with a cleaner and more
consistent technique. We expected that longer swing durations would be associated with longer
post-movement initiation quiet eye durations and greater eye quietness during swing execution.
Method
Participants
Twenty right-handed male golfers took part in this study. Ten were experts (age: M =
20.90, SD = 0.74 years; experience: M = 11.25, SD = 3.78 years; handicap: M = 1.50, SD = 2.32)
and ten were novices (age: M = 19.00, SD = 0.66 years; experience: M = 1.85, SD = 2.49 years;
no formal handicap). All provided informed consent.
Putting task
Participants putted golf balls (diameter 4.7 cm) on an artificial flat putting surface

98
(Turftiles) to 2.4 m distant hole, using a blade-style putter (length 90 cm). The hole was of
regular size for novices (diameter: 10.8 cm) and half-size for experts (diameter: 5.4 cm). This
difference in hole size was chosen so that the two groups holed a similar number of putts and
thereby putting outcome (holed, missed) could be used as a factor in our analyses (cf. Babiloni et
al., 2008). Indeed, the performance of the two groups did not differ, t(18) = 1.18, p = .25, r² = .
072, with experts holing 41% (SD = 17%) and novices holing 31% (SD = 19%) of putts.
Participants were instructed to get each ball “ideally in the hole, but if unsuccessful, to make
them finish as close to the hole as possible.” Addressing of the ball, movement initiation (i.e.,
beginning of backswing), and putter-ball impact were detected through the combination of infra-
red (S51-PA 2-C10PK, Datasensor, Monte San Pietro, Italy) and sound (NT1, Rode, Silverwater,
Australia) sensors.
EOG signal
Three pairs of Ag-AgCl electrodes, each with an integrated preamplifier, were applied to
the participant’s skin. These were placed at the bottom and outer canthi of both eyes as well as
on the forehead (Fp1 and Fp2 location in the 10–20 system, Jasper, 1958). Common mode sense
and driven right leg electrodes were used instead of ground and reference electrodes to enhance
the common mode rejection ratio of the signal. Voltages were recorded and digitized at 512 Hz
(24-bit resolution) using the ActiveTwo system (BioSemi, Netherlands). Offline, the electrodes
were bipolar-referenced to obtain one horizontal EOG and two vertical EOGs channels: for the
horizontal channel, positive and negative voltages indicated eye movements respectively to the
left and to the right; for the vertical channels, positive and negative voltages indicated
respectively upward and downward eye movements. The signals were band-pass filtered 0.1 to
30 Hz (FIR, Order 512) according to guidelines (Marmor et al., 2011). Epochs were extracted

99
from –9 to +3 s relative to movement initiation (i.e., beginning of backswing), unless two
contiguous trial epochs overlapped (in this case, the prebackswing portion was cut shorter). All
participants’ vertical and horizontal EOG signals are presented in the Supplemental Material of
Chapter Four (Supplement S1) and examples are shown in Figure 4.1A. As golf putting is
performed in the frontal plane, we focused our analyses on the horizontal signals. Signal
processing was performed using MATLAB (MathWorks, Natick, MA).

100
Figure 4.1. (A) Horizontal and vertical (left and right eye) EOG signals. Voltages (µV) are represented as function of time (s). Voltage
increases indicate eye movements to the left or upward; voltage decreases indicate movements to the right or downward. Eye blinks
are evident in the vertical EOG signals. (B) Output of the QE algorithm with 60 and 20 µV thresholds. Thick colored lines indicate the
quiet eye period in its pre-movement initiation (QEpre) and post-movement initiation (QEpost) components.

101
Procedure
Following instrumentation and task familiarization (20 putts), participants putted 60 balls
in each of two counter-balanced pressure conditions. Due to the methodological nature of this
study, only the no-pressure condition was analyzed. It is worth noting that the null effects of
pressure on performance and other psychophysiological signals have been reported by Cooke et
al. (2014). The mean inter-putt interval for the no-pressure condition was 15.44 s (SD = 1.90).
Light conditions were kept constant throughout testing.
Measures
Quiet eye. The duration of the total quiet eye (QEtotal) was measured as the time (in
seconds) between quiet eye onset and quiet eye offset. QEtotal comprised the sum of the pre-
movement initiation (QEpre) and post-movement initiation (QEpost) components. The onset and
offset of the quiet eye were detected using a voltage-threshold algorithm, which is described in
detail in the Supplemental Material of Chapter Four (Supplement S2). This algorithm was
employed twice: once using a 60 µV threshold and once using a 20 µV threshold, corresponding
with eye movements of 3° and 1° of visual angle, respectively (Shackel, 1967; cf. Mann et al,
2011). The outputs of both algorithms for all participants are presented in the Supplemental
Material of Chapter Four (Supplement S3); examples are shown in Figure 4.1B.
Eye quietness. Eye quietness was operationalized as the standard deviation of the
horizontal EOG signal (HEOG-SD), measured in µV, within each of 12 0.5 s bins, ranging from
–4 to +2 s relative to movement initiation. Lower HEOG-SD values correspond with less
movement of the eyes, i.e., greater quietness. The bin width was chosen following exploratory
analyses using a range of widths (0.125, 0.25, 0.5 and 1 s): 0.5 s was sufficiently brief to capture
variation in eye quietness in the context of golf putting whereas 1 s was too coarse.

102
Putting times. Address time was measured as the time, in seconds, between the
positioning of the putter head next to the ball and movement initiation (i.e., beginning of
backswing). Swing time was measured as the time, in seconds, between movement initiation and
putter-ball impact.
Performance. Performance was measured as the percentage of holed putts.
Data reduction and statistical analyses
Putting times, quiet eye and eye quietness measures were computed for each putt. These
were used to compute each participant’s (a) arithmetic mean, as an index of the average value,
and (b) standard deviation, as an index of variability across putts. Analyses involving quiet eye
durations were conducted twice, separately for the two thresholds (60 and 20 µV) .
Group, outcome, and time differences. Differences in quiet eye durations and putting
times were examined using 2 Group (expert, novice) × 2 Outcome (holed, missed) ANOVAs,
with group as a between-subjects factor and outcome as a within-subjects factor. Differences in
eye quietness were examined using 2 Group (expert, novice) × 2 Outcome (holed, missed) × 12
Time (0.5 s bins from –4 to +2 s) ANOVA, with group as a between-subjects factor and outcome
and time as within-subjects factors. The multivariate solution was adopted where appropriate
(Vasey & Thayer, 1987) and Wilks' lambda (λ) reported. Univariate partial eta-squared (η²p) was
reported as a measure of effect size, with values of .02, .13, and .26 reflecting small, medium,
and large effects, respectively (Cohen, 1992). Significant interactions were interrogated using
posthoc t-tests (reported for p < .05).
Relations between quiet eye and eye quietness. Pearson’s correlations were conducted
between quiet eye durations and eye quietness (HEOG-SD) to examine the relationship between
the two indices of ocular activity. Only relevant comparisons were considered: QEpre with pre-

103
movement initiation eye quietness and QEpost with post-movement initiation eye quietness.
Impact of threshold on quiet eye durations. We employed 300 different thresholds,
ranging from 2 to 600 µV (in 2 µV increments), corresponding to a range of 0.1 to 30° (in 0.1°
increments) of visual angle. For each threshold we evaluated group differences through
independent-sample t-tests.
Correlates of performance. Pearson’s correlations were conducted between the
percentage of holed putts and (a) quiet eye durations, (b) eye quietness, and (c) putting times.
These correlations were performed separately for each group due to the different hole sizes (i.e.,
task difficulties) used for these two groups.
Relations between putting times and ocular activity. Pearson’s correlations were
conducted to explore the relations between ocular activity (quiet eye and eye quietness) and
putting times (address and swing times).
Results
Group, outcome, and time differences
Quiet eye. The mean (SD) quiet eye durations for each group’s holed and missed putts are
presented in Table 4.1. More and greater expert-novice differences were detected using the more
restrictive 20 µV threshold than the 60 µV threshold. It is noteworthy that QEtotal and QEpre
durations did not differ between experts and novices. However, experts had longer QEpost (for 60
µV and 20 µV thresholds) than novices. In terms of variability across putts, experts had less
variable QEtotal and QEpre durations (for 60 µV threshold) but more variable QEpost duration (for
20 µV threshold) compared to novices.

104
Table 4.1. Mean (SD) of quiet eye durations (QEtotal, QEpre, and QEpost), computed with 60 and 20 µV threshold levels, and putting
times (address and swing times), with the results of the 2 Group (expert, novice) × 2 Outcome (holed, missed) mixed ANOVAs.
Values were examined as average (e.g., QEtotal) and standard deviation (e.g., SD QEtotal) across putts.
Experts (n = 10) Novices (n = 10) Group Outcome Group × Outcome
Measures Holed Missed Holed Missed F(1,18) η²p F(1,18) η²p F(1,18) η²p
Quiet eye durations (s), 60 µV QEtotal 1.983 (0.60) 2.002 (0.52) 2.400 (1.65) 2.557 (1.72) 0.78 .041 0.66 .035 0.40 .022 QEpre 1.032 (0.49) 1.061 (0.50) 1.848 (1.59) 2.014 (1.63) 2.88 .138 0.81 .043 0.40 .022 QEpost 0.952 (0.21) 0.942 (0.23) 0.552 (0.25) 0.543 (0.21) 16.49** .478 0.26 .014 0.00 0.00 SD QEtotal 0.57 (0.43) 0.55 (0.35) 1.15 (0.83) 1.19 (0.62) 6.61* .268 0.01 .000 0.07 .003 SD QEpre 0.46 (0.49) 0.44 (0.38) 1.06 (0.86) 1.11 (0.68) 6.28* .259 0.03 .002 0.07 .004 SD QEpost 0.21 (0.12) 0.22 (0.08) 0.25 (0.06) 0.25 (0.08) 0.73 .039 0.05 .003 0.22 .012
Quiet eye durations (s), 20 µV QEtotal 0.705 (0.25) 0.655 (0.21) 0.664 (0.54) 0.627 (0.44) 0.04 .002 4.03 .183 0.08 .004 QEpre 0.417 (0.19) 0.381 (0.13) 0.497 (0.51) 0.454 (0.41) 0.25 .014 2.91 .139 0.02 .001 QEpost 0.288 (0.11) 0.275 (0.11) 0.167 (0.06) 0.173 (0.07) 8.29* .884 0.13 .007 0.89 .047 SD QEtotal 0.33 (0.13) 0.32 (0.09) 0.38 (0.29) 0.38 (0.25) 0.38 .020 0.35 .019 0.02 .001 SD QEpre 0.27 (0.11) 0.25 (0.08) 0.35 (0.30) 0.34 (0.28) 0.82 .044 0.89 .047 0.04 .002 SD QEpost 0.16 (0.07) 0.16 (0.08) 0.08 (0.04) 0.10 (0.05) 8.73** .327 1.02 .054 0.51 .027
Putting times (s)
Address 2.92 (0.81) 2.99 (0.90) 4.79 (3.3) 4.43 (2.78) 2.79 .134 1.16 .061 2.47 .121
Swing 0.89 (0.15) 0.90 (0.16) 0.71 (0.14) 0.71 (0.15) 8.53** .321 0.44 .024 0.15 .008
SD Address 0.78 (0.60) 0.79 (0.48) 1.96 (1.47) 2.15 (1.60) 6.19* .256 1.54 .079 1.13 .059
SD Swing 0.04 (0.02) 0.06 (0.09) 0.07 (0.03) 0.20 (0.44) 1.35 .070 1.18 .062 0.66 .036 * p ≤ .05; ** p < .01

105
Eye quietness. The mean (SE) HEOG-SD measures of eye quietness as a function of
group, outcome, and time are illustrated in Figure 4.2. A consistent time-varying cubic pattern
can be seen: ocular activity increased during the movement preparation phase (–4 to –1 s),
peaking just before movement initiation (c. –1 s), before dropping, with a trough around
movement execution (0 s), and then increasing again after the ball was struck (c. 1 s).
The 2 Group × 2 Outcome × 12 Time ANOVA conducted on the mean HEOG-SD
revealed a main effect for time, F(11,8) = 7.87, p = .004, λ = .085, η²p = .247, and a Group ×
Time interaction, F(11,8) = 9.95, p = .002, λ = .068, η²p = .141. Independent-sample t-tests
revealed that, compared to novices, experts had greater HEOG-SD from –2.5 to –1.5 s and
smaller HEOG-SD from 0 to 1 s. No effects emerged for group, F(1,18) = 0.96, p = .34, η²p =
.051, outcome, F(1,18) = 0.51, p = .49, η²p = .027, Group × Outcome, F(1,18) = 1.11, p = .31, η²p
= .058, Outcome × Time, F(11,8) = 0.65, p = .75, λ = .528, η²p = .070, nor Group × Outcome ×
Time, F(11,8) = 0.78, p = .65, λ = .481, η²p = .044.
The 2 Group × 2 Outcome × 12 Time ANOVA conducted on the variability of HEOG-
SD revealed a main effect for time, F(11,8) = 5.24, p = .01, λ = .122, η²p = .414, namely, a cubic
(increase, decrease, increase) pattern. No effects emerged for group, F(1,18) = 0.27, p = .61, η²p
= .015, outcome, F(1,18) = 1.11, p = .31, η²p = .058, Group × Outcome, F(1,18) = 0.72, p = .41,
η²p = .038, Outcome × Time, F(11,8) = 3.13, p = .06, λ = .189, η²p = .115, Group × Time, F(11,8)
= 2.84, p = .07, λ = .204, η²p =.139, or Outcome × Group × Time, F(11,8) = 0.85, p = .61, λ =
.462, η²p = .023.
Putting times. The mean (SD) putting times for each group’s holed and missed putts are
presented in Table 4.1. Experts had longer swing times and less address time variability
(indicative of greater consistency across putts) than novices.

106
Figure 4.2. Eye quietness, i.e., HEOG-SD (µV), (panels A, B, and C) and its variability across putts, i.e., SD HEOG-SD (µV), (panels
D, E, and F) as a function of time (s) from −4 to 2 s and either group (experts, novices) or outcome (holed, missed). HEOG-SD is
inversely related to eye quietness: lower values indicate greater quietness. Panels A and D show Group × Time effects. Error bars
indicate between-subject SE. Panels B and E show Outcome × Time effects for the experts. Panels C and F show Outcome × Time
effects for the novices. Error bars indicate within-subject SE computed through normalization of the outcome factor (Cousineau,
2005).

107
Relation between quiet eye and eye quietness
Quiet eye durations were negatively correlated with HEOG-SD in both the pre- and
post-movement initiation phases, most notably and prominently in the second before and the
second after the onset of the backswing (see Table 4.2). As expected, these analyses confirm
an inverse association between the quiet eye and eye quietness measures.
Table 4.2. Pearson’s correlations between quiet eye durations (QEpre and QEpost), computed
with 60 and 20 µV threshold levels, and eye quietness (HEOG-SD), computed in different
time intervals relative to backswing initiation. The table shows only relevant comparisons
(e.g., pre-movement initiation quiet eye with pre-movement initiation eye quietness).
HEOG-SD (µV)
QEpre (s) QEpost (s)
60 µV 20 µV 60 µV 20 µV
–4 to –3.5 s –.50* –.34 - -
–3.5 to –3 s –.41 –.21 - -
–3 to –2.5 s –.38 –.07 - -
–2.5 to –2 s –.34 –.02 - -
–2 to –1.5 s –.33 –.11 - -
–1.5 to –1 s –.64** –.35 - -
–1 to –0.5 s –.62** –.50* - -
–0.5 to 0 s –.48* –.49* - -
0 to 0.5 s - - –.91*** –.80***
0.5 to 1 s - - –.53* –.33
1 to 1.5 s - - .11 –.18
1.5 to 2 s - - .19 .29
* p ≤ .05; ** p < .01; *** p < .001
Impact of threshold level on quiet eye duration
To further explore the impact of threshold level on expert-novice differences in the
quiet eye, we computed their quiet eye durations corresponding to visual angles of 0.1 to 30°
(2 to 600 µV). Importantly, experts never exhibited longer durations of QEtotal (Figure 4.3A)

108
or QEpre (Figure 4.3B) than novices. Unexpectedly, compared to experts, novices showed
longer QEtotal durations at extremely high thresholds spanning approximately 400-500 µV
(i.e. 20-25° of visual angle) as well as longer QEpre durations at high to extremely high
thresholds spanning 100-500 µV (5°-25° of visual angle). Finally, experts displayed longer
QEpost durations than novices at thresholds of 20-150 µV, corresponding to 1°-7° of visual
angle, which overlap with those used in camera-based research.

109
Figure 4.3. Durations (s) of total (QEtotal, panel A), pre-movement initiation (QEpre, panel B),
and post-movement initiation (QEpost, panel C) quiet eye, as a function of threshold (µV and
corresponding degrees of visual angle). The solid and dashed lines represent mean durations,
respectively for experts and novices. The two colored bars above the x-axis indicate r2 and p
values associated with the independent-sample t-tests conducted on group differences (df =
18). The shaded areas represent the SE of each group’s means and were computed using
pooled estimates, hence corresponding with the independent-sample t-tests (Pfister &
Janczyk, 2013).

110
Correlates of performance
For experts, the percentage of holed putts was unrelated to putting times, quiet eye
durations, and eye quietness, with two exceptions (see Supplement S4 in the Supplemental
Material of Chapter Four). Expert performance was negatively correlated with mean HEOG-
SD in only the –2 to –1.5 s (r = –.76, p = .01) and 1.5 to 2 s (r = –.71, p = .02) bins,
indicating that more putts were holed by players whose eyes were quieter within these
intervals. For novices, the percentage of holed putts was unrelated to putting times, quiet eye
durations, and eye quietness, with three exceptions (see Supplement S4 in the Supplemental
Material of Chapter Four). Novice performance was negatively correlated with the QEtotal (r =
–.63, p = .05) and QEpre (r = –.63, p = .05) with the 60 µV threshold, showing that more putts
were holed by players with shorter total and pre-movement initiation quiet eye durations.
Lastly, novices’ performance was positively correlated with mean HEOG-SD in just the –0.5
to 0 s bin (r = .73, p = .02), indicating that more putts were holed by participants whose eyes
were less quiet within this interval.
Relations between putting times and ocular activity
Pearson’s correlations were computed between pre-movement initiation ocular
activity and address times as well as between post-movement initiation ocular activity and
swing times (Supplement S5 in the Supplemental Material of Chapter Four). These analyses
showed that address times were unrelated to quiet eye and eye quietness. Crucially, ocular
activity after backswing initiation was associated with the duration of the swing time.
Namely, swing times correlated positively (r = .52, p = .02) with QEpost (60 µV threshold)
and negatively (r = –.63, p = .003) with HEOG-SD measured 0.5 to 1 s after swing initiation.
Thus, participants with longer putting strokes were characterized by longer post-movement
initiation quiet eye durations and greater quietness around impact with the ball.

111
Discussion
This report explored the utility of EOG in the study of ocular activity during performance of a
motor skill. Specifically, we conducted the first analysis of the effects of expertise on both
pre- and post-movement initiation quiet eye components in golf putting. We also developed a
new measure of movement-related ocular activity in the form of eye quietness, inversely
related with quiet eye duration. The analyses generated a number of novel findings shedding
light on the mechanisms underpinning the relationship between ocular activity and motor
behavior. These effects are discussed below.
Quiet eye
A primary aim was to quantify both pre- and post-movement initiation components of
the quiet eye using EOG and a secondary aim was to examine the impact of threshold level
on quiet eye duration. We examined quiet eye durations at threshold levels corresponding
with 3° and 1° of visual angle (i.e., respectively, 60 µV and 20 µV; Shackel, 1967), typically
used in the quiet eye literature. As expected, quiet eye durations were longer with 3° (around
2 s for experts and 2.5 s for novices) than with 1° (around 0.7 s for experts and 0.6 s for
novices). However, contrary to expectations, total quiet eye duration (i.e., QEtotal) did not
distinguish experts from novices. Interestingly, group differences emerged when the quiet eye
period was broken down relative to the moment of movement initiation. Compared to
novices, experts showed a shorter, albeit not significant, pre-movement initiation quiet eye
(i.e., QEpre), and longer post-movement initiation quiet eye (i.e., QEpost) (Table 4.1). Further
analyses revealed that there was no threshold setting at which experts had a longer total quiet
eye (QEtotal) or pre-movement initiation quiet eye (QEpre) than novices. Instead, experts only
had shorter durations than novices, although this difference was significant only for threshold

112
levels that were larger than typically used in literature (Figure 4.3A and 4.3B). These
analyses also confirmed that experts showed a longer post-movement initiation quiet eye
(QEpost) than novices (Figure 4.3C).
That the post-movement initiation component of the quiet eye was more sensitive than
the pre-movement initiation component of the quiet eye in revealing differences in putting
performance in experienced golfers is consistent with two previous studies (Vine et al., 2013,
2015). First, Vine et al. (2013) tested 50 expert golfers (mean handicap 3.6) as they putted
balls to a 5 foot (i.e., 1.5 m) distant hole. They examined the quiet eye in different phases of
the putt and found that, compared to missed putts, holed putts were characterized by a longer
post-movement initiation quiet eye, whereas the pre-movement initiation quiet eye was not
different. Second, Vine et al. (2015) tested 27 experienced golfers (mean handicap 5.8) as
they putted balls to a 10 foot (i.e., 3 m) distant hole. Participants’ view of the ball was
occluded either before or after movement initiation, through a liquid crystal glass panel –
positioned above the ball –turning opaque. The authors found that, compared to a no-
occlusion condition, performance was impaired by post-movement initiation occlusion but
not by pre-movement initiation occlusion. Taken together, these findings were interpreted as
evidence that visual information was actively processed only after movement initiation (i.e.,
during the execution of the movement), suggesting that post-movement initiation quiet eye
was involved in the online control of movement (Vine et al. 2015). However, it has to be
noted that this interpretation may not apply to novices (Causer et al., 2017).
To our knowledge, this is the first golf putting study to separately examine quiet eye
durations before and after movement initiation in an expert-novice design. The fact that
effects of expertise, as well as of performance, emerged only after movement initiation, i.e.,
when movement preprogramming is completed, raises doubts on the interpretation of the
quiet eye as correlate of motor programming (Vickers, 1996). Further mechanistic

113
psychophysiological research is needed to clarify this issue. The EOG methodology
developed here offers a promising tool to permit such research.
Eye quietness
Our primary purposes here were to develop a novel time-based EOG measure of eye-
quietness, and to evaluate its validity by assessing correlations with our measure of quiet eye.
We examined ocular activity as a function of time by computing the variability (standard
deviation) of the EOG signal in short intervals (500 ms). This index allowed us to evaluate
not only how long the eyes remained “quiet” but also how “quiet” the eyes were for intervals
overlapping the quiet eye period. Time-varying statistical analyses revealed that eye quietness
fluctuated over time, decreasing prior to movement initiation, increasing around movement
execution, and then finally decreasing after movement completion (Figure 4.2). It is
interesting to note that the eyes were quietest immediately after movement initiation. Group
differences emerged in the second after the ball was struck, which were times that roughly
overlapped movement execution, when experts kept their eyes quieter compared to novices.
Experts also showed more ocular activity than novices around 2 s prior to movement
initiation, perhaps indicative of them taking a final look at the hole consistently at that time
(see Supplement S1 in the Supplemental Material of Chapter Four) .
As expected, these results for eye quietness broadly match those for quiet eye
durations, i.e., greater post-movement initiation eye quietness corresponded with longer quiet
eye duration, whereas less pre-movement initiation eye quietness corresponded with shorter
quiet eye duration. Indeed, further analyses confirmed our hypothesis that eye quietness
would correlate negatively with quiet eye durations, particularly at times immediately
preceding and following movement initiation (Table 4.2), concurrently validating eye
quietness as a measure of ocular activity. This new measure of movement-related ocular
activity promises to be especially useful for future multi-method psychophysiological

114
investigations, where it will allow time-synchronized analyses of ocular activity with other
signals of interest such as EEG. This research is needed to shed further light on the
mechanisms that underpin motor performance.
Consistency
We hypothesized that consistency of ocular activity across putts would be greater in
experts than novices. The analyses of the variability (standard deviation) across putts for
quiet eye durations and address times revealed that experts generally showed greater
consistency than novices (Table 4.1), in line with classic models of motor skill acquisition
(e.g., Fitts & Posner, 1967). Such group differences are also noticeable from inspection of the
individual EOG waveforms (see Supplement S1 in the Supplemental Material of Chapter
Four). This consistency effect may reflect the fact that experts have a more consolidated and
permanent putting routine than novices, involving address time as well as ocular behavior.
Performance effects
We predicted, based on extant literature, that quiet eye durations would be longer, and
eye quietness greater, for holed compared to missed putts. No differences emerged comparing
holed and missed putts for all measures of ocular activity and movement times (Table 4.1).
However, performance effects were detected when we considered the variability of
participants separately within each group (see Supplement S4 in the Supplemental Material of
Chapter Four). Correlation analyses revealed that among the novices, those with shorter quiet
eye durations (total and pre-movement initiation quiet eye) and less eye quietness
immediately before movement initiation holed more putts. This finding is in contrast with the
view that longer quiet eye leads to better performance (Vine et al., 2014) but is consistent
with the finding of this study that, on average, experts showed shorter total and pre-
movement initiation quiet eye durations than novices. In other words, the novices that
showed ocular activity more similar to that of the experts performed better. For the experts,

115
those with greater eye quietness two seconds before and after movement initiation holed
more putts. These findings may indicate that better performance was achieved by experts who
moved their eyes less before putting (perhaps because they did not need to look at the hole as
often, due to superior green-reading abilities) and after movement completion (perhaps
because the ball ended in the hole more often or was rolling directly to the target and,
therefore, there was less need to track it in some other spatial locations).
Kinematic hypothesis
Our final prediction was that longer swing durations would be associated with longer
post-movement initiation quiet-eye durations and greater eye quietness during swing
execution. Experts took around 200 ms longer than novices to swing the putter and hit the
ball (Table 4.1). This finding is consistent with studies that have examined expert-novice
differences for movement kinematics in golf putting (e.g., Delay et al., 1997). The fact that
experts showed less ocular activity (i.e., greater eye quietness) than novices at times
overlapping the execution of the swing suggests a connection between ocular activity and
movement duration. Further analyses confirmed that swing duration correlated positively
with the duration of the post-movement initiation quiet eye (i.e., QEpost) and negatively with
eye quietness 0.5 to 1 s after movement initiation (see Supplement S5 in the Supplemental
Material of Chapter Four). These results suggests that group differences for post-movement
initiation ocular activity, discussed above, may be explained, at least in part, by the fact that
experts took longer to perform the movement compared to novices. This provides promising
evidence for the kinematic hypothesis as a mechanism to explain individual differences in
gaze behavior. Specifically, keeping a quiet eye during the swing may enhance postural
stability and permit a smoother movement execution. Alternatively, a longer and smoother
technique may prompt a longer quiet eye and greater eye quietness during the swing. Indeed,
compared to novices, experts swing the putter with lower variability in the axis perpendicular

116
to the putting line (Cooke et al., 2014; Sim & Kim, 2010). The hypothesis that quiet eye
represents a correlate of stability during the movement execution is worthy of more direct
examination by future research. For example, studies could manipulate features of the
movement (e.g., by varying putting distance; Delay et al., 1997) and examine their impact on
putting kinematics (e.g., swing duration, smoothness, stability) as well as ocular activity to
provide more direct tests of the kinematic hypothesis.
Limitations and Directions
The findings of this study need to be considered in light of some limitations. First, the
EOG measures eye movements relative to the head and, therefore, head movements are
confounded with eye movements (Young & Sheena, 1975). For example, a shift in gaze to
the left with a still head generates an EOG signal that looks similar to a head movement to the
right with a still gaze: in both cases the eyes move to the left but indicate a saccade and a
fixation, respectively. In the present study we were able to observe that all participants rested
their head above the ball during the final seconds before and during movement. Nonetheless,
it would be better for future studies to directly measure head movements to control for this
source of bias. Second, we computed quiet eye durations using the EOG signal from only the
horizontal channel. However, to increase reliability and generalizability of this method to a
variety of movement tasks, future studies could develop better algorithms that combine
information from both the vertical and horizontal EOG channels. Third, we acknowledge that
the equivalence of 20 µV on the horizontal EOG signal with 1° of visual angle is an
oversimplification (Shackel, 1967). In fact, the corneo-retinal potential that generates the
electrical activity that is detected by the EOG changes according to ambient luminance
(Young & Sheena, 1975). This effect does not bias our findings because light conditions were
kept constant throughout testing and adaptations to luminance changes occur over the course
of several minutes (Marmor et al., 2011). Nonetheless, we recommend that researchers

117
calibrate the EOG signal to visual stimuli placed at a known distance in visual angles, for
each participant, to account for inter-individual variability. Fourth, differently from eye-
tracking, the EOG does not provide spatial information on gaze location. For example, we
could not distinguish whether, during the quiet eye period, the gaze was on the target (i.e., the
ball) or on a location near the target (e.g., putting surface, putter head). In light of the fact that
less skilled golfers make more fixations than more skilled golfers prior to backswing
initiation (e.g., Vickers, 1992), this limitation may explain why our finding that novices had
longer pre-movement initiation quiet eye durations than experts departs from what is reported
in most other quiet eye studies. Fifth, experts putted to a smaller hole than novices. This
ensured that the two groups achieved a similar number of holed and missed putts. However,
the novelty of putting to a smaller hole may have affected experts’ preparatory processes and
their ocular behaviour. Finally, EOG can provide complementary information to eye-
tracking. Therefore, future studies would do well to concurrently record eye-tracking and
EOG to combine the greater spatial resolution of the former with the greater temporal
resolution of the latter.
Conclusion
This study demonstrated the utility of new EOG-based methods as complementary
techniques to camera-based eye-tracking to assess ocular activity during execution of motor
skills. By incorporating EOG methods, quiet eye research should benefit from the body of
knowledge produced by psychophysiological research about expertise and performance in
motor control (for review of studies see Cooke, 2013; Hatfield, Haufler, Hung, & Spalding,
2004). This interdisciplinarity should provide novel viewpoints on pressing issues, such as
the efficiency paradox (Mann, Wright, & Janelle, 2016), questioning the function of a longer
quiet eye when most psychomotor indices, including those of brain activity, indicate that
expertise is associated with quietening of task-irrelevant activity and enhancement of task-

118
relevant activity (e.g., Gallicchio, Cooke, & Ring, 2017). The evidence garnered here favors a
more parsimonious explanation for previously identified expert-novice differences in quiet
eye duration; they could simply reflect experts’ better and smoother technique.

119
References
Babiloni, C., Del Percio, C., Iacoboni, M., Infarinato, F., Lizio, R., Marzano, N., … Eusebi,
F. (2008). Golf putt outcomes are predicted by sensorimotor cerebral EEG rhythms.
Journal of Physiology, 586, 131-139. https://doi.org/10.1113/jphysiol.2007.141630
Causer, J. (2016). The future of quiet eye research – comment on Vickers. Current Issues in
Sport Science, 1, 1–4. https://doi.org/10.15203/CISS_2016.103
Causer, J., Hayes, S. J., Hooper, J. M., & Bennett, S. J. (2017). Quiet eye facilitates
sensorimotor preprograming and online control of precision aiming in golf putting.
Cognitive Processing, 18(1), 47-54. https://doi.org/10.1007/s10339-016-0783-4
Cohen, J. (1992). A power primer. Psychological Bulletin, 112, 155–159.
https://doi.org/10.1037/0033-2909.112.1.155
Cooke, A. (2013). Readying the head and steadying the heart: A review of cortical and
cardiac studies of preparation for action in sport. International Review of Sport and
Exercise Psychology, 6, 122–138. https://doi.org/10.1080/1750984X.2012.724438
Cooke, A., Kavussanu, M., McIntyre, D., & Ring, C. (2010). Psychological, muscular and
kinematic factors mediate performance under pressure. Psychophysiology, 47(6),
1109-1118. https://doi.org/10.1111/j.1469-8986.2010.01021.x
Cooke, A., Kavussanu, M., Gallicchio, G., Willoughby, A., McIntyre, D., & Ring, C. (2014).
Preparation for action: Psychophysiological activity preceding a motor skill as a
function of expertise, performance outcome, and psychological pressure.
Psychophysiology, 51(4), 374-384. https://doi.org/10.1111/psyp.12182
Cousineau, D. (2005). Confidence intervals in within‐subject designs: A simpler solution to
Loftus and Masson’s method. Tutorials in Quantitative Methods for Psychology, 1,
42‐45. https://doi.org/10.20982/tqmp.01.1.p042

120
Delay, D., Nougier, V., Orliaguet, J., & Coello, Y. (1997). Movement control in golf putting.
Human Movement Science, 16, 597–619. https://doi.org/10.1016/S0167-
9457(97)00008-0
Fitts, P. M., & Posner, M. I. (1967). Human performance. Belmont, CA: Brooks/Cole.
Gallicchio, G., Cooke, A., & Ring, C. (2017). Practice makes efficient: Cortical alpha
oscillations are associated with improved golf putting performance. Sport, Exercise &
Performance Psychology, 6(1), 89-102. https://doi.org/10.1037/spy0000077
Gonzalez, C. C., Causer, J., Miall, R. C., Grey, M. J., Humphreys, G., & Williams, A. M.
(2017). Identifying the causal mechanisms of the quiet eye. European Journal of
Sport Science, 17(1), 74-84. https://doi.org/10.1080/17461391.2015.1075595
Guyton, A. C., & Hall, J. E. (2006). Textbook of medical physiology (11th Ed.). Philadelphia,
PA: Elsevier Inc.
Hatfield, B. D., Haufler, A. J., Hung, T. M., & Spalding, T. W. (2004).
Electroencephalographic studies of skilled psychomotor performance. Journal of
Clinical Neurophysiology, 21, 144–156. https://doi.org/10.1097/00004691-
200405000-00003
Helsen, W. F., Starkes, J. L., Elliott, D., & Ricker, K. L. (1998). Sampling frequency and the
study of eye-hand coordination in aiming. Behavior Research Methods, 30(4), 617-
623. https://doi.org/10.3758/BF03209479
Jasper, H. H. (1958). The ten-twenty electrode system of the International Federation.
Electroencephalography and Clinical Neurophysiology, 17, 37–46.
Klostermann, A., Kredel, R., & Hossner, E. J. (2014). On the interaction of attentional focus
and gaze: The quiet eye inhibits focus-related performance decrements. Journal of
Sport and Exercise Psychology, 36(4), 392-400. https://doi.org/10.1123/jsep.2013-
0273

121
Krauzlis, R. J., Goffart, L., & Hafed, Z. M. (2017). Neuronal control of fixation and
fixational eye movements. Philosophical Transactions of the Royal Society B,
372(1718), 1-12. https://doi.org/10.1098/rstb.2016.0205
Lebeau, J. C., Liu, S., Sáenz-Moncaleano, C., Sanduvete-Chaves, S., Chacón-Moscoso, S.,
Becker, B. J., & Tenenbaum, G. (2016). Quiet eye and performance in sport: A meta-
analysis. Journal of Sport and Exercise Psychology, 38(5), 441-457.
https://doi.org/10.1123/jsep.2015-0123
Mann, D. T., Coombes, S. A., Mousseau, M. B., & Janelle, C. M. (2011). Quiet eye and the
bereitschaftspotential: Visuomotor mechanisms of expert motor performance.
Cognitive Processing, 12(3), 223-234. https://doi.org/10.1007/s10339-011-0398-8
Mann, D. T., Wright, A., & Janelle, C. M. (2016). Quiet eye: The efficiency paradox –
comment on Vickers. Current Issues in Sport Science, 1, 1-4.
https://doi.org/10.15203/CISS_2016.111
Mann, D. T., Williams, A. M., Ward, P., & Janelle, C. M. (2007). Perceptual-cognitive
expertise in sport: A meta-analysis. Journal of Sport and Exercise Psychology, 29(4),
457-478. https://doi.org/10.1123/jsep.29.4.457
Marmor, M. F., Brigell, M. G., McCulloch, D. L., Westall, C. A., Bach, M., & International
Society for Clinical Electrophysiology of Vision. (2011). ISCEV standard for clinical
electro-oculography (2010 update). Documenta Ophthalmologica, 122(1), 1-7.
https://doi.org/10.1007/s10633-011-9259-0
Pfister, R., & Janczyk, M. (2013). Confidence intervals for two sample means: Calculation,
interpretation, and a few simple rules. Advances in Cognitive Psychology, 9(2), 74-80.
https://doi.org/10.5709/acp-0133-x
Rienhoff, R., Tirp, J., Strauß, B., Baker, J., & Schorer, J. (2016). The ‘quiet eye’ and motor
performance: a systematic review based on Newell’s constraints-led model. Sports

122
Medicine, 46(4), 589-603. https://doi.org/10.1007/s40279-015-0442-4
Sim, M., & Kim, J. U. (2010). Differences between experts and novices in kinematics and
accuracy of golf putting. Human Movement Science, 29, 932–946.
https://doi.org/10.1016/j.humov.2010.07.014
Shackel, B. (1967). Eye movement recording by electro-oculography. In P. H. Venables, & I.
Martin (Eds.), A manual of psychophysiological methods. Amsterdam, North-Holland:
Pub. Co.
Shannon, C. E. (1948). A mathematical theory of communication. The Bell System Technical
Journal, 27(3), 379-423.
Vasey, M. W., & Thayer, J. F. (1987). The continuing problem of false positives in repeated
measures ANOVA in psychophysiology: A multivariate solution. Psychophysiology,
24, 479–486. https://doi.org/10.1111/j.1469-8986.1987.tb00324.x
Vickers, J. N. (1992). Gaze control in putting. Perception, 21(1), 117-132.
https://doi.org/10.1068/p210117
Vickers, J. N. (1996). Visual control when aiming at a far target. Journal of Experimental
Psychology: Human Perception and Performance, 22(2), 342.
https://doi.org/10.1037/0096-1523.22.2.342
Vickers, J. N. (2007). Perception, cognition, and decision training: The quiet eye in action.
Champaign, IL: Human Kinetics.
Vine, S. J., Lee, D., Moore, L. J., & Wilson, M. R. (2013). Quiet eye and choking: Online
control breaks down at the point of performance failure. Medicine & Science in Sports
& Exercise, 45(10), 1988-1994. https://doi.org/10.1249/MSS.0b013e31829406c7
Vine, S. J., Moore, L. J., & Wilson, M. R. (2014). Quiet eye training: The acquisition,
refinement and resilient performance of targeting skills. European Journal of Sport
Science, 14(S1), S235-S242. https://doi.org/10.1080/17461391.2012.683815

123
Vine, S. J., Lee, D. H., Walters-Symons, R., & Wilson, M. R. (2015). An occlusion paradigm
to assess the importance of the timing of the quiet eye fixation. European Journal of
Sport Science, 17(1), 85-92.
http://www.tandfonline.com/doi/full/10.1080/17461391.2015.1073363
Walters-Symons, R., Wilson, M., Klostermann, A., & Vine, S. (2017). Examining the
response programming function of the Quiet Eye: Do tougher shots need a quieter
eye? Cognitive processing, 1-6. https://doi.org/10.1007/s10339-017-0841-6
Walters-Symons, R., Wilson, M., & Vine, S. (2017). The quiet eye supports error recovery in
golf putting. Psychology of Sport and Exercise, 31, 21-27.
https://doi.org/10.1016/j.psychsport.2017.03.012
Webb, R. A., & Obrist, P. A. (1970). The physiological concomitants of reaction time
performance as a function of preparatory interval and preparatory interval series.
Psychophysiology, 6(4), 389-403. https://doi.org/10.1111/j.1469-8986.1970.tb01749.x
Williams, A. M. (2016). Quiet eye vs. noisy brain: The eye like the brain is always active –
comment on Vickers. Current Issues in Sport Science, 1, 1-3.
https://doi.org/10.15203/CISS_2016.116
Wilson, M. R., Causer, J., & Vickers, J. N. (2015). Aiming for excellence. In J. Baker, & D.
Farrow (Eds.), Routledge handbook of sport expertise. New York, NY: Routledge.
Wilson, M. R., Wood, G. W., & Vine, S. J. (2016). Say it quietly, but we still do not know
how Quiet Eye training works – comment on Vickers. Current Issues in Sport
Science, 1, 1-3. https://doi.org/10.15203/CISS_2016.117
Wulf, G. (2013). Attentional focus and motor learning: A review of 15 years. International
Review of Sport and Exercise Psychology, 6, 77-104.
https://doi.org/10.1080/1750984X.2012.723728
Young, L. R., & Sheena, D. (1975). Survey of eye movement recording methods. Behavior

124
Research Methods, 7(5), 397-429. https://doi.org/10.3758/BF03201553

125
CHAPTER FIVE
The quiet eye effect: A test of the visual and postural-kinematic hypotheses
Abstract
The quiet eye effect describes the performance advantage associated with a long ocular
fixation on a critical target of an action, prior to and during movement execution. Researchers
have advocated a multi-measure approach to shed light on the mechanism(s) behind the
association between ocular activity and motor performance. In this study we used
psychophysiological methods to test whether the quiet eye period is associated with enhanced
visual processing (visual hypothesis) or longer movement durations (postural-kinematic
hypothesis). Thirty-two recreational golfers putted 20 balls to a 2-m distant target on a flat
surface. We examined quiet eye duration and time-varying eye quietness using
electrooculography, occipital alpha power as inverse neural marker of visual processing using
electroencephalography, and swing duration using kinematic sensors. Occipital alpha power
increased prior to and during swing execution, suggesting decreased visual processing
compared to baseline. Correlations revealed that, despite the overall decrease, visual
processing decreased less with a longer quiet eye and greater eye quietness. Importantly,
swing duration was strongly and positively correlated with both indices of ocular activity:
longer quiet eye and greater eye quietness were associated with longer swing duration. Our
findings support the postural-kinematic hypothesis, confirming that the duration of the quiet
eye is associated with a slow movement execution and question the role of visual processing
in the final moments of closed-loop aiming tasks. We anticipate major advancements in the
mechanistic understanding of the quiet eye effect as researchers adopt psychophysiological

126
methods to examine eye movements in combination with measures of other biological
systems.
Introduction
The way we move our eyes has been linked with the precision of movements requiring fine
motor control, such as those used in target sports. Research using eye-tracking technology
has revealed that, compared to novices, experts make fewer ocular fixations of longer
duration on action-related locations prior to and during the execution of a motor skill (Mann,
Williams, Ward, & Janelle 2007). The duration of the final ocular fixation on a critical target
of the action, labelled the quiet eye (Vickers, 1996), has attracted much interest from
researchers due to its ability to distinguish skilled from less skilled performers and successful
from unsuccessful performance (for reviews of studies see Lebeau et al., 2016; Mann,
Williams, Ward, & Janelle, 2007; Rienhoff, Tirp, Strauß, Baker, & Schorer, 2016; Vickers,
2007; Wilson, Causer, & Vickers, 2015). In the case of golf putting, the quiet eye period has
been defined as the duration of the final ocular fixation on the ball, with onset prior to the
initiation of the swing movement and offset when the gaze deviates from the ball, potentially
even after putter-ball impact (Vickers, 2007). Longer quiet eye durations have been reported
for experienced versus novice golfers (e.g., Walters-Symons, Wilson, & Vine, 2017) and for
holed versus missed putts in experienced golfers (e.g., Wilson & Pearcy, 2009).
Despite the compelling evidence endorsing the existence of the quiet eye effect,
researchers still debate how it might influence performance. In order to advance our
understanding and inform the design of training programs aimed at improving performance,
researchers have advocated the use of mechanistic and cross-disciplinary investigations to
test the validity of the various competing hypotheses (Causer, 2016; Williams, 2016; Wilson,

127
Wood, & Vine, 2016). A comprehensive review of the putative mechanisms goes beyond the
scope of the present work, and for a detailed account we refer the reader to a recent review by
Gonzalez et al. (2017a). In the present study, we evaluated two mechanistic hypotheses: the
visual hypothesis and the postural-kinematic hypothesis.
Visual hypothesis
Vision-action coupling constitutes a key element in the debate on quiet eye
mechanisms. Researchers have described the quiet eye as a perceptual-cognitive phenomenon
reflecting the selective processing of movement-related visual information through overt
attention (see Posner, 1980). For example, in their study of the quiet eye in billiards,
Williams et al. (2002) concluded that ‘To execute the shot, players must successfully
integrate visual information from the cue, cue ball, target ball, and pocket.’ The thesis that
visual processing plays a major role in the quiet eye was emphasized by Vickers (2012), who
referred to the dorsal cortical stream – which is a network of visual attention (Corbetta &
Shulman, 2002; Goodale & Milner, 1992) – to explain the putative mechanism underlying the
quiet eye effect. In short, processing of visual information has been the dominant mechanism
in this context, even for closed-loop aiming tasks with stationary targets, such as golf putting.
Indeed, in their study of the quiet eye in golf putting, Vine et al. (2015) concluded that ‘it
seems that visual information is being actively extracted and processed, likely to aid the
control of the putter head and to ensure good putter-ball contact.’ In the current study we
refer to this visual attention mechanism as the visual hypothesis.
Cognitive processes, including attention and perception, can be studied in an objective
and unobtrusive manner by recording individuals’ electroencephalogram (EEG) as they
perform goal-oriented actions. More specifically, the selective allocation of attentional
resources to processing of visual information can be assessed using the magnitude of cortical
oscillations (i.e., power) within the alpha frequency band (8-12 Hz) in the occipital regions of

128
the brain. Studies have established that increased occipital alpha power reflects decreased
visual processing (Romei, Gross, & Thut, 2010; Romei, Rihs, Brodbeck, & Thut, 2008;
Vanni, Revonsuo, & Hari, 1997). EEG methods have been successfully implemented in sport
research (for review of studies see Cooke, 2013; Hatfield, Haufler, Hung, & Spalding, 2004).
For example, EEG research has revealed that superior motor performance is associated neural
efficiency by alpha gating, which describes the allocation of attentional resources towards
movement-related and away from movement-unrelated information processing (e.g.,
Gallicchio, Finkenzeller, Sattlecker, Lindinger, & Hoedlmoser, 2016; Gallicchio, Cooke, &
Ring, 2017).
Given the extensive use of EEG in sport research it is surprising that, with one
exception, the association between quiet eye and visual processing, assessed using EEG, has
been largely neglected. The exception is the study by Janelle et al. (2000) that reported a
positive correlation between quiet eye duration and EEG occipital alpha power in
experienced marksmen. Contrary to the visual hypothesis, this finding suggests diminished
visual processing during the quiet eye period in a shooting task. Given that this critical piece
of evidence appears to have been overlooked within the quiet eye literature and, moreover,
that this finding has never been replicated, the association between occipital alpha power and
quiet eye duration warrants further investigation.
Postural-kinematic hypothesis
An alternative postural-kinematic hypothesis contends that the link between quiet eye
and performance is accounted for by a kinematic mechanism, whereby postural stability
(involving trunk, limbs, head, and eyes) before and during movement is associated with better
performance and longer quiet eye. In the case of golf putting, a slower and more stable swing
may be linked with (a) a cleaner putter-ball impact to optimize impact velocity and angle and
thereby ensuring greater putting accuracy, and (b) greater likelihood to keep the head and

129
eyes still and thereby resulting in delayed quiet eye offset and longer quiet eye. Each of these
two elements is considered next.
First, the association between swing kinematics/biomechanics (i.e., a slow and stable
movement) and superior putting performance is substantiated by research indicating that,
compared to less skilled counterparts, expert golfers sway less (i.e., exhibit less centre of
pressure variability) (e.g., Hurrion, 2009; McLaughlin, Best, & Carlson, 2008; Richardson,
Hughes, & Mitchell, 2012), generate less lateral putter head acceleration (i.e., they are less
likely to swing out of line) (e.g., Cooke et al., 2014; Sim & Kim, 2010), and putt more slowly
(e.g., Delay et al., 1997; Gallicchio, Cooke, & Ring, 2018).
Second, the association between putting kinematics/biomechanics and longer quiet
eye is relatively unexplored. For sake of clarity, this association can be examined separately
for stability and duration. The argument that greater movement stability is associated with
longer quiet eye is supported by the finding that novice golfers trained to increase their quiet
eye duration in a putting task also generated decreased lateral and vertical putter head
acceleration, compared to a control group (Moore, Vine, Cooke, Ring, & Wilson, 2012). The
argument that longer movement duration (i.e., slower swing) is associated with longer quiet
eye is supported by the findings that experts swung for longer than novices and that
movement duration was positively correlated with post-movement initiation quiet eye
duration (Gallicchio et al., 2018). In other words, because novices swung the putter quicker
than experts they had less reason to keep their head still and dwell on the impact location.
Conversely, novices had more reason to start to track the moving ball sooner (see online
supplementary material, Gallicchio et al., 2018), and, therefore, exhibited an earlier quiet eye
offset compared to experts. The current study aims to extend and replicate the study by
Gallicchio and colleagues by testing the movement duration element of the postural-
kinematic hypothesis both within and between participants.

130
The Present Study
In the present study we had two aims. Our first aim was to assess whether ocular
activity was associated with EEG occipital alpha power and thereby test a core tenet of the
visual hypothesis. Our second aim was to assess whether ocular activity was associated with
movement duration in order to test a core tenet of the postural-kinematic hypothesis. We used
EEG to examine brain activity implicated with visual processing (e.g., Janelle et al., 2000),
and movement sensors to examine the duration of the movement (e.g., Gallicchio et al.,
2018). We used electrooculography (EOG) to score the quiet eye period in different phases of
the movement (e.g., Gallicchio et al., 2018; Gonzalez et al., 2017b; Mann, Coombes,
Mousseau, & Janelle, 2011). We supplemented quiet eye information with the novel ‘eye
quietness’ index (Gallicchio et al., 2018), which, unlike quiet eye duration, measures the
extent to which the eyes are quiet (rather than dichotomizing eye movements into a state of
‘quiet’ or ‘non quiet’) with high temporal resolution.
Method
Participants
We tested 32 right-handed male relatively-inexperienced recreational golfers (age: M
= 20.09, SD = 2.04 years) with no formal golf handicap and occasional golf experience: they
reported to have played 12.06 times (SD = 12.96) in the 12 months preceding testing.
Participants were asked to refrain from alcohol, caffeine, and nicotine 3 hours prior to testing.
All provided signed consent to take part in the study and were compensated with £10 and
research credits. This study was approved by the local ethics committee.

131
Putting task
Participants putted golf balls (diameter 4.7 cm) to a 2-m distant target with a 91-cm
blade-style putter on a 5 × 1.5 m flat surface (Turftiles; Stimpmeter value: 2.27 m). The target
was a 6 mm diameter adhesive paper marker placed on the putting surface. Participants were
instructed to execute the putt at their own pace (i.e., no time pressure) with their goal to “get
the final position of the ball as close as possible to the target”. Prior to each putt participants
were required to stand in a relaxed position and maintain their gaze on a fixation cross placed
at eye level on the facing wall (c. 1.5 m away) for 4-5 s, until a 200-ms acoustic tone
prompted them to prepare for the putt. This acoustic tone was generated by a piezo buzzer
controlled by an Arduino Micro board (Arduino, Italy) interfaced with a computer running
MATLAB (MathWorks, USA).
Procedure
Upon arrival in the laboratory, participants were briefed and instrumented for
physiological recording. Then, participants performed 10 putts to a series of targets varying
in distance and extent to familiarize them with the putting surface. Finally, participants putted
20 balls to a straight 2-m distant target. The average time between consecutive putts was
22.82 s (SD = 2.45). After each putt the researcher took a photo of the putting area using a
ceiling-mounted camera and repositioned the ball for the next putt.
Physiological signals
Electrophysiological signals were recorded using an ActiveTwo system (BioSemi,
Netherlands). The EOG was recorded using four electrodes applied on the participant’s skin
near the eyes: two were placed at the outer canthi of each eye and the other two at the bottom
of each eye. The EEG was recorded through 32 electrodes applied on scalp sites Fp1, Fp2,
AF3, AF4, F7, F3, Fz, F4, F8, FC5, FC1, FC2, FC6, T7, C3, Cz, C4, T8, CP5, CP1, CP2,
CP6, P7, P3, Pz, P4, P8, PO3, PO4, O1, Oz, O2 (10-20 system, Jasper, 1958). Additional

132
electrodes were applied to the mastoids and to the chest (proximal lead-II ECG montage) for
offline denoising purposes (described below). The signal was amplified and digitized at 2048
Hz with 24-bit resolution and no filter was set during recording. All channels were recorded
in monopolar. Common mode sense and driven right leg electrodes were used to enhance the
common mode rejection ratio of the signal.
Digital triggers (transistor-transistor logic inputs) were sent via parallel
communication to the recording system in order to detect (a) the onset of the acoustic tone
(prompting the participant to prepare for the putt), (b) the initiation of the backswing, and (c)
the impact of the putter head with the ball. Participants were instructed to align the putter
head with an infrared digital switch (E18-D80NK) when ready to putt: this sensor sent a
digital trigger as the putter head moved away from the ball at the initiation of the backswing.
In addition, a piezo sensor (MiniSense 100) attached to the back of the putter head was used
to record putter-ball impact vibrations. This sensor was interfaced with the recording system
to synchronize information about the impact with the electrophysiological signals.
After recording, we performed the following pre-processing steps. Signals were
down-sampled to 512 Hz. For the analysis of the quiet eye, the electrodes positioned at the
canthi of each eye were re-referenced to each other to create a bipolar horizontal EOG
channel. Then we applied a 30 Hz low-pass filter (Finite Impulse Response, filter order =
2^8) according to EOG guidelines (Marmor et al., 2011). No high-pass filter was applied in
order to preserve flat sections of the signal, typical of ocular fixations (Acuña et al., 2014).
Epochs were segmented from -9 to +3 s (0 s = backswing initiation) and the voltages were
linearly detrended (i.e., the best straight-line fit was subtracted to each epoch signal). Finally,
a 125-ms median filter was applied to attenuate ocular overshoots while preserving sharp
vertical edges typical of ocular saccades (Bulling et al., 2011; Juhola, 1991). Figure 5.1

133
shows the horizontal EOG channel from selected trials for illustration. All single-trial
waveforms can be accessed from the Supplemental Material of Chapter Five (Appendix S1).
Figure 5.1. Voltage of the horizontal EOG channel as a function of time (0 s = backswing
initiation) for selected putts. Increases and decreases in signal amplitude indicate saccades to
the left and right, respectively, whereas a flat signal indicates absence of eye saccades (i.e.,
fixations). For each waveform, the grey line represents the original signal (low-pass filtered
at 30 Hz); the black line represents the same signal after median filtering; orange and blue
portions represent respectively QEpre and QEpost durations identified with the 60 µV
threshold; the red vertical line indicates putter-ball impact.

134
For the analyses of EEG activity and eye quietness we applied a 0.1-40 Hz band-pass
filter (Finite Impulse Response, filter order = 2^15). Two types of epochs were segmented
from -3.5 to +1.5 s relative to (a) the acoustic tone and (b) the initiation of the backswing.
Voltages were mean-centered within each epoch. Epochs were visually inspected and were
discarded from all subsequent analyses if they showed movement or electrical artefacts. The
mean number of backswing-centered epochs that were retained was 19.84 (SD = 0.37,
minimum = 19). The mean number of tone-centered epochs that were retained was 19.75 (SD
= 0.51, minimum = 18). Independent Component Analysis (Makeig et al., 1996) was
performed to attenuate any electrical artefacts due to ocular, cardiac, and muscular activity in
the EEG signal using the EOG and ECG channels. Finally, the EEG channels were average-
referenced.
Measures
Quiet eye. Quiet eye durations (ms) were calculated for two periods and were
obtained by further processing the horizontal EOG signal: QEpre defined as quiet eye onset to
backswing initiation, and QEpost defined as backswing initiation to quiet eye offset. Onset and
offset of the quiet eye were identified through a threshold algorithm. Specifically, voltages at
successive time points were compared with the voltage at the instant of the initiation of
backswing (i.e., time = 0 s). Quiet eye onset and offset were respectively defined as the
farthest time points preceding and following backswing initiation that did not exceed a
certain threshold (Gallicchio et al., 2018). We evaluated the quiet eye durations for 30
threshold options (ranging from 5 to 150 µV in 5 µV steps). We conducted exploratory
analyses using all these threshold settings (Figure 5.2); however, for our main analyses, we
chose a threshold of 60 µV, corresponding with eye movements of 3° of visual angle
(Shackel, 1967). This choice was informed by visual inspection revealing that, compared to
other thresholds (including 20 µV corresponding with 1° of visual angle), the 60 µV

135
threshold detected most accurately the duration of the final fixation, commencing with the
foot of the final square wave prior to backswing initiation (Figure 5.1). Moreover, 60 µV is
the same threshold deemed optimal in a previous study (Gallicchio et al., 2018). The
interested reader can inspect the single-trial quiet eye durations identified by the different
threshold options in the Supplemental Material of Chapter Five (Appendix S1).
Eye quietness. Eye quietness (%) was computed as the standard deviation of the
horizontal EOG channel (HEOG-SD) in eight non-overlapping 0.5 s intervals ranging from -3
to +1 s (0 s = backswing initiation) (Gallicchio et al., 2018). Each HEOG-SD value reflected
how much the eyes moved or were active in the horizontal plane: larger values indicated
more and larger eye movements (hence less eye quietness); conversely, smaller values
indicated fewer and smaller eye movements (hence greater eye quietness). Finally, HEOG-
SD was baseline-corrected to reflect the percentage change relative to average HEOG-SD in
the 2 s prior to the onset of the acoustic tone. This transformation was performed to minimize
variability between participants and, moreover, this procedure is implemented as standard in
the analysis of EEG signals (Pfurtscheller & Lopes da Silva, 1999).
Occipital alpha power. Time-frequency decomposition was performed through short-
time Fast Fourier Transform (FFT), conducted on eight non-overlapping 0.5 s windows
ranging from -3 to +1 s (0 s = backswing initiation), to match the windows used for the
analysis of eye quietness. Prior to FFT, each window was mean-averaged, multiplied by a
Hanning function to taper both ends, and then zero-padded to reach a length of 4 s, yielding a
frequency resolution of 0.25 Hz. The amplitude of the signal resulting from the FFT was
doubled for all positive frequencies and alpha power was computed as the squared amplitude
in the 8-12 Hz frequency range. Then, alpha power was baseline-corrected to reflect the
percentage change (Pfurtscheller & Lopes da Silva, 1999) relative to the average baseline
activity in the 2 s prior to the onset of the acoustic tone. Finally, occipital alpha power was

136
obtained by averaging values for the O1, Oz, and O2 channels to create an occipital region of
interest, consistent with previous research (e.g., Gallicchio et al. 2017).
Movement duration. The duration of the swing (ms) was measured as the time
between backswing initiation and putter-ball impact. These two events were detected through
a bespoke MATLAB script that combined data from the infrared switch and the piezo sensor.
Putting performance. Radial error (cm) was computed as the distance between the
target and the terminal position of the ball after each putt. Scoring was performed through a
bespoke MATLAB script that used the photos of the target area taken after each putt
(Gallicchio & Ring, 2018).
Statistical Analyses
We used two statistical strategies to examine the associations between ocular activity
(i.e., quiet eye and eye quietness) and (a) brain activity (i.e., occipital alpha power), (b)
movement duration, and (c) putting performance (i.e., radial error). Correlations were
computed using the Spearman’s rank test to examine non-linear associations. Spearman’s ρ
was used as the effect size, with values of .10, .30, and .50 reflecting small, medium, and
large effects, respectively (Cohen, 1992).
Our first strategy sought to capture the effects for each participant at the individual
trial level. We refer to this as trial-level analysis. This strategy involved two steps. First, we
correlated the two variables across all trials separately for each participant. Second, we
performed a one-sample t test on the Fisher-Z transformed correlation coefficients across all
participants (cf. Klostermann et al., 2014). For this analysis we report the group mean of the
back-transformed Spearman’s rho correlation coefficient (ρM) along with the t value and the
associated p value. Our second strategy sought to compare participants using the average
scores over all of their trials; this is the typical correlation analysis. We refer to this as
participant-level analysis. For this analysis we report the Spearman’s rho coefficient (ρ) and

137
the associated p value. The purpose of each analysis and our selection of the pairs of
measures is described next.
Quiet eye and eye quietness. We correlated quiet eye and eye quietness to cross-
validate these two indices of ocular activity. More specifically, we correlated QEpre with pre
backswing initiation HEOG-SD (i.e., in the six time intervals from -3 to 0 s) and QEpost with
post backswing initiation HEOG-SD (i.e., in the two time intervals from 0 to 1 s).
Correlates of occipital alpha power. We correlated ocular activity (i.e., quiet eye and
eye quietness) with brain activity (i.e., occipital alpha power) to test the visual hypothesis.
For the analyses involving the quiet eye, we correlated QEpre with pre backswing initiation
occipital alpha power (i.e., in the six time intervals from -3 to 0 s), and QEpost with post
backswing initiation occipital alpha power (i.e., in the two time intervals from 0 to 1 s). For
the analyses involving eye quietness, we correlated HEOG-SD and occipital alpha power in
each of the eight time intervals from -3 to +1 s. In addition, we evaluated the specificity of
any effect to the alpha band by conducting further analyses on activity in other EEG
frequencies. We examined non-alpha frequencies to evaluate the extent to which any effect
for the alpha band was unequivocally attributable to visual processing rather than indicating a
general electrophysiological phenomenon (e.g., elevated somatic activity).
Correlates of movement duration. We correlated ocular activity (i.e., quiet eye and
eye quietness) with movement duration to test the postural-kinematic hypothesis. Because it
was necessary to measure movement duration from the initiation of the backswing, we
correlated only the post-backswing initiation indices of ocular activity (i.e., QEpost and
HEOG-SD in the 2 intervals from 0 to +1 s).
Correlates of performance. We correlated ocular activity (i.e., QEpre, QEpost, and
HEOG-SD in each of the eight time intervals from -3 to 1 s) with radial error to explore
performance effects linked with gaze behaviour.

138
Results
Quiet eye and eye quietness
We computed the quiet eye for two intervals: before backswing initiation (QEpre) and
after backswing initiation (QEpost). The threshold algorithm at 60 µV identified the following
mean durations: QEpre 928 ms (SD = 501, range = 227 to 2623) and QEpost 819 ms (SD = 219,
range = 367 to 1213). The main analyses reported below were conducted using the 60 µV
threshold (see Measures section above for the rationale underlying this choice). Nonetheless,
there is a healthy debate among quiet eye researchers about the appropriate choice of this
threshold (i.e., visual angle), and therefore, we have displayed the influence of threshold
choice on quiet eye duration in Figure 5.2A, which shows that the higher the threshold the
longer the duration.
We analysed eye quietness (i.e., HEOG-SD) as a function of time (Figure 3). Smaller
values reflected less variability, hence greater quietness. Eye quietness was best described by
a cubic trend, F(1,31) = 16.84, p < .001, ηp2 = .352, whereby quietness decreased until -1 s,
increased until +0.5 s, and finally decreased after +0.5 s. It is worth mentioning that the
greatest quietness was evident between 0 and +0.5 s, that is, during the execution of the
swing.
To evaluate the utility of eye quietness as index of ocular activity we examined its
correlation with quiet eye durations. The outcomes of trial- and participant-level correlations
are reported in Table 5.1. Both types of analyses confirmed that greater eye quietness (i.e.,
smaller HEOG-SD) was associated with longer quiet eye durations before (i.e., in the time
intervals from -1.5 to 0 s) and after (i.e., in the time intervals from 0 to 1 s) backswing
initiation, with small to large effect sizes. It is noteworthy that this association held across
multiple thresholds (Figure 5.2B and 2C).

139
Table 5.1. Trial-level analyses (i.e., average Spearman’s ρ and t values) and participant-level
analyses (i.e., Spearman’s ρ) of the relation between quiet eye durations (QEpre and QEpost)
and eye quietness (HEOG-SD) in 8 0.5 time intervals from -3 to +1 s (0 s = backswing
initiation).
QEpre QEpost
Time ρM(18) t(31) ρ(30) ρM(18) t(31) ρ(30)
-3 to -2.5 s -.08 -1.86† -.00
-2.5 to -2 s .01 0.16 -.06
-2 to -1.5 s -.02 -0.29 -.26
-1.5 to -1 s -.12 -2.48* -.25
-1 to -0.5 s -.30 -5.85*** -.42*
-0.5 to 0 s -.31 -4.34*** -.42*
0 to +0.5 s -.09 -2.15* -.29
+0.5 to +1 s -.03 -0.71 -.40*
Note. Only relevant comparisons are reported: QEpre with pre during initiation HEOG-SD
(i.e., 6 intervals from -3 to 0 s) and QEpost with post during initiation HEOG-SD (i.e., 2
intervals from 0 to +1 s).
† < .10, * p < .05, ** p < .01, *** p < .001

140
Figure 5.2. Effect of threshold (5-150 µV) on quiet eye durations (s) in the ‘pre’ and ‘post’
phases (panel A). Trial-level (panel B) and participant-level (panel C) analyses exploring the
relation between quiet eye (s) and eye quietness (%), occipital alpha power (%), movement
duration (s), and radial error (cm), as a function of thresholds (µV).

141
Figure 5.3. Eye quietness (HEOG-SD) as percentage change from the baseline (i.e., cross-
trial average activity in the 2 s prior to the onset of the acoustic tone) as a function of time
(i.e., 0.5-s non-overlapping intervals from -3 to +1 s; 0 s = movement initiation). Smaller
values indicate less variability on the horizontal plane hence greater eye quietness. Error bars
indicate within-participant SE computed through normalization of the outcome factor
(Cousineau, 2005)

142
Correlates of occipital alpha power
Occipital alpha power averaged 157 µV2 (SD = 187, range = -59 to 693) in the 1 s
prior to backswing initiation and 125 µV2 (SD = 158, range = -55 to 535) in the 1 s following
backswing initiation, indicating an overall increase from the pre-cue period. The topography
of alpha power for the 32 EEG channels is presented in the Supplemental Material of Chapter
Five (Appendix S2).
Quiet eye. Quiet eye durations correlated negatively with occipital alpha power, with
small to large effect sizes (Table 5.2). More specifically, trial-level analyses revealed that
longer QEpre was associated with decreased occipital alpha power from -2 to -1.5 s prior to
backswing initiation. Longer QEpost was associated with decreased occipital alpha power in
the 1 s following backswing initiation (i.e., approximately during swing execution).
Participant-level correlations revealed that participants who showed larger decreases in
occipital alpha power from -3 to -2.5 s and in the 1 s prior to backswing initiation were those
with longer QEpre.
Eye quietness. HEOG-SD was positively correlated with occipital alpha power, with
small to large effect sizes (Table 5.2). More specifically, trial-level correlations revealed that
greater eye quietness (i.e., smaller HEOG-SD) was associated with a decrease in occipital
alpha power in the 2.5 s prior to backswing initiation. Participant-level correlations confirmed
the same pattern for the 1 s following backswing initiation: participants with greater eye
quietness were those with the largest decrease in occipital alpha power.
Alpha specificity. The exploration of other (i.e., non-alpha band) frequencies revealed
that the association between occipital activity and ocular activity (i.e., quiet eye and eye
quietness) was part of a more general phenomenon that was not specific to alpha band
activity (Figure 5.4).

143
Table 5.2. Correlations between ocular activity (QEpre, QEpost, and HEOG-SD) and occipital
alpha power in 8 0.5 time intervals from -3 to +1 s (0 s = backswing initiation). Spearman’s ρ
is reported for the participant-level correlations. Average ρ and t values are reported for the
within-participant correlations.
QEpre QEpost HEOG-SD
Time ρM(18) t(31) ρ(30) ρM(18) t(31) ρ(30) ρM(18) t(31) ρ(30)
-3 to -2.5 s .00 0.02 -.37* 0.04 0.76 .04
-2.5 to -2 s .04 0.84 -.27 0.11 2.61* .09
-2 to -1.5 s -.09 -2.24* -.28 0.13 3.04** .21
-1.5 to -1 s -.03 -0.82 -.29 0.12 2.47* .07
-1 to -0.5 s -.08 -1.58 -.44* 0.12 2.37* .32†
-0.5 to 0 s -.09 -1.54 -.51** 0.09 1.67 .47**
0 to +0.5 s -.14 -3.38** -.10 0.05 1.04 .36*
+0.5 to +1 s -.08 -2.21* -.28 0.08 1.84 .42*
Note. Only relevant comparisons are reported: QEpre with pre during initiation occipital alpha
power (i.e., 6 intervals from -3 to 0 s) and QEpost with post during initiation occipital alpha
power (i.e., 2 intervals from 0 to +1 s).
† < .10, * p < .05, ** p < .01, *** p < .001

144
Figure 5.4. Trial-level (panel A) and participant-level (panel B) analyses exploring the
relation between EEG power (%) in the 1 s preceding (-1 to 0 s) and following (0 to +1 s)
backswing initiation and either quiet eye (s) or eye quietness (%), as a function of frequency
(Hz).

145
Correlates of movement duration
Movement duration averaged 719 ms (SD = 174, range = 427 to 1057). Correlations
examined the relation between movement duration and ocular activity (i.e., quiet eye and eye
quietness) to test the postural-kinematic hypothesis. Only the indices measured after
backswing initiation were used in these analyses (i.e., QEpost and HEOG-SD in the two
intervals from 0 to 1 s).
Quiet eye. Quiet eye duration was positively associated with movement duration, with
medium to large effect sizes. The trial-level analysis revealed that movement duration was
positively correlated with QEpost, ρM(18) = .32, t(31) = 4.19, p < .001. Participant-level
analysis confirmed this association, revealing that participants who executed the swing more
slowly were those with longer QEpost, ρ(30) = .53, p = .002.
Eye quietness. Eye quietness was inversely associated with movement duration, with
small to medium effect sizes, and only for certain time intervals. More specifically, trial-level
analyses yielded a negative correlation between movement duration and HEOG-SD in the
interval from 0.5 to 1 s, ρM(18) = -.18, t(31) = -3.40, p = .002, but not from 0 to 0.5 s, ρM(18)
= -.01, t(31) = -0.18, p = .86. Participant-level analyses confirmed the same general pattern,
albeit these were not statistically significant: participants with longer movement durations
tended to show greater eye quietness (i.e., smaller HEOG-SD) from 0.5 to 1 s, ρ(30) = -.27, p
= .15, but not from 0 to 0.5 s, ρ(30) = .01, p = .92.
Correlates of performance
Putting performance was assessed as radial error (M = 22.64 cm, SD = 5.47, range =
9.93 - 35.05). Trial- and participant-level correlations examined the relation between radial
error and ocular activity (i.e., quiet eye and eye quietness). These results are described below.
Quiet eye. Trial-level analyses revealed that radial error was not significantly
correlated with QEpre, ρM(18) = -.02, t(31) = -0.40, p = .69, and QEpost, ρM(18) = -.03, t(31) =

146
-0.84, p = .41. Participant-level analyses also revealed non-significant correlations between
radial error and QEpre, ρ(30) = .12, p = .51, and between radial error and QEpost, ρ(30) = -.12,
p = .53. Additional exploratory analyses conducted with less stringent thresholds for scoring
the quiet eye duration revealed a negative and statistically significant relation between radial
error and QEpost duration (see Figure 5.2B), providing some evidence that longer QEpost was
associated with superior putting performance.
Eye quietness. No relation emerged between radial error and eye quietness (i.e.,
HEOG-SD) from -3 to + 1 s at the trial level, ρMs(18) = .00 to .06, ts(31) = -0.12 to 1.37, ps
= .18 to 97, or at the participant level, ρs(30) = -.07 to .09, ps = .62 to .89.
Discussion
The goal of this study was to shed light on two of the putative mechanisms behind the
quiet eye phenomenon. We tested the links between ocular activity and visual processing
(visual hypothesis) and between ocular activity and movement kinematics (postural-
kinematic hypothesis). Our findings provided support for the postural-kinematic hypothesis
and only limited support for the visual hypothesis. Although we did not make explicit
predictions regarding path (i.e., mediation) analyses we noted that, in our sample of
recreational golfers, gaze measures were not reliably associated with putting performance.
The implications of our findings are discussed below.
Quiet eye and eye quietness
Quiet eye was scored for separate movement phases: QEpre before movement
initiation and QEpost after movement initiation. A threshold of 60 µV – corresponding to
approximately 3° of visual angle (Shackel, 1967) – yielded a total quiet eye duration of 1747
ms. Quiet eye durations associated with multiple thresholds and different phases of

147
movement are illustrated in Figure 5.2A. As expected, larger thresholds yielded longer quiet
eye durations, in line with that reported in a previous multiple-threshold EOG study
(Gallicchio et al., 2018). Moreover, these values for the quiet eye components are consistent
with those obtained using camera-based eye tracking in a similar population (e.g., Walters-
Symons, Wilson, & Vine, 2017).
Eye quietness was scored as the standard deviation of the horizontal EOG signal
(HEOG-SD) as a function of time relative to the initiation of movement. A trend analysis
revealed a cubic pattern consisting of three phases: first, increased ocular activity 1 to 2 s
prior to movement initiation; second, decreased ocular activity (i.e., increased eye quietness)
during movement execution; and third, increased ocular activity. It is possible that the
increased ocular activity in the first and third phases is attributable to saccades directed
towards the target prior to swing initiation and to the ball and target following swing
execution, to confirm the target location and monitor the rolling ball towards the target
location, respectively. Importantly, the increased eye quietness around movement execution
should reflect the quiet eye period. This interpretation is supported by the finding that eye
quietness was strongly associated with quiet eye durations around movement initiation. The
link between quiet eye and eye quietness was robust because (a) both trial- and participant-
level analyses yielded medium to large effect sizes (Table 5.1), (b) the effect emerged for
multiple quiet eye thresholds (Figure 5.2), and (c) it replicated previous findings (Gallicchio
et al., 2018).
Visual hypothesis
EEG occipital alpha power was measured as percentage change from a pre-putt
baseline during which participants fixated their gaze on a cross at eye level. The finding that
this change score was positive indicates an increase from baseline, which can be interpreted
as a withdrawal of processing resources away from visual processing (Romei et al., 2008,

148
2010; Vanni et al., 1997). In other words, the participants performed less visual processing in
the moments just before, during, and just after putting the ball. In line with Janelle et al.
(2000), this key finding undermines the visual hypothesis.
The co-examination of EEG and EOG revealed that occipital alpha power correlated
negatively with quiet eye durations (QEpre and QEpost) and positively with eye quietness
(HEOG-SD). The size of these effects ranged from small to large (Table 5.2) and emerged for
different quiet eye thresholds (Figure 5.2). These results could be interpreted as suggesting
that, despite the overall decrease in visual processing, it decreased less for longer quiet eye
durations and greater eye quietness, providing some limited support for the visual hypothesis.
Importantly, however, the fact that these effects were not restricted to time intervals
overlapping the quiet eye period (Table 5.2) and were not specific to the alpha frequency
band (Figure 5.4) raises doubts on the plausibility of this interpretation. Accordingly, any
interpretation of the relationship between EEG occipital alpha power and ocular activity in
terms of visual processing should be treated with caution: at the moment we cannot rule out a
more parsimonious electrophysiological interpretation whereby postural-kinematic
quiescence influenced EEG recordings across a broad spectrum of brain waves that includes
alpha. Furthermore, exploratory correlation analyses of the alpha-eye movement relationship
across multiple EEG channels suggests that non-occipital areas are also implicated with
longer quiet eye and greater eye quietness (see Appendix S2 in the Supplemental Material of
Chapter Five). Indeed, additional analyses conducted on this dataset, reported in Gallicchio
and Ring (2018), revealed that processing resources were gated towards the sensorimotor
regions, presumably reflecting increased attention to and processing of proprioceptive
afference to aid postural stability.
Postural-kinematic hypothesis
Both measures of ocular activity (quiet eye and eye quietness) were robustly

149
associated with movement duration. First, post-movement initiation quiet eye (i.e., QEpost)
correlated positively with movement duration. This association emerged for both trial- and
participant-level analyses with large effect sizes and for multiple quiet eye thresholds (Figure
5.2). Second, eye quietness correlated negatively with movement duration. Interestingly, this
association emerged only for the time interval that included the conclusion of movement
execution (i.e., from +0.5 to +1 s after movement initiation) and, therefore, it indicates that a
slower swing was associated with greater and longer-lasting eye quietness. These results
replicate previous findings (Gallicchio et al., 2018) and provide additional support for the
postural-kinematic hypothesis, which maintains that longer and greater ocular quietness after
movement initiation is associated with a longer movement in closed-loop aiming tasks.
In line with the predictions of the postural-kinematic hypothesis, these analyses
focused exclusively on the post-movement initiation component of gaze behaviour. It is
noteworthy that the relatively few studies that have examined the separate contribution of
pre- and post-movement initiation quiet eye in golf putting have all attributed a greater
importance to the latter (Causer et al., 2017; Gallicchio et al., 2018; Klostermann et al., 2014;
Vine, Lee, Moore, & Wilson, 2013; Vine, Lee, Walters-Symons, & Wilson, 2015). These
findings imply that many other previously reported quiet eye effect findings may be at least
partly attributable to differences in the kinematics of the movement: a longer post-movement
initiation quiet eye could be due to a longer and smoother movement execution.
Correlates of performance
Our primary analyses were designed to test the visual and postural-kinematic
hypotheses by focusing exclusively on the neurophysiological and kinematic correlates of the
quiet eye and eye quietness (i.e., irrespective of performance). Nonetheless, incorporating
performance data into the picture is a useful exercise for our mechanistic understanding of the
quiet eye.

150
Gaze behaviour (quiet eye and eye quietness) was not reliably associated with putting
performance. A recent meta-analysis of studies reporting within-participant associations
between quiet eye duration and performance did not uncover any studies involving relatively
inexperienced participants (Lebeau et al., 2016). The conspicuous absence of findings –
positive, negative, and null – suggests a “file drawer” reporting bias, where null findings
among non-experts have not been reported by authors. Accordingly, our null finding appears
to be compatible with this hidden literature. It is also worth noting that the exploratory
analyses involving less stringent quiet eye thresholds (c. 6 degrees of visual angle) revealed a
positive association between quiet eye duration and performance: putts with longer post-
movement initiation quiet eye duration were associated with lower radial error (Figure 5.2).
Importantly, the null finding for gaze behaviour and performance does not undermine our
findings concerning the visual and postural-kinematic hypotheses. Separate analyses
conducted on the current dataset (see Gallicchio & Ring, 2018) revealed that putting
performance was better for participants who exhibited elevated EEG occipital alpha power,
suggesting that diminished visual processing is conducive to superior performance. This
finding is consistent with Loze, Collins, and Homes (2001) who reported that best pistol-
shooting accuracy was accompanied by elevated EEG occipital alpha power compared to
worst performance, indicating withdrawal of resources from visual processing. Finally,
additional analyses conducted on the current dataset revealed that changes in swing duration
did not correspond with changes in performance3. However, it is worth mentioning that a
previous investigation (Gallicchio et al., 2018) reported longer swing times for experts than
novices. In sum, it is clear that future studies are needed to examine the extent to which the
3 Movement duration was not significantly associated with radial error as revealed by trial-
level analyses, ρM(18) = -.03, t(31) = -0.86, p = .40 and participant-level analyses, ρ(30) = -.05, p =
.80.

151
effect of gaze behaviour on performance is mediated by visual processing and swing
duration.
Limitations
The present findings need to be considered in light of some potential study
limitations. First, our results on quiet eye duration might be biased by the fact that, differently
from camera-based eye tracking, EOG does not provide spatial information on the gaze
location. Despite observing that participants kept their head above the ball during the swing
we cannot confirm whether their gaze was on the expected focus point (i.e., the ball) or on
locations near this point (e.g., the putter head) during the quiet eye period. The uncertainty of
gaze location is aggravated by the fact that the equivalence of 20 µV on the horizontal EOG
signal with 1° of visual angle is more a guideline rather than an exact mathematical law
(Shackel, 1967). With this in mind, we recommend that researchers co-record EOG with
camera-based eye tracking to determine which processing parameters (e.g., EOG threshold)
provide the most accurate measures of quiet eye.
Second, we could not co-examine horizontal and vertical eye movements because
EOG recordings were not calibrated to visual stimuli placed at known distances. While we
concede that the horizontal signal is more meaningful than the vertical signal in a putting task
(which is performed in the frontal plane) we recommend that future studies pay greater
attention to this technical point. To address this limitation, future studies should consider
calibrating the EOG signal (e.g., Gonzalez et al., 2017b) to achieve a better voltage-to-visual
angle mapping.
Third, our analyses could not determine whether the association between quiet eye
and activity in the visual regions of the brain was due to fixation on the critical focus location
(i.e., the ball) or just a general ocular quiescence. To answer this question, future research
should examine EEG occipital alpha power while individuals are instructed to fixate the

152
critical focus location or an irrelevant spot nearby this location (cf. Williams, 2016).
Connected to this point, future research should consider recording the EEG from a larger set
of electrodes to discern activity from primary and secondary visual regions of the brain. This
point arises from the acknowledgement of an alternative interpretation of our findings: the
increase in EEG occipital alpha power may reflect diminished processing of task-irrelevant
visual information, hence a sharpened visual focus on task-relevant visual information (i.e.,
the ball in golf putting).
Fourth, this study does not provide a comprehensive test of the postural-kinematic
hypothesis. Future studies interested in this mechanism should assess movement smoothness
and postural stability by recording, respectively, multi-axis movement acceleration (e.g.,
Cooke et al., 2014; Moore et al., 2012) and body sway (e.g., Hurrion, 2009) in relation with
quiet eye duration.
Finally, by focusing on the association between ocular activity and visual processing /
movement kinematics, this study tested only one path of the mediation model described by
the visual and postural-kinematic hypotheses: we did not examine the mediatory role of
visual processing or movement kinematics on the relation between quiet eye and
performance. With the basic understanding accrued so far, future research is now well-
equipped to address causality in the proposed mechanisms by employing experimental
manipulations and mediation analyses.
Conclusion
Our study demonstrates the utility of adopting psychophysiological methods in quiet
eye research. We anticipate valuable developments in the mechanistic understanding of this
phenomenon as quiet eye researchers incorporate this methodology to study eye movements
together with the activity of multiple other biological systems. Furthermore, the use of EOG
opens new avenues for novel training programmes based on real-time eye quietness

153
biofeedback. Our findings imply that the quiet eye may be indicative of a quiet body (cf.
Obrist, Webb, & Sutterer, 1969) and question the role played by visual attention before and
during movement execution in golf putting. It is entirely plausible that attention to visual
information plays an important role at an earlier stage of movement planning – the so-called
“green reading” in golf – where individuals make perceptual judgments on spatial features of
the target scene (e.g., distance, slope) to calibrate movement parameters, such as force and
direction (Carey, Jackson, Fairweather, Causer, & Williams, 2017). It is likely that
individuals internalize these parameters into an action plan and maintain it in working
memory before and during movement execution. Obviously, these ideas need to be addressed
by future research. Finally, we foresee that a multi-method approach, such as the one that we
advocate, will allow research teams to confirm the mechanism(s) underlying the quiet eye
phenomenon as we approach the end of the third decade since its discovery.

154
References
Acuña, O. V., Aqueveque, P., & Pino, E. J. (2014, August). Eye-tracking capabilities of low-
cost EOG system. In Engineering in Medicine and Biology Society (EMBC), 2014
36th Annual International Conference of the IEEE (pp. 610-613). IEEE.
https://doi.org/10.1109/EMBC.2014.6943665
Andersen, R. A., & Buneo, C. A. (2002). Intentional maps in posterior parietal cortex. Annual
Review of Neuroscience, 25, 189–220.
http://dx.doi.org/10.1146/annurev.neuro.25.112701.142922
Bulling, A., Ward, J. A., Gellersen, H., & Troster, G. (2011). Eye movement analysis for
activity recognition using electrooculography. IEEE transactions on pattern analysis
and machine intelligence, 33(4), 741-753. https://doi.org/10.1109/TPAMI.2010.86
Carey, L. M., Jackson, R. C., Fairweather, M. M., Causer, J., & Williams, A. M. (2017).
Perceptual-cognitive expertise in golf putting. In M. Toms (Eds.), Routledge
International Handbook of Golf Science (pp. 173–182).
Causer, J. (2016). The future of quiet eye research—Comment on Vickers. Current Issues in
Sport Science, 1, 1–4. https://doi.org/10.15203/CISS_2016.103
Causer, J., Hayes, S. J., Hooper, J. M., & Bennett, S. J. (2017). Quiet eye facilitates
sensorimotor preprograming and online control of precision aiming in golf putting.
Cognitive processing, 18(1), 47-54. http://doi.org/10.1007/s10339-016-0783-4
Cohen, J. (1992). A power primer. Psychological Bulletin, 112, 155–159.
http://dx.doi.org/10.1037/0033-2909.112.1.155
Cooke, A. (2013). Readying the head and steadying the heart: A review of cortical and
cardiac studies of preparation for action in sport. International Review of Sport and
Exercise Psychology, 6, 122–138. https://doi.org/10.1080/1750984X.2012.724438

155
Cooke, A., Kavussanu, M., Gallicchio, G., Willoughby, A., McIntyre, D., & Ring, C. (2014).
Preparation for action: Psychophysiological activity preceding a motor skill as a
function of expertise, performance outcome, and psychological pressure.
Psychophysiology, 51(4), 374–384. https://doi.org/10.1111/psyp.12182
Cousineau, D. (2005). Confidence intervals in within-subject designs: A simpler solution to
Loftus and Masson’s method. Tutorials in Quantitative Methods for Psychology, 1,
42–45. https://doi.org/10.20982/tqmp.01.1.p042
Gallicchio, G., Cooke, A., & Ring, C. (2017). Practice makes efficient: Cortical alpha
oscillations are associated with improved golf putting performance. Sport, Exercise &
Performance Psychology, 6(1), 89–102. https://doi.org/10.1037/spy0000077
Gallicchio, G., Cooke, A., & Ring, C. (2018). Assessing ocular activity during performance
of motor skills using electrooculography. Psychophysiology, 55(7), 1-12.
https://doi.org/10.1111/psyp.13070
Gallicchio, G., & Ring, C. (2018). Don’t look, don’t think, just do it! Towards an
understanding of alpha gating in a discrete aiming task. Manuscript submitted for
publication.
Gonzalez, C. C., Causer, J., Miall, R. C., Grey, M. J., Humphreys, G., & Williams, A. M.
(2017a). Identifying the causal mechanisms of the quiet eye. European Journal of
Sport Science, 17(1), 74–84. https://doi.org/10.1080/17461391.2015.1075595
Gonzalez, C. C., Causer, J., Grey, M. J., Humphreys, G. W., Miall, R. C., & Williams, A. M.
(2017b). Exploring the quiet eye in archery using field-and laboratory-based tasks.
Experimental brain research, 235(9), 2843-2855.
https://dx.doi.org/10.1007%2Fs00221-017-4988-2

156
Hatfield, B. D. (2018). Brain dynamics and motor behavior: A case for efficiency and
refinement for superior performance. Kinesiology Review, 7(1), 42-50.
https://doi.org/10.1123/kr.2017-0056
Hatfield, B. D., Haufler, A. J., Hung, T. M., & Spalding, T. W. (2004).
Electroencephalographic studies of skilled psychomotor performance. Journal of
Clinical Neurophysiology, 21, 144–156. http://dx.doi.org/10.1097/00004691-
200405000-00003
Hatfield, B. D., & Hillman, C. H. (2001). The psychophysiology of sport: A mechanistic
understanding of the psychology of superior performance. In R. N. Singer, H. A.
Hausenblas, & C. M. Janelle (Eds.), Handbook of sport psychology (2nd ed., pp. 362–
386). New York, NY: Wiley.
Janelle, C. M., Hillman, C. H., Apparies, R. J., Murray, N. P., Meili, L., Fallon, E. A., &
Hatfield, B. D. (2000). Expertise differences in cortical activation and gaze behavior
during rifle shooting. Journal of Sport and Exercise Psychology, 22(2), 167-182.
https://doi.org/10.1123/jsep.22.2.167
Jasper, H. H. (1958). The ten-twenty electrode system of the International Federation.
Electroencephalography and Clinical Neurophysiology, 17, 37–46.
Juhola, M. (1991). Median filtering is appropriate to signals of saccadic eye movements.
Computers in biology and medicine, 21(1-2), 43-49. https://doi.org/10.1016/0010-
4825(91)90034-7
Klostermann, A., Kredel, R., & Hossner, E. J. (2014). On the interaction of attentional focus
and gaze: the quiet eye inhibits focus-related performance decrements. Journal of
Sport and Exercise Psychology, 36(4), 392-400. https://doi.org/10.1123/jsep.2013-
0273

157
Lebeau, J. C., Liu, S., Sáenz-Moncaleano, C., Sanduvete-Chaves, S.,Chacón-Moscoso, S.,
Becker, B. J., & Tenenbaum, G. (2016). Quiet eye and performance in sport: A meta-
analysis. Journal of Sport and Exercise Psychology, 38(5), 441–457.
https://doi.org/10.1123/jsep.2015-0123
Mann, D. T., Coombes, S. A., Mousseau, M. B., & Janelle, C. M. (2011). Quiet eye and the
Bereitschaftspotential: Visuomotor mechanisms of expert motor performance.
Cognitive Processing, 12(3), 223–234. https://doi.org/10.1007/s10339-011-0398-8
Mann, D. T., Williams, A. M., Ward, P., & Janelle, C. M. (2007). Perceptual-cognitive
expertise in sport: A meta-analysis. Journal of Sport and Exercise Psychology, 29(4),
457–478. https://doi.org/10.1123/jsep.29.4.457
Makeig, S., Bell, A. J., Jung, T. P., & Sejnowski, T. J. (1996). Independent component
analysis of electroencephalographic data. In D. Touretzky, M. Mozer, & M. Hasselmo
(Eds.), Advances in neural information processing systems (Vol. 8, pp. 145–151).
Cambridge, MA: MIT Press.
Marmor, M. F., Brigell, M. G., McCulloch, D. L., Westall, C. A., Bach, M., & International
Society for Clinical Electrophysiology of Vision. (2011). ISCEV standard for clinical
electrooculography (2010 update). Documenta Ophthalmologica, 122(1), 1–7.
https://doi.org/10.1007/s10633-011-9259-0
Moore, L. J., Vine, S. J., Cooke, A., Ring, C., & Wilson, M. R. (2012). Quiet eye training
expedites motor learning and aids performance under heightened anxiety: The roles of
response programming and external attention. Psychophysiology, 49(7), 1005-1015.
https://doi.org/10.1111/j.1469-8986.2012.01379.x
Obrist, P. A., Webb, R. A., & Sutterer, J. R. (1969). Heart rate and somatic changes during
aversive conditioning and a simple reaction time task. Psychophysiology, 5(6), 696-
723. http://psycnet.apa.org/doi/10.1111/j.1469-8986.1969.tb02872.x

158
Pfurtscheller, G., & Da Silva, F. L. (1999). Event-related EEG/MEG synchronization and
desynchronization: basic principles. Clinical neurophysiology, 110(11), 1842-1857.
https://doi.org/10.1016/S1388-2457(99)00141-8
Rienhoff, R., Tirp, J., Strauß, B., Baker, J., & Schorer, J. (2016). The ‘quiet eye’ and motor
performance: A systematic review based on Newell’s constraints-led model. Sports
Medicine, 46(4), 589–603. https://doi.org/10.1007/s40279-015-0442-4
Romei, V., Gross, J., & Thut, G. (2010). On the role of prestimulus alpha rhythms over
occipito-parietal areas in visual input regulation: correlation or causation? Journal of
Neuroscience, 30(25), 8692-8697. https://doi.org/10.1523/JNEUROSCI.0160-
10.2010
Romei, V., Rihs, T., Brodbeck, V., & Thut, G. (2008). Resting electroencephalogram alpha-
power over posterior sites indexes baseline visual cortex excitability. Neuroreport,
19(2), 203-208. https://doi.org/10.1097/WNR.0b013e3282f454c4
Shackel, B. (1967). Eye movement recording by electro-oculography. In P. H. Venables, & I.
Martin (Eds.), A manual of psychophysiological methods. Amsterdam, Netherlands:
North-Holland.
Vanni, S., Revonsuo, A., & Hari, R. (1997). Modulation of the parieto-occipital alpha rhythm
during object detection. Journal of Neuroscience, 17(18), 7141-7147.
https://doi.org/10.1523/JNEUROSCI.17-18-07141.1997
Vickers, J. N. (1996). Visual control when aiming at a far target. Journal of Experimental
Psychology: Human Perception and Performance, 22(2), 342–354.
https://doi.org/10.1037/0096-1523.22.2.342
Vickers, J. N. (2007). Perception, cognition, and decision training: The quiet eye in action.
Champaign, IL: Human Kinetics.

159
Vickers, J. N. (2012). Neuroscience of the quiet eye in golf putting. International Journal of
Golf Science, 1(1), 2-9. https://doi.org/10.1123/ijgs.1.1.2
Vine, S. J., Lee, D., Moore, L. J., & Wilson, M. R. (2013). Quiet eye and choking: Online
control breaks down at the point of performance failure. Medicine & Science in Sports
& Exercise, 45(10), 1988–1994. https://doi.org/10.1249/MSS.0b013e31829406c7
Vine, S. J., Lee, D. H., Walters-Symons, R., & Wilson, M. R. (2015). An occlusion paradigm
to assess the importance of the timing of the quiet eye fixation. European Journal of
Sport Science, 17(1), 85–92.
http://www.tandfonline.com/doi/full/10.1080/17461391.2015.1073363
Vine, S. J., Moore, L. J., & Wilson, M. R. (2011). Quiet eye training facilitates competitive
putting performance in elite golfers. Frontiers in Psychology, 2, 1–9.
https://doi.org/10.3389/fpsyg.2011.00008
Walters-Symons, R. M., Wilson, M. R., & Vine, S. J. (2017). The quiet eye supports error
recovery in golf putting. Psychology of Sport and Exercise, 31, 21-27.
https://doi.org/10.1016/j.psychsport.2017.03.012
Williams, A. M. (2016). Quiet eye vs. noisy brain: The eye like the brain is always active—
Comment on Vickers. Current Issues in Sport Science, 1, 1–3.
https://doi.org/10.15203/CISS_2016.116
Wilson, M. R., Causer, J., & Vickers, J. N. (2015). Aiming for excellence. In J. Baker, & D.
Farrow (Eds.), Routledge handbook of sport expertise. New York, NY: Routledge.
Wilson, M. R., Cooke, A. M., Vine, S. J., Moore, L. J., & Ring, C. M. (2012). Quiet eye,
quiet head, quiet hand, or quiet heart: The four horsemen of human motor
performance? Journal of Sport & Exercise Psychology, 34, 37-38.

160
Wilson, M. R., & Pearcy, R. C. (2009). Visuomotor control of straight and breaking golf
putts. Perceptual and Motor Skills, 109(2), 555-562.
https://doi.org/10.2466%2Fpms.109.2.555-562
Wilson, M. R., Wood, G. W., & Vine, S. J. (2016). Say it quietly, but we still do not know
how quiet eye training works—Comment on Vickers. Current Issues in Sport Science,
1, 1–3. https://doi.org/10.15203/CISS_2016.117

161
CHAPTER SIX
General Discussion
The aim of my thesis was to increase our understanding of the biological correlates of
superior motor performance by providing an integrated account of the models of neural
efficiency (Hatfield & Hillman, 2001) and quiet eye (Vickers, 2007). For this purpose, I
conducted a series of four empirical studies adopting a multi-measure, psychophysiological
approach to analyse brain activity – through electroencephalography (EEG) – and eye
movements – through electrooculography (EOG) – in golf putting. In this final chapter I
provide an integrated summary of the findings of these studies. Then, I propose a model of
superior motor performance that reconciles the thus-far divergent predictions of the neural
efficiency and quiet eye models. In the next section I highlight some limitations of this model
and suggest directions for future research within this framework. Finally, I describe some
practical implications for athletes.
Summary of Findings
The overarching aim of study one (described in Chapter Two and in Gallicchio, Cooke, &
Ring, 2017) and study two (described in Chapter Three and in Gallicchio & Ring, 2018a) was
to evaluate the utility of an extension of the model of neural efficiency (Hatfield & Hillman,
2001) incorporating the gating-by-inhibition framework of alpha oscillations (Jensen &
Mazaheri, 2010). This framework was deemed useful to reconcile the apparently conflicting
findings associating superior motor performance to elevated alpha power (i.e., decreased

162
activity) in some regions and diminished alpha power (i.e., increased activity) in other
regions (for a review of studies see Cooke, 2013; Hatfield, Haufler, Hung, & Spalding, 2004).
Topographical EEG analyses revealed a focal pattern whereby alpha power was
lowest in the central regions, intermediate in the temporal regions, and greatest in the
occipital regions. This pattern emerged in both study one and study two. Study two also
indicated that this pattern varied as a function of time relative to movement onset and that,
therefore, it reflected a phasic process specific to the movement preparation and execution
rather than a general tonic process. In line with the gating model (Jensen & Mazaheri, 2010),
the focal distribution of alpha indicated that, in preparation for and during movement
execution, cortical resources were diverted away from the occipital and temporal regions and
directed towards the central regions. Because the central regions are involved with
sensorimotor processing whereas the occipital and temporal regions are involved with non-
motor cognitive processing (Bears, Connors, & Paradiso, 2007), the movement-related alpha
gating pattern most likely reflects the temporary shift of cognitive resources, including
attentional focus, towards movement-related processing.
Importantly, the movement-related alpha gating pattern appeared to be functionally
related to performance. Specifically, study one revealed that larger performance
improvements following practice of the golf putting task over the course of several days were
partly attributable to increased inhibition and functional isolation of the left and, to a lesser
extent, right temporal regions. Study two revealed that better performance accuracy was
preceded by greater inhibition of the occipital region. Taken together, these findings suggest
that, provided that cognitive resources are gated towards sensorimotor processes, additional
inhibition of movement-unrelated activity (i.e., in the temporal and occipital regions) is more
beneficial than additional enhancement of movement-related activity (i.e., in the central
regions).

163
The behavioural relevance of the movement-related alpha gating was further
highlined by the finding that an experimentally induced disturbance to the gating resulted in
the impairment of performance. Namely, the findings of study two indicated that when
performing under conditions of high variability (e.g., by having the position of the target of
the action vary randomly at each repetition) the task was perceived as more difficult,
performance deteriorated, and alpha gating was disrupted. This disruption was marked by
weakened inhibition of the left and, to a lesser extent, right temporal regions. In other words,
non-motor processes based in the temporal regions are likely to have interfered with the
optimal execution of the movement.
It is noteworthy to point out that the findings of study one and study two attributed
greater importance to the inhibition of the temporal regions rather than the occipital regions.
As suggested in study one, the fact that these effects were not evident in the occipital region
is most likely because inhibition was already the strongest in the occipital region out of the
brain regions examined. Notably, the finding that the activity in the occipital region – which
is directly involved with visual processing – was detrimental for performance in an aiming
task, even though replicating previous findings (e.g., Loze, Collins, & Holmes, 2001) was
puzzling and warranted further investigation. Accordingly, study three (described in Chapter
Four and in Gallicchio, Cooke, & Ring, 2018) was designed to pioneer the co-analysis of
alpha gating and vision. More specifically, the aim of this study was to validate EOG tools to
examine ocular activity during the execution of a motor skill. The methodological
innovations of this study consisted in the development of a measure to examine time-varying
eye quietness and a procedure to score the quiet eye period by employing multiple thresholds.
The main theoretical contribution of this study was the specification of the kinematic
hypothesis, contending that expert-novice differences in post-movement initiation quiet eye

164
duration are associated with differences in movement kinematics, such as movement duration
and smoothness.
Finally, by integrating the methodological tools and the theoretical framework
developed in the preceding empirical studies, study four (described in Chapter Five and in
Gallicchio & Ring, 2018b) assessed the mechanistic roles of both visual processing and
movement kinematics in the quiet eye phenomenon. The findings of this study provided
additional support for the kinematic hypothesis by revealing that intra-individual differences
as well as inter-individual differences in post-movement initiation quiet eye were related to
the duration of movement execution. Importantly, this study revealed that visual processing
does not play an important role during the final stages of movement preparation. This
evidence underpinned my interpretation of the quiet eye as manifestation of psychomotor
quiescence whereby a quieter eye reflects greater efficiency. In the next section, I discuss
these ideas in more detail and introduce a revised integrated model of neural efficiency and
quiet eye.
Neural Efficiency and Quiet Eye Revisited
The overarching aim of this thesis was to extend our understanding of the biological
correlates of superior motor performance by overcoming some theoretical drawbacks in the
neural efficiency (Hatfield & Hillman, 2001) and quiet eye (Vickers, 2007) models with
regards to their external validity and generalizability. In this section I propose an integrated
neural efficiency-quiet eye model of performance. This model consists of two core ideas:
neural efficiency as gating and quiet eye as efficiency.

165
Neural Efficiency as Gating
Since its first introduction in the human movement science literature, the model of
psychomotor efficiency became very influential as it was able to explain a broad range of
effects involving various biological systems (Hatfield & Hillman, 2001). A subcomponent of
this model that regarded brain activity – the neural efficiency model – contended that superior
motor performance was accompanied by diminished overall neural effort due to the
attenuation of task-unrelated processes (Hatfield & Hillman, 2001). Despite the initial
success of the neural efficiency model (for reviews of study findings interpreted within the
neural efficiency model see Hatfield et al., 2004 and Hatfield & Kerick, 2007), it soon
struggled with contradictory and incompatible findings that associated motor expertise and
improved performance with elevated – rather than decreased – neural effort (e.g., Babiloni et
al., 2008; Cooke et al., 2014).
In order to accommodate these seemingly contradictory pieces of evidence, a revised
neural efficiency model would need to incorporate the concept that superior performance
requires optimal activity in some task-related cortical regions while insulating this activity
from other task-unrelated processes. In this context, the gating-by-inhibition model of alpha
oscillations (Jensen & Mazaheri, 2010) provides a suitable framework for the analysis of
diverging patterns of alpha power across multiple regions of the cerebral cortex. According to
this gating model, cortical resources are channelled away from regions exhibiting elevated
alpha activity and conveyed towards regions exhibiting diminished alpha activity. The
research described in this thesis demonstrated the utility of the concept of neural efficiency as
gating. Within this framework, efficiency is no longer defined as overall decreased activity
but as a differential pattern of cortical activity whereby some activity is inhibited while other
activity is enhanced.

166
The model of neural efficiency as gating is defined by two concepts: regional
distribution and intensity. First, the regional distribution of the alpha gating indicates which
regions are active and which regions are inhibited. By comparing the actual regional
distribution with the theoretical regional distribution – based on a priori knowledge of
neuroanatomy and neuropsychological networks – this regional distribution can reveal the
extent to which cortical activity is routed towards task-related processes. For example,
performing a motor task should elicit activity in the sensorimotor cortex, involved with
cognitive processes associated with motor control and kinaesthetic sensation (Bears et al,
2007). Moreover, depending on the nature of the motor task (e.g., closed-loop or open-loop
motor task), activation of non-sensorimotor regions may reflect task-irrelevant processing
which may interfere with the optimal execution of the movement. Accordingly, a gate that is
localized exclusively in the sensorimotor regions should reflect the efficient distribution of
resources towards task-related sensorimotor processes while resourced towards other task-
unrelated cognitive processes are minimized.
Second, the intensity of the alpha gating should reflect the strength by which task-
related processes are insulated from the cognitive interference of other task-unrelated
processes that are detrimental to task performance. In other words, a more intense gate should
reflect the stronger inhibition of task-irrelevant processes, whereas a weaker gate may
indicate allocation of mental resources towards task-irrelevant processes. In the case of a
closed-loop motor task, it is plausible that a strong inhibition of non-sensorimotor processes
can lay the neurophysiological foundations for optimal movement execution. In summary, a
strong and spatially-localized alpha gating may reflect neural efficiency as a mental state
characterized by a sharp and exclusive attentional focus on mental processes that matter for
the successful execution of the task at hand.

167
Quiet Eye as Efficiency
Because the main function of the eyes is to extract visual information from the
environment, it seems logical to conceive that the association between quiet eye and superior
motor performance reflects some form of enhanced visual processing (Vickers, 2012). As a
matter of fact, there is an almost unanimous consensus among quiet eye researchers (e.g.,
Vine et al., 2015; Williams et al., 2002) on the importance of vision. However, the finding
that superior performance is associated with longer – rather than shorter – quiet eye durations
seems to defy the widely-accepted principle of efficiency whereby superior motor
performance is characterized by faster and more specific mental processes (Mann, Wright, &
Janelle, 2016). Moreover, the association of expertise with long quiet eye duration contradicts
the findings of the broader, non-motor literature (e.g., reading) that expertise corresponds
with shorter ocular fixations (Foulsham, 2016).
A working solution to the efficiency paradox has been proposed by Klostermann,
Kredel, and Hossner (2014) who suggested that the quiet eye period reflects the time spent on
inhibiting non-optimal task solutions. This inhibition mechanism is based on the notion that
experts have a larger movement repertoire than novices and, therefore, they require more
time in order to inhibit competing movement variants and select one of the many possible
options. While this inhibition hypothesis is certainly a solution to the efficiency paradox, it is
not clear how this mechanism would differ if the gaze was on an irrelevant spot or not steady:
would the inhibition of competing movement options be altered by a steady gaze away from
the visual target of the action or by movement of the eyes? This point clearly warrants further
investigation. Moreover, the inhibition mechanism does not take into account the different
phases of the movement. This distinction appears important in light of recent evidence that
most quiet eye effects are localized to the post-movement initiation component of the quiet

168
eye period (e.g., Vine, Lee, Walters-Symons, & Wilson, 2015), that is when presumably
motor preparation processes are completed and a movement option has already been selected.
The discussion on psychomotor efficiency as pruning of task-unrelated processes
(Hatfield & Hillman, 2001) together with the realization (study four, described in Chapter
Five) that visual processing may play little-to-no role during the final stages of movement
preparation and execution of a closed-loop motor skill encouraged a re-examination and
radical reinterpretation of the quiet eye phenomenon. The findings of the empirical research
described in this thesis allowed me to reconsider the role played by visual processing in the
performance of a closed-loop motor task and conceive a model of quiet eye as efficiency.
This model stems out of the following hypothetical scenario: how would the eyes
move if vision did not play a key role for performance in a closed-loop motor task? This
possibility cannot be ruled out until there is solid empirical evidence supporting the role of
vision during the quiet eye period. Crucially, based on the concept of psychomotor efficiency,
the answer to this question is that, if vision was irrelevant, the brain would allocate fewer
resources to visual processing and the eyes would remain still, for as long as vision was not
needed. Thereby, the inhibition of vision would produce a longer quiet eye. According to the
model of quiet eye as efficiency, during the quiet eye period, the eyes go quiet not to process
more but to process less: eye movements decrease because there is no need to acquire visual
information (Loze et al., 2001). This concept implies that it does not matter where the gaze is
directed, as long as the eyes are still and provide a stable visual reference for the smooth
execution of the movement (Konttinen, Landers, & Lyytinen, 2000).
According to this idea, the quiet eye can be interpreted as a manifestation of a general
postural-kinematic stability and somatic quiescence (cf. Obrist, Webb, & Sutterer, 1969).
Namely, a prolonged period of eye quietness – especially during the execution of the
movement – confers performance advantages through its association with a smooth and

169
steady execution of a movement, which have been linked to better motor performance (e.g.,
Cooke et al., 2014; Hurrion, 2009; McLaughlin et al., Best, & Carlson, 2008; Richardson,
Hughes, & Mitchell, 2012) as contended by the kinematic hypothesis (Gallicchio et al., 2018;
Gallicchio & Ring, 2018b). In contrast, unnecessary eye movements may interfere with the
fine control of movement execution as well as with the optimal allocation of cortical
resources towards sensorimotor processes. Accordingly, the suppression of eye movements
should reduce any such interference.
An Integrated Account of Neural Efficiency and Quiet Eye
I propose that conceiving ocular activity as being integrated – and not isolated – within a
biological system where multiple processes are orchestrated towards one goal, allows us to
resolve the apparent discrepancy between the neural efficiency and quiet eye models of
superior motor performance. The neural efficiency-quiet eye model argues that, in order to
move optimally, the sensorimotor processes necessary to execute a movement need to be
shielded from activity that is unnecessary for (or even detrimental to) performance. In light of
the evidence accrued in this thesis, it makes sense to conceive that, during the final stages of
movement preparation, the integrated mind-body system – comprising brain, ocular, as well
as other biological activity – operates as one to actualise a pre-planned motor programme.
Limitations and Future Directions
Conceiving neural efficiency as gating and quiet eye as efficiency opens exciting new
possibilities for researchers and athletes alike. However, for the sake of scientific progress, it
is important to acknowledge some potential limitations of the current work. First, the ‘neural
efficiency as gating’ model contends that superior performance arises from the optimal
activation of task-related processes that are insulated from unnecessary processes. This

170
concept may appear rather simplistic because it does not answer the question of how to
identify which processes are necessary and which are detrimental to performance for each
motor skill. One way to discern task-relevant and task-irrelevant processes is by using a
theoretical model informed on the psychological, physiological, and behavioural evidence
described within the human movement science literature. Another way entails empirically
testing the link between successful performance and psychobiological activity. Such
empirical tests are especially important to study the generalizability of the neural efficiency-
quiet eye model to motor skills that were not examined in this thesis. For example, it is likely
that open-loop motor skills (e.g., interceptive actions) elicit a less-focused alpha gating
during movement execution that enables the system to process visual information and adapt
to a changing and unpredictable environment. Future research should address this question by
applying research methods similar to those used in this thesis to other types of motor skills.
Second, the link between psychophysiological states and cognitive activity during
performance of motor tasks is still underdeveloped. Admittedly, this thesis adds little to this
knowledge because the empirical studies described in the previous chapters did not
manipulate selectively a specific cognitive function. For example, there is a large body of
literature assuming a link between activity of the left temporal region of the cortex and verbal
interference during motor execution. However, this link has yet to be empirically proven.
Future research could manipulate self-talk during action preparation and execution to shed
light on the neurophysiological correlates of verbal processing.
Third, the methods developed and applied in this thesis to extract information from
the EEG and EOG on psychophysiological processes related to motor performance are far
from being definitive and may represent a departure from conventions in the literature.
Accordingly, it is desirable that researchers improve these methods. For example, an exciting
research goal for future research would be to combine psychophysiological techniques with

171
camera-based eye-tracking methods to measure brain and ocular activity with greater
accuracy than currently possible.
Fourth, considering the quiet eye as a manifestation of psychomotor quiescence
implies that ocular stillness is functional to performance, at least in part, via a process of
postural-kinematic stabilization. From this concept it can be deduced that, because vision is
not important, the precise spatial location where the eyes rest does not matter. Future research
should test this idea for example by instructing individuals to rest their eyes on irrelevant
locations or to close their eyes during movement execution (Williams, 2016).
Fifth, this thesis demonstrated the utility of mediation analysis for mechanistic
understanding of the neural efficiency phenomenon. The quiet eye literature is rich in
descriptive reports but still lacking of mechanistic work. Scientists interested in the causal
mechanisms behind the quiet eye-performance effect could employ mediation analyses in
combination with experimental manipulations (e.g., of postural-kinematic parameters) to
provide a more compelling test of the many competing hypotheses proposed to date.
Finally, the most interesting challenge for future research is to attempt to integrate not
just brain and ocular activity but other biological systems, including autonomic and somatic
activity. The evidence gathered so far allows us to appreciate that brain, eyes, heart, and
muscles operate as one to prepare the body for action (Wilson, Cooke, Vine, Moore, & Ring,
2012). However, the terms of this interaction across biological systems are still unknown and
future research addressing this issue promises to be highly valuable to expand our conceptual
understanding of fine motor control and learning.

172
Practical Implications for Athletes
The model of neural efficiency-quiet eye proposes that motor execution is assisted by a
psychophysiological state consisting in the activation of movement-related processes (i.e.,
motor control and kinaesthetic sensation) along with the attenuation of task-irrelevant
processes (e.g., visual and verbal processing). There is a number of practical ways to
implement this framework to train athletes to be more efficient and perform better. One such
way is through biofeedback. Namely, athletes could be trained to self-regulate their biological
activity (e.g., brain and ocular activity) in a way that is beneficial to motor performance (cf.
Cooke, Bellomo, Gallicchio, & Ring, 2018). A fascinating idea would be to train athletes to
maintain an optimal level of psychomotor efficiency during conditions that challenge
postural-kinematic stability, psychomotor quiescence, and the integrity of the alpha gating,
such as during elevated psychological pressure or physical load.
Another way to apply the knowledge accrued in this thesis is to borrow some
elements of inoculation training from cognitive-behavioural therapy, commonly used for the
management of stress and anxiety (Meichenbaum & Deffenbacher, 1988). More specifically,
athletes could be encouraged to practice under conditions of elevated cognitive load, for
example, through increased practice variability (as shown in Chapter Three). By practicing
under conditions of gradually increasing cognitive challenge, athletes may develop and
strengthen their coping strategies to focus on the relevant information for performance (e.g.,
postural-kinematic stability) while concomitantly ignoring information that is potentially
detrimental for performance (e.g., vision). As a result of continued practice, athletes should
become more resilient to cognitive interference.
Finally, the nascent association of psychophysiology with computational methods
such as machine learning (Yarkoni & Westfall, 2017) will allow researchers to build

173
individual models of performance allowing athletes to receive personalised training protocols
to help optimize their learning and performance.
General Conclusion
The main contribution of my thesis was to introduce a novel perspective into a field of
science that, following initial enthusiasm and progress, became dormant on issues of
theoretical relevance for the mechanistic understanding of how we control, learn, master, and
disrupt the control of actions. The knowledge described in my thesis is far from being
definitive, however, it can help lay the foundations for future interdisciplinary work. By
permitting the objective, unobtrusive, and simultaneous measurements of multiple biological
systems along with their association with different mental states, it is likely that
psychophysiology will play a leading role in forging the next scientific breakthroughs in this
context.
References
Babiloni, C., Del Percio, C., Iacoboni, M., Infarinato, F., Lizio, R., Marzano, N., ... & Eusebi,
F. (2008). Golf putt outcomes are predicted by sensorimotor cerebral EEG rhythms.
The Journal of physiology, 586(1), 131-139.
http://dx.doi.org/10.1113/jphysiol.2007.141630
Bear, M. F., & Connors, B. W., & Paradiso, M. A. (2007). Neuroscience: exploring the brain.
Hagerstwon, MD: Lippincott Williams & Wilkins.

174
Cooke, A. (2013). Readying the head and steadying the heart: A review of cortical and
cardiac studies of preparation for action in sport. International Review of Sport and
Exercise Psychology, 6, 122–138. https://doi.org/10.1080/1750984X.2012.724438
Cooke, A., Bellomo, E., Gallicchio, G., & Ring, C. (2018). Neurofeedback in sport. In R. A.
Carlstedt (Ed.), Handbook of Sport Neuroscience and Psychophysiology. Psychology
Press.
Cooke, A., Kavussanu, M., Gallicchio, G., Willoughby, A., McIntyre, D., & Ring, C. (2014).
Preparation for action: Psychophysiological activity preceding a motor skill as a
function of expertise, performance outcome, and psychological pressure.
Psychophysiology, 51(4), 374–384. https://doi.org/10.1111/psyp.12182
Foulsham, T. (2016). Functions of a quiet and un-quiet eye in natural tasks – comment on
Vickers. Current Issues in Sport Science, 1, 106.
https://doi.org/10.15203/CISS_2016.106
Gallicchio, G., Cooke, A., & Ring, C. (2017). Practice makes efficient: Cortical alpha
oscillations are associated with improved golf putting performance. Sport, Exercise &
Performance Psychology, 6(1), 89-102. https://dx.doi.org/10.1037%2Fspy0000077
Gallicchio, G., Cooke, A., & Ring, C. (2018). Assessing ocular activity during performance
of motor skills using electrooculography. Psychophysiology, 55(7), e13070.
https://doi.org/10.1111/psyp.13070
Gallicchio, G., & Ring, C. (2018a). Don’t look, don’t think, just do it! Towards an
understanding of alpha gating in a discrete aiming task. Psychophysiology. e13298.
https://doi.org/10.1111/psyp.13298
Gallicchio, G., & Ring, C. (2018b). The quiet eye effect: A test of the visual and postural-
kinematic hypotheses. Manuscript submitted for publication.

175
Hatfield, B. D., Haufler, A. J., Hung, T. M., & Spalding, T. W. (2004).
Electroencephalographic studies of skilled psychomotor performance. Journal of
Clinical Neurophysiology, 21, 144-156. http://dx.doi.org/10.1097/00004691-
200405000-00003
Hatfield, B. D., & Hillman, C. H. (2001). The psychophysiology of sport: A mechanistic
understanding of the psychology of superior performance. In R. N. Singer, H. A.
Hausenblas, & C. M. Janelle (Eds.), Handbook of sport psychology (2nd ed., pp. 362-
386). New York: Wiley.
Hatfield, B. D., & Kerick, S. E. (2007). The psychology of superior sport performance: A
cognitive and affective neuroscience perspective. In G. Tenenbaum & R.C. Eklund
(Eds.), Handbook of sport psychology (3rd ed., pp. 84–109). New York, NY: John
Wiley & Sons, Inc.
Hurrion, P. (2009). A biomechanical investigation into weight distribution and kinematic
parameters during the putting stroke. International Journal of Sports Science & Coaching, 4,
89-102. https://doi.org/10.1260/174795409789577489
Jensen, O., & Mazaheri, A. (2010). Shaping functional architecture by oscillatory alpha
activity: gating by inhibition. Frontiers in Human Neuroscience, 4, 1-8.
http://dx.doi.org/10.3389/fnhum.2010.00186
Klostermann, A., Kredel, R., & Hossner, E. J. (2014). On the interaction of attentional focus
and gaze: the quiet eye inhibits focus-related performance decrements. Journal of
Sport and Exercise Psychology, 36(4), 392-400. https://doi.org/10.1123/jsep.2013-
0273
Konttinen, N., Landers, D. M., & Lyytinen, H. (2000). Aiming routines and their
electrocortical concomitants among competitive rifle shooters. Scandinavian journal

176
of medicine & science in sports, 10(3), 169-177. https://doi.org/10.1034/j.1600-
0838.2000.010003169.x
Loze, G. M., Collins, D., & Holmes, P. S. (2001). Pre-shot EEG alpha-power reactivity
during expert air-pistol shooting: a comparison of best and worst shots. Journal of
sports sciences, 19(9), 727-733. https://doi.org/10.1080/02640410152475856
Mann, D. T., Wright, A., & Janelle, C. M. (2016). Quiet eye: The efficiency paradox –
comment on Vickers. Current Issues in Sport Science, 1, 1-4.
https://doi.org/10.15203/CISS_2016.111
McLaughlin, P., Best, R., & Carlson, J. (2008). Movement of the centre of pressure (COP) in
the putting stroke. In D. Crews & R. Lutz (Eds.) Science and golf V: Proceedings of
the World Scientific Congress of Golf (pp. 239-244). Meza, AZ: Energy in Motion.
Meichenbaum, D. H., & Deffenbacher, J. L. (1988). Stress inoculation training. The
Counseling Psychologist, 16(1), 69-90. https://doi.org/10.1177/0011000088161005
Obrist, P. A., Webb, R. A., & Sutterer, J. R. (1969). Heart rate and somatic changes during
aversive conditioning and a simple reaction time task. Psychophysiology, 5(6), 696-
723. http://psycnet.apa.org/doi/10.1111/j.1469-8986.1969.tb02872.x
Richardson, A. K., Hughes, G., & Mitchell, A. C. S. (2012). Center of pressure excursion
during the golf putting stroke in low, mid and high handicap golfers. International
Journal of Golf Science, 1(2), 127-139. https://doi.org/10.1123/ijgs.1.2.127
Vickers, J. N. (2007). Perception, cognition, and decision training: The quiet eye in action.
Champaign, IL: Human Kinetics.
Vickers, J. N. (2012). Neuroscience of the quiet eye in golf putting. International Journal of
Golf Science, 1(1), 2-9. https://doi.org/10.1123/ijgs.1.1.2
Vine, S. J., Lee, D. H., Walters-Symons, R., & Wilson, M. R. (2015). An occlusion paradigm
to assess the importance of the timing of the quiet eye fixation. European Journal of
177
Sport Science, 17(1), 85–92.
http://www.tandfonline.com/doi/full/10.1080/17461391.2015.1073363
Williams, A. M. (2016). Quiet eye vs. noisy brain: The eye like the brain is always active—
Comment on Vickers. Current Issues in Sport Science, 1, 1–3.
https://doi.org/10.15203/CISS_2016.116
Williams, A. M., Singer, R. N., & Frehlich, S. G. (2002). Quiet eye duration, expertise, and
task complexity in near and far aiming tasks. Journal of Motor Behavior, 34(2), 197-
207. https://doi.org/10.1080/00222890209601941
Wilson, M. R., Cooke, A. M., Vine, S. J., Moore, L. J., & Ring, C. M. (2012). Quiet eye,
quiet head, quiet hand, or quiet heart: The four horsemen of human motor
performance? Journal of Sport & Exercise Psychology, 34, 37-38.
Yarkoni, T., & Westfall, J. (2017). Choosing prediction over explanation in psychology:
Lessons from machine learning. Perspectives on Psychological Science, 12(6), 1100-
1122. https://doi.org/10.1177%2F1745691617693393

178
SUPPLEMENTAL MATERIAL
The Supplemental Material of each chapter is available at the following links:
Chapter Two
http://supp.apa.org/psycarticles/supplemental/spy0000077/spy0000077_supp.html
Chapter Three
https://onlinelibrary.wiley.com/doi/full/10.1111/psyp.13298
Chapter Four
https://onlinelibrary.wiley.com/doi/full/10.1111/psyp.13070
Chapter Five
https://www.dropbox.com/sh/stmjcg3eou9swgs/AACtSNYWTRYdbmUwAyq-12nBa?dl=0