motor sequence learning: a study with positron emission … · 2003-09-12 · new sequences and the...
TRANSCRIPT

The Journal of Neuroscience, June 1994, 14(6): 37753790
Motor Sequence Learning: A Study with Positron Emission Tomography
I. H. Jenkins,‘,* D. J. Brooks,’ P. D. Nixon,* R. S. J. Frackowiak,’ and Ft. E. Passingham’s*
‘MRC Cyclotron Unit, Hammersmith Hospital, London, United Kingdom and 2Department of Experimental Psychology, University of Oxford, Oxford, United Kingdom
We have used positron emission tomography to study the functional anatomy of motor sequence learning. Subjects learned sequences of keypresses by trial and error using auditory feedback. They were scanned with eyes closed under three conditions: at rest, while performing a sequence that was practiced before scanning until overlearned, and while learning new sequences at the same rate of perfor- mance. Compared with rest, both sequence tasks activated the contralateral sensorimotor cortex to the same extent. Comparing new learning with performance of the prelearned sequence, differences in activation were identified in other areas. (1) Prefrontal cortex was only activated during new sequence learning. (2) Lateral premotor cortex was signifi- cantly more activated during new learning, whereas the sup- plementary motor area was more activated during perfor- mance of the prelearned sequence. (3) Activation of parietal association cortex was present during both motor tasks, but was significantly greater during new learning. (4) The pu- tamen was equally activated by both conditions. (5) The cerebellum was activated by both conditions, but the acti- vation was more extensive and greater in degree during new learning. There was an extensive decrease in the activity of prestriate cortex, inferotemporal cortex, and the hippocam- pus in both active conditions, when compared with rest. These decreases were significantly greater during new learning. We draw three main conclusions. (1) The cerebellum is in- volved in the process by which motor tasks become auto- matic, whereas the putamen is equally activated by se- quence learning and retrieval, and may play a similar role in both. (2) When subjects learn new sequences of motor ac- tions, prefrontal cortex is activated. This may reflect the need to generate new responses. (3) Reduced activity of areas concerned with visual processing, particularly during new learning, suggests that selective attention may involve depressing the activity of cells in modalities that are not engaged by the task.
[Key words: PET, motor learning, cerebellum, basal gan- glia, prefrontal cortex, premotor areas]
Received June I, 1993; revised Oct. 4, 1993; accepted Dec. 16, 1993.
We are grateful to the Unit’s radiographers, Ms. Andreanna Williams and Mr. Graham Lewington, for their help with scanning. I.H.J. is supported by the Well- come Trust.
Correspondence should be addressed to Dr. I. H. Jenkins, MRC Cyclotron Unit, Hammersmith Hospital, DuCane Road, London W 12 OHS, UK.
Copyright 0 1994 Society for Neuroscience 0270-6474/94/143775-16$05.00/O
A skilled typist can type accurately from a text while holding a conversation (Shaffer, 1975). The task of copy typing has be- come automatic; this means that the person can attend to an- other task at the same time. Psychologists use “dual-task” per- formance as a way of assessing the degree to which a task has become automatic.
Positron emission tomography (PET) scanning provides the ideal tool for measuring the changes in brain activity that occur when a task becomes automatic, because scans can be performed at different times during learning. The tracer C50, can be used to map the changes in regional cerebral blood flow (rCBF) that accompany changes in neuronal activity (Greenberg et al., 1979). The field of view of the PET scanner makes it possible to ex- amine functionally related areas that may have a wide anatom- ical distribution.
Several groups have used PET to study the acquisition of motor skills. Seitz et al. (1990) scanned subjects while they executed a complex sequence of oppositions of finger to thumb; the subjects were scanned after varying degrees of practice so as to improve their motor skill. These authors found a retraction of activation in parietal association cortex during this process, but aspects of motor performance, including the rate at which the movements were performed, changed with practice; this makes interpretation of the results difficult. Despite this, Seitz et al. (1990) argued that, since there was no apparent change in cerebellar activation as learning progressed, this represented a reduction in activation with improving skill. They reasoned that one would otherwise have expected greater cerebellar activation as performance became faster.
In our own laboratory, Friston et al. (1992) required subjects to oppose the thumb to the fingers in turn, and they paced the task with a metronome to control the rate of performance. The authors identified an attenuation of activation in the cerebellum as the subjects became more practiced.
There are two limitations of this study. First, because no measures of performance were taken, subtle changes in the am- plitude of the movements could be overlooked. Second, the PET camera had a field of view limited to 10.5 cm; only the upper part of the cerebe\\um could be scanned if the supplementary motor area was also to be imaged.
We therefore designed a study in which both the rate and amplitude of subjects’ movements were controlled. The subjects learned sequences of keypresses, and both the timing of their responses and errors in the sequence were measured. We scanned two groups of subjects using the same paradigm. The subjects in one group were positioned low in the scanner and the subjects in the other group high; thus, we were able to image the entire cerebral volume, including the whole of the cerebellum.

3776 Jenkins et al. * Motor Learning and PET
We measured rCBF during the process of acquiring new motor sequences, and also while subjects performed a motor sequence they had practiced before scanning until they could perform it automatically. The subjects pressed the keys in the same way in the two conditions. The difference is that in the one case they were learning which keys to press, and in the other case they had overlearned the correct sequence of movements.
quency during the rest condition to control for auditory input during the experiment.
All scans were performed with the subjects lying supine with their eyes closed in a darkened room. Head position was maintained by use of individually made thermally molded foam head rests, and a Perspex chin support was used to minimize head movement during scanning.
Task performance was monitored by the Amiga computer, which recorded the number of responses made, the number of incorrect key- presses in the sequence, and the number of omissions (where the subject failed to depress a key within 3 set after a prompt tone). The response times (reaction time plus movement time) for individual movements were also recorded so that these could be compared during the NEW and PRE conditions.
Materials and Methods Subjects. We studied 12 normal male volunteers, with a mean age of 32.5 years (range, 21-46 years). All were right-handed as measured by the Edinburgh Inventory (Oldfield, 1971). Written consent for each study was obtained after the procedures had been fully explained. Ap- proval for these experiments was given by the Ethics Committee of the Royal Postgraduate Medical School, Hammersmith Hospital. Permis- sion to administer radioactive CsO, was given by the Administration of Radioactive Substances Advisory Committee of the Department of Health, UK.
Experimental design. Using the tracer Ct50,, six PET measurements of regional cerebral blood flow (rCBF) were made sequentially in each subject. These six scans were performed under three different experi- mental conditions, each one occurring twice. The baseline condition was rest (REST). One active condition (NEW) involved learning a new sequence of keypresses, eight moves long; the subjects performed on a keypad with four keys using the fingers of the right hand. This keypad was linked to an Amiga 2000 computer, which controlled the task. The other condition (PRE) involved performing a sequence learned ap- proximately 90 min before scanning. This sequence had been learned originally in the same way as the new sequences were learned during scanning. The sequences were the same for all subjects.
The sequences were learned in the following way. A pacing tone sounded every 3 sec. The subjects learned by trial and error. When they heard the pacing tone they pressed a key. If they correctly identified the first keypress in the sequence, they were rewarded by a high-pitched tone and then tried to identify the next press in the sequence at the next pacing tone. If they were wrong they heard a low-pitched tone, and they tried another key at the next prompt tone by depressing a different finger. The end of the sequence was signified by three short high-pitched tones. The subjects then returned to the beginning, and continued to perform the task in the same fashion.
The tones used for prompts and feedback were generated by the Amiga computer and were sufficiently different to be easily distinguished by all subjects.
Before scanning all subjects learned a standard sequence (PRE) until they could perform it without any errors. After a rest period of 2 min, subjects rehearsed this same sequence under the same conditions for repeated trials of 3.5 min followed by further rest periods until 10 such trials were completed. During the last trial, subjects were additionally given serial digit span tasks to perform to assess the automaticity of the motor task, strings of digits were presented at the rate of one every second and subjects required to repeat them immediately and in the same order. Two further trials of the sequence were performed imme- diately prior to scanning, while subjects were lying on the scanner couch, in order to ensure that they were able to perform it in this context.
In the NEW condition, the subjects learned new sequences, the se- quences being the same for all subjects. They attempted to learn the new sequences by the same process that they had used to learn the first one. Since all conditions were performed twice by each subject, different sequences were presented in each of the two NEW scans. A further safeguard was introduced in case some subjects were able to perform this sequence without errors before the end of the scan; we were con- cerned that the sequence should not become overlearned. If a subject learned one of the new sequences a further sequence was presented to the subject and the learning process started again from the beginning.
The precise sequences offinger movements that subjects were required to learn were as follows: ring, index, middle, little, middle, index, ring, index for the preleamed sequence; and for the two different new sequence tasks, index, ring, little, ring, index, little, middle, ring; and middle, little, ring, index, middle, little, index, middle.
The tasks were performed in the order REST, PRE, PRE, NEW, NEW, REST. This order was chosen to avoid any interference between the new sequences and the prelearned sequence. The computer generated a sequence of prompt tones and response tones at the appropriate fre-
Data acquisition. PET scans were performed using a CT1 93 l-081 12 camera (CTI, Knoxville, TN), the physical characteristics of which have been described elsewhere (Spinks et al., 1988). This camera collects 15 parallel transaxial planes of data with a total axial field of view of 10.5 cm. In order to examine the effects of our paradigm on both supra- and infratentorial structures, we scanned six subjects positioned low to in- clude the whole of the cerebellum in the field of view, and six subjects positioned higher to image the supplementary and lateral premotor areas.
A transmission scan, collected during exposure of a 68Ge/68Ga ring source, was used to correct for radiation attenuation by the head. Scans were reconstructed with a Hanning 0.5 filter giving a transaxial reso- lution of 8.5 mm full width at half maximum. The reconstructed PET images contained 128 x 128 pixels, each of 2.05 x 2.05 mm.
During each scan, subjects inhaled Cis02 at a concentration of 6 MBq ml-l and a flow rate of 500 ml min’ through a standard oxygen face mask for a period of 2 min. Dynamic PET scans were collected over 3.5 min starting 0.5 min before Ch50, delivery to obtain background radiation levels. Each activation task was performed for 3 min 35 set, starting 5 set before administration of the isotope. During scanning, arterial blood activity was measured continuously via a cannula sited in the left radial artery. Blood time-activity curves were corrected for delay and dispersion (Lammertsma et al., 1990).
Data analysis. Calculations and image matrix manipulations were performed in PROMATLAB (Mathworks Inc., Sherbom, MA) on Sparc2 computers (Sun Microsystems, Mountain View, CA) with software for image analysis (SPM, MRC Cyclotron Unit, UK; ANALYZE, Biodynamic Research Unit, Mayo Clinic, MN).
The 15 original axial planes of each PET image (interplanar distance, 6.75 mm) were interpolated linearly to 43 planes to produce approxi- mately cubic voxels (2 mm diameter). All scans were converted to rCBF images using the corrected blood time-activity curves to calculate rCBF by a dynamic/integral method for the activity recorded during the 2 min of administration of the isotope (Lammertsma et al., 1990).
Each rCBF image was reorientated to the intercommissural (AC-PC) line and resealed to fit the standard stereotaxic space defined in the brain atlas of Talairach and Toumoux (1988). This resulted in 26 planes parallel to the AC-PC line with an effective interplanar distance of 4 mm (Friston et al., 1989). These slices were resampled in a nonlinear fashion to account for differences in nonlinear brain shape (Friston et al., 199la). Images were smoothed with a Gaussian filter of 2 cm di- ameter to compensate for intersubject gyral variability and to attenuate high-frequency noise, thus increasing the signal-to-noise ratio.
Differences in global cerebral blood flow between subjects and con- ditions were removed by analysis of covariance (ANCOVA) with global flow as the confounding variable (Friston et al., 1990). This process resulted in the generation of a map of group mean blood flow for each task. The uixel values of rCBF in these maps together with the associated adjusted error variances were used for further statistical analysis. Planned comparisons between the three conditions were performed using t sta- tistics with a threshold set at p < 0.05 and a correction for multiple nonindependent comparisons. The results were displayed as statistical parametric maps (SPMs) of significant focal changes in rCBF (Friston et al., 1991b).
The two groups of subjects were analyzed separately to identify foci of significant change in rCBF between conditions in structures situated at the extremes of the cerebral volume. There was an overlap in the structures imaged in the two groups, and this provided a complete data set with 12 subjects for structures such as the thalamus and striatum (Fig. 1). Planned comparisons weie made between conditions for these designated groups as follows: PRE versus REST, NEW versus REST, and NEW versus PRE. Both significant increases and decreases are reported for all these comparisons.

The Journal of Neuroscience, June 1994, 74(6) 3777
Six high
The percentage rCBF increases were calculated for all comparisons in every area of significant change, identified with reference to the atlas of Talairach and Toumoux (1988). These were measured from the nor- malized maps and the foci of maximal change in rCBF were identified for each area. Because the data are smoothed during analysis, these foci correspond to spherical regions of interest of 2 cm diameter.
Results Task performance On the last trial of the prelearned sequence task before scanning, every subject was able to perform serial digit spans five long without errors; seven subjects were able to perform spans six long without making mistakes. All subjects were able to partic- ipate in normal conversation during the tenth and last trial while continuing to execute the prelearned sequence without errors.
During scanning, no subject made any omissions during the motor sequence tasks. As a result, the number of completed keypresses during each scan for each subject was exactly the same. The mean response time for keypresses during PRE was 400 msec (SD = 96 msec). For NEW the time was 566 msec (SD = 112 msec); this was significantly slower (p < 0.00 1, paired two-tailed t test).
I
Figure 1. Positioning of subjects in the
Six low
PET camera. Six were scanned “low” to include the whole of the cerebellum in the field of view and six “high” to include the SMA. The shaded aYea cor- responds to the extent of the area for which there was data in all 12 subjects. This includes the basal ganglia, thala- mi, and the superior part of the cere- bellum.
In the entire PET study, there were a total of 31 errors (in- correct choice of finger) during the prelearned task (PRE). These errors were distributed within 20 (9.8%) of the 204 completed executions ofthe prelearned sequence in the whole study. During new learning (NEW), one subject managed to learn two se- quences within 3.5 min to the point of being able to perform the sequence without errors, eight subjects managed to learn one sequence, and three subjects had not managed to perform the first new sequence without errors at the end of the scan.
Figure 2 demonstrates that learning is taking place during the NEW scans, since we found a progressively diminishing error rate for each subsequent trial of the new sequences. However, the lowest mean error rate of 1.33 found during the NEW con- dition for the sixth run-through of the sequence (Fig. 2) was still much greater than that of 0.15 found for the PRE condition (calculated from the data above).
Statistical parametric maps
The data set for the six subjects scanned low extended from 48 mm below the AC-PC line to 28 mm above it. For the six subjects scanned higher, the extent was from 16 mm below the
2 6- 0
ii 4-
Trial number
Figure 2. This shows the mean num- ber of errors made in the whole group of subjects for each completed run- through of the new sequences during the NEW scans, together with the stan- dard deviation ofthe data. The learning process is demonstrated by progres- sively lower mean error rates with each subsequent trial. Where subjects were able to learn more than one new se- quence during the scan, these data have been included separately.
3778 Jenkins et al. - Motor Learning and PET
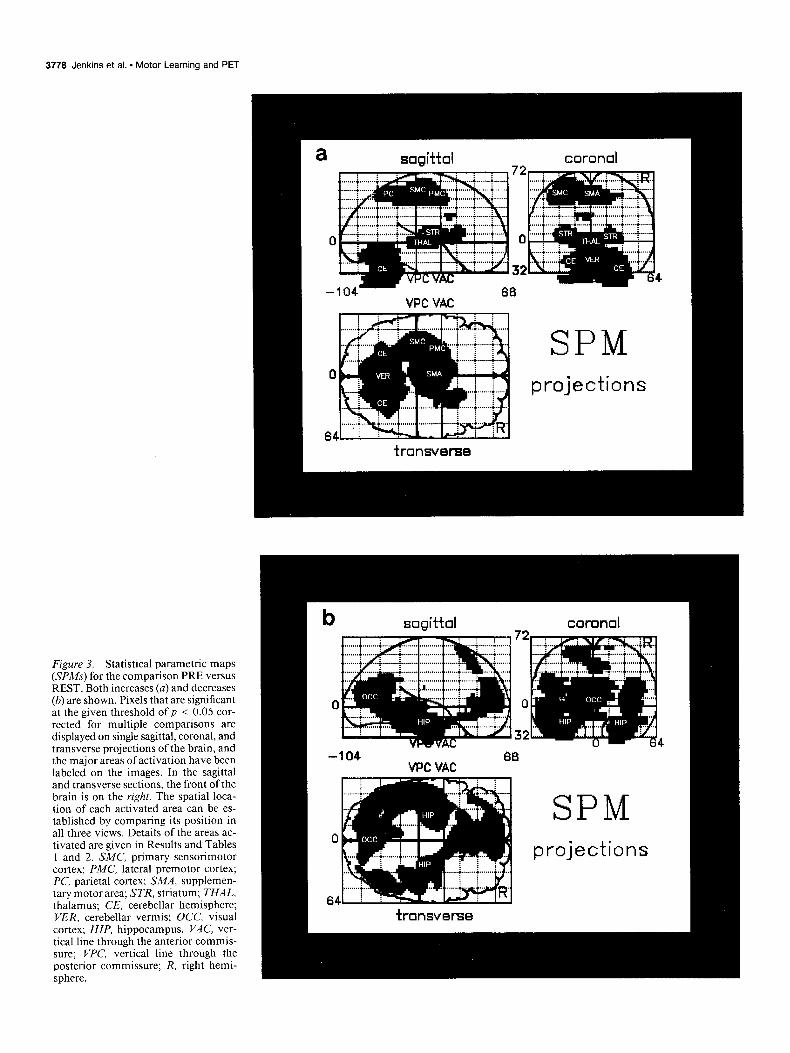
Figure 3. Statistical parametric maps (SPMs) for the comparison PRE versus REST. Both increases (a) and decreases (b) are shown. Pixels that are significant at the given threshold of p < 0.05 cor- rected for multiple comparisons are displayed on single sagittal, coronal, and transverse projections of the brain, and the major areas of activation have been labeled on the images. In the sagittal and transverse sections, the front of the brain is on the right. The spatial loca- tion of each activated area can be es- tablished by comparing its position in all three views. Details of the areas ac- tivated are given in Results and Tables 1 and 2. SMC, primary sensorimotor cortex; PMC, lateral premotor cortex; PC, parietal cortex; SMA, supplemen- tary motor area; STR, striatum; THAL, thalamus; CE, cerebellar hemisphere; VER, cerebellar vermis; OCC, visual cortex; HIP, hippocampus. VAC, ver- tical line through the anterior commis- sure; WC, vertical line through the posterior commissure; R, right hemi- sphere.
coronal
VPC VAC
SPM prcljections
transverse
coronal
VPC VAC
SPM projectims
transverse

The Journal of Neuroscience, June 1994, 14(6) 3779
Table 1. Comparison of PRE with REST: foci of significant increases in rCBF in the prelearned sequence task
% Change
Extent of area Talairach Z score in nor- activated coordinates of of peak malized
Area activated (rel. to AC-PC line) peak activation activation rCBF
Cerebellar nuclei (L) -40 to - 16 mm - 18,-62,-20 5.15 2.9 Cerebellar nuclei (R) -40 to - 16 mm +24,-54,-36 5.17 5.4 Cerebellar vermis= -32 to 0 mm -2,-60,-12 7.18 5.3 Thalamus (L)” Oto +4mm -lO,-14,0 5.86 3.6 Thalamus (Rp Oto+8mm +12,-16,+4 5.31 2.8 Putamen (L)Q Oto +16mm -22,-4,+4 6.15 3.7 Striatum (R)o Oto +16mm +22,+6,+4 4.98 2.3 Area 24 +24 to f44 mm 0,-2,+44 5.44 5.4 Area 40 (L) +40 to +48 mm -26,-36,+44 5.68 5.3 Area 7 (L) +44 to +56 mm -22,-46,+48 5.78 4.1 Area 7 (R) +44 to +52 mm +12,-52,+48 5.12 4.2 SMC (L) +48 to +60 mm -24,-20,+56 6.33 6.8 Premotor (L) +56 to +64 mm -22,-14,+64 3.84 4.6 SMA +48 to +56 mm O,-4,+48 5.5 6.2
Tables l-6 list foci of significant change in rCBF for each comparison. The coordinates in a standard stereotaxic space (Talairach and Tournaux, 1988) are given (in millimeters) for the maximally significant pixel in each area in the order x,y,z, where x is the lateral displacement from the midline (- for left hemisphere); y is the anteroposterior displacement relative to the anterior commissure (- for positions posterior to this); and z is the vertical position relative to the AC- PC line (- if below this line). The percentage change in normalized rCBF is given at each location, together with a measure of significance, the Z score (Z is the standard deviation of the standard normal distribution).
Li Data derived from all 12 subjects.
AC-PC line to 68 mm above it. Hence, we had data for all 12 subjects extending from 16 mm below to 28 mm above the AC- PC line. The foci of activation are detailed below (p < 0.05, corrected for multiple comparisons). They are reported for all 12 subjects for - 16 mm to +28 mm and for six subjects below and above these coordinates.
Prelearned sequence versus rest Figure 3 shows the statistical parametric maps (SPMs) for this comparison (both increases and decreases).
Increases. The areas in which there was greater activation during performance of the prelearned task than during rest (PRE vs REST) are listed in Table 1.
Significant activation was found in the cerebellar hemispheres bilaterally and in the anterior and posterior lobes of the vermis. There were also foci of activation that appear to lie in the cer- ebellar nuclei. There was activation of the left putamen and there was also a focus of activation on the right on the border between the striatum and claustrum. The ventral thalamus was activated bilaterally.
The following cortical areas were activated: left sensorimotor cortex (SMC); left lateral premotor cortex (PMC); the supple- mentary motor area (SMA), and the adjacent anterior cingulate area 24; parietal area 7 bilaterally; and the left parietal area 40.
Decreases. Table 2 lists the areas that were significantly less active during the prelearned task than during rest (REST vs PRE).
Compared with rest, there was a significant depression in activation in both temporal lobes, including areas 20, 21, 36, 37, and both the left and right hippocampus. Decreases were also found in inferomedial frontal cortex (rostra1 anterior cin- gulate area 32 and area 10) extending superiorly to involve medial areas 9 and 8. There was reduced rCBF in both supra-
marginal gyri (area 39) and in area 19 bilaterally and retros- plenial cortex (areas 23 and 31).
New sequences versus rest
The SPMs for this comparison are shown in Figure 4. Increases. The areas in which there was greater activation in
new learning than during rest (NEW vs REST) are listed in Table 3.
There was extensive significant activation of both cerebellar hemispheres and the anterior and posterior lobes of the vermis. There were also foci of activation that appeared to lie in the cerebellar nuclei. A separate increase in rCBF was found in the midbrain near the midline, in the region of the red nucleus. The left putamen was activated, and there was also a focus of acti- vation near the claustrum between the right striatum and insula. The medial thalamus was activated on the left.
Cortical areas of significantly increased blood flow were left SMC; bilateral PMC; parietal areas 7 and 40 bilaterally; anterior cingulate cortex (area 32); and prefrontal cortex with much more extensive activation on the right (areas 9, 10, and 46) than on the left (area 46 only).
Decreases. Table 4 lists the areas that were less active in new sequence learning than during rest (REST vs NEW).
Compared with rest, there was a significant depression of activation in the temporal lobes bilaterally, extending to the temporal poles, and involving areas 20, 35, 2 1, and the hip- pocampus on both sides. These decreases were more extensive and larger as a percentage reduction than for the comparison REST versus PRE. Decreases were also found in several other cortical areas: areas 18 and 19 bilaterally in the occipital lobes; retrosplenial cortex (areas 23 and 31); posterior insula bilater- ally; left area 37; area 39 bilaterally; rostra1 anterior cingulate area 32 and areas 10 and 9 medially; left area 8; and right SMC.

3780 Jenkins et al. l Motor Learning and PET
Table 2. Comparison of PRE with REST: foci of significant decreases in rCBF in the prelearned sequence task
Area activated
Area 20 (L) Area 20 (R)
Area 36 (L) Area 36 (R) Hippocampus (L) Hippocampus (R) Area 21 (L) Area 21 (R) Area 37 (L) Area 37 (R) Area 32a Area 19 (L) Area 19 (Rp Area 39 (L) Area 39 (R) Area 23/3 1’ Area l@ Area 90 Area 8
See Table 1 for details.
Extent of area Talairach 2 score activated coordinates of of peak (rel. to AC-PC line) peak activation activation
-32 to -12 mm -3O,-lo,-32 4.15 -36 to -16 mm +28,-20,-32 4.98
-24 mm -26,-8,-24 4.51
-24 mm +28,- 14,-24 4.76
-20 to -4 mm -2O,-8,-16 5.12 -20 to -4 mm +28,-12,-20 5.17 -12to+4mm -58,-40,-4 5.93
-12 mm +44,-4,- 12 3.91
-16to+8mm -54,-56,O 6.13
-12to+4mm +50,-48,-12 4.46
-8 to -4 mm -8,+32,-S 5.00
+4to+16mm -38,-78,+16 5.26
+4to+16mm +32,-84,+8 4.2
+ 16 to +32 mm -54,-54,+24 5.09
+8 to +28 mm +40,~62,+44 5.8
+8 to +28 mm -6,-62,+20 5.61
-4 to +20 mm -6,+54,+16 7.0 +24 to +28 mm -8,+50,+24 5.44
+36 to +56 mm +4,+32,+40 4.91
% Change in nor- malized rCBF
3.8 5.6
3.8
4.4
3.5
3.8
4.0
2.1
4.3
2.8
3.6
3.3
2.6
2.3
3.9
2.7
4.4
3.5
3.8
New sequences versus prelearned sequence Figure 5 shows the SPMs for this comparison.
Increases. The areas in which there was greater activation in new learning than during the prelearned task (NEW vs PRE) are listed in Table 5.
During new learning, there were greater increases in rCBF in the cerebellar vermis, cortex, and nuclei bilaterally. There was also greater activation in the medial thalamus, and in a focus located in the midline in the region of the red nuclei.
There was significantly greater activation in the following cor- tical areas: right prefrontal area 47; prefrontal areas 9, 10, and 46 bilaterally; parietal areas 7 and 40 bilaterally; anterior cin- gulate cortex (area 32); and PMC bilaterally.
Decreases. Table 6 lists the areas that were less active in new sequence learning than during performance of the prelearned sequence (PRE vs NEW).
In new learning there was a greater depression in rCBF in temporal cortex bilaterally (involving areas 20, 2 1, 37, and the hippocampus), as well as bilaterally in the posterior insula. Oth- er areas with significantly lower blood flow were areas 17 and 18 close to the midline; parietal area 40 bilaterally; posterior SMA and the adjacent cingulate area 24.
Changes in rCBF
The percentage changes in rCBF in the areas activated in each comparison are given in Tables l-6. These are measured at the peak focus of activation within each area. Figure 6 gives the normalized rCBF values across conditions in four particular regions: the cerebellum, putamen, prefrontal cortex, and tem- poral lobe.
Figure 6a illustrates the pattern ofchange in rCBFacross scans
in the left cerebellar nuclei for the six subjects who were posi- tioned low in the PET camera. It can be seen that there is an increase in rCBF during performance of the prelearned task, but that there is a greater increase during new learning. There is no difference between the two rest conditions (the first and last scans).
Figure 66 illustrates the rCBF changes in the left putamen for all 12 subjects. It can be seen that there is an increase in rCBF both during new learning and during performance of the pre- learned task, but that there is no significant difference in acti- vation between these two conditions.
Figure 6c illustrates the rCBF changes in the right prefrontal cortex (area 46) for all 12 subjects. It can be seen that there is an increase in rCBF during new learning, but that during per- formance of the prelearned task rCBF is at baseline resting lev- els.
Figure 6d illustrates the changes for the right temporal lobe (area 20) for the six subjects positioned low in the scanner. It can be seen that there is a decrease in rCBF during the over- learned sequence task, but that there is a greater decrease, com- pared with rest, when new sequences are learned.
Discussion
We have compared changes in rCBF when subjects learn new sequences of motor actions or perform a prelearned sequence automatically. The same number of movements were made in the two conditions and the rate was the same, but the response times were longer in new learning. We also measured the level of performance in terms of errors made.
In the studies by Seitz et al. (1990) and Friston et al. (1992), the subjects knew what they had to do before scanning com- menced; during the scans they had more practice and improved

The Journal of Neuroscience, June 1994, 14(6) 3761
VPC VAC
SPM projections
transverse
sagittal coronal
I
VI-L VAL SPM cl
projectitms
64 transversi2
I
Figure 4. The SPMs for the compar- ison NEW versus REST. Both increases (a) and decreases (b) are shown. Details of the areas activated are given in Re- sults and Tables 3 and 4. DP, dorsal prefrontal cortex; other abbreviations are as for Figure 3.

3782 Jenkins et al. + Motor Learning and PET
Table 3. Comparison of NEW with REST: foci of significant increases in rCBF in the new sequence task
Area activated
Extent of area Talairach activated coordinates of (rel. to AC-PC line) peak activation
% Change
Z score in nor- of peak malized activation rCBF
Cerebellar cortex (L) Cerebellar cortex (R) Cerebellar nuclei (L) Cerebellar nuclei (R) Cerebellar vermisO Midbraina Thalamus (L)” Putamen (L)Q Striatum/insula (R)o Area 10 (R)R Area 46 (L)a Area 46 (R)a Area 320 Area 9 (R)o Area 40 (L) Area 40 (R) Area 7 (L) Area 7 (R) SMC (L) Premotor (L) Premotor (R)
-44 to -20 mm
-44 to -20 mm -40 to - 16 mm
-40 to - 16 mm
-40 to -8 mm
-12to-4mm Oto+16mm Oto+Smm
-4 to -t 12 mm
-4 to +20 mm
+ 16 to +20 mm
+8 to +28 mm
+20 to +28 mm
+24 to +40 mm
+40 to +52 mm
+40 to +52 mm
+40 to +60 mm
+40 to +60 mm
+44 to +56 mm
+44 to +68 mm
+44 to +68 mm
-2O,-60,-36 7.08 7.4
+24,-56,-36 7.8 8.5
-22,-64,-24 8.37 6.6
+22,-56,-32 8.91 8.5
-4,-66,- 16 10.0 8.3
-4,-22,-4 7.62 4.8
-4,-20,O 8.18 5.2
-2o,+ 10,o 5.35 3.0
+26,+ 14,+4 7.55 4.5
+36,+44,+12 6.5 5.2
-32,+42,+16 3.94 2.8
+36,+40,+20 7.92 6.4
-+4,+22,+28 5.28 4.1
+34,+38,+24 8.76 6.8
-3O,-38,+48 6.43 6.0
+32,-44,+44 7.0 8.6
-2O,-54,+48 7.59 7.2
+ lo,-58,+48 1.6 8.4
-4O,-24,+48 6.8 6.9
-32,-8,+52 6.48 7.6
+20,+4,+56 6.01 6.0
See Table 1 for details.
their level of skill. Grafton et al. (1992) also studied the effect of practice on a motor skill, using a pursuit rotor task. Subjects were scanned after increasing amounts of practice, and changes in the rCBF profile were correlated with changes in performance as assessed by time on target.
In our study, the subjects had been given extensive practice in pressing the keys before scanning. During new learning they had to learn what keys to press. In other words, during scanning for new sequences they learned mainly what to do, rather than how to do it. The difference is analogous to the difference be- tween learning the notes of a tune on the piano, and improving skilled performance of the tune with practice.
Cerebellum The cerebellum was activated both during new sequence learn- ing (NEW vs REST) (Fig. 4~) and automatic performance (PRE vs REST) (Fig. 3a), but the activation was more extensive during new learning (NEW vs PRE) (Fig. 5~) and greater in terms of percentage change (Fig. 6~).
The difference in cerebellar activation is consistent with the decrease in activation with practice reported by Friston et al. (1992). However, in the smaller study by Friston et al. (1992) there was also a modest increase in rCBF in the rest condition with time, whereas in the present study the baseline resting flow values were remarkably consistent (Fig. 6~). We have also been able to demonstrate differences throughout the cerebellar hemi- spheres as well as in the cerebellar nuclei.
Since changes in flow are thought to relate to synaptic activity
(Raichle, 1987), the lesser activation in the cerebellar nuclei during performance of the prelearned task probably reflects a change in the activity ofthe neurones that project to these nuclei. A major group of cells projecting to the nuclei are the Purkinje cells of the cerebellar cortex, the synapses being inhibitory (Ito, 1984). Marr (1969) proposed that the cerebellum plays an im- portant role in the learning of motor skills. He supposed that during learning the cerebrum sets up and organizes the move- ments, and that the cerebellum is involved in the process by which the movements can be run off automatically. It is true that Marr (1969) does not use the word “automatic,” but it captures the sense of what he says.
In his model, cerebellar inputs via the climbing fibers and mossy fibers are integrated through their connections to the Purkinje cells. The process of learning would then involve syn- aptic changes at this level. Long-term depression of activity has been reported in the cerebellar cortex by Ito et al. (1982) as the result of stimulation of the climbing fibers and mossy fibers at the sarne time. Furthermore, Gilbert and Thach (1977) have provided indirect evidence from cell recording that the synapses onto the Purkinje cells are modifiable.
There is other evidence that the cerebellum plays a role in learning. In rabbits lesions in the cerebellar nuclei or cortex impair or abolish the classically conditioned response of the nictitating membrane (McCormick and Thompson, 1984; Yeo et al., 1992). In monkeys, lesions in the flocculus retard the recalibration of the vestibulo-ocular reflex (Ito, 1975). Patients with cerebellar pathology are impaired at motor learning (Sanes

The Journal of Neuroscience, June 1994, 14(6) 3783
Table 4. Comparison of NEW with REST: loci of significant decreases in KBF in the new sequence task
Area activated
Extent of area Talairach activated coordinates of frel. to AC-PC line) peak activation
Z score of peak activation
% Change in nor- malized rCBF
Area 20 (L) Area 20 (R) Area 35 (L) Area 35 (R) Hippocampus (L) Hippocampus (R) Area 21 (L) Area 32a Area 18 (L)” Area 18 (R) Area 37 (L) Post. insula (L) Post. insula (R) Area 19 (L) Area 19 (RF Area 39 (L) Area 39 (R) Area 23/3 la Area l@ Area 9a Area 8 (L) SMC (R)
-40 to - 16 mm -40 to -32 mm -24 mm -24 mm -20 to -4 mm -20 to -4 mm -12toOmm
-8 to -4 mm -8toOmm -8to+12mm -8 to +4 mm +4 mm
0 to +20 mm -4to+16mm -4to +12mm +8 to +28 mm
+ 16 to +24 mm +8 to +32 mm -4 to +20 mm
+24 to +28 mm +48 mm +56 to +64 mm
-54,- 16,-20 8.00 8.9 +18,-12,-36 6.96 11.2 -24,-2,-24 7.08 7.7 +26,-4,-24 1.73 8.5 -18,-8,-16 7.48 6.7 +28,-8,-20 8.15 6.9 -46,~4,- 12 9.97 5.1
-6,+32,-8 6.18 4.7 -3O,-88,0 5.41 3.5 +24,-92,+4 6.3 4.1 -5O,-64,+4 7.19 4.5 -5O,-18,+4 6.77 3.4 +44,- 18,+ 12 7.45 4.7 -44,-72,+ 12 8.00 5.2 +36,-78,+8 6.41 4.2 -46,-64,+20 9.4 4.9 +38,-66,+ 16 6.02 3.9
-4,-60,+16 8.6 4.2 -4,+56,+ 16 8.2 5.5 -4,+54,+24 6.14 4.6
-14,+30,+48 3.91 3.1 + lo,-28,+60 4.07 3.2
See Table 1 for details.
Table 5. Comparison of NEW with PRE: foci of significant increases in rCBF in the new sequence task
Area activated
Cerebellar cortex (L) Cerebellar cortex (R) Cerebellar nuclei (L) Cerebellar nuclei (R)
Extent of area activated (rel. to AC-PC line)
-40 to -20 mm -40 to 20 mm -32 to -20 mm -32 to -20 mm
Talairach coordinates of oeak activation
% Change
Z score in nor- of peak malized activation rCBF
-26,-66,~32 5.25 4.4 +28,-56,-36
-4,-78,-16 4.58
3.99 3.6
3.4
-22,-68,-24 6.68 4.9 +28,-62,-28
-2,-26,-8 4.76
5.13 4.6
3.1 -2,-22,+4 3.86 2.1
+36,+20,+4 5.07 2.6 -30,+46,-4 6.16 4.6 +28,+50,-4 7.28 6.5 -40,+22,+24 4.36 2.4
Cerebellar vermisO
Area 46 (Rp Area 32” Area 9 (L) Area
Midbrain
9 (R) Area 40 (L) Area 40 (R) Area
Thalami”
7 (L) Area 7 (R) Premotor (L) Premotor (R)
Area 47 (R) Area 10 (L) Area 10 (R) Area 46 (L)
$8 to +28 mm
-16
+24 to +44 mm +28 mm
mm
+24 to +40 mm +40 mm +28 to +56 mm +40 to +60 mm
-12
+40 to +60 mm +52 to +64 mm
to -8 mm
+44 to +64 mm
+4 mm -8 to +4 mm -8 to +20 mm -8 to +20 mm +4 to +24 mm
+40,+38,+16 1.3 6.8 +6,+30,+28 4.85 3.5
-40,+20,+28 5.22 3.3 +36,+32,+28 7.89 6.3 -34,-62,+40 3.72 4.0 +36,-58,+40 6.98 7.7 -24,-60,+48 4.12 4.1 i-36,-52,+44 6.43 8.6 - 16,+ lo,+60 4.8 4.4 +20,+10,+60 6.61 8.4
See Table 1 for details.

3784 Jenkins et al. - Motor Learning and PET
maittal coronal 72
32 4
VPC VAC
transverse
SPM projections
Figure 5. The SPMs for the compar- ison NEW versus PRE. Both increases (a) and decreases (b) are shown. Details of the areas activated are given in Re- sults and Tables 5 and 6. DP, dorsal prefrontal cortex; other abbreviations are as for Figure 3.
coranol
VPC VAC
cl
32 4
88
SPM pimjections
trmwverse

The Journal of Neuroscience, June 1994, M(6) 3785
Table 6. Comparison of NEW with PRE: loci of significant decreases in rCBF in the new sequence task
Area activated
Area 20 (L) Area 20 (R) Area 38 (L) Area 38 (R) Area 21 (L) Area 21 (R) Area 28 (L) Area 28 (R) Hippocampus (L)” Hippocampus (R) Post. insula (L)Q Post. insula (R) Area 17 Area 18 Area 40 (L) Area 40 (R) Area 24 Posterior SMA
Extent of area activated (rel. to AC-PC line)
-36 to ~ 16 mm -36 mm
-32 to -24 mm
-32 to -24 mm
-32 to -16 mm
-28 to -24 mm
-28 to -24 mm
-28 to -24 mm
-12to-8mm -20 to -8 mm -4 to +8 mm
-4 to +8 mm -4to+12mm -8to+12mm +16 mm +16 to +28 mm +28,+40 to +44 mm
+48 to +56 mm
Talairach Z score coordinates of of peak peak activation activation
% Change in nor- malized rCBF
- 14,- 14,-36 4.6 1.3
+14,-6,-36 5.3 10.5
-20,+2,-32 5.8 8.9
+18,+2,-32 5.41 9.2
-44,~4,-28 5.22 4.9
+36,0,-24 5.65 4.9
-18,+4,-28 6.28 9.3
+24,0,-28 5.37 5.8
-32,-24,-8 5.64 2.8
+32,-4,-20 5.44 4.4
-42,- 14,0 6.81 3.6
+34,-10,+4 5.2 2.7
l t6,-80,+8 5.17 2.4
M-12,+4 5.63 2.9
-46,-26,+ 16 4.99 2.8
+52,‘22,+20 5.22 3.4
O,-12,+44 4.91 3.6
O,-12,+48 4.34 3.5
See Table 1 for details.
et al., 1990), slow to learn conditional tasks (Bracke-Tolkmitt et al., 1989), and can fail to improve on concurrent learning tasks (Fiez et al., 1992).
Raichle and colleagues have also demonstrated that when subjects are given practice at producing verbs that are appro- priate for particular nouns, there is a reduction in the activity of the right cerebellar hemisphere (Raichle, 1991). The results of that study and the present one are compatible with the hy- pothesis that the cerebellum plays some role in the process by which learned tasks become automatic.
Thalamus There was significant activation of the left thalamus when sub- jects learned new sequences (NEW vs REST) (Fig. 4a), and bilateral activation when they performed the prelearned se- quence (PRE vs REST) (Fig. 3a). It is not possible to be sure which nuclei are activated, given the resolution of the scanner. However, the peak activation appeared to lie within the ven- trolateral thalamus for the prelearned task, and in the dorso- medial nucleus for the new learning tasks.
Both the basal ganglia and cerebellum project to the motor cortex and the premotor areas via the ventrolateral thalamus, and the dorsomedial nucleus projects to prefrontal cortex (Jones, 1985). There was significantly more activation of the medial thalamus when subjects were learning new sequences (NEW vs PRE). This is consistent with the fact that the prefrontal cortex was activated during new learning (NEW vs PRE) (Figs. 5a, 6~).
Putamen
The left putamen was activated during automatic performance and new learning (PRE vs REST, NEW vs REST) (Figs. 3a, 4a, 6b). There was no significant difference in the degree of acti- vation during either task (NEW vs PRE) (Fig. 5). The data are
based on 12 subjects and thus the finding should be particularly reliable (Fig. 6b).
One problem in interpreting activation data from the basal ganglia is that there are many parallel inputs into the lateral and medial putamen (Selemon and Goldman-Rakic, 1985; Alex- ander et al., 199 1). The spatial resolution of PET will not allow independent measures to be taken of the activity of each of these projection areas. On this basis, we suggest two alternative ex- planations for our findings. Either the putamen performs the same executive function in new learning and in performance of the prelearned sequence task, or different subpopulations ofcells are active to the same extent in these two situations.
Midbrain There was significant activation in the midbrain during new learning (NEW vs REST) (Table 3), but no significant activation during performance of the prelearned sequence (PRE vs REST). There was also significantly more activation during new learning than prelearned performance (NEW vs PRE) (Fig. 5a).
It is not possible to be sure of the localization of the signal in the midbrain, given the spatial resolution of the scanner. However, it appears to lie in the region of the red nucleus. The activation may therefore represent activation of cerebellorubral pathways.
Sensorimotor cortex
The contralateral SMC was activated during new learning (NEW vs REST) (Fig. 4a) and automatic performance (PRE vs REST) (Fig. 3a). There was no significant difference between the acti- vation in new learning and prelearned performance (NEW vs PRE) (Fig. 5). This is consistent with the fact that the rate and amplitude of the movements were the same during both con- ditions.

3786 Jenkins et al. * Motor Learning and PET
Figure 6. The graphs illustrate the rCBF changes across the six scans (identified on the x-axis) for four areas: left cerebellar nuclei (a), left putamen (b), right dorsolateral prefrontal cortex (c), and right temporal lobe (d). The mean normalized rCBF values (cen- tered on the Talairach coordinates giv- en) are plotted, together with the stan- dard deviation of these values.
a 76 -
68 - . 1
66 REST PRE PRE NEW NEW REST !
rCBF changes in the left cerebellar nuclei
(Talairach coordinates (x,y,z) = -2O,-68,-24)
REST PRE PRE NEW NEW REST !
rCBF changes in the left putamen
(Talairach coordinates [ x,y,z] = -18,+8,+8)

The Journal of Neuroscience, June 1994, 14(6) 3787
C 52 -
46-
46: I f
44 REST PRE PRE NEW NEW REST !
rCBF changes in the right prefrontal cortex
(Talairach coordinates { x,y,z] = +36,+32,+28)
cl 44 7
P +d
ri c 36-
I I 1 I
36 ; REST PRE PRE NEW NEW REST !
rCBF changes in the right temporal lobe (area 20)
(Talairach coordinates (x,y,z) = +18,-12,-36)

3788 Jenkins et al. - Motor Learning and PET
Friston et al. (1992) also found no change in the activation of the SMC as subjects practiced sequences of paced finger movements. In contrast, both Seitz et al. (1990) and Grafton et al. (1992) found increased activation of the contralateral SMC; however, in these studies we may assume that there were changes in the execution of the movements as the subjects were given more practice and became more skilled.
Premotor cortex and SMA
There was greater activation in the lateral premotor cortex when subjects learned new sequences than during performance of the prelearned task (NEW vs PRE) (Table 5, Fig. 5a). By contrast, there was greater activation in the posterior SMA during au- tomatic performance than new learning (PRE vs NEW) (Table 6, Fig. 5b). Grafton et al. (1992) also found increased activation of the posterior SMA as subjects became more skilled on the pursuit rotor task.
Both Goldberg (1985) and Passingham (1987; Passingham et al., 1989) have argued that the lateral premotor cortex makes a greater contribution when performance is guided by external cues, and the SMA when such cues are not available. In our study, when subjects were learning the new sequences they had to make use of the auditory cues provided by the computer, but when the task had become automatic they could run the se- quence off without using feedback, even though it was provided. However, in both conditions the sequence was performed with- out any external cue that specified what the next movement should be.
Parietal cortex
Parietal areas 7 and 40 were activated both in new learning (NEW vs REST) (Fig. 4a) and automatic performance (PRE vs REST) (Fig. 3a), but the activation was significantly greater and more extensive during new learning, particularly in the right hemisphere (NEW vs PRE) (Fig. 5a). Seitz et al. (1990) reported a decrease in the activation of the parietal association cortex as subjects practiced a motor sequence; there was a marked de- crease in flow in the cortex of the intraparietal sulcus of both hemispheres (Roland et al., 199 1).
One possibility is that the decrease in activation reflects a decrease in the “enhancement” of neuronal activity. The pari- eta1 association cortex plays a role in spatial attention (Posner and Rothbart, 1991) and Bushnell et al. (198 1) have shown that the activity of cells in this area is enhanced when monkeys attend to visuospatial cues. Meyer et al. (199 1) report that there is greater activation of the somatosensory cortex when human subjects attend to a vibratory stimulus than when they do not. Furthermore, Pardo et al. (199 1) found activation of the parietal association cortex when subjects attended to tactile stimulation of their toes, and Corbetta et al. (1993) report activation of area 40 when subjects covertly attend to the left or right visual field. In the present study, the subjects had to attend to their fingers during new learning, but when the task was automatic they could direct their attention to other tasks such as reporting numbers in digit span tasks or taking part in a conversation.
In the study by Pardo et al. (199 1) the right parietal association cortex was activated whether it was the left or right toe that was touched. In the present study, it was in the right parietal cortex that we found the greatest difference in activation when new learning and automatic performance were compared (Table 5, Fig. 5a).
Prefrontal cortex
Prefrontal areas 9, 10, and 46 were activated only during new learning (NEW vs REST) (Fig. 4a), not during automatic per- formance (PRE vs REST) (Fig. 3a). Figure 6c shows the rCBF values for 12 subjects for the area of peak significance in area 46 on the right. When new learning was compared with auto- matic performance (NEW vs PRE), significant and extensive activation was found, particularly in the right hemisphere (Fig. 5a). The activation involved much of the lateral surface of the hemisphere.
The prefrontal cortex was not significantly activated in the study by Seitz et al. (1990; Roland et al., 199 1) in which subjects practiced sequences that they had learned before scanning. Yet in both that study and in new sequence learning in our study the subjects had to rehearse the sequences in working memory. The crucial difference may be that in our new sequence learning paradigm (NEW) the process of trial and error learning required the subjects to generate (freely select) finger movements. The subjects tried a finger and the computer told them whether that movement was correct. The dorsal prefrontal cortex is especially activated if subjects generate movements of a joystick (Deiber et al., 199 1; Playford et al., 1992) or movements of the fingers (Frith et al., 1991). In our study, when subjects had mastered a sequence, they no longer had to select movements to try out; they simply executed the sequence of finger movements that they had learned.
In the present study, the right prefrontal cortex was more extensively activated than the left (Fig. 3). In the studies by Deiber et al. (1991) and Playford et al. (1992), a comparison was made between activation when subjects freely selected movements of a joystick (left, right, forward, or backward) and a condition in which they always pushed the joystick forward. Both groups of workers identified significant activation of the prefrontal cortex during the free selection task compared with the repetitive movement task. This activation was more exten- sive in the right prefrontal cortex in both cases. The dominance of the right hemisphere in these studies could reflect the fact that the joystick movements involved spatial processing. Like- wise, in our study, the subjects pressed keys that were set out in a spatial array.
Anterior cingdate cortex
The anterior cingulate area 32 was activated during new learning (NEW vs REST) (Table 3) but not during automatic perfor- mance (PRE vs REST) (Table 1). In most experiments using PET in which the dorsal prefrontal cortex is activated, the an- terior cingulate area is also activated (for review, see Frith and Grasby, in press). This is not surprising since prefrontal cortex sends outputs to areas 32 and 24 in the anterior cingulate cortex (Vogt and Pandya, 1987).
There are a few studies in which the anterior cingulate cortex was activated without concomitant activation of the dorsal pre- frontal cortex. This occurs when subjects attend to part of their body (Pardo, 199 1) or when they attend to the color of the ink in which a word is written in the Stroop task (Pardo et al., 1990) Corbetta et al. (1993) also found activation of the anterior cin- gulate cortex when subjects attended covertly to the left or right visual field; there was activation of frontal area 8, but not of the dorsal prefrontal areas 9 and 46. These results suggest that the anterior cingubte cortex plays some role in directed atten- tion. In the present study, the subjects had to attend to the task

The Journal of Neuroscience, June 1994, 74(6) 3789
during new learning, but not when the task had become auto- matic.
Temporal cortex
Both during new learning (REST vs NEW) and during automatic performance (REST vs PRE) there was a depression in rCBF in the temporal lobe, prestriate cortex, and angular gyrus (area 39) (Tables 2, 4; Figs. 3b, 4b). The depression was significantly greater during new learning (PRE vs NEW) (Fig. 6d). Consid- ering area 20 in the right inferior temporal cortex alone, the mean percentage decrease in rCBF was 11.2% for new learning and 5.6% for the prelearned sequence.
The depression in activity in posterior cortex was confined to areas that process and store visual signals (Desimone and Ungerleider, 1989). No depression of rCBF was found in the superior temporal association cortex (area 22), which processes auditory signals (Pandya and Yeterian, 1985). In the present study, the subjects lay with their eyes closed, but still had to attend to the pacing tones presented by the computer.
There are two facts to be explained: first, that there was a depression in rCBF compared with the resting condition, and second, that it was less when the task had become automatic. The depression in rCBF may reflect the fact that when subjects moved their fingers, they were attending to a motor task and visual information was irrelevant. If this is the case, then we can conclude that there are two mechanisms underlying the phenomenon of selective attention. The first is that cells enhance their activity when subjects attend to one stimulus rather than another within the same modality. The second is that the activity of cells can be depressed in modalities to which the subject is not attending.
The depression in rCBF may have been greater during new learning because the subjects had to pay more attention to the motor task during new learning. When the task was more au- tomatic the subjects were better able to attend to other things. A novice typist has to attend to the task of copying from a text, but the skilled typist can engage in conversation at the same time.
Hippocampus
There was also a depression in rCBF in the hippocampus when subjects performed the motor tasks (REST vs NEW, REST vs PRE) (Tables 2,4). The depression was greater during new learn- ing (PRE vs NEW) (Table 5). In the hippocampus the mean decrease (left and right) was 6.8% for new learning and 3.6% for the prelearned sequence. It is possible that, if the subjects had been given more time to practice the overlearned sequence, the decrease in activity on the prelearned tasks would have been further reduced.
Bilateral removal of the hippocampus does not prevent learn- ing of simple motor tasks by monkeys (Zola-Morgan and Squire, 1984) or patients (Milner et al., 1968). This supports the evi- dence from our study that motor learning need not engage the hippocampal system. By contrast, the hippocampus is activated during recall of learned visual (Roland et al., 199 1) and verbal material (Raichle, 199 1).
Conclusion
We have three main suggestions concerning the process by which motor tasks can become automatic. The first is that the cere- bellum is involved in this process. The cerebellar cortex and
nuclei are strongly activated during new learning, but they are less active when the subjects can perform the task automatically. The putamen is activated during both conditions, and is as strongly activated during performance as during new learning. Whatever the role of the basal ganglia, this role is as important when a task has been learned as during new learning.
The second suggestion is derived from the observation that the prefrontal cortex is strongly engaged by new learning, but is no longer activated when the task is performed automatically. One possible implication of this finding is that during new learn- ing of motor tasks there will be interference with the making of decisions on other tasks. When a motor task has become au- tomatic the prefrontal cortex is no longer engaged.
The final suggestion is that if subjects have to attend hard to one modality there is a mechanism by which activity in irrel- evant modalities can be decreased. In the present study, when subjects learned new motor sequences, there was a decrease in activity in those parts of the posterior cortex that analyze and store visual information. When the subjects performed the tasks automatically there was a lesser decrease in the activity of these areas. This may relate to the observation that when subjects perform tasks automatically they are able to attend to other tasks.
References Alexander GE, Crutcher MD, DeLong M (199 1) Basal ganglia-thal-
amocortical circuits: parallel substrates for motor, oculomotor, “pre- frontal” and “limbic” functions. Prog Brain Res 85: 119-146.
Bracke-Tolkmitt R, Linden A, Canavan AGM, Rockstroh B, Scholz E, Wessel K. Diener H-C (1989) The cerebellum contributes to mental skills. Behav Neurosci IO3:442-446.
Bushnell MC, Goldberg GM, Robinson DL (1981) Behavioral en- hancement of visual responses in monkey cerebral cortex. 1. Mod- ulation in posterior parietal cortex related to selective visual attention. J Neurophysiol 46:?55-112.
Corbetta M. Miezin FM. Shulman GL. Petersen SE f 1993) A PET study of visuospatial attention. J Neurosci 13: 1202-I226. ’
Deiber M-P, Passingham RE, Colebatch JG, Friston KJ, Nixon PD, Frackowiak RSJ (199 1) Cortical areas and the selection of move- ment: a study with positron emission tomography. Exp Brain Res 84: 393-402.
Desimone R, Ungerleider LS (1989) Neural mechanisms of visual processing in monkeys. In: Handbook of neuropsychology, Vol 2 (Boller F, Grafman J, eds), pp 267-300. Amsterdam: Elsevier.
Fiez JA, Petersen SE, Cheney MK, Raichle ME (1992) Impaired non- motor learning and error detection associated with cerebellar damage. Brain 115:155-178.
Friston KJ, Passingham RE, Nutt JG, Heather JD, Sawle GV, Frac- kowiak RSJ (1989) Localisation in PET images: direct fittine of the intercommissural (AC-PC) line. J Cereb Blooh Flow Metab?:690- 695.
Friston KJ, Frith CD, Liddle PF, Dolan RJ, Lammertsma AA, Frac- kowiak RSJ (1990) The relationship between global and local changes in PET scans. J Cereb Blood Flow Metab 10:458-466.
Friston KJ, Frith CD, Liddle PF, Frackowiak RSJ (1991a) Plastic transformation of PET images. J Comput Assist Tomogr 15:634-639.
Friston KJ, Frith CD, Liddle PF, Frackowiak RSJ (199 1 b) Comparing functional (PET) images: the assessment ofsignificant change. J Cereb Blood Flow Metab 11:690-699.
Friston KJ, Frith CD, Passingham RE, Liddle PF, Frackowiak RSJ (1992) Motor practice and neurophysiological adaptation in the cer- ebellum: a positron tomography study. Proc R Sot Lond [Biol] 248: 223-228.
Frith CD, Grasby PM (in press) rCBF studies of prefrontal function. In: Handbook of neuropsychology, Vol 9 (Johnson R, Baron JC, Grafman J, Hendler J, eds), in press. Amsterdam: Elsevier.
Frith CD, Friston KJ, Liddle PF, Frackowiak RSJ (199 1) Willed action and the prefrontal cortex in man: a study with PET. Proc R Sot Lond [Biol] 244:241-246.
3790 Jenkins et al. * Motor Learning and PET
Gilbert PFC, Thach WT (1977) Purkinje cell activity during motor learning. Brain Res 128:309-328.
Goldberg G (1985) Supplementary motor area structure and function: review and hypotheses. Behav Brain Res 8:567-588.
Grafton ST, Mazziotta JC, Presty S, Friston KJ, Frackowiak RSJ, Phelps ME (1992) Functional anatomy of human procedural learning de- termined with regional cerebral blood flow and PET. J Neurosci 12: 2542-2548.
Greenberg J, Hand P, Sylvestro A, Reivich M (1979) Localized met- abolic-flow couple during functional activity. Acta Neurol Stand [Suppl] 72:12-14.
Ito M (1975) Learning control mechanisms by the cerebellum: inves- tigations in the flocculo-vestibular-ocular system. In: The nervous system: basic neurosciences (Tower DB, ed), pp 245-252. New York: Raven.
Ito M (1984) The cerebellum and neural control. New York: Raven. Ito M, Sakurai M, Tongroach P (1982) Climbing fibre induced de-
pression of both mossy fibre responsiveness and glutamate sensitivity of cerebellar Purkinje cells. J Physiol (Lond) 324: 113-l 34.
Jones EG (1985) The thalamus. New York: Plenum. Lammertsma AA, Cunningham VJ, Deiber M-P, Heather JD, Bloom-
field PM, Nutt J, Frackowiak RSJ, Jones T (1990) Combination of dynamic and integral methods for generating reproducible functional CBF images. J Cereb Blood Flow Metab 10:675-686.
Marr D (1969) A theory of cerebellar cortex. J Physiol (Lond) 202: 437-470.
McCormick DA, Thompson RF (1984) Cerebellum: essential involve- ment in the classically conditioned eyelid response. Science 223:296- 299.
Meyer E, Ferguson SSG, Zattore RJ, Alivisatos B, Marrett S, Evans AC, Hakim AM (199 1) Attention modulates somatosensory cere- bral blood flow response to vibrotactile stimulation as measured by positron emission tomography. Ann Neurol 29:440-443.
Milner B, Corkin S, Teuber H-L (1968) Further analysis of the hip- pocampal amnesic syndrome. Fourteen year follow-up study of H.M. Neuropsychologia 6:2 15-234.
Oldfield RC (197 1) The assessment and analysis of handedness: the Edinburgh Inventory. Neuropsychologia 9:97-l 13.
Pandya DN, Yeterian EH (1985) Architecture and connections of cortical association areas. In: Association and auditory cortices, Vol 4 (Peters A, Jones EG, eds), pp 3-6 1. New York: Plenum.
Pardo JV, Pardo PJ, Janer KW, Raichle ME (1990) The anterior cingulate cortex mediates processing selection in the Strooo atten- tional conflict paradigm. Proc Nat1 &ad Sci USA 87:256-239.
Pardo JV, Fox PT, Raichle ME (199 1) Localization ofa human system for sustained attention by positron emission tomography. Nature 349: 61-64.
Passingham RE (1987) Two cortical systems for directing movement. Motor areas of the cerebral cortex. Ciba Found Symp 132: 15 l-l 64.
Passingham RE, Chen YC, Thaler D (1989) Supplementary motor cortex and self-initiated movement. In: Neural programming (Ito M, ed), pp 13-24. Basel: Karger.
Playford ED, Jenkins IH, Passingham RE, Nutt J, Frackowiak RSJ, Brooks DJ (1992) Impaired mesial frontal and putamen activation in Parkinson’s disease: a positron emission tomography study. Ann Neural 32:151-161.
Posner MI, Rothbart MK (1991) Attentional mechanisms and con- scious experience. In: The neuropsychology of consciousness (Milner AD, Rugg MD, eds), pp 9 l-l 11. London: Academic.
Raichle ME (1987) Circulatory and metabolic correlates of brain func- tion in normal humans. In: Handbook of physiology, Set 1, The nervous system, Vo15 (Plum F, ed), pp 643-674. Bethesda: American Physiological Society.
Raichle ME (199 1) Memory mechanisms in the processing of words and word-like svmbols. Ciba Found Svmu 163: 198-204.
Roland PE, Gulyas B, Seitz RJ (199 1) Strictures in the human brain participating in visual learning, tactile learning, and motor learning. In: Memory: organization and locus of change (Squire LR, Weinberger NM, Lynch G, McGaugh JL, eds), pp 95-l 13. London: Oxford UP.
Sanes JN, Dimitrov B, Hallett M (1990) Motor learning in patients with cerebellar dysfunction. Brain 113: 103-l 20.
Seitz RJ, Roland PE, Bohm C, Greitz T, Stone-Elander S (1990) Motor learning in man: a positron emission tomographic study. Neuroreport 1:57-60.
Selemon LD, Goldman-Rakic PS (1985) Longitudinal topography and interdigitation of corticostriatal projections in the rhesus monkey. J Neurosci 5~776-794.
Shaffer LH (1975) Multiple attention in continuous verbal tasks. In: Attention and performance (Rabbitt PMA, Dornic S, eds), pp 205- 2 13. New York: Academic.
Spinks TJ, Jones T, Gilardi MC, Heather JD (1988) Physical perfor- mance of the latest generation of commercial positron scanner. IEEE Trans Nucl Med 351721-725.
Talairach J, Toumoux P (1988) Co-planar stereotaxic atlas of the human brain. New York: Thieme.
Vogt BA, Pandya DN (1987) Cingulate cortex of the rhesus monkey: II. Cortical afferents. J Comn Neurol 262:27 l-289.
Yeo CH, Hardiman MJ (1962) Cerebellar cortex and eyeblink con- ditioning: a reexamination. Exp Brain Res 88:623-638.
Zola-Morgan S, Squire LR (1984) Preserved learning in monkeys with medial temporal lesions. J Neurosci 4:1072-1085.