motor control system design for electric vehicles...
TRANSCRIPT

Motor Control System Design for Electric VehiclesMaster of Science Thesis in Embedded Electronic System Design
VICTOR PASSE
Chalmers University of TechnologyUniversity of GothenburgDepartment of Computer Science and EngineeringGoteborg, Sweden, June 2014

The Author grants to Chalmers University of Technology and University of Gothenburgthe non-exclusive right to publish the Work electronically and in a non-commercialpurpose make it accessible on the Internet. The Author warrants that he/she is theauthor to the Work, and warrants that the Work does not contain text, pictures orother material that violates copyright law.
The Author shall, when transferring the rights of the Work to a third party (forexample a publisher or a company), acknowledge the third party about this agreement.If the Author has signed a copyright agreement with a third party regarding the Work,the Author warrants hereby that he/she has obtained any necessary permission fromthis third party to let Chalmers University of Technology and University of Gothenburgstore the Work electronically and make it accessible on the Internet.
Developing the systems needed for an electric vehicle
The design, implementation and testing of the hardware and software needed topropel an electric vehicle with respect to efficiency, performance and safety.
VICTOR PÅSSEc© VICTOR PÅSSE, June
Examiner: Sven Knutsson
Chalmers University of TechnologyDepartment of Computer Science and EngineeringSE-412 96 GöteborgSwedenTelephone + 46 (0)31-772 1000
Cover: Picture of modified Sinclair C5 about which the thesis is basedDepartment of Computer Science and Engineering
Göteborg, Sweden June 2014

Abstract
The use of efficient vehicles is crucial to meet the populations mobility demands. It istherefore important to conduct research and development on, for example, electric vehi-cles to contribute to the continued evolution of these vehicles. In this master thesis anelectric vehicle has been fitted with developed hardware, such as motor drivers and con-trol computers with the purpose of controlling the vehicle with respect to performance,safety and efficiency. Several software features, such as torque vectoring and regenerativebreaking, has been implemented and evaluated. The resulting hardware and softwareworks as designed, performs well and can control the vehicle correctly and safely. Theresults of this report can and has been used to further develop other electric vehicles.


Acknowledgements
I, Victor Passe, a student at Chalmers Tekniska Hogskola, am extremely grateful to AFfor the confidence bestowed in me by entrusting and financing my project entitled ”MotorControl System Design for Electric Vehicles”. I would also like to express my gratitudeto my external supervisor Martin Lorne who has helped me through this project andguided me when problems has occurred. I would also like to thank many of the employ-ees at AF for their help as well as my internal supervisor Sven Knutsson for his guidance.
Victor Passe, Goteborg 14/05/28


Contents
1 Introduction 11.1 Background . . . . . . . . . . . . . . . . . . . . . . . . . . . . . . . . . . . 1
1.1.1 Vehicle . . . . . . . . . . . . . . . . . . . . . . . . . . . . . . . . . 11.2 Aims . . . . . . . . . . . . . . . . . . . . . . . . . . . . . . . . . . . . . . . 2
2 Method 32.1 System design . . . . . . . . . . . . . . . . . . . . . . . . . . . . . . . . . . 3
2.1.1 System layout . . . . . . . . . . . . . . . . . . . . . . . . . . . . . . 32.1.2 Operational margin . . . . . . . . . . . . . . . . . . . . . . . . . . 52.1.3 Fault containment . . . . . . . . . . . . . . . . . . . . . . . . . . . 52.1.4 Safety . . . . . . . . . . . . . . . . . . . . . . . . . . . . . . . . . . 52.1.5 Legal . . . . . . . . . . . . . . . . . . . . . . . . . . . . . . . . . . 62.1.6 CAN bus protocol . . . . . . . . . . . . . . . . . . . . . . . . . . . 6
2.2 Hardware . . . . . . . . . . . . . . . . . . . . . . . . . . . . . . . . . . . . 72.2.1 Hardware design tools . . . . . . . . . . . . . . . . . . . . . . . . . 72.2.2 MotorDriver . . . . . . . . . . . . . . . . . . . . . . . . . . . . . . 82.2.3 ControlComputer . . . . . . . . . . . . . . . . . . . . . . . . . . . . 82.2.4 FrontNode . . . . . . . . . . . . . . . . . . . . . . . . . . . . . . . . 8
2.3 Software . . . . . . . . . . . . . . . . . . . . . . . . . . . . . . . . . . . . . 92.3.1 Software design tools . . . . . . . . . . . . . . . . . . . . . . . . . . 92.3.2 MotorDriver . . . . . . . . . . . . . . . . . . . . . . . . . . . . . . 92.3.3 Anti Spin and Anti Lock Braking . . . . . . . . . . . . . . . . . . . 112.3.4 Electronic Stability Program . . . . . . . . . . . . . . . . . . . . . 112.3.5 Torque Vectoring . . . . . . . . . . . . . . . . . . . . . . . . . . . . 112.3.6 Regenerative Braking . . . . . . . . . . . . . . . . . . . . . . . . . 11
3 Results 143.1 Hardware . . . . . . . . . . . . . . . . . . . . . . . . . . . . . . . . . . . . 15
3.1.1 MotorDriver . . . . . . . . . . . . . . . . . . . . . . . . . . . . . . 153.1.2 ContolComputer . . . . . . . . . . . . . . . . . . . . . . . . . . . . 22
i

CONTENTS
3.1.3 FrontNode . . . . . . . . . . . . . . . . . . . . . . . . . . . . . . . . 243.1.4 SoftStart . . . . . . . . . . . . . . . . . . . . . . . . . . . . . . . . 273.1.5 Sensors . . . . . . . . . . . . . . . . . . . . . . . . . . . . . . . . . 293.1.6 SoundRacer . . . . . . . . . . . . . . . . . . . . . . . . . . . . . . . 29
3.2 Software . . . . . . . . . . . . . . . . . . . . . . . . . . . . . . . . . . . . . 303.2.1 Stability Program . . . . . . . . . . . . . . . . . . . . . . . . . . . 303.2.2 Torque Vectoring . . . . . . . . . . . . . . . . . . . . . . . . . . . . 323.2.3 Regenerative Breaking . . . . . . . . . . . . . . . . . . . . . . . . . 333.2.4 Anti Lock Breaking . . . . . . . . . . . . . . . . . . . . . . . . . . 333.2.5 Anti Spin . . . . . . . . . . . . . . . . . . . . . . . . . . . . . . . . 33
4 Discussion 34
5 Conclusion 36
Bibliography 37
ii
Abbreviations
BEMK Back ElectroMotive Force
BLDC BrushLess Direct Current
CAN Controller Area Network
EMI ElectroMagnetic Interference
ESD Electro Static Discharge
ESR Equivalent Series Resistance
IMU Inertial Measurement Unit
PCB Printed Circuit Board
PID Proportional Integral Derivative
PWM Pulse Width Modulated
RPM Revolutions Per Minute
RTOS Real Time Operating System
SD Secure Digital, memory card manufacturer
VGS Voltage from Gate to Source
iii

1Introduction
This master thesis has been executed at AF which is a consult company with consultantsin many different technical fields. The reason for AF to request this master thesis is touse the resulting vehicle as advertisement for the company at various gatherings and useit as an educational development platform for the employees.
1.1 Background
Electric vehicles are slowly replacing their internal combustion based counterparts andmay one day be the standard. It is therefore important to develop methods for controllingthe motors in electric vehicles in an efficient and safe way. This must be done from thelowest level of motor drivers to the highest level of the control systems to guarantee thesafety and efficiency of the whole motor control system.
1.1.1 Vehicle
AF currently have a modified Sinclair C5[1], which has been fitted with BLDC motorsin the rear wheels and a LiPo battery pack. An original Sinclair C5 is shown in Figure1.1 for reference.
1

1.2. AIMS CHAPTER 1. INTRODUCTION
Figure 1.1: A Sinclair C5, the mechanical base for this master thesis.
AF wants a new drive system for the vehicle that demonstrates some of the function-ality that could be implemented on a full-size electric vehicle such as different forms ofvehicle stabilization systems and regenerative breaking. The vehicle will, after comple-tion, be displayed in official events and be used as an educational platform for employeesand also for further development.
1.2 Aims
This master thesis aimed to develop the whole chain of both hardware and softwarecomponents needed to drive and control the electric motors located in the rear wheels ofa modified Sinclair C5 electric vehicle with regards to efficiency, performance and safety.This was done by developing and constructing two motor drivers, a central vehicle controlcomputer and several sensors. These units was connected via a local network. Softwarehave been developed to control the hardware and to aid the driver with vehicle handlingenhancement functionality.
2

2Method
2.1 System design
When designing a complex system it is important that the system is well structured anddesigned in a way which allows it to be expanded to include more subsystems if needed.Because of this, the system is designed to be modular, with each subsystem forming anode which is connected to the rest of the system via a bus. This design methodologyallows for more subsystems to be added to the system without making any changes tothe other subsystems. This also allows each subsystem to be independently modifiedas long as it is backwards compatible with respect to communication as the subsystemsonly share the bus and power.
2.1.1 System layout
The complete system is broken up into subsystems which reduces the complexity of thesystem. The subsystems are represented by the graph in Figure 2.1.
3

2.1. SYSTEM DESIGN CHAPTER 2. METHOD
ControlComputer
MotorDriver
FrontNode
MotorDriver
Wheel
Wheel
CANSoftStart
Bat
E-Stop
SteeringAngle
Front WheelSpeed
SoundRacer
48V
Brake &Throttle
PCBluetooth/USB
Figure 2.1: High level hardware system description
The main nodes in the system are
• MotorDriverBased on speed and torque values from the control computer, the motor driverdirects power from the battery to a motor. It also measures state data such asmotor rotational speed, motor current and battery voltage and sends it to thecontrol computer.
• ControlComputerThe control computer calculates target torque values for the motors using a set ofvehicle control programs based on vehicle state. It also sends vehicle state to a PCor other external device via Bluetooth or a serial link. The control computer alsohas the ability to log vehicle state to SD card and contains a local IMU to measurevehicle orientation and external forces.
• FrontNodeThe front node uses sensors to measure parameters such as throttle and brakepedal angle, steering angle and front wheel speed and sends these to the controlcomputer. It also controls the SoundRacer unit based on data from the controlcomputer.
• SoundRacerThis node designed and provided by AF generates the sound of an internal combus-tion engine based on a RPM value input. This unit will not be covered extensivelyin this report as it does not serve any functional purpose.
• SoftStartThe soft start limits the maximum current from the battery for the first second
4

2.1. SYSTEM DESIGN CHAPTER 2. METHOD
after start to reduce current inrush as an effect of the large decoupling capacitorslocated in the motor drivers. It also reads the dead-man’s handle and start/stopbutton and connects or disconnects the battery from the system accordingly.
2.1.2 Operational margin
One way to improve the reliability of a system is to design the given system with a highoperational margin, this means that all components should be able to survive a harsherenvironment than they will experience during normal operation. This method can beapplied to, for example, the components in the motor current path by increasing themaximum tolerated current above the maximum expected current. The same methodcan also be applied to software by adding code to cope with events that should nothappen when operating normally but that could appear in case of faults or failures.Many features like the one described has been implemented in the hardware and softwareof the vehicle.
2.1.3 Fault containment
If one node fails other nodes that don’t depend on the failed nodes services should notfail. This is called fault containment. As there are only small amounts of redundancy inthe system many of the faults will lead to a system failure. This is however not true forthe motor drivers as there are two motor drivers. The services provided by the motordrivers are power supply for the CAN bus, wheel state information and power to themotor. Some of these services such as supplying the CAN bus with power can be movedto the other motor driver in case of failure. This is implemented in the design.
2.1.4 Safety
One ever increasing design concern regarding vehicles is safety. As the vehicle can controlits own speed and brakes it is important that this is done in a safe way and according towhat the driver wants. Certain measures have been taken to decrease the probability thatthe vehicle misinterprets the drivers commands or fails due to errors. These measuresinclude:
• Giving the brake pedal precedence over the throttle pedal to allow the driver tobrake if the throttle pedal jams in an activated position.
• Detecting the failure of a sensor based on its reading.
• Shutting down the power to all subsystems if the driver falls of the vehicle.
• Defaulting sensitive data, such as throttle and torque, to a safe state if no newdata is present on the CAN bus for a certain amount of time.
5

2.1. SYSTEM DESIGN CHAPTER 2. METHOD
2.1.5 Legal
There are laws and regulations regarding vehicles like the one in this report. The vehicleis classified as a ”Bike without pedals” and must therefore comply with, among others,the following rules according to TSFS 2010:144 chapter 3 [2]:
• 2§ The vehicle should be steerable
• 3§ The vehicle should be safe and the driver should have a good view of thesurrounding
• 4§ The vehicle should be easy to operate
• 5§ The vehicle should be able to be turned on and off
• 9§ The vehicle should be at most 1.6x0.75m in area
• 11§ The vehicle should be able to decelerate with a retardation of at least 3ms2
• 12§ The vehicle should brake if the throttle is released
• 13§ The vehicle should have a parking brake that is able to hold the vehicle at astandstill on a inclination of 15◦
There are other regulation as well but only a subset of the rules will be covered in thisreport. Most of the rules are basic and the vehicle comply with those rules automatically,these rules are for example paragraph 2-5. The vehicle have been designed to complywith the rules 11 and 13 by ensuring that the brakes are strong enough and that someobject, for example a battery, can be removed and used as a parking brake by puttingit in front of a tire. The measurements of the braking force is covered in 3.1.1. Thereare two paragraphs that the vehicle does not comply, namely 9 and 12, the vehicle is1.8x0.8m and does not brake when the throttle is released. Compliance with paragraph12 can be easily implemented in software but it would not be suitable for this type ofvehicle as the throttle and brake should behave as they do in a car. Applying the brakeswhen the throttle is released could result in a vehicle that is difficult to operate and thevehicle would thereby break paragraph 4. All things considered, the vehicle is not legallyallowed to operate on public roads as it is too large and does not engage the brakes whenthe driver releases the throttle.
2.1.6 CAN bus protocol
All nodes need to either send or receive vehicle state data to or from other nodes, thisis done by using a CAN bus. CAN only specify the lowest level of the communicationstandard and there exist several protocols for use on a CAN bus. This project uses nopreviously existing protocol but instead utilizes the fact that the only data to be sent onthe CAN bus are scalars describing some form of sensor reading or signal to an actuator.A CAN frame contains, among other parts, an id field and a payload section which can
6

2.2. HARDWARE CHAPTER 2. METHOD
be up to 8 bytes long. Each scalar that are to be sent are given a unique identifier whichis used as the id when sending that scalar on the CAN bus. The scalar itself is placed inthe payload section and the format for the scalar can be signed or unsigned 8, 16 or 32bitfixpoint or a IEEE 754 float. Several scalars can be placed in the same package if thesize does not exceed 8 bytes. This should however only be done if the scalars are closelyrelated otherwise the readability could be degraded. There are many other standards touse but most of them rely on a state full system to send the CAN packages eg. severalCAN frames are needed to make up a single data transmission. By implementing a stateless CAN transmission system the drawbacks of a state full system, such as complexityand liability to crash or hang, can be mitigated.
2.2 Hardware
The hardware design process starts with the specifications of the system and results infinished hardware that fulfills the specifications. The process can be split up in to severalsteps such as
• High level system design, the entire system is broken up in to self contained sub-systems that interact with each other.
• Low level system design, the components needed in each subsystem are identified.
• PCB schematic design, the schematics of PCBs in each subsystem are designed.
• PCB layout design, the layout of PCBs in each subsystem are designed.
• Subsystem testing, each subsystem is tested to ensure that it works according tothe specifications.
• System testing, the final system is tested to ensure that it works according to thespecifications.
If some subsystem does not fulfill the specifications when tested, there are threemethods that can be used to make the system fulfill the specifications. The subsystemcan be modified, redesigned or the specifications can be changed. To execute the PCBrelated design steps a PCB design tool is needed, the other steps does not require anyspecial design tools.
2.2.1 Hardware design tools
The PCBs covered in this report has been designed in CadSoft EAGLE [3], which canbe used in a free and limited mode to design non-commercial 2 layer PCBs that aresmaller than 100x80mm. There are other similar tools such as KiCad [4] as well as moreprofessional tools that requires a purchased license such as Altium Designer [5]. Thedecision to use EAGLE is based on previous knowledge of that software.
7

2.2. HARDWARE CHAPTER 2. METHOD
2.2.2 MotorDriver
The motor driver hardware subsystem takes power from the battery and drives themotor based on data coming from the CAN bus. The motor driver is implemented ontwo PCBs, the power driver and the control board. The design decision to separate theboard is taken to increase the distance between the power driver, which generates highamounts of EMI, and the control board, which is sensitive to EMI. This separation alsomakes it easier to insert ferrite material around the cable that connect the PCBs to limitthe amount of conducted high frequency noise. The power driver contains all the highcurrent components such as MOSFETs, MOSFET drivers, DC/DC converters, fuses,current sensor and so on. The control board contains all the control related componentssuch as the Cortex M3 based microcontroller, CAN transceiver and filters. The powerdriver PCB uses a thicker copper layer of 105µm compared to the 35µm of the controlboard, this is to reduce the inductance and resistance of the high current traces to reducethe EMI and power loss. The two PCBs are stacked and mounted in a water tight boxwith space for a fan to increase the cooling if needed.
2.2.3 ControlComputer
The control computer subsystem is the main computer which executes all the vehiclestability software. It is implemented on a single PCB that contains the Cortex M4 basedmicrocontroller, an IMU to measure force and rotation rate of the vehicle, power supplyto supply power locally in the node, micro SD card to log data on, bluetooth to sendlogged data via and CAN transceiver to interface to the CAN bus. There are some pointsof concern on this PCB such as the decoupling for the microcontroller as it runs at ahigh frequency of 168MHz and requires high current peaks. Another point of concernis the bluetooth antenna which requires a special shape of the ground plane for properoperation.
2.2.4 FrontNode
The front node hardware subsystem has two different purposes. It reads sensor outputsand reports their value on the CAN bus and it reads engine RPM on the CAN bus andsends it to the SoundRacer subsystem. The SoundRacer contains a CAN transceiver,however no code for utilizing it is currently available, this is the reason for connecting theSoundRacer via the front node. The front node subsystem is implemented on a singlePCB on which a power supply to supply power locally in the node, microcontroller torun the software and input filters for all the sensors are mounted. The input filtersare designed in such a way that they can be implemented as a lowpass filter, highpassfilter, voltage divider or any combination out of those depending on the type of sensorconnected to the front node. For example the reading from a sensor with a 0-10V signaloutput could be scaled to 0-3V, the ADC range, and lowpass filtered to avoid aliasingof high frequency noise. The front node is designed to be a general purpose unit with 8analog inputs, 12 digital inputs/outputs, 2 open-drain outputs and a CAN bus.
8

2.3. SOFTWARE CHAPTER 2. METHOD
2.3 Software
Most of the subsystems in the vehicle needs software to define their behaviour. Thedifferent purposes of the subsystems results in different demands of the software runningon the subsystems. For example the motor driver needs the software to meet tightdeadlines for the commutations to run smoothly, these deadlines are in the order ofmicroseconds. The control computer needs many pieces of software such as vehiclecontrol tasks and communications tasks to run independently of each other with quiteloose deadlines, typically a few milliseconds. The requirements of the control computerallows for the use of a RTOS to simplify the software development while the motor driverwould not get the benefits of a RTOS.
2.3.1 Software design tools
There are two types of software related to the vehicle, the software running on thevehicle and the software running outside of the vehicle. The software running on thevehicle includes the code in the motor driver, control computer and front node whichare written in C using the ”CooCox” IDE [6] whereas the software running outside ofthe vehicle includes the monitoring program running on a PC which is written in C# [7]using VisualStudioExpress C# [8]. C was chosen for all the on vehicle software as it isthe largest industry standard and supported by most IDEs targeting the microcontrollersused in the vehicle. Instead of using CooCox, Eclipse, arm-gcc and openOCD can beused to achieve the same results. C# was chosen for the PC based program because ofprevious knowledge and familiarity with the syntax and IDE. The control computer runsthe real time operating system CoOs [9], there are many alternatives such as chibios andfreeRTOS but CoOs was chosen because of previous familiarity with that RTOS.
2.3.2 MotorDriver
The motor drivers software is 100% interrupt driven, meaning that when an event occursthat needs CPU time that event is executed if no other event of higher priority is currentlyexecuted. This allows for some form of priority based execution of code but if the CPUburden is too high then events may be delayed. There are several types of events that canoccur, for example the Hall-effect sensors, reading the angle of the rotor in the motor willtrigger the highest priority interrupt when the motor driver needs to do a commutationwhile some events are time driven and of lower priority such as sending data to the CANbus.
With the equation 2.5, derived from equation 2.4, 2.3, 2.2 and 2.1, it is shown thatthe torque of the motor can be controlled by choosing a duty cycle based on the batteryvoltage, motor RPM and Kv. Kv is a constant and the battery voltage and RPM aremeasured. This allows the motor driver to receive an input torque value and drive themotor accordingly for both positive and negative values of input torque. A positivetorque would result in acceleration and using power from the battery while a negative
9

2.3. SOFTWARE CHAPTER 2. METHOD
torque would result in a deceleration and charging of the battery using power from themotor.
τMotor = Kt ∗ IMotor (2.1)
in whichTMotor Motor TorqueKt Nm per A Motor ConstantIMotor Motor Current
IMotor =VDriver − VBEMK
RMotor(2.2)
in whichIMotor Motor CurrentVDriver Driver Output VoltageVBEMK Motor Back ElectroMotive ForceRMotor Motor Resistance
VDriver = Dutycycle ∗ VBattery (2.3)
in whichVDriver Driver Output VoltageDutycycle Driver Duty CycleVBattery Battery Voltage
VBEMK = RPM ∗Kv (2.4)
in whichVBEMK Motor Back ElectroMotive ForceRPM Motor Revolutions Per MinuteKv V per RPM Motor Constant
τMotor ∝ (Dutycycle ∗ VBattery)− (RPM ∗Kv) (2.5)
in whichTMotor Motor TorqueDutycycle Driver Duty CycleVBattery Battery VoltageRPM Motor Revolutions Per MinuteKv V per RPM Motor Constant
10

2.3. SOFTWARE CHAPTER 2. METHOD
2.3.3 Anti Spin and Anti Lock Braking
Anti spin and anti lock braking are forms of traction control systems. Traction controltries to avoid loosing traction by reducing the torque signal to the motors when tractionis lost. This is done by monitoring the front wheel speed and the rear wheel speeds, ifthere is a large enough difference between the speed values then traction is assumed tobe lost as any of the wheels are rotating too fast or slow. When this happens the torquesignal to that wheel is reduced which allows the tires to slow catch up with the vehiclespeed grip the ground more effectively.
2.3.4 Electronic Stability Program
The driver commanded yaw rate of the vehicle is a function of the steering wheel de-flection angle and the vehicle speed. In reality this is not the case as the vehicle canundersteer and oversteer. This means that the vehicle is turning less or more than thedriver wants. The yaw rate of the car can be measured as well as the speed and steeringwheel angle to calculate if the car is steering too much or too little and the differentialmode signal to the rear wheel torque values can by used to correct the unwanted yawrate. This is done by the ESP or Electronic Stability Program.
2.3.5 Torque Vectoring
To enhance the steering performance of the vehicle the rear wheels can be used to increaseor decrease the yaw rate by adding a differential mode torque signal to the rear wheels.The magnitude of the torque signal can be a function of any vehicle state informationsuch as steering angle deflection and speed. By implementing Torque Vectoring thecontrol envelope of the vehicle can be increased.
2.3.6 Regenerative Braking
To lower the speed of the vehicle some of its kinetic energy must be transformed to eitherheat which is the conventional form of braking or chemical energy in the battery which isrefereed to as regenerative braking. Regenerative braking stores the energy of the vehiclein the batteries and that energy can later be used to accelerate the vehicle. This formof braking is preferred over conventional braking as it is more efficient and produces lessheat. The voltage generated by the motor, VBEMK , as it spins can be estimated by theequation 2.6. This voltage will normally be lower than the battery voltage which meansthat the voltage generated from the motor needs to be boosted to a higher voltage thanthat of the battery in order to charge the battery. This can be accomplished by usingthe coils in the motor as the inductors in a multiphase boost topology power converter.
VBEMK =RPM
Kv(2.6)
in whichVBEMK Motor Back ElectroMotive Force
11

2.3. SOFTWARE CHAPTER 2. METHOD
RPM Motor Revolutions Per MinuteKv V per RPM Motor Constant
The motor driver can be modelled by 6 switches as shown in Figure 2.2. This modelwill be used to describe the process of boosting the voltage from the motor to chargethe battery which can be broken down to the following two states.
• State 1. Close switch S4 and S2, current will build up in the coils connected to S4and S2 given that the motor spins.
• State 2. Close switch S4 and S1, the current that has been built up in the coilswill circulate in the loop connecting S1, the battery, S4 and the coils themselves.This will charge the battery with the energy previously stored in the coils.
The ratio of the time spent in the respective states controls the amount of current usedto charge the battery. The maximum charge current is bounded by the rotational speedof the motor according to equation 2.7 in which RMOTOR is the resistance of a motorcoil, RDRIV ER is the total resistance of the motor driver and RBATTERY is the resistanceof the battery. To brake with a force over the regenerative bound is possible by applyingthe mechanical brakes. This can however only be done by the driver as the vehicle cannotcontrol the mechanical brakes by itself.
Figure 2.2: Model of motor driver for regenerative braking
12

2.3. SOFTWARE CHAPTER 2. METHOD
IMax =VBEMK
2 ∗ (RMotor +RDriver +RBattery)(2.7)
in whichIMax Maximum Brakeing CurrentVBEMK Motor Back ElectroMotive ForceRMotor Motor ResistanceRDriver Driver ResistanceRBattery Battery Resistance
13

3Results
The completed vehicle is shown in Figure 3.1. In this final configuration all of theelectronics are mounted, the chassis has been reworked to accommodate the motors andthe body has been painted.
Figure 3.1: The final Vehicle
Determining whether or not the goals has been fulfilled requires evaluation of theresults with respect to the projects aim. The results can be broken down in severalsegments such as hardware, software and control systems and the method for evaluating
14

3.1. HARDWARE CHAPTER 3. RESULTS
the success of the results depends on the type of system being evaluated.Hardware can typically be evaluated based on the specifications and whether or not
the hardware passes each part of the specification. To give a more complete pictureof the performance of the hardware, tests need to be carried out in different types ofenvironments by for example varying the supply voltage, temperature and amount ofvibration to simulate a range of operating conditions. The methods used to test thehardware on the vehicle are depending on the subsystem and are covered in the resultsection for the particular subsystem.
Software can be tested by creating test vectors for the functions and comparingthe observed output with the desired output for the given vectors. Another, similar,method is simulating sensor inputs to excite the system and observing the outputs, thisis basically the same thing as mentioned previously but the complete system is testedinstead of subsystems of the software. The methods used for testing the software runningon the vehicle are quite basic and not formally complete. The general method used couldbe described as a empirical test method or ”if it seems to work, it is deemed working”.
The control systems has been evaluated by driving the vehicle with and without themand comparing logs of sensor reading to determine if any gain in performance has beenachieved.
3.1 Hardware
All of the hardware mentioned in section 2.2 has been fully implemented and tested.The different hardware subsystems has been tested to varying degrees. Simple hardwaresubsystems such as the sensors and front node has been verified to work but not testedfor a range of different environmental parameters. More complex hardware subsystemssuch as the motor driver subsystem has been rigorously tested using a mechanical motorbrake bench and tested in the full input voltage range and temperature range from about-20◦C to 40◦C ambient temperature.
3.1.1 MotorDriver
The motor driver is the most stressed piece of hardware as it has to control a highamount of power in a controlled and correct way for the vehicle to function. Any designflaws in the critical parts of the motor driver will have a high risk of resulting in a failureof the motor driver as many components are highly loaded and slight timing variationscan result in cross conduction in MOSFETS and thereby a critical failure. Because ofthis sensitivity to errors it is important to test and verify the motor driver thoroughly.
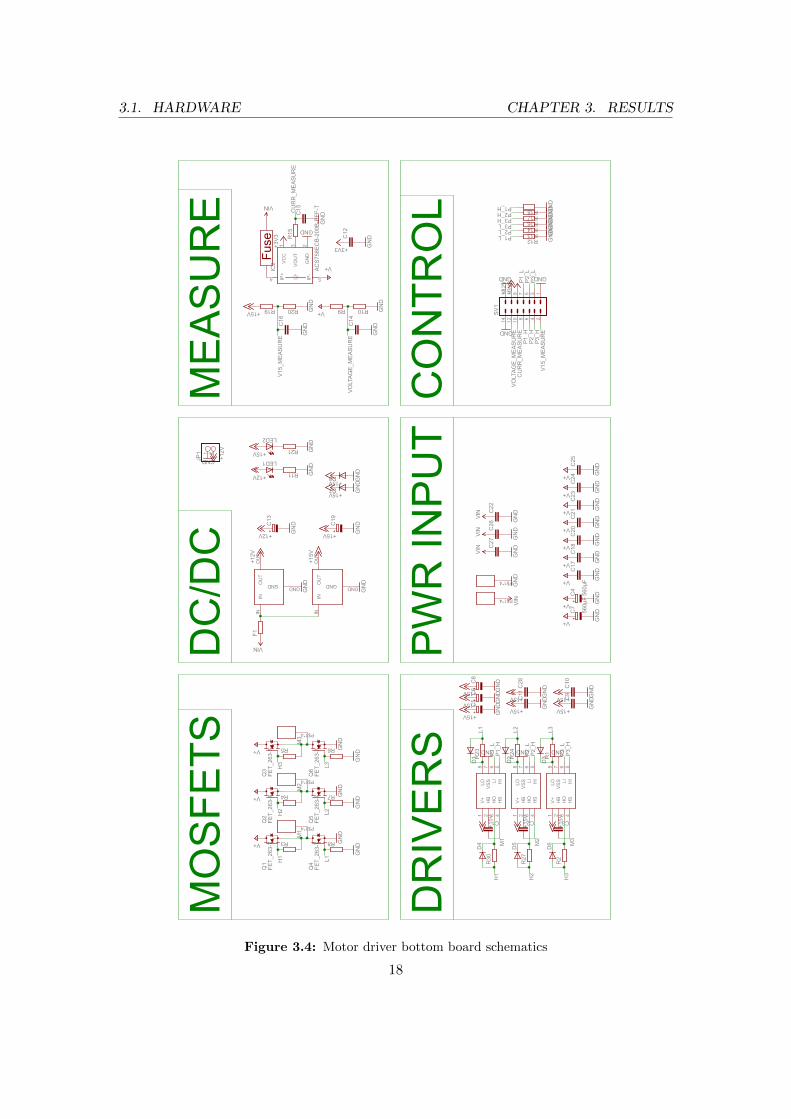
The schematics and PCB layouts for the driver and controlBoard is shown in Figure3.4, 3.5, 3.2 and 3.3 respectively.
The schematics for the controlBoard, seen in Figure 3.2, contains several sectionssuch as CAN transceiver, power regulation, Hall sensor filtering and the microcontroller.By splitting the schematic into different parts the complexity of each part is loweredmaking the reading and understanding of the schematics easier.
15

3.1. HARDWARE CHAPTER 3. RESULTS
GNDGND
GND
+3V3
+12V
GND
GND
+12V
+5V
+3V3
+3V3
7805DT
+5V
+3V3
+3V3
+3V3
+3V3
GND GND GNDGND
GND
GND
GND
+12V
+5V
+3V3
+5V
GND
GND
GND
GND
GNDGNDGND
+3V3
+3V3
GND
+5V
GNDGND +12V
GND +5V
GND
+5V GND
GND
+12V
GND
GND
GND
+3V3
GND
+3V3
GND
+3V3
GND
+3V3GNDG
NDG
ND
GND
GND
+5V
+3V3
GND
GND GND
SOLD
ERJU
MPE
RNO
SOLD
ERJU
MPE
RNO
+3V3
+3V3
+3V3
SOLD
ERJU
MPE
RNO
+5V
+12V
SWITCH-M
OMEN
TARY-2
GND
SV1
135791113
2461214 810
GND
18
VCC
19
OSC_IN(PD0)
2
OSC_O
UT(PD1)
3
NRST
4
AGND
5
AVCC
6
PA0(ADC12_0/TIM2_CH1_ETR
*)7
PA1(ADC12_1/TIM2_CH2*)
8
PA2(ADC12_2/TX2/TIM2_CH3)
9
PA3(ADC12_3/RX2/TIM2_CH4)
10
PA4(ADC12_4/UART2
_CK)
11
PA5(ADC12_5/SPI1_S
CK*)
12
PA6(ADC12_6/SPI1_M
ISO*/TIM3_CH1*)
13
PA7(ADC12_7/SPI1_M
OSI*/TIM3_CH2*)
14
PB0(ADC12_8/TIM3_CH3)
15
PB1(ADC12_9/TIM3_CH4)
16
PB2(BOOT1
)17
PA8(TIM1_CH1/UART1
_CK)
20
PA9(TX
1*/TIM1_CH2)
21
PA10(RX1*/TIM1_CH3)
22
PA11(CANRX*/USB-/T
IM1_CH4)
23
PA12(CANTX
*/USB+)
24
PA13(JTM
S/SWDIO)
25
GND
26
VCC
27
PA14(JTC
K/SWDCLK
)28
PA15(JTD
I)29
PB3(JTDO)
30
PB4(JN
TRST)
31
PB5
32
PB6(I2C1_SCL/TIM4_CH1)
33
PB7(I2C1_SDA/TIM4_CH2)
34
BOOT0
35
GND
36
VCC
1
U1
STM32F1
03Tx
P$1
1
P$2
2
P$3
3
P$4
4
P$5
5
P$1
1P$2
2P$3
3P$4
4P$5
5
P$1
1P$2
2P$3
3P$4
4P$5
5
IC1
ADJ
INOUT
IC3
GND
VI
1
3
VO
2
C1
C2
C3
R1
C4
R3
C5
R5
C6
R7
C7
TXD
1
VSS
2
VDD
3
RXD
4VREF
5CANL
6CANH
7RS
8R8
C8
C9
Q6 C16
C17
C10
C11
C12
C13
LED1 R9
LED2 R10
LED3 R11
LED4 R12
LED5 R13
LED6 R14
R15
SJ1
SJ2
SJ3
S1
CURR_M
EASU
RE
CURR_M
EASU
RE
VOLTAG
E_MEA
SURE
VOLTAG
E_MEA
SURE
V15_MEA
SURE
V15_MEA
SURE
PWM1
PWM1
PWM2
PWM2
PWM3
PWM3
PWM3N
PWM3N
PWM2N
PWM2N
HAL
L1
HAL
L1
HAL
L2
HAL
L2
HAL
L3
HAL
L3SW
DIO
SWDIO
SWDCLK
SWDCLK
RES
ET
RES
ET
RESET
PWM1N
PWM1N
CAN
RX
CAN
RX CAN
TX
CAN
TX
OSC1
OSC
1
OSC2
OSC
2
LED1
LED1
LED2 LED2LED3
LED3
LED0
LED0
+
+
+
CAN
STM
32
PWR
HALL
DRIVER
Figure 3.2: Motor driver ControlBoard schematics
16

3.1. HARDWARE CHAPTER 3. RESULTS
The layout of the the control board, seen in Figure 3.3, did not require any specialcare except for keeping the linear voltage regulators at a low temperature. This wasaccomplished by placing solid copper planes connected via several thermally conductivevias to the pins of the voltage regulators that are the carrier for the silicon substrateand thereby lowering the thermal resistance from silicon die to ambient air. This designmethod for keeping the components generating a lot of heat at a low temperature ispresent through out all of the PCB designs.
1412
Figure 3.3: Motor driver control board layout
The schematic for the driver board, seen in Figure 3.4, contains several sections, justas the control board schematic. The more interesting sections are the MOSFETs sectionwhich contains the motor driving MOSFETs and the drivers section which contains theMOSFET drivers and their decoupling. It is important that the MOSFET drivers arecorrectly decoupled as they drive high peak currents into the gate of each MOSFET.The MOSFET drivers supply voltage must not exceed 14V as the drivers would thenbe destroyed or fall below 8V as the MOSFETs would not turn on completely. Thedriver board supplies power to all other boards on the vehicle, this is done by usingswitch regulators to lower the main battery voltage of about 48V to 12V for the gatedrivers and 5V for all the other nodes. Another important feature of the driver boardschematics is the presence of low impedance ceramic capacitors and bulk electrolyticcapacitors, these are added to minimize the current running along the supply wires tothe driver at high frequencies. Most of the high frequency power needed to drive theMOSFETs on and off quickly are supplied by these ceramic capacitors. The mediumfrequency power is supplied by the large electrolytic capacitors and the low frequenciesare supplied by the batteries. This allows the current running on the cables betweenthe batteries and drivers to be frequency limited and thereby reducing the EMI of thecables.
17
3.1. HARDWARE CHAPTER 3. RESULTS
GND GND GND
FET_
263-
7FE
T_26
3-7
FET_
263-
7
FET_
263-
7FE
T_26
3-7
FET_
263-
7
GN
DG
ND
GN
D
V+
V+
V+G
ND
GN
DG
ND
GN
D
560µ
F
V+ GN
D
560µ
F
V+ GN
D
+15V
+15V GN
DG
ND
GN
DGN
D
GN
D
ACS7
58EC
B-20
0B-P
FF-T
GN
D
+15V
+15V GN
D
+15V GN
D
GN
D
+3V3
+3V3
V+
+15V
+15V
+15V
+15V
+15V
+15V
+15V
+12V
+12V GN
D
GN
D
GND
GN
D
GN
D
GND
GND
GND
+3V3
V+ GN
DG
ND
+12V
GN
DGN
DGN
DGN
DGN
DGN
D
GN
DG
ND
+15V
GN
DG
ND
+12V
+15V
V+
V+
GN
DG
ND
V+
V+G
ND
GN
DV+ G
ND
V+
V+
GN
DG
ND
GN
DG
ND
GN
D
VIN
VIN
VIN
VIN
VIN
VIN
+12V
GND
+15V GN
D+15V GN
D
V+
1
HB
2
HO
3
HS
4H
I5
LI6
VS
S7
LO8
V+
1
HB
2
HO
3
HS
4H
I5
LI6
VS
S7
LO8
C1 C2
R23
R24
R27
R30
V+
1
HB
2
HO
3
HS
4H
I5
LI6
VS
S7
LO8
C3
R1
R2
Q1
Q2
Q3
Q4
Q5
Q6
R3
R4
R5 R6
R7
R8
D1
D2
D3
D4
D5
D6
C4
C7
C9
C10
C11
IC2
IP-
IP+ 54
GN
D2
VC
C1
VO
UT
3R
15C
15
C19
C28
F1
C12
C5
C6
C8
P$1*4
P$1*4
P$1*4
P$1*4
P$1*4
SV1
135791113
2461214 810
ININ
OU
TO
UT
GND GND
ININ
OU
TO
UT
GND GND
C13
R9 R10
C14
R12R13R14R16R17R18
R19 R20
C16
LED1
LED2
R11
R21
C17
C18
C20
C21
C23
C24
C25
C22
C26
C27
JP1 1 2
D7
D8
M1M
1
M2
M2
L1
L1
H1
H1
H2
H2
L2
L2
P1_H
P1_H
P1_H
P1_L
P1_L
P1_L
H3
H3
M3
M3
L3
L3
P3_L
P3_L
P3_L
P3_H
P3_H
P3_H
P2_H
P2_H
P2_H
P2_L
P2_L
P2_L
CU
RR
_MEA
SUR
E
CU
RR
_MEA
SUR
E
VOLT
AGE_
MEA
SUR
E
VOLT
AGE_
MEA
SUR
E
V15_
MEA
SUR
E
V15_
MEA
SUR
E
+
+
+
Fuse
+
+
+
+
MO
SFE
TSD
C/D
C
DR
IVE
RS
PW
R IN
PU
T
ME
AS
UR
E
CO
NTR
OL
Figure 3.4: Motor driver bottom board schematics
18

3.1. HARDWARE CHAPTER 3. RESULTS
The layout of the the driver board, seen in Figure 3.5 contains several importantfeatures. The main objective of the driver board is to supply the motor with powerin a controlled fashion without producing too much EMI or heat. This was done byminimizing the resistance and inductance of the traces that carries the high currents.The highest current is present on the traces that connect the MOSFETs to the motorwindings, this current can be much higher than the current from the battery as thedriver and motor operates as a buck converter. This is especially true when the motoris running at low speeds as the BEMK of the motor is low. The motor driver and motorcan be seen as a buck converter driving the BEMK and when the BEMK is low and dutycycle high the current on the traces running from the MOSFETS to the motor can reachseveral hundred amperes. The simplest way of minimizing the resistance and inductanceof a trace is to make the cross sectional area of the trace as large as possible and thetrace length as short as possible, this has been done by using a thick copper layer of105µm and a trace width of about 10mm. The traces connecting the MOSFETs to themain power input are also as wide, thick and short as possible, some parts of these traceshave their stop-mask removed and a thick coating of solder added to further reduce theresistance and inductance. Another trick to lower the resistance and inductance of atrace is to route the same trace on several layers of the board, only two layers can beused on this board as it only contains two layers, routing traces on both sides of theboard has been done for some high current segments. Another important aspect of thePCB layout is to place the ceramic and electrolytic capacitors close to the MOSFETsand power terminals to reduce the path length of the high frequency currents as thosegenerates high amounts of EMI. Having a too low impedance path to the low impedanceceramic capacitors can however be bad as the currents will have higher slew rates whichalso generates EMI. There are another design concern regarding the layout of the driverboard, namely thermal performance. The MOSFETs, electrolytic capacitors and to someextent the MOSFETs drivers generates heat which must be dissipated in some way. Themotor driver node is enclosed in a watertight box which restricts the possibility of coolingthe components. The only way to cool it is to try to keep the thermal resistance of thedriver board as low as possible to allow heat to go from the heat generating componentsto the entire PCB and use the larger surface are of the PCB to radiate and conduct theheat to the enclosure and thereby keeping the temperature of the hottest components aslow as possible. The temperature in the enclosure is monitored and the highest notedtemperature inside the box is only a few degrees higher than that of the outside. Themounting holes on the PCB are positioned to allow the PCB to be mounted in a specificbox.
19

3.1. HARDWARE CHAPTER 3. RESULTS
1412
Figure 3.5: Motor driver driver board layout
Testing and verification of the hardware was done by first testing every feature with-out any load such as the sensors, MOSFET drivers, commutation timing and MOSFETgate rise/fall time. The most critical things to test are the MOSFET gate rise/fall curve,if the gate drive circuitry is not correctly designed the MOSFETs can either turn on/offto slow and thereby be operating in the resistive region and waste power or turn on andoff several times resulting in excessive ringing on the VGS voltage. It is also importantto have the right amount of dead-time when changing the active transistor in each half-bridge, if the dead-time is lower than the rise time and the reverse recovery time of thebody diodes in the MOSFETs cross conduction will occur, potentially destroying thedriver, and if the dead-time is too high excessive amounts of power will be dissipated inthe drivers as the efficiency is lowered.
The performance of the motor driver perceived by the user can be split in two -acceleration and retardation. The retardation has been measured by logging key vehiclestate data such as speed, pedal engagement and acceleration while braking the vehiclefrom full speed to a standstill at a reasonable pedal engagement. The results of this testare shown in Figure 3.6. The minimum retardation according to the law is marked toshow that the retardation performance is as required. The legal aspects are covered in2.1.5.
20

3.1. HARDWARE CHAPTER 3. RESULTS
0 2 4 6 8 10 12 14−4
−2
0
2
4
6
8
Time[s]
Spe
ed[m
/s],L
Eng
agem
ent[0−
1]La
ndLA
ccel
erat
ion[
m/s
2 ]
Speed[m/s]
BrakeLpedalLengagement[0−1]
Acceleration[m/s2]LegalLlimit[m/s]
Figure 3.6: Plot of vehicle state while breaking from full speed
As seen in Figure 3.6 the time it takes to brake the vehicle from its top speed of about8m
s is about 3s which gives a mean retardation of about 2.7ms2
and peak retardationof about 3.5m
s2which is sufficient as any higher levels of retardation would not feel
comfortable in the vehicle, nor is it required by law.The acceleration has also been measured by logging key vehicle states such as speed,
pedal engagement and acceleration while accelerating the vehicle from a standstill to fullspeed at a reasonable pedal engagement. The results of this test are shown in Figure3.7. The acceleration ramps up with the pedal engagement and evens out at about 2m
s2
until the continued acceleration would require a higher battery voltage and as a resultof the limited battery voltage the acceleration falls down to zero as the vehicles speedevens out at the maximum speed of about 8m
s . An acceleration of about 2ms2
is sufficientbut higher acceleration can be attained by changing the maximum current allowed tothe motors, the motor drivers has been tested up to about three times higher currentthat those attained in this test.
21

3.1. HARDWARE CHAPTER 3. RESULTS
00
1
2
3
4
5
6
7
8
Spe
ed[m
/s],C
Eng
agem
ent[0−
1]Ca
ndCA
ccel
erat
ion[
m/s
2 ]
1 2 3 4 5 6 7−5
0
5
10
15
20
25
30
35
Cur
rent
[A]
Time[s]
Speed[m/s]
ThrottleCpedalCengagement[0−1]
Acceleration[m/s2]Current[A]
Figure 3.7: Plot of vehicle state while accelerating to full speed
3.1.2 ContolComputer
The Control computer contains a powerful, floating point capable Cortex M4[10] basedmicrocontroller from ST Microelectronics, IMU(gyro and accelerometer), SD card socket,bluetooth module, CAN transceiver and power regulation as well as some other miscel-laneous parts. A powerful microcontroller is needed in the control computer node toexecute the vehicle control programs in floating point math at high speed and to becapable of running potential future software.
The schematics of the control computer is shown in Figure 3.8. The microcontrollerhas many unused pins. This is because most microcontrollers with a CPU running athigh speed are packaged in high pin count packages. The control computer needs muchcomputing power but only a few GPIOs which leads to many unused pins as there wereno microcontrollers available from ST with the M4 cortex core and few GPIOs at thetime when the control computer was designed.
22

3.1. HARDWARE CHAPTER 3. RESULTS
STM32F405RGT6
GND
+3V3
+3V3
+3V3
+3V3
+3V3
+3V3
+3V3
MPU6050
GND
GND
GND
GND
GND
GND GND GND
GND
GND
GNDGND +12V
GND +5V
GND
+5V GND
GND
+12V
GND
GND
+12V
+5V
+3V3
+3V3
7805DT
+5V
GND
GND
GND
+12V
+5V
+3V3
GNDGND
+5V
+3V3
GND
GND
+3V3
GND
+3V3
GND
+3V3
GND
+3V3
GND
GND
+3V3
GNDGNDGND
USD-SOCKETNEW
GNDGNDGNDGND
+3V3
GND
GND
+3V3
+3V3
+3V3
+3V3
+3V3
+3V3
GND
GND
SOLDERJUMPERNO
+5V
+12V
VDDA
13
VDD_2
32
VDD_3
48
VDD_4
19
VDD
64
VBAT
1
PC13
2
PC14
3
PC15
4
PH0
5
PH1
6
NRST
7
PC0
8
PC1
9
PC2
10
PC3
11
PA0_WKUP
14
PA1
15
PA2
16
PA3
17
PA4
20
PA5
21
PA6
22
PA7
23
PC4
24
PC5
25
PB0
26
PB1
27
PB2
28
PB10
29
PB11
30
VCAP_1
31
VSSA
12
VSS_2
63
VSS
18
PB12
33PB13
34PB14
35PB15
36PC6
37PC7
38PC8
39PC9
40PA8
41PA9
42PA10
43PA11
44PA12
45PA13
46VCAP_2
47PA14
49PA15
50PC10
51PC11
52PC12
53PD2
54PB3
55PB4
56PB5
57PB6
58PB7
59BOOT0
60PB8
61PB9
62
U1
PI1
1PI2
2PI3
3PI4
4PI5
5
R7
U3
CLKIN
1
VLOGIC
8
AD0
9
REGOUT
10
RESV-G
11INT
12
SDA
24
SCL
23
CPOUT
20
GND
18
VDD
13
C1
C2
PI1
1
PI2
2
PI3
3
PI4
4
PI5
5
TXD
1
VSS
2
VDD
3
RXD
4VREF
5CANL
6CANH
7RS
8R8
C8
C9
C3C4
IC1
ADJ
INOUT
IC3
GND
VI1
3
VO2
C5C6C7
LED4 R12
LED5 R13
C10
C11
C12
R1
R2
C13
TX14
RX
13
CTS
11
RTS
12
GND
7VIN
8
C14
LED1 R3
LED2 R4
LED3 R5
U2
CS 2
DI 3
GND 6
VCC 4
SCK 5
RSV 8DO 7
NC 1
SHIELD GND1
SHIELD GND3
SHIELD CD1
SHIELD CD2
C15
Q6 C16
C17
R6SJ1
SWDIO
SWDIO
RESET
RESET
RESET
SDA
SDA
SDA
SCL
SCL
SCL
SWCLK
SWCLK
CAN_RX
CAN_RX
CAN_TX
CAN_TX
OSC1
OSC1
OSC2
OSC2
BT_RX
BT_RX
BT_TX
BT_TX
LED2
LED2
LED3
LED3
LED1
LED1
SD_MISO
SD_MISO
SD_MOSI
SD_MOSI
SD_SS
SD_SS
SD_SCK
SD_SCK
+
+
+
PWR
STM
BT
IMU
CAN
SD
Figure 3.8: Control computer schematics
23

3.1. HARDWARE CHAPTER 3. RESULTS
The PCB layout of the control computer is shown in Figure 3.9. There are somedesign decisions behind the PCB layout. These include removing the ground planesaround the antenna of the bluetooth module, placing the IMU at right angles relativeto the enclosure as the enclosure is placed at right angles relative to the lateral andlongitudinal directions of the vehicle which removes the need of applying any coordinatetranform to the data from the IMU and placing many decoupling capacitors close to themicrocontrollers voltage supply pins. There are many LEDs located on the PCB. This isto make debugging code and hardware easier as the microcontroller can show the stateof different variables or which part of the code that is currently being executed with theLEDs. Two LEDs are connected to the voltage rails. This allows the user to quicklyevaluate if the voltage rails are at the correct voltage or not. Most of the PCBs in themore complex nodes have many LEDs to ease debugging. The mounting holes on thePCB are positioned to allow the PCB to be mounted in a specific box.
**
X
YZ
Figure 3.9: Control computer layout
3.1.3 FrontNode
The front node module acts as a hub between the CAN bus and all the sensors in thefront of the vehicle and the SoundRacer node. Some sensors have an analog output
24

3.1. HARDWARE CHAPTER 3. RESULTS
signal and some have a digital output signal. These signals are routed to the frontnode, filtered to remove any noise and measured by the microcontroller in the front nodeusing either the ADC or GPIO peripheral. Analog signals comes from, for example, thesteering angle sensor or pedal engagement sensors whereas digital signals comes from, forexample, the front wheel speed sensor. The values from the sensors are then scaled andsent on the CAN bus. Any packages on the CAN bus containing information regardingthe SoundRacer node are received by the front node and the signals to the SoundRacerare changed accordingly.
The schematics of the front node is shown in Figure 3.10. The schematic is, as theprevious schematics, broken up in subsections to increase the readability. The sectionsinclude the microcontroller, CAN, power regulation and input/output filtering parts.The front node and Motor driver are based on the same microcontroller to simplifythe reuse of code between the subsystems. By sharing parts between several nodes theworkload can be lowered. Each input channel can be filtered by a lowpass filter with again of ≤ 1 by configuring passive components connected to the inputs. These filters canfor example be used to scale the reading of a 5V sensor to 3.3V, which is the maximumvoltage that should be applied to the microcontroller, and lowpass filter the signal toprevent high frequency noise being aliased down to low frequencies when sampled.
25

3.1. HARDWARE CHAPTER 3. RESULTS
GND
+3V3
+3V3
GNDGND +12V
GND +5V
GND
+5V GN
DG
ND
+12V
GN
D
GN
D
+12V
+5V
+3V3
+3V3
7805
DT
+5V
GN
DG
ND
GN
D
+12V
+5V
+3V3
GN
DG
ND
+5V
+3V3
GN
D
+3V3
GN
D
+3V3
GN
D
+3V3
GN
DG
ND
GN
D
GN
DG
ND
+3V3
+3V3
+3V3
+3V3
GND GND GNDGND
GND
+5V
+3V3
GND
GN
D
GN
D
+5V
+3V3
GND
GN
D
GN
D
+5V
+3V3
GND
GN
D
GN
D
+5V
+3V3
GND
GN
D
GN
D
GN
D
+5V
GN
D
+3V3
GN
D
+5V
GN
D
+3V3
+5V
+3V3
GND
GN
D
GN
D
+5V
+3V3
GND
GN
D
GN
D
GN
D
+5V
GN
D
+3V3
+3V3+3V3+3V3+3V3+3V3+3V3+3V3+3V3+3V3+3V3+3V3+3V3
+5V
+3V3
GND
GN
D
+5V
GN
D
+3V3
GN
D
GN
D GN
D
GN
D
SOLD
ERJU
MPE
RN
O+1
2V
+5V
P$1
1P$
22
P$3
3P$
44
P$5
5
R7
P$1
1P$
22
P$3
3P$
44
P$5
5
TXD
1VS
S2
VDD
3R
XD4
VREF
5C
ANL
6C
ANH
7R
S8
R8
C8
C9
IC1
ADJ
INO
UT
IC3
GN
DVI
1
3
VO2
C5
C6
C7
LED4 R12
LED5 R13
C10
C11
C12
LED1 R3
LED2 R4
LED3 R5
Q6 C16
C17
GN
D18
VCC
19
OSC
_IN
(PD
0)2
OSC
_OU
T(PD
1)3
NR
ST4
AGN
D5
AVC
C6
PA0(
ADC
12_0
/TIM
2_C
H1_
ETR
*)7
PA1(
ADC
12_1
/TIM
2_C
H2*
)8
PA2(
ADC
12_2
/TX2
/TIM
2_C
H3)
9PA
3(AD
C12
_3/R
X2/T
IM2_
CH
4)10
PA4(
ADC
12_4
/UAR
T2_C
K)11
PA5(
ADC
12_5
/SPI
1_SC
K*)
12PA
6(AD
C12
_6/S
PI1_
MIS
O*/T
IM3_
CH
1*)
13PA
7(AD
C12
_7/S
PI1_
MO
SI*/T
IM3_
CH
2*)
14
PB0(
ADC
12_8
/TIM
3_C
H3)
15
PB1(
ADC
12_9
/TIM
3_C
H4)
16
PB2(
BOO
T1)
17
PA8(
TIM
1_C
H1/
UAR
T1_C
K)20
PA9(
TX1*
/TIM
1_C
H2)
21PA
10(R
X1*/T
IM1_
CH
3)22
PA11
(CAN
RX*
/USB
-/TIM
1_C
H4)
23PA
12(C
ANTX
*/USB
+)24
PA13
(JTM
S/SW
DIO
)25
GN
D26
VCC
27
PA14
(JTC
K/SW
DC
LK)
28PA
15(J
TDI)
29
PB3(
JTD
O)
30
PB4(
JNTR
ST)
31
PB5
32
PB6(
I2C
1_SC
L/TI
M4_
CH
1)33
PB7(
I2C
1_SD
A/TI
M4_
CH
2)34
BOO
T035
GN
D36
VCC
1
U5
STM
32F1
03Tx
P$1
1P$
22
P$3
3P$
44
P$5
5R
1
R2
C2
C3
P$1
1P$
22
P$3
3P$
44
P$5
5R
6
R9
C1
C4
P$1
1P$
22
P$3
3P$
44
P$5
5R
10
R11
C13
C14
P$1
1P$
22
P$3
3P$
44
P$5
5R
14
R15
C15
C18
C19
C20
C21
C22
P$1
1P$
22
P$3
3P$
44
P$5
5R
16
R17
C23
C24
P$1
1P$
22
P$3
3P$
44
P$5
5R
18
R19
C25
C26
C27
C28
R20R21R22R23R24R25R26R27R28R29R30R31
P$1
1P$
22
P$3
3P$
44
P$5
5
C33
C34
Q1
Q2 R34R35
R32SJ1
SWD
IO
SWD
IOR
ESET
RESET
RES
ET
SWC
LK
SWC
LK
CAN
_RX
CAN
_RX
CAN
_TX
CAN
_TX
OSC1
OSC
1
OSC2
OSC
2
LED2
LED
2
LED3
LED
3
LED1
LED
1
AUX1
AUX1
AUX1
AUX2
AUX2
AUX2
AUX3
AUX3
AUX3
AUX4
AUX4
AUX4
AUX5
AUX5
AUX5
AUX6
AUX6
AUX6
AUX7
AUX7
AUX7AU
X8
AUX8
AUX8
AUX9
AUX9
AUX9
AUX1
0
AUX1
0
AUX10
AUX1
1
AUX1
1
AUX11
AUX1
2
AUX1
2
AUX12
OD
2
OD
2
OD
1
OD
1
+
+
+
PWR
STM
INC
AN
IN
INOU
T
Figure 3.10: Front node schematics
26

3.1. HARDWARE CHAPTER 3. RESULTS
The PCB layout of the front node is shown in Figure 3.11. The layout shares manyfeatures with the motor driver and the control board seen in Figure 3.4 and 3.2 such as theCAN transceiver, voltage regulation and microcontroller section. The voltage regulationcomponents can get hot so the same precautions as in the motor driver control boardhas been taken by placing large copper pours thermally connected to the regulators toact as heat sinks. The mounting holes on the PCB are positioned to allow the PCB tobe mounted in a specific box.
Figure 3.11: Front node layout
3.1.4 SoftStart
The soft start module limits the inrush current from the batteries by first connecting aresistor in series with the batteries to slowly charge the bulk capacitors on the motordrivers and after a fixed time connect the batteries directly to the motor drivers. Thesoft start module also connects or disconnects the battery based on the start/stop buttonand dead-man’s handle.
The schematics of the soft start module is shown in Figure 3.12. The schematicsmostly consists of a pair of relays to connect the batteries via a resistor or directly to themotor drivers, a RC filter to set the delay before the charge resistor is shorted, a charge
27

3.1. HARDWARE CHAPTER 3. RESULTS
resistor and a discharge resistor. One important feature of the soft start module is todisconnect the power quickly when the user either disconnects the dead-man’s handle orpresses the power off switch, this is done by placing a diode, seen in the section labeled”SlowStart” in Figure 3.12, across the R in the RC net to lower its discharge time andthereby disconnecting the batteries quickly.
V+
V+
V+
V+
V+
+ + + +
Power In Power Out
Pre Charge
Estop1 Estop2K1
K1
K1
K2
K2
Power
SlowStart
Estop
Figure 3.12: Soft start schematics
The layout of the soft start module, seen in Figure 3.13, is simple and only containsa few important design decisions. The most important design aspect of the PCB layoutis to minimize the power loss, this is done by using a large copper thickness of 105µm,wide and short traces and adding solder on the traces. The mounting holes on the PCBare positioned to allow the PCB to be mounted in a specific box.
28

3.1. HARDWARE CHAPTER 3. RESULTS
D312
12
Figure 3.13: Soft start layout
3.1.5 Sensors
Two sensors types have been developed for use on the vehicle; a Hall effect based angularsensor and an optical rotational encoder with quadrature output. The optical sensor wasnot used in the final setup of the vehicle as the front wheel was changed and the opticalsensor removed. A Hall based magnetic sensor was used instead as an optical sensor couldbe more prone to failure due to dirt or bright sun light. These sensors are connected tothe pedals, steering rack and front wheel. The schematics and layouts of the sensors areelementary and are not included in this report.
3.1.6 SoundRacer
The SoundRacer unit has been connected to the front node and is controlled via aPWM signal that controls the virtual engine RPM. The duty cycle of the PWM signalis proportional to the throttle pedal engagement, this could be implemented in a nicerway to properly simulate a combustion engine by for example implementing a completevirtual drivetrain.
29

3.2. SOFTWARE CHAPTER 3. RESULTS
3.2 Software
All of the software mentioned in 2.3 has been either fully or partially implemented andtested. The testing has been done empirically and not by formal verification. Thisdecision has been made partly because the main aims of this project are not dependentof any formal verification and because the time needed to formally verify all code couldbe used for tasks that have higher priority. The software running on the front node,motor driver or the operating system running on the control computer are not coveredin this section, only the vehicle enhancement software subsystems. The resulting codeand test results are covered in the subsections below for each software subsystem.
3.2.1 Stability Program
The purpose of the stability program is to measure the true yawrate and calculate targetyawrate based on steering angle and vehicle speed. The true yawrate is measured in theIMU on the control computer and the target yawrate can be calculated using equation 3.1and equation 3.2, measuring the front wheel speed and the steering angle. The yawrateerror is feed in to a PID regulator whose output is added to the differential mode torquesignal to the rear wheels. Equation 3.1 and equation 3.2 was developed using simpletrigonometry.
TurnRadius =WheelSeparation
tan(SteeringAngle)(3.1)
in whichTurnRadius Turn RadiusWheelSeparation Wheel Separation between Front and Rear WheelsSteeringAngle Steering Angle
Y awRate =FrontWheelSpeed
TurnRadius(3.2)
in whichY awRate Vehicle YawRateFrontWheelSpeed Front-Wheel SpeedTurnRadius Turn Radius
The model for estimating the yawrate has been tested by driving the vehicle at differentspeeds and steering angles and logging vehicle state data such as speed, steering angleand yawrate to calculate the estimated yawrate based on the logged speed and steeringangle and comparing the true yawrate with the estimated yaw rate. The data of this testis shown in Figure 3.14 and the results are that the model is sufficiently accurate. Anydiscrepancies between the measured yawrate and the estimated yawrate is attributed tonon linearity in the steering and measurement errors.
30

3.2. SOFTWARE CHAPTER 3. RESULTS
34 36 38 40 42 44 46 48 50 52 54−100
0
100
Time[s]
Ya
wra
te[d
eg
/s]
34 36 38 40 42 44 46 48 50 52 54
−1
0
1
Sp
invd
ete
cte
d[−
1,0
,1]
SpinvdetectionvwithvspinveventMeasuredvyawRate[deg/s]Calculatedvyawrate[deg/s]Spinvdetected[−1,0,1]
0 10 20 30 40 50 60 70 80 90 100−100
−50
0
50
100
Time[s]
Yaw
rate
[deg
/s]
0 10 20 30 40 50 60 70 80 90 100
−1
0
1
Spi
nvde
tect
ed[−
1,0,
1]
Spinvdetectionvwithoutvspinvevent
MeasuredvyawRate[deg/s]Calculatedvyawrate[deg/s]Spinvdetected[−1,0,1]
Figure 3.14: Stability program test without spin event
The measured yawrate and the estimated yawrate are compared and the differenceis filtered and then compared to a threshold of 50◦/s, if the difference is higher thanthe threshold a clockwise spin is detected and if the difference is lower than the negativethreshold a counter clockwise spin is detected. The output of the spin detection algorithmduring a spin event is shown in Figure 3.15 which shows the same data as in Figure 3.14but with a spin event present. A large discrepancy between the measured and estimatedyawrate can be seen from 43 seconds in to the test until 44 seconds in to the test. Thisshows that the spin detection algorithm works and can detect spin events.
31

3.2. SOFTWARE CHAPTER 3. RESULTS
34 36 38 40 42 44 46 48 50 52 54−100
0
100
Time[s]
Ya
wra
te[d
eg
/s]
34 36 38 40 42 44 46 48 50 52 54
−1
0
1
Sp
invd
ete
cte
d[−
1,0
,1]
SpinvdetectionvwithvspinveventMeasuredvyawRate[deg/s]Calculatedvyawrate[deg/s]Spinvdetected[−1,0,1]
Figure 3.15: Stability program test with spin event
The PID regulator was never implemented on the vehicle as there was no availablelocation suitable to test the stability program nor any time to do so.
3.2.2 Torque Vectoring
Torque vectoring has been implemented by adding a differential mode signal to thetorque value to the motor drivers based on the steering angle. One problem with thevehicle is the missing suspension, this makes the vehicle lift the inner rear wheel if turnedsharply. By implementing torque vectoring the same total amount of torque is appliedindependently of whether a wheel is off the ground or not by increasing the torque to thewheel on the ground and reducing the torque to the with less weight on it. The benefitsare several such as lowered power consumption as less power is send to any wheel in theair, the wheel not contacting the ground does not build up speed which would be lostwhen ground contact occurs and thereby increasing the wear on the tire. Another benefitof the torque vectoring is that the torque developed by each motor is more proportional
32

3.2. SOFTWARE CHAPTER 3. RESULTS
to the load on that wheel. This lowers the risk of spinning as the torque is more proneto be lower than the static/dynamic friction limit.
3.2.3 Regenerative Breaking
The regenerative breaking system has been implemented as discussed in section 2.3.6.The regenerative breaking system has been tested by simply breaking the vehicle withthe regenerative breaking enabled. The motor driver has been tested with breakingcurrents up to 25A at voltages up to 70V which is more than the battery is designed tobe charged with. The regenerative breaking system is therefore deemed as working andnot limiting in any way.
3.2.4 Anti Lock Breaking
The anti lock breaking system has been implemented and tested. The system works bymeasuring the front wheel speed and the rear wheel speeds and comparing these. If anyrear wheel is rotating slower than the front wheel by a fixed amount while breaking,that rear wheel is considered locked and the breaking force is reduced to regain traction.This implementation requires the front wheel speed to be equal to the vehicles true speedwhich may not be true as there is a mechanical brake present on the front wheel designedto be used in emergency situations. If the front brake is applied, the anti lock breakingsystem will not function properly and may increase the breaking distance. Because ofthis the anti lock breaking system was removed and not implemented in the final versionbut it is, however, functional.
3.2.5 Anti Spin
The anti spin system is implemented by comparing the true vehicle speed to each rearwheel speed and if any rear wheel is rotating quicker than the true vehicle speed plusa threshold then the torque to that wheel is lowered which makes that rear wheel slowdown and stop spinning. There was no available location suitable to test the anti spinsystem as spinning only occurs if the friction to the ground is very low as most of theweight of the vehicle is on the rear whees.
33

4Discussion
Since all subsystems, both hardware and software, work as designed and the vehicle isfully operational and performs well, the main aims of this project are fulfilled. Theresults of this project shows that it is feasible to build a electric propulsion system fromground and up within a highly limited period of time and still maintain performanceand safety of said system.
Most of the subsystems can be reused for any electric vehicle that has one or moreelectric motors. The design of the motor driver node has been slightly modified andreused on a electric bike. The regenerative anti lock braking software subsystem wasmoved to the motor driver instead of running on the control computer node in the bikeas no control computer node was present. This shows that the hardware and software aremodular and the configuration of these can easily be modified to serve many purposes.
Several parts of the project can be worked on more to increase the value and useful-ness of the vehicle, for example the pieces of software that was never fully implementedor tested such as stability program and anti spin or adding hardware nodes such as adashboard. A dashboard will be added by AF in the form of a tablet connected to thevehicle via a bluetooth or USB link.
There are parts of the subsystems that has flaws, some examples of these are listedbelow:
• The main bulk electrolytic capacitors has a too high ESR which limits their ripplecurrent handling capability, this could lead to excessive heat and EMI noise.
• Some of the inputs on the nodes are not protected very well for noise or ESD.
• The relays in the soft start node are not rated for the surge current that they couldexperience due to the design of the soft start
Most systems have flaws and it is important to find out all of them so that they can befixed or avoided. The mentioned flaws has not been fixed as they have not resulted in
34

CHAPTER 4. DISCUSSION
any problems as of yet. By testing the systems to their limits, flaws that can result inproblems or errors can be found. It is therefore important to test all systems to theirlimits. The vehicle has been driven in several types of terrain, such as wet, uneven andloose terrain, as well as by several drivers to find flaws on the vehicle. The only failuresthat has occurred during testing are fuses which have blown and have been replaced byfuses with higher current rating. This is however a good form of failure to have as itshows that the motor drivers can handle more current than the fuses. After the finalfuses of 30A per battery and 40A per motor driver was mounted no fuses have blown.
It is important to note that the hardware and software developed in this project is not,in any way, tested for compliance with the rules and regulations of automotive systemsand would to all probability fail most of the harsh tests designed to keep the vehicles onthe roads safe and reliable. The results of this project are for purely academical purposesand should be treated accordingly.
The methodology used in this report is not the same as those used by large vehiclemanufacturers who usually use a more model based approach by modeling the vehi-cle carefully and design their software and hardware using higher abstraction layers.Examples of this include using simulink or similar programs to develop and maintainthe control systems used in the vehicles for everything from climate control to enginecontrol.
35

5Conclusion
All of the hardware works as designed and performs very well according to all tests.Most of the software has been implemented and tested successfully while some softwarewas never completed as it was too complex and the need of them was not as great aspredicted in the beginning of the project.
To conclude this project, it is clear that developing the whole chain of hardware andsoftware needed to control an electric vehicle can be quickly and easily done and stillfunction in a satisfying manner.
36

Bibliography
[1] N/A, Sinclair C5, http://en.wikipedia.org/wiki/Sinclair_C5, [Online; ac-cessed 28-May-2014] (2014).
[2] Transportstyrelsens, Transportstyrelsens forfattningssamling, https://www.
transportstyrelsen.se/tsfs/TSFS%202010_144.pdf, [Online; accessed 03-May-2014] (2010).
[3] Farnell, CadSoft Eagle PCB Design Software, http://www.cadsoftusa.com/, [On-line; accessed 03-May-2014] (2011).
[4] J.-P. Charras, KiCad EDA Software Suit, http://www.kicad-pcb.org/display/KICAD/KiCad+EDA+Software+Suite, [Online; accessed 03-May-2014] (2014).
[5] Altium, EDA Software, http://www.altium.com/, [Online; accessed 03-May-2014](2014).
[6] Farnell, Free ARM Cortex MCU IDE, http://www.coocox.org/CooCox_CoIDE.
htm, [Online; accessed 03-May-2014] (2011).
[7] Microsoft, Visual C#, http://msdn.microsoft.com/en-us/library/kx37x362.
aspx, [Online; accessed 03-May-2014] (2014).
[8] Microsoft, Visual Studio Express, http://www.visualstudio.com/en-
us/products/visual-studio-express-vs.aspx, [Online; accessed 03-May-2014] (2014).
[9] Farnell, Free and open ARM Cortex MCU RTOS, http://www.coocox.org/CoOS.htm, [Online; accessed 03-May-2014] (2011).
[10] S. Microelectronics, STM32F4 Series, http://www.st.com/web/en/catalog/mmc/FM141/SC1169/SS1577, [Online; accessed 28-May-2014] (2014).
37