motives and barriers to cloud erp selection for smes: a
TRANSCRIPT

Georgia State UniversityScholarWorks @ Georgia State University
Business Administration Dissertations Programs in Business Administration
5-4-2014
Motives and Barriers to Cloud ERP Selection forSMEs: A Survey of Value Added Resellers (VAR)PerspectivesMichael L. GarverickGeorgia State University
Follow this and additional works at: http://scholarworks.gsu.edu/bus_admin_diss
This Dissertation is brought to you for free and open access by the Programs in Business Administration at ScholarWorks @ Georgia State University. Ithas been accepted for inclusion in Business Administration Dissertations by an authorized administrator of ScholarWorks @ Georgia State University.For more information, please contact [email protected].
Recommended CitationGarverick, Michael L., "Motives and Barriers to Cloud ERP Selection for SMEs: A Survey of Value Added Resellers (VAR)Perspectives." Dissertation, Georgia State University, 2014.http://scholarworks.gsu.edu/bus_admin_diss/36

i
PERMISSION TO BORROW
In presenting this dissertation as a partial fulfillment of the requirements for an advanced degree
from Georgia State University, I agree that the Library of the University shall make it available
for inspection and circulation in accordance with its regulations governing materials of this type.
I agree that permission to quote from, to copy from, or publish this dissertation may be granted
by the author or, in his/her absence, the professor under whose direction it was written or, in his
absence, by the Dean of the Robinson College of Business. Such quoting, copying, or publishing
must be solely for the scholarly purposes and does not involve potential financial gain. It is
understood that any copying from or publication of this dissertation which involves potential
gain will not be allowed without written permission of the author.
Michael L. Garverick

NOTICE TO BORROWERS
All dissertations deposited in the Georgia State University Library must be used only in
accordance with the stipulations prescribed by the author in the preceding statement.
The author of this dissertation is:
Michael Leigh Garverick
J. Mack Robinson College of Business
Georgia State University
35 Broad Street NW
Atlanta, GA 30303
The director of this dissertation is:
Dr. Michael J. Gallivan
Department of Computer Information Systems
J. Mack Robinson College of Business
Georgia State University
35 Broad Street, Suite 900
Atlanta, GA 30303

Motives and Barriers to Cloud ERP Selection for SMEs: A Survey of Value Added Resellers
Perspectives
BY
Michael Leigh Garverick
A Dissertation Submitted in Partial Fulfillment of the Requirements for the Degree
Of
Executive Doctorate in Business
In the Robinson College of Business
Of
Georgia State University
GEORGIA STATE UNIVERSITY
ROBINSON COLLEGE OF BUSINESS
2014

Copyright by
Michael Leigh Garverick
2014

ACCEPTANCE
This dissertation was prepared under the direction of the Michael Leigh Garverick Dissertation
Committee. It has been approved and accepted by all members of that committee, and it has
been accepted in partial fulfillment of the requirements for the degree of Doctoral of Philosophy
in Business Administration in the J. Mack Robinson College of Business of Georgia State
University.
H. Fenwick Huss, Dean
DISSERTATION COMMITTEE
Dr. Michael J. Gallivan (Chair)
Dr. Dan C. Bello
Dr. Bruce Behn

TABLE OF CONTENTS
CHAPTER 1: INTRODUCTION AND BACKGROUND ............................................................ 1
1.1 Introduction ...................................................................................................................... 1
1.2 Background ...................................................................................................................... 4
1.2.1 Motivation for the Study ........................................................................................... 4
1.2.2 Significance of the Study .......................................................................................... 5
1.3 Theoretical and Conceptual Framework .......................................................................... 9
1.4 Summary ........................................................................................................................ 11
CHAPTER 2: LITERATURE REVIEW ...................................................................................... 13
2.1 ERP Literature ................................................................................................................ 13
2.1.1 Selection Articles .................................................................................................... 21
2.1.2 SME Applicability .................................................................................................. 23
2.2 Cloud Literature ............................................................................................................. 24
2.2.1 Cloud Definition ..................................................................................................... 24
2.2.2 Cloud Benefits and Weaknesses ............................................................................. 27
2.2.3 SME Applicability .................................................................................................. 28
CHAPTER 3: CLOUD ERP SELECTION FRAMEWORK ....................................................... 31
3.1 Components of “Adoption Motives” Construct ............................................................. 32
3.1.1 Strategic Motives .................................................................................................... 33
3.1.2 Operational Motives................................................................................................ 33
3.1.3 Technical Motives ................................................................................................... 34
3.2 Components of “Adoption Barriers” Construct ............................................................. 35
3.2.1 Strategic Barriers .................................................................................................... 35
3.2.2 Operational Motives................................................................................................ 35
3.2.3 Technical Barriers ................................................................................................... 36
CHAPTER 4: RESEARCH METHODOLOGY .......................................................................... 38
4.1 Research Design ............................................................................................................. 38
4.2 Survey Development ...................................................................................................... 39

4.3 Selection of Study Participants ...................................................................................... 45
4.4 Data Collection ............................................................................................................... 45
CHAPTER 5: RESULTS .............................................................................................................. 48
5.1 Survey Response Rates .................................................................................................. 48
5.2 UF Motives and Barriers Questions ............................................................................... 49
5.2.1 Motives ................................................................................................................... 49
5.2.2 Barriers .................................................................................................................... 54
5.2.3 Other Data Analysis ................................................................................................ 62
5.3 Demographic Descriptives ............................................................................................. 66
5.3.1 Number of Employees ............................................................................................ 68
5.3.2 Time/Years Experience Selling ERP Software....................................................... 69
5.3.3 Time/Years Experience Selling Cloud ERP Software ............................................ 70
5.3.4 TOTAL ERP Client Base........................................................................................ 71
5.3.5 Cloud ERP Sales Quantity ...................................................................................... 73
5.3.6 TOTAL ERP Systems Sold Last Year .................................................................... 74
5.3.7 Cloud ERP Percentage of LAST Year ERP Sales .................................................. 74
5.3.8 Cloud ERP Percentage of NEXT Year ERP Sales ................................................. 75
5.3.9 Specialization in any particular verticals/industries ............................................... 76
5.3.10 Successful Verticals/Industries Selling Cloud ERP Software ................................ 77
5.3.11 Reasons for Success in Verticals/Industries ........................................................... 78
5.3.12 Problem Verticals/Industries Selling Cloud ERP Software .................................... 81
5.3.13 Reasons for Problems in Verticals/Industries ......................................................... 81
CHAPTER 6: DISCUSSION ........................................................................................................ 86
6.1 Methodological Contribution ......................................................................................... 86
6.2 Theoretical Contribution ................................................................................................ 88
6.3 Empirical Contribuition.................................................................................................. 90
6.4 Contribution to Practice ................................................................................................. 94
CHAPTER 7: CONCLUSION ..................................................................................................... 95
7.1 Recommendations for Future Research ......................................................................... 95
7.2 Limitations ..................................................................................................................... 96

CHAPTER 8: REFERENCES ...................................................................................................... 98
8.1 Appendix A – Additional ERP Selection Papers ........................................................... 98
8.2 Appendix B – Hosted vs. On-Premise vs. Cloud ERP Framework ............................. 101
8.3 Appendix C – SaaS ERP Advantages/Disadvantages Framework .............................. 102
8.4 Appendix D – Cloud ERP Final Survey ...................................................................... 104
8.5 Bibliography ................................................................................................................. 123

LIST OF TABLES
Table 1: ERP Review Papers ........................................................................................................ 13
Table 2: ERP Selection Criteria .................................................................................................... 15
Table 3: Table VI from Kamhawi (2008) ..................................................................................... 22
Table 4: Final Cloud ERP Adoption Motives ............................................................................... 41
Table 5: Final Cloud ERP Adoption Barriers ............................................................................... 43
Table 6: Daily Survey Responses ................................................................................................. 47
Table 7: List of Motives and Codes .............................................................................................. 50
Table 8: Motives Descriptive Statistics ........................................................................................ 51
Table 9: Tests of Differences for Motives .................................................................................... 51
Table 10: Additional Motives ....................................................................................................... 53
Table 11: Summary of Additional Motives .................................................................................. 54
Table 12: List of Barriers and Codes ............................................................................................ 55
Table 13: Barriers Descriptive Statistics....................................................................................... 56
Table 14: Tests of Differences for Barriers .................................................................................. 56
Table 15: Additional Barriers ....................................................................................................... 60
Table 16: Summary of Additional Barriers .................................................................................. 61
Table 17: Spearman Correlations - Motive Magnitudes and Frequencies .................................... 63
Table 18: Spearman Correlations - Barrier Magnitudes and Frequencies .................................... 64
Table 19: Company Relationship by Position Matrix .................................................................. 66
Table 20: Final Company Relationship by Position Matrix ......................................................... 67
Table 21: Descriptive Statistics for Demographics Variables ...................................................... 68
Table 22: Number of Employees .................................................................................................. 69
Table 23: Time Selling ERP ......................................................................................................... 70
Table 24: Time Selling Cloud ERP .............................................................................................. 71
Table 25: Number of ERP Clients ................................................................................................ 72
Table 26: Number of Cloud ERP Sales ........................................................................................ 73
Table 27: "Other" specified Industries .......................................................................................... 77
Table 28: Successful Verticals/Industries ..................................................................................... 78
Table 29: Reasons for Success in Verticals/Industries ................................................................. 79
Table 30: Summary of Success Reasons ...................................................................................... 80
Table 31: Challenging Verticals/Industries .................................................................................. 81
Table 32: Reasons for Challenges in Verticals/Industries ............................................................ 83
Table 33: Summary of Problem Reasons...................................................................................... 84
Table 34: Final UF Tested ............................................................................................................ 90
Table 35: Additional ERP Selection Papers ................................................................................. 98
Table 36: Hosted vs. On-Premise vs. Cloud ERP (Duan et al, 2013) ......................................... 101

LIST OF FIGURES
Figure 1: Evolution of ERP (Rashid et al, 2002) ............................................................................ 1
Figure 2: Anatomy of an ERP (Davenport, 1998) .......................................................................... 2
Figure 3: Technology Acceptance Model (TAM) .......................................................................... 5
Figure 4: Diffusion of Innovation (DOI) Model ............................................................................. 6
Figure 5: IS Success Model ............................................................................................................ 6
Figure 6: Marketing Satisfaction Model ......................................................................................... 7
Figure 7: The Dominant Paradigm for IT Innovation ..................................................................... 9
Figure 8: Grabski ERP Research Overview.................................................................................. 20
Figure 9: Cloud Computing Models (adapted from NIST) .......................................................... 25
Figure 10: Saeed et al (2012) Unified Framework ....................................................................... 32
Figure 11: Research Model ........................................................................................................... 38
Figure 12: Barrier 5 Histogram ..................................................................................................... 58
Figure 13: Motive Magnitude and Frequency Mean Ranking Comparison ................................. 65
Figure 14: Barrier Magnitude and Frequency Mean Ranking Comparison ................................. 65
Figure 15: Number of Employees ................................................................................................. 69
Figure 16: Time Selling ERP ........................................................................................................ 70
Figure 17: Time Selling Cloud ERP ............................................................................................. 71
Figure 18: Number of ERP Clients ............................................................................................... 72
Figure 19: Number of Cloud ERP Sales ....................................................................................... 73
Figure 20: Histogram of Number of Last Year ERP Sales ........................................................... 74
Figure 21: Last Year Cloud Sales Percentage............................................................................... 75
Figure 22: Next Year Cloud Sales Percentage .............................................................................. 76
Figure 23: VAR Specialization by Vertical/Industry .................................................................... 77
Figure 24: SaaS ERP Advantages (Hoseini, 2013) ..................................................................... 102
Figure 25: SaaS ERP Disadvantages (Hoseini, 2013) ................................................................ 103

ABBREVIATIONS
List of Abbreviations (in Alphabetical Order)
ASP – Application Service Provider
BI – Business Intelligence
BPR – Business Process Re-engineering
CloudERP – Vendor of cloud ERP software whose VAR’s are surveyed in this current study
CRM – Customer Relationship Management
CSF – Critical Success Factor
DOI – Diffusion of Innovation
DV – Dependent Variable
ERP – Enterprise Resource Planning
IaaS – Infrastructure as a Service
IS – Information Systems
ISP – Internet Service Provider
IT – Information Technology
IV– Independent Variable
MRP – Materials Requirement Planning
NIST – National Institute of Standards and Technology
OM – Operations Management
PaaS – Platform as a Service
RBV – Resource Based View
RDMS – Relational Database Management System
ROI – Return on Investment
SaaS – Software as a Service
SCM – Supply Chain Management
SMB – Small to Mid-size Business
SME – Small to Mid-size Enterprise
SOA – Service-Oriented Architecture
SOP – Subscription On Premise
TAM – Technology Acceptance Model
TCO – Total Cost of Ownership
UF – Unified Framework of Motives and Barriers of Cloud ERP Adoption
VAR – Value Added Reseller
Y2K – Year 2000

ABSTRACT
Motives and Barriers to Cloud ERP Selection for SMEs:
A Survey of Value Added Resellers Perspectives
BY
Michael Leigh Garverick
April 22, 2014
Committee Chair: Dr. Michael J. Gallivan
Major Academic Unit: Department of Computer Information Systems
Small to Mid-size Enterprises (SMEs) typically are slow/late to adopt new technologies
due to a conservative bias, cost factors and possible lack of knowledge. Implementation of a new
Enterprise Resource Planning (ERP) system is a major, costly undertaking for a company of any
size, especially SMEs, but there is the potential for huge paybacks touted by advantages afforded
by the cloud. Cloud based ERP technology for SMEs is relatively new and poses a potential
large risk-reward payoff. Given that these SMEs are currently functioning with their existing
systems, why would they want to risk switching to "Bleeding Edge" Cloud ERP technology?
Prior ERP research has focused primarily on an ERP’s implementation success and the
relevant critical success factors (CSFs) important throughout the various stages of an ERP’s
lifecycle. The focus of these studies has been on post-selection variables and the success or
failure of the ERP’s adoption or implementation. Inherent in these studies are firms who already
selected ERP technology which provides no insight into any potential barriers that prevent
selection.

ERP research in the area of SME cloud/SaaS ERP systems is nascent. This paper adds
methodological, empirical and theoretical contributions to this existing stream of research about
the motives and barriers in the selection of cloud ERP systems for SME’s. In particular, this
research paper proposes to help bridge these gaps by operationalizing and testing Saeed, Juell-
Skielse, and Uppström (2012)’s Unified Framework (UF) of the motives and barriers to the
selection of cloud ERP systems. This current study uses Value Added Resellers (VARs) as
subjects. They are arguably the most knowledgeable and in the best position to assess both the
motives and more importantly barriers since there are in direct contact with the cloud ERP
prospective purchasers.

1
CHAPTER 1: INTRODUCTION AND BACKGROUND
1.1 Introduction
Initial ERP systems evolved out of Materials Resource Planning (MRP and MRP II)
systems from the 1970’s and 1980’s which were run on large mainframe computers. MRP/II
systems were used to plan and calculate inventory and other value chain requirements based on a
company’s forecasted sales and calculated needs of materials and resources (based on a Bill of
Materials) to meet demand. ERP evolved from the MRP/II systems and came into existence in
the late 1980’s and early 1990’s as computer hardware and software became more powerful and
allowed for other stand-alone systems to communicate and share information with one another
across one common database (see Figure 1 (Rashid, Hossain, & Patrick, 2002, p. 4)).
Figure 1: Evolution of ERP (Rashid et al, 2002)
This included extension to and integration with accounting systems to close the loop on
the procurement (purchasing, accounts payables) and fulfillment (sales, accounts receivable)
processes as well as other stand-alone systems (e.g., general ledger, Customer Relationship
Management (CRM), etc.; see Figure 2 ((Davenport, 1998, p. 124))).

2
Figure 2: Anatomy of an ERP (Davenport, 1998)
It was during the 1980’s and early 1990’s that powerful relational database management
systems (RDMS) began to surface that allowed for such integration of previously independent
systems. Also, to help push ERP systems into the mainstream was the increase in computing
power and the advent of client/server networked computer systems where some of the computer
processing tasks could now able to be offloaded onto and shared with client workstations (which
was previously impossible with the “dumb” terminals that were hooked up to mainframe
systems). Lastly, if companies had not jumped on the ERP bandwagon by this time the infamous
problems associated with the “Year 2000” (Y2K) data storage and processing/calculation issues
had forced many companies off of their home-grown, custom, proprietary systems and forced
them into the modern era of ERP. Rashid et al. (2002), p. 1 “ERP systems are now ubiquitous in
large businesses and the current move by vendors is to repackage them for small to medium
enterprises (SMEs)”. Prior to Y2K, other smaller ERP vendors had already been catering their

3
software to the SME market as well, although the penetration rate was not near that of the larger
companies due to the smaller Information Technology (IT) budgets of the SME businesses and
their perceived need for such systems was lower.
The basic definition of ERP is an “enterprise-wide information system designed to
integrate and optimize the business processes and transactions throughout an entire organization
(Addo-Tenkorang & Helo, 2011, p. 1). Developments in technology (e.g., the internet, web
related software, cell phones, tablets, hardware, social media, eCommerce, etc) have led to
“Extended ERP” (ERP II and ERP III), which transcends the boundaries of the organization.
ERP II applications extend supply functionality to external enterprises (generally vendor-
affiliated companies) to reduce cost, improve supply chain efficiency, and to perform
collaborative innovation while ERP III enterprises go to the next level to include customers and
the sales side of the marketplace into enterprise operations where customers become active
participants in a firm’s business (Wood, 2010). In addition, many “add-ons” are available from
third-party vendors or system integrators to enhance the capabilities of the ERP systems.
Enterprise Resource Planning (ERP) systems are usually the largest, most complex, and
most demanding information systems implemented by firms (Grabski, Leech, & Schmidt, 2011,
p. 37). “ERP systems can provide great rewards, but the risks they carry are equally as great”
(Davenport, 1998, p. 128). The literature has documented a high implementation failure rate of
ERP implementations of up to 70% (Al-Mashari, 2000), some to the extent of causing
bankruptcy of the company. “An enterprise system, by its very nature, imposes its own logic on
a company’s strategy, organization and culture” (Davenport, 1998, p. 122). ERP systems will
not improve an organization overnight. Most ERP systems implementations will require some
degree of customization and are overall very disruptive to the organization. “The high
expectation of achieving all-round cost savings and service improvements is very much

4
dependent on how good [well or closely] the chosen ERP system fits to the organizational
functionalities and how well the tailoring and configuration process of the system matched with
the business culture, strategy and structure of the organization” (Rashid et al., 2002, p. 5).
In summary, technological change is inevitable. The initial invention of the computer in
the form of mainframe systems allowed organizations to digitize some of their old, archaic,
manual, paper-based systems. Separate, disparate systems developed and evolved within
companies to perform specific or specialized tasks and functions in isolation. Eventually MRP/II
finally evolved to help companies manage their warehouse planning and requirements. Along
the same lines, companies developed their own in-house, proprietary systems to help run specific
aspects of their businesses. The increase in computing power and technological capabilities led
to advances in RDMS and the proliferation of client/server networks and personal computers.
This led to larger companies initially adopting ERP systems. Environmental factors such as
Y2K issues increased the adoption of ERP systems for both large and SME’s due to the risk of
their existing systems not working. The internet has led to ERP II and ERP III, extending the
ERP system outside corporate boundaries to interact with vendors and customers in the value
chain. Now a new technology, “cloud computing” has become more prevalent and pervasive.
With the growth of the internet and cloud computing, cloud based ERP technology has emerged
as a promising alternative for companies to choose for their ERP systems.
1.2 Background
1.2.1 Motivation for the Study
Over the past fifteen years the landscape of computing has been through significant
changes, initially with the Y2K scare forcing a lot of businesses of all sizes to switch to Y2K
compliant ERP systems. The investment in and implementation of an ERP system is typically
the largest, most pervasive and often painful systems endeavor a company endures. Technology

5
keeps changing at a rapid pace. Similar to older automobiles, client-server technologies from the
Y2K era or initial ERP systems implementation are eventually going to become outdated,
unsupported and in need of an upgrade or change. The emergence of mobile technologies such
as cell phones, tablets, etc., combined with more geographically disbursed workforces, global
competitiveness and need for more current information has caused a change in the way
companies need to deliver information in a faster, quicker, more economical manner. In
addition, these information consumers now extend beyond the barriers of the corporate
employees, to external business partners, vendors, customers, and even the public or social
media. Will companies choose to enhance their existing ERP systems, by upgrading them and/or
adding/integrating additional software components to meet the growing needs or will this new
cloud computing technology cause a shift in companies decisions to switch to more current cloud
based ERP technology? If cloud computing is supposed to be the next best thing since sliced
bread, will companies be willing to go through another major, painful, costly and risky systems
implementation to keep up with the “bleeding edge” of technology?
1.2.2 Significance of the Study
In the past, adoptions of new technologies have been studied using theories such as the:
(1) Technology Acceptance Model (TAM) (Davis (1989), Venkatesh, Morris, Davis, and Davis
(2003)), see Figure 3:
Figure 3: Technology Acceptance Model (TAM)

6
(2) Diffusion of Innovation (DOI) (Agarwal & Prasad, 1998; Cooper & Zmud, 1990; Crum,
Premkumar, & Ramamurthy, 1996); see Figure 4:
Figure 4: Diffusion of Innovation (DOI) Model
(3) Information Success (IS) Model (Delone, 2003; DeLone & McLean, 1992); see Figure 5:
Figure 5: IS Success Model

7
(4) Marketing Satisfaction Model applied to Application Service Providers (ASP) (Susarla,
Barua, & Whinston, 2003); see Figure 6:
Figure 6: Marketing Satisfaction Model
These are the predominant models used in the IS literature to study the adoption of a wide
variety of technologies. If applied to ERP adoption, each of these models presumes purchase of
the ERP system to measure the impact of some independent variables (IV’s; e.g., CSF’s) and
their impact on a dependent variable (DV) from one of the models specified (e.g., Satisfaction,
Implementation Success, etc.). These variables (the red boxes outlining variables above in
Figure 3 through Figure 6) would have to be measured post ERP selection decision. Thus,
implicit in these models is the fact that the given ERP system has been selected or purchased.
These variables highlighted in the models may have little relation to the actual selection decision
process and criteria since their success (or outcome) dimension relies on post-selection factors

8
that may not be related to the selection criteria (e.g., quality of service provider, estimate of
project budget, quality of software, etc.). Thus, we would be looking at DV measures that most
likely have been influenced by other variables or factors introduced post system selection. In
addition, these models would be only looking at “adopters” who decided to select (purchase or
adopt) the software. By using these models we would never get any feedback or measurement of
potential barriers to selection by “non-adopters” (lost customers) who chose not to purchase the
ERP system.
To address this issue, this current study uses Value Added Resellers (VARs) as subjects
in the study. VARs have the expertise, experience and are in contact with both prospects (who
turn into customers or purchasers) and non-purchasers during the sales cycle. Arguably, the
VARs are in the best position to evaluate and provide feedback about both the motives as well as
barriers to the Cloud ERP selection decision.
Fichman (2004) discusses the “Dominant Paradign for IT Innovation” (see Figure 7
below). He states that “the ultimate outcomes or benefits of innovation with IT are rarely
considered in studies within the dominant paradigm. No doubt the difficulty of measuring
impacts has played a role in this, however another important reason is the well known pro-
innovation bias, which refers to the assumption that innovations are beneficial” (Fichman, 2004,
p. 317).

9
Figure 7: The Dominant Paradigm for IT Innovation
Jeyaraj, Rottman, and Lacity (2006) review the research on the adoption and innovation
of IT-based innovations by both individuals and organizations. One of the prescriptions they
provide for overcoming the “adopter bias” is to increase the study of non-adopters. Although the
current study will not directly observe or get feedback of the non-adopters, using VARs as
subjects will hopefully provide more feedback about barriers than traditional adoption studies. A
practical outcome of this current study is to develop a competitive win-loss analysis and
feedback process with the CloudERP company to collect information directly from non-adopters
as well as the VARs about each particular lead’s win/loss scenario.
1.3 Theoretical and Conceptual Framework
The stream of ERP systems research is very mature but reviewers have identified a few
particular research areas that are consistently cited as lacking throughout the literature relating to
research applicable to SMEs, a lack of theory, and a need for research into cloud-based
applications and/or SaaS offerings (Addo-Tenkorang & Helo, 2011; Grabski et al., 2011). Prior
ERP research has focused primarily on an ERP’s implementation success and the relevant

10
critical success factors (CSFs) important throughout the various stages of an ERP’s lifecycle
(Addo-Tenkorang & Helo, 2011; Grabski et al., 2011; Schlichter & Kraemmergaard, 2010). The
focus of these studies has been on post-selection variables and the success or failure of the ERP’s
adoption or implementation. Inherent in these studies are firms who already selected ERP
technology, which provides no insight into any potential barriers that prevent selection. Also,
the dependent variable (DV) in these studies has typically been the success of the
implementation or customer satisfaction which is heavily influenced by a multitude of CSF’s and
other factors that may not reflect the actual criteria (or motives) used for the selection decision.
This current study adds methodological, empirical and theoretical contributions to this existing
stream of research about the motives and barriers in the selection of cloud ERP systems for
SME’s.
With respect to a theoretical perspective, this current study operationalizes and tests the
“Unified Framework of Motives and Barriers of Cloud ERP Adoption” (UF hereafter) put forth
by Saeed et al. (2012). This current study is grounded in a literature review and uses interviews
with industry experts (other industry VARs and executives from CloudERP, the company whose
VARs we will be surveying) to assess the face validity and content validity of the UF. Unique to
this current study is using VARs as subjects in order to provide better insight into the barriers
that are preventing the prospective buyers from not selecting to purchase cloud ERP technology.
As previously mentioned, prior studies have focused on measuring post-adoption
variables of interest. This (a) by definition (since the ERP product has been purchased) misses
capturing barriers to the purchase decision, and (b) results in typically measuring variables that
have been affected by many other post-selection factors unrelated to the motives that drove the
selection decision. This current study tests components of the constructs of “motivations” as

11
well as a “barriers” to cloud ERP software selection for SMEs as presented in the UF. The
research questions addressed by this current study are:
What factors are motivators for the selection of Cloud ERP for SMEs?, and
What factors are barriers to the selection of Cloud ERP for SMEs?
Specificially, this research modifies the UF and tests the components of the motives and
barriers of the modified UF. This study’s expert VARs dropped one motive as it was not
relevant to the CloudERP business model. Additionally, three barriers were dropped from the
original UF due to being as a no longer relevant in the current market environment. These three
dropped barriers with three new barriers. Results of the study show support for all seven motives
of the modified UF, whereas only three out of the eight barriers are supported. Note that two out
of the three barriers that were significant were barriers added by the content and face validity
checks performed with expert VARs. These results suggest that the “wave” of cloud ERP
technology is developing rather quickly and becoming more mainstream. The original Saeed et
al. (2012) UF framework is less than two years old and already is becoming somewhat out of
date as assessed by our experts and supported by the results of our survey.
1.4 Summary
This chapter provides an introduction and background to Cloud ERP and motivation for
the study. It also introduces the UF theoretical framework that is tested, as well as the research
methodology used, and the research questions that are addressed. The following chapters of this
dissertation provide support for the arguments stated above, describe the research methodology
used, as well as discuss the results and findings of the research:
Chapter CHAPTER 2: LITERATURE REVIEW. This chapter presents a relevant
review of ERP and Cloud streams of literature. The ERP literature is very mature and
expansive so key review papers are relied upon as the basis for a summary. At the other

12
extreme, Cloud research is in its infancy. In both of these areas a special section
addresses research that is focused specifically on SMEs.
Chapter CHAPTER 3: CLOUD ERP SELECTION FRAMEWORK. This chapter
reviews the UF presented in Saeed et al. (2012), listing the components and descriptions
of the individual components of the motives and barriers of Cloud ERP selection.
Chapter CHAPTER 4: RESEARCH METHODOLOGY. This chapter details the
steps involved in designing the final questionnaire, including expert reviews of the UF to
provide face and content validity checks. This chapter also outlines the data collection
strategy.
Chapter CHAPTER 5: RESULTS. This chapter provides analysis of the data,
including statistical test results (when applicable).
Chapter CHAPTER 6: DISCUSSION. This chapter discusses the major contributions
from the study, with supporting results from the previous chapter.
Chapter CHAPTER 7: CONCLUSION.: This final chapter discusses the limitations of
the study. It also discusses directions and recommendations for future research.

13
CHAPTER 2: LITERATURE REVIEW
2.1 ERP Literature
ERP research was in its infancy in the mid- to late-nineties. Esteves and Pastor (2001)
list several articles from 1997 conference proceedings while Davenport (1998) was the first
mainstream article. The stream of research has matured in a relatively short period of time,
peaking at 131 articles in the year 2005 and steadily declining to a total of only 13 articles in
2010 (Addo-Tenkorang & Helo, 2011, Fig. 1). Nine key review papers were identified spanning
various timeframes, some overlapping eras, some using different inclusion strategies and
categorization methodologies (see Table 1: ERP Review Papers).
Table 1: ERP Review Papers
ERP Review Papers
Author (Year) # Papers Reviewed
Time-Span Frame
Esteves and Pastor (2001) 189 1997-2000 Annotated bibliography and categorization by ERP life Cycle stage
Shehab, Sharp, Supramaniam, and Spedding (2004)
76 1990-2003 Selection/implementation
Botta-Genoulaz, Millet, and Grabot (2005)
80 2003-2004 Identifies six areas of research
Cumbie, Jourdan, Peachey, Dugo, and Craighead (2005)
49 1999-2004 Implementation/operation/benefit
Esteves and Bohorquez (2007)
640 2001-2005 Life Cycle
Moon (2007) 313 2000-2006 Categorizes papers into six major themes plus sub-themes
Schlichter and Kraemmergaard (2010)
885 2000-2009 Topic/discipline/method
Addo-Tenkorang and Helo (2011)
154 2005-2010 Categorize papers into ERP System Life Cycle (SLC) six major and sub phases
Grabski et al. (2011) Not Specified
Prior to 2011 AIS focused taxonomy of three major research areas and sub areas

14
The first review paper from 2001 (Esteves & Pastor, 2001) analyzed 189 publications
from ten IS journals and eight IS conferences, with only a small number from journal
publications (21) while the rest were from conferences. Research up through this point (1997-
2000) mainly focused on the implementation phase and related issues. The authors concluded
that ERP systems research should become interdisciplinary instead of just IS focused. In the
following years ERP research flourished. Due to the vast number of articles and topics
addressed, this paper will provide a summary of the categorization provided by the remaining
review articles and emphasize the particular areas and papers mentioned that address the main
concern of this research study, the ERP software selection process and SMEs.
Shehab et al. (2004) provides an overview of ERP systems, followed by an outline of
ERP evolution, then proceeds into major ERP vendors and the main drawbacks of their systems
and also has a section on implementation approaches and factors influencing the implementation
process. Shehab et al. (2004) state that the deployment of ERP can be divided into selection and
implementation. A section of their article called “Selection Criteria of an ERP System” is
presented in Table 2: ERP Selection Criteria (from (Shehab et al., 2004, Table II p. 372)) below.
This shows a list of the papers that they selected on the topic and various selection factors
considered.

15
Table 2: ERP Selection Criteria
Botta-Genoulaz et al. (2005) analyze 80 papers over a two year span (2003-2004) on the
basis of classification into six categories: Implementation of ERP, Optimization of ERP,
Management through ERP, the ERP Software, ERP for Supply Chain Management, and Case
Studies. They conclude that although ERP research is still growing, it has reached some
maturity while noting a growing interest in the post-implementation phase of ERP project, ERP
customization, the sociological aspects of implementations, interoperability of ERP and other
systems and on the return on investment (ROI) of ERP implementations.
Cumbie et al. (2005) analyzed 49 articles over a five year span (1999-2004) from top
Information Systems (IS) and Operations Management (OM) fields. The categorize research
topics into three areas of ERP: Implementation, Operation and Benefits. They further divide the

16
articles by research strategies or methodology within the three research topics. Qualitative field
studies were the overwhelming chosen research method, being used in 23 of the 49 articles.
Surveys were next closest with 13 followed by 10 Theory/Literature reviews. They concluded
that ERP research in 2005 was still exploratory in nature as evidenced by their breakdown of
research strategies.
Esteves and Bohorquez (2007) looked at 640 articles from 23 IS journals and ten IS
conferences from a five year span (2001-2005) and categorized them through an ERP lifecycle
based framework that is structured in phases. The breakdown of publications was 25 focusing on
adoption, 15 on acquisition, 207 on implementation (primary focus with over 32% of articles),
68 on usage, 59 on evolution, 35 on education and 40 were classified as general. They conclude
by stating that ERP systems are pervasive by nature and the topic lends itself to a wide range of
fields outside of IS and that research on the topic could or should be interdisciplinary.
Moon (2007) classifies 313 articles from 79 journals to try and understand what types of
ERP research questions that have been addressed and categorizes them by the following six
research topics: Implementation of ERP, Optimization of ERP, Management through ERP, The
ERP software, ERP for supply chain management, and Case studies (similar to Botta-Genoulaz
et al. (2005)). Again, implementation was by far the largest represented category with over 40%
of the articles. He also divides these major themes into sub-themes. One of the sub-themes of
interest under the Implementation stage is the “Focused Stage” which includes articles that cover
adopting company’s entire ERP life-cycle from the decision to “go for it” to the final “go live”
stage. In this “Focused Stage” there are only 12 articles involving the selection process
((Bernroider & Koch, 2001), (Stefanou, 2001), (Verville & Halingten, 2002b), (Verville &
Halingten, 2002a), (Bryson & Sullivan, 2003), (Verville & Halingten, 2003a), (Verville &
Halingten, 2003b), (Wei & Wang, 2004), (Luo & Strong, 2004), (Wei, Chien, & Wang, 2005),

17
(Baki & Çakar, 2005), and (Verville, Bernadas, & Halingten, 2005)) that will be addressed in
Section 2.1.1 Selection Articles.
Schlichter and Kraemmergaard (2010) studied 885 peer-reviewed publications from 2000
to 2009 with the goals of understanding the current state of ERP research and also to develop a
conceptual framework identifying areas of concern with regard to ERP systems. They find that
ERP research is an interdisciplinary field and that the number of ERP publications has decreased
(peaking with 116 articles in 2003 and decreasing to 66 articles in 2009 ) signaling that it is a
mature research field. They identified eight areas of concern and list relevant issues in each area:
(1) Implementation, (2) Optimization and post-implementation, Management and organization,
(4) the ERP tool, (5) Supply Chain Management and ERP, (6) Studying ERP, (7) Education and
Training, and (8) Market and Industry. They study states that the topic of implementation of
ERP is the most studied topic accounting for 29 percent of the papers that they reviewed. They
also found that case studies have been the most used method (22 percent) but that in the later
years this research method was declining at the expense of surveys, with a larger proportion of
survey studies eclipsing case studies starting in 2006.
One of the relevant issues listed under “Implementation” area of concern was “Which
criteria should be used in selecting the ERP system, e.g., how well does the ERP system fit the
business strategy” (Schlichter & Kraemmergaard, 2010, p. 510). They cited two papers, (Wei et
al., 2005) and (Wei & Wang, 2004)) which relate to ERP selection and will be addressed in
Section 2.1.1 Selection Articles.
Lastly, Schlichter and Kraemmergaard (2010) analyze the various theoretical lenses used
to analyze a specific aspect of ERP, Business Process Re-engineering (BPR). Of the 20 papers
they analyzed, CSF’s was the dominant lens used in eight of the twenty papers. Formal business
modeling, connectionist model, innovation processes, organizational sociology, change

18
management, supply chain theory, object orientation, organizational memory and adoption
models are all the other “theoretical lenses” listed (some of these sound like a stretch to be called
“theoretical lenses”, sounding more like categorization or classification methodologies than
theories).
Addo-Tenkorang and Helo (2011) provides a more recent picture of the ERP research
using a similar categories as Moon (2007). The research category of “Implementing ERP” is
most pervasive (54% of articles in this review) since it can potentially allow a company to
manage its business better and provide all the touted benefits of improvements in information
quality, integration, coordination, planning, control, SCM, customer service, etc. (Gattiker &
Goodhue, 2005). On the flipside is the numerous failed implementations that are often reported.
They divide subtopics of implementation into ‘General’ (describe implementation practices and
approaches, models, methodologies, various difficulties/issues encountered, etc), ‘Case Studies’
(describing implementation experiences at one or several companies), CSF’s (popular topic
although many inconsistent and inconclusive findings), ‘Change Management’ (including BPR
efforts), ‘Focused Stage’ (addressing particular stage of ERP implementation life-cycle), and
‘Cultural Issues’.
The next major topic (Addo-Tenkorang & Helo, 2011) addresses is ERP
Exploration/Uses. The subtopics explored in this category are ‘General’ (user acceptance,
satisfaction, post-implementation BPR, uncertainty management, process management,
legal/accounting requirements, upgrades/migration, political roles, operational capabilities),
‘Decision Support Systems’ (Business Intelligence (BI), forecasting/planning/control of
operations), ‘Focused Function’ (accentuating the efficient exploration of ERP systems in
specific areas such as manufacturing, marketing, accounting, production, project management,
operations, etc.), and ‘Maintenance’ (keeping system up and running). Other major topics

19
include Extension (providing functionalities beyond the original ERP system (ERP 2.0 or 3.0)
including e-Business/Commerce, SCM, CRM, BI, Service-oriented Architecture (SOA),
Software as a Service (SaaS), etc), Value (what are the benefits, how to measure value, market
reactions, cost/benefit, ROI, etc.), and Education/Training (IT skills, end users at various stages,
students).
In their “Trends and Perspectives” and “Analysis” sections Addo-Tenkorang and Helo
(2011) provide several key recommendations supporting the importance of this studies topic.
Regarding SaaS they state that this “model is of much interest when researching the future of
ERP systems…but there seem to be not much academic research published within this area yet.”
They further discuss SaaS by stating that “this future delivery model might change the current
ERP systems value-chain…and very well could include hybrid SaaS solutions where the
distributors offer the customized SaaS solutions to the end customer.” They discuss an
interesting question of examining how SaaS-based ERP systems delivery meet [change] the
business IT needs of organizations including the small and mid-sized and what the implications
are for the ERP value chain of switching from perpetual licensing (purchasing) to SaaS offerings.
The mention using the Resource Based View (RBV) and the perspective of core competencies as
theoretical lenses to offer interesting perspectives into the value chain issue mentioned above.
Lastly, they specifically state that the topic of “ERP in SMEs…[is an] area lacking in ERP
research and development.”
Grabski et al. (2011) state that “early [ERP] research consisted of descriptive studies of
firms implementing ERP systems. Then researchers started to address other research questions
about the factors that led to successful implementations: the need for change management and
expanded forms of user education, whether the financial benefit outweighed the cost and whether
the issues are different depending on organizational type and cultural factors.” The authors point
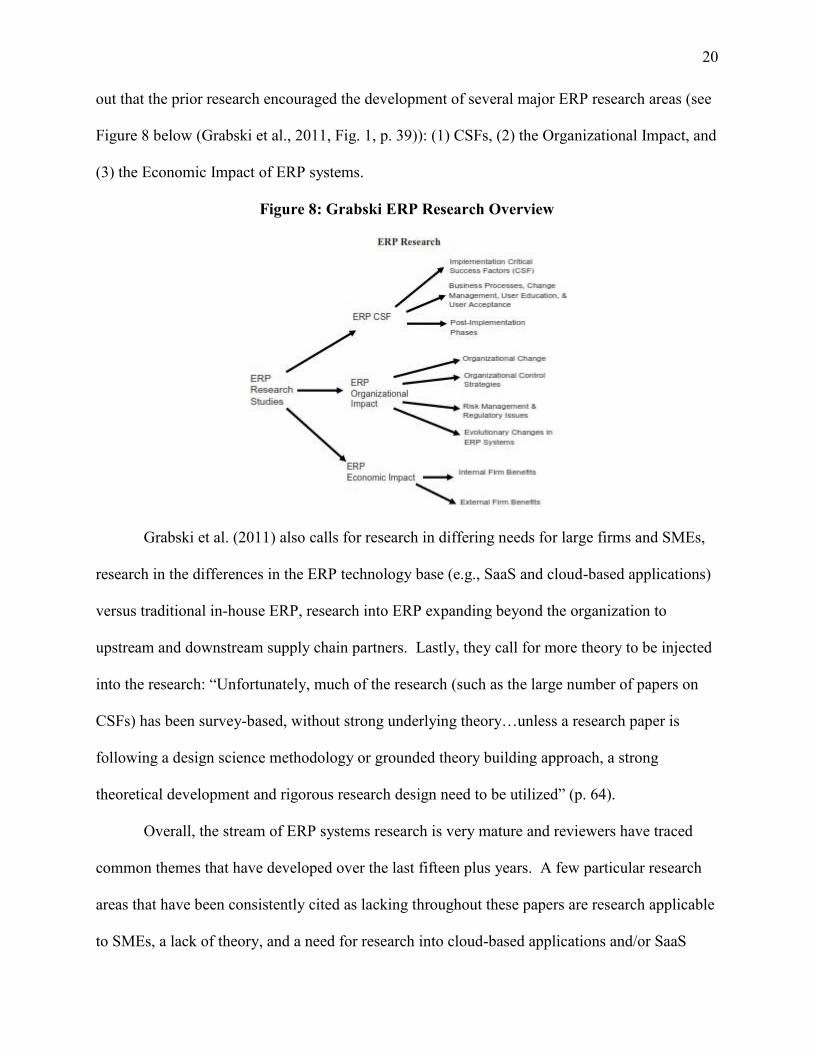
20
out that the prior research encouraged the development of several major ERP research areas (see
Figure 8 below (Grabski et al., 2011, Fig. 1, p. 39)): (1) CSFs, (2) the Organizational Impact, and
(3) the Economic Impact of ERP systems.
Figure 8: Grabski ERP Research Overview
Grabski et al. (2011) also calls for research in differing needs for large firms and SMEs,
research in the differences in the ERP technology base (e.g., SaaS and cloud-based applications)
versus traditional in-house ERP, research into ERP expanding beyond the organization to
upstream and downstream supply chain partners. Lastly, they call for more theory to be injected
into the research: “Unfortunately, much of the research (such as the large number of papers on
CSFs) has been survey-based, without strong underlying theory…unless a research paper is
following a design science methodology or grounded theory building approach, a strong
theoretical development and rigorous research design need to be utilized” (p. 64).
Overall, the stream of ERP systems research is very mature and reviewers have traced
common themes that have developed over the last fifteen plus years. A few particular research
areas that have been consistently cited as lacking throughout these papers are research applicable
to SMEs, a lack of theory, and a need for research into cloud-based applications and/or SaaS

21
offerings. This research paper proposes to help bridge these gaps by using a survey with VARs
of CloudERP to test the constructs of motives and barriers presented in the UF.
2.1.1 Selection Articles
The selection1 articles mentioned in the ERP Literature review under both the Moon
(2007) and Schlichter and Kraemmergaard (2010) papers were numerous. I added several other
traditional ERP selection review articles to this list and succinctly summarized them in Table 35
in Appendix A – Additional ERP Selection Papers (note that the table does not duplicate any of
the articles that also appear in Table 2 from Shehab et al. (2004)).
Kamhawi (2008) is the only traditional ERP study located that looked at barriers to ERP
adoption. The study investigates the motives adopted, benefits realized and barriers faced in the
adoption and non-adoption of ERP systems in Bahrain. Kamhawi (2008) uses a survey based on
prior studies and get responses from 16 adopter firms (40 usable questionnaires) and 37 non-
adopter firms (51 usable questionnaires). The list of barriers for not adopting traditional ERP
systems in large Bahrainian firms is shown in Table 3 below (from (Kamhawi, 2008, Table VI,
p. 323)), along with the means and significance levels. “Requires large capital investments”,
“Require too much training for employees” and “We have more important priorities now” are all
significant.
1 “Selection” refers to factors considered, decisions processes used and system and organizations characteristics
affecting the choice of an ERP system.

22
Table 3: Table VI from Kamhawi (2008)
Two additional papers are noted. First, Duan, Faker, Fesak, and Stuart (2013) present a
framework that discriminates not only between Cloud-based ERP and On-premise ERP, but also
considers “Hosted ERP” which they define as “a service offered to an individual or an
organization by a provider that hosts the physical servers running that service somewhere else”.
Typically, “Hosted ERP” involves running traditional client/server ERP on a hosted, virtualized
environment (typically SaaS or IaaS) and then accessing the server using remote technologies
such as Citrix or Remote Desktop. While the system is accessible via the internet, it is not based
on cloud technology and cannot be accessed using a web browser via mobile devices such as
tablets and cell phones. This is a major differentiator. Their framework comparing traditional,
hosted and cloud ERP is shown in Table 36: Hosted vs. On-Premise vs. Cloud ERP (Duan et al,
2013) in 8.2 Appendix .

23
Lastly, Hoseini (2013) provides a framework of the advantages and disadvantages of
adopting SaaS ERP (see Figure 24: SaaS ERP Advantages (Hoseini, 2013) and Figure 25: SaaS
ERP Disadvantages (Hoseini, 2013) in Appendix ). Note that SaaS does not equal Cloud ERP
although there are some similarities. She further tests her framework using a survey of “users”
who were “aware of ERP adoption/implementation issues as well as knowledgeable about SaaS
adoption issues due to their experience or general knowledge”. These “users” were chosen based
on descriptions in their LinkedIn profiles and they had to be living in Sweden. Based on her
samples size of 45 responses, five of the 19 SaaS ERP advantages are statistically significant
(supported) but none of proposed twelve SaaS ERP disadvantages were significant.
2.1.2 SME Applicability
SME’s typically do not have large budgets for ERP implementations and not near as
much cushion or savings as larger companies in the case of failure. Thus implementing a new
ERP system is an even riskier challenge for the SME market. “The cost associated with
implementation of ERP systems and difficulties found in achieving management expectations are
most significant reasons hindering SMEs to adopt the systems. Over the last decade or so
implementation of ERP systems in SMEs is becoming common, as the technology is more
established and prices come down” (Ahmad & Pinedo Cuenca, 2013, p. 104). Rao (2000) states
that since SMEs do not have the robustness associated with big companies that they have to tap
the power of IT and an integrated information system to stay competitive and customer oriented
and that ERP is often considered the answer for their survival. To keep up with the increasingly
competitive, global, digital marketplace, SMEs will have to confront some sort of ERP decision
choice in the near future. These options include (1) to purchase or rent (i.e., SaaS) and
implement a system for the first time, (2) to continue upgrading their existing system and/or

24
enhancing it with “add-on” functionality, or (3) to replace legacy system by purchasing or
renting (i.e., SaaS) a new, modernized system based on new technologies (i.e., cloud ERP).
In concluding their analysis about ERP adoption in SME’s Haddara (2012) state that
“Due to their limited resources, budgets and their high sensitivity to costs, when SMEs take the
first step into implementing an ERP system, they need to think about many things, foremost the
cost of adoption. Literature suggests that most ERP implementations fail due to inaccurate and
optimistic budget and schedule estimations, as well as, anticipating indirect costs beforehand is
problematic” (p. 250). Elragal and Haddara (2010) state “sometimes benefits in relation to costs
are not important or unattainable. For example, when an SME’s budget is crossed, it does not
matter how much benefits it will gain through dedicating more money to the project, as it might
be out of the required resources already” (p. 99). “SMEs are more cost sensitive than large
enterprises. Any cost rise or project delays would seriously affect SMEs’ survival in the market.
Since ERP adoption within SMEs is still immature, researchers need to inspect and identify the
basic drivers that influence ERP adoption decisions, especially ERP adoption costs” (Haddara,
2012, p. 251).
2.2 Cloud Literature
2.2.1 Cloud Definition
Defining “the cloud” is like trying to hit the proverbial moving target – it is tough
because it keeps changing. It is similar to what Swanson and Ramiller (1997) introduced to the
IS literature as an organizing vision which is a “focal community idea for the application of
information technology in organizations” (p. 460). “When an organizing vision is just
introduced, the content of the vision might be incoherent as actors interpret the underlying IT
innovation in different ways that suit their diverse interests” (Wang & Swanson, 2007, p. 79).
Currie (2004) states that these visions have a “revolutionary impact on work organization.” This

25
sounds very much like “the cloud.” According to their landing page, the National Institute of
Standards and Technology (NIST) had a hard time defining the cloud: “After years in the works
and 15 drafts, the NIST’s working definition of cloud computing, the 16th and final definition
has been published” (NIST Tech Beat, 2011).
NIST states that Cloud computing is an evolving paradigm and that their definition is just
to provide a baseline for discussion. With that in mind, the NIST definition of cloud computing
is “a model for enabling ubiquitous, convenient, on-demand network access to a shared pool of
configurable computing resources (e.g., networks, servers, storage, applications, and services)
that can be rapidly provisioned and released with minimal management effort or service provider
interaction” (Mell & Grance, 2011, p. 2). The cloud model is composed of five essential
characteristics: on-demand self-service, broad-network access, resource pooling, rapid elasticity,
and measured service (see Figure 9 below).
Figure 9: Cloud Computing Models (adapted from NIST)
The NIST also identifies three cloud service models and four cloud deployment models.
The service models are (Alali & Yeh, 2012, p. 14):

26
(1) Software-as-a-Service (SaaS) allows users to run a variety of software applications on
the Internet without having possession or managing applications (e.g., Salesforce.com,
Gmail, Microsoft Online, etc.).
(2) Platform-as-a-Service (PaaS) provides a computing platform to support building of web
applications and services completely residing on the Internet (e.g., Google Apps,
Force.com, 3Tera AppLogic).
(3) Infrastructure-as-a-Service (IaaS) allows the use of computer hardware and system
software, including operating systems and communication networks in which the cloud
provider is responsible for hardware installation, system configuration, and maintenance
(e.g., Amazon EC2, Citrix Cloud Center).
The deployment models are (Jansen & Grance, 2011):
(1) Public cloud is available to the public or a large industry group and is owned by an
organization selling cloud services.
(2) Private cloud is a cloud operated solely for an organization. It can be managed by the
organization or a third party and can exist on or off premises of the organization.
(3) Community cloud is a cloud that is shared by several organizations and supports a
specific community purpose (e.g., mission, security requirements, policy, and
compliance). It can be managed by either an organization or a third party and can be on
or off premises of the community organizations.
(4) Hybrid cloud is a composition of two or more clouds that remain unique entities but are
bound by standardized or proprietary technology that enables data and application
portability.
There have been other definitions of the cloud that vary slightly. Marston, Li,
Bandyopadhyay, Zhang, and Ghalsasi (2011) state that “There are perhaps as many definitions as
there are commentators on the subject…[including NIST]”. They further state that “our
definition does not explicitly require that the services be provided by a third-party, but
emphasizes more on the aspects of (1) resource utilization, (2) virtualized physical resources, (3)
architecture abstraction, (4) dynamic scalability of resources, (5) elastic and automated self-
provisioning of resources, (6) ubiquity (i.e. device and location independence) and (7) the
operational expense model” (Marston et al., 2011, p. 177). This definition allows for private
cloud deployment which in turn would rule out multi-tenancy aspects required in some cloud
definitions.

27
Lastly, Kim (2009) provides the more condensed definition as “being able to access files,
data, programs and 3rd
party services from a Web browser via the Internet that are hosted by a 3rd
party provider” and “paying only for the computing resources and services used”. He also states
that “cloud computing is used synonymously, inaccurately in my view, with such terms as utility
computing (or on-demand computing), software as a service (SaaS), and grid computing” (Kim,
2009, p. 65).
2.2.2 Cloud Benefits and Weaknesses
“Cloud computing represents a convergence of two major trends in information
technology: (a) IT efficiency, whereby the power of modern computers is utilized more
efficiently through highly scalable hardware and software resources, and (b) business agility,
whereby IT can be used as a competitive tool through rapid deployment, parallel batch
processing, use of compute-intensive business analytics and mobile interactive applications that
respond in real time to user requirements” (Marston et al., 2011, p. 177). It represents both a
technology and an economic shift in an organization’s use of IT resources, offering the potential
for significant savings in both IT expenditures and resources (Rosenberg & Mateos, 2011).
Marston et al. (2011) list key advantages and opportunities of cloud computing (p. 177-
178, 182):
1) It dramatically lowers the cost of entry for smaller firms trying to benefit from compute-
intensive business analytics that were hitherto available only to the largest of
corporations,
2) It can provide an almost immediate access to hardware resources, with no upfront capital
investments for users, leading to a faster time to market in many businesses. Treating IT
as an operational expense (in industry-speak, employing an ‘Op-ex’ as opposed to a
‘Cap-ex’ model) also helps in dramatically reducing the upfront costs in corporate
computing,
3) Cloud computing can lower IT barriers to innovation,
4) Cloud computing makes it easier for enterprises to scale their services, which are
increasingly reliant on accurate information, according to client demand,

28
5) Cloud computing also makes possible new classes of applications and delivers services
that were not possible before (e.g, mobile interactive applications, parallel batch
processing, business analytics, and extensions of computer intensive desktop
applications),
6) Small businesses can exploit high-end applications like ERP software or business
analytics that were hitherto unavailable to them,
7) Potential to help developing countries reap the benefits of information technology
without the significant upfront investments that have stymied past efforts, and
8) Cloud computing appeals to large IT infrastructures that want to reduce their carbon
footprint.
Marston et al. (2011) also list several weaknesses and threats associated with the cloud
(Marston et al., 2011):
1) Organizations will be justifiably wary of the loss of physical control of the data that is put
on the cloud,
2) Organizations will also be wary of entrusting mission-critical applications to a cloud
computing paradigm where providers cannot commit to the high quality of service and
availability guarantees that are demanded in such environments,
3) Backlash from entrenched incumbents (e.g., IT staff and job security),
4) Cloud providers going bankrupt/stability, especially in a down economy,
5) Security,
6) Lack of standards,
7) Vendor lock-in and increasing costs, and
8) Government regulation, from data privacy and access to audit requirements.
2.2.3 SME Applicability
In a rapidly changing, competitive marketplace products and skills become outdated,
especially with the pace of technological advancements. SMEs have limited resources and are at
a disadvantage. “Cloud computing has the potential to play a major role in addressing
inefficiencies and make a fundamental contribution to the growth and competitiveness…[of]
29
SMEs” (Sahandi, Alkhalil, & Opara-Martins, 2013, p. 1). This new strategy provides for
business agility and acts as a catalyst for more innovation allowing SMEs to implement new
strategic ideas at a faster pace in order to gain a competitive advantage over their competition
(Sahandi et al., 2013). “Cloud computing offers a new pathway to business agility and supports
a faster time to market by offering ready-to-consume cloud enable resources such as IaaS,
software platforms, and business application…far faster than acquiring, installing, configuring
and operating IT resources in house” (Sahandi et al., 2013, p. 2).
Sahandi et al. (2013) surveyed 169 UK SMEs. Their results showed that just over half
claimed to know what cloud computing is and 25% were unsure of the concept. This in part may
account for the slow adoption of cloud computing by SMEs which is expected to gain
acceleration as understanding and awareness of the cloud increases (Sahandi et al., 2013). They
also found that the main motivations for SMEs adopting cloud services were cost reduction
(45.5%) followed closely by mobility and convenience in accessing applications (44.9%).
Ubiquity and flexibility of cloud computing were motives for 38.9% of the respondents while
increasing computing capacity (32.9%) and providing greater IT efficiency (31.7%) were found
important as well.
When Sahandi et al. (2013) asked what they plan to use cloud-based services for, 32.5%
said for their current business operations (ERP). On the flip side, 27% of respondents had no
plans to use cloud computing while another 20.2% said that don’t know if they would. The good
news was that 17.8% said that they planned to used cloud services for new business operations,
indicating that SMES are aware of the importance of business agility and the importance of
cloud computing in supporting innovative, dynamic and evolving business environments
potentially leading to competitive advantage (Sahandi et al., 2013). 54.6% of the surveyed
SMEs indicated data protection and privacy as the main reason for not considering cloud

30
services. Also, almost half of the surveyed SMEs considered vendor lock-in as a major concern
for adopting cloud computing’ and that they are worried about losing control of their data and
lack of trust problems (Sahandi et al., 2013).
From the results of the Sahandi et al. (2013) study, it seems that the potential advantages
of cloud computing exist for SMEs to reduce costs and increase agility but it may take some time
for the bandwagon phenomenon to occur since knowledge and awareness of cloud computing
must increase. It will also take time for SMEs to gain trust and confidence with the vendors and
to gain confidence in security issues (Sahandi et al., 2013).

31
CHAPTER 3: CLOUD ERP SELECTION FRAMEWORK
Saeed et al. (2012) perform an exploratory study using qualitative methods (ten
interviews with highly experience ERP practitioners) and a systematic literature review (research
papers from 1995-2011 in domains of (1) adoption of new technologies, (2) motives/barriers of
traditional ERP, (3) ERP Outsourcing, and (4) characteristics, benefits and challenges of cloud
computing) to build a unified framework (UF) of motives and barriers of cloud ERP adoption.
They stated “Cloud ERP is a new and emerging area of research and there’s a lack of scientific
research on this topic. For that reason, it requires exploratory research by using qualitative
methods.”
This current study will use the components UF as a starting point for the preliminary
survey that will be presented to industry experts for face validity and content validity checks.
The final Saeed et al. (2012) UF is shown below in Figure 10.

32
Figure 10: Saeed et al (2012) Unified Framework
The next sections detail and describe the individual components of the Motives construct
and the Barriers construct (note that all descriptions below are summarized from Saeed et al.
(2012)).
3.1 Components of “Adoption Motives” Construct
The Adoption Motives are broken into three categories (for convenience): strategic,
operational and technical motives.

33
3.1.1 Strategic Motives
3.1.1.1 Cloud ERP provides flexibility for business innovation
Cloud ERP enables mobility, allowing access from pretty much any device, anywhere,
anytime. It reduces barriers to innovation by allowing new classes of applications and services
to be delivered that were not possible before. Cloud solutions are new and modern so vendors
typically are in a continuous improvement mode, providing better opportunities for IT innovation
which paves the way to business innovation.
3.1.1.2 Faster time to market for products and services
Cloud ERP takes less time to set up since the hardware and software infrastructure are
typically maintained by third-party cloud providers. Barring any heavy customization or
integration the system can be up and running relatively quickly, benefitting companies by
reducing the time to market of their products and services.
3.1.1.3 Cloud ERP allows users to concentrate on their core business
Since the technical aspects (hardware and software) of Cloud ERP are typically managed
by expert, third-party cloud providers, companies do not have to hire/maintain internal IT staff to
manage and resolve technical problems and can focus on their core business. The service
providers are responsible for the technical problems.
3.1.2 Operational Motives
3.1.2.1 Reduced IT cost for the Enterprise
Cloud vendors are able to provide services at a low price because of their economies of
scale and dynamic resource sharing. Compared to traditional in-house systems which in addition
to the initial capital expenditures require support, maintenance, space, personnel/employees,
excess capacity IT personnel/resources and other such costs, cloud ERP includes all of these

34
costs which reduces the Total Cost of Ownership (TCO). It also becomes affordable to SMEs
that cannot justify all the aforementioned ongoing costs.
3.1.2.2 Cloud ERP is scalable on demand
Cloud services are typically virtualized allowing for dynamic resource availability. Thus
resources are scalable on demand. This allows companies to pay for the amount of usage that
they need as it fluctuates with their demand. This is very attractive to SMEs who have plans for
growth in the future and do not want to have to worry about outgrowing their systems capacity.
3.1.2.3 Cloud ERP has low capital expenditure
Enterprises can avoid initial capital hardware and software infrastructure and IT costs by
using cloud-based solutions. This is especially attractive to SMEs who are cash-strapped and
cost sensitive and do not typically have the resources or know-how to run ERP systems on their
own.
3.1.3 Technical Motives
3.1.3.1 Cloud ERP vendors provide high technical reliability
Cloud ERP vendors are more knowledgeable and reliable than in-house IT departments,
especially with respect to their cloud ERP system. This is due to economies of scale, their
product-specific focus and their specialized product-related technical capabilities. Also, their
dynamic resource availability provides more hardware reliability than is possible in-house.
3.1.3.2 Cloud ERP vendors provide automatic upgrades
Cloud vendors can upgrade their systems economically because of the single source
codes and multi-tenancy features. This increases an organization’s capabilities as the upgrades
are done automatically by the vendors.

35
3.2 Components of “Adoption Barriers” Construct
The Adoption Barriers are broken into the same three categories (for convenience):
strategic, operational and technical motives.
3.2.1 Strategic Barriers
3.2.1.1 Invested too much into on-premises ERP systems
Cloud ERP may require lower up-front costs for the hardware and software
infrastructure, implementation processes. Costs of both types of systems should be about the
same. Other costs already incurred for their existing system such as employee training and
customizations may deter a company from re-investing in a Cloud ERP system.
3.2.1.2 Lack of early adopters because of cloud ERP’s low awareness
Cloud ERP is new and companies may not be aware of its existence or benefits. Also,
cloud ERP products may not have a solid enough track record or reputation for companies to risk
such a huge investment in their company’s primary information system.
3.2.2 Operational Motives
3.2.2.1 Government regulations regarding the secure data storage
Some governmental regulations regarding data storage were made before cloud
computing. Since companies are not aware of the data location in the cloud they may be hesitant
to use Cloud ERP since they may be in violation of a regulation with which it it cannot document
compliance. Some cloud ERP systems may not meet strict government regulations or SOX
requirements for secure cloud data storage.
3.2.2.2 Current traditional ERP systems support business strategy
“If it’s not broke, don’t fix it.” If the current system is meeting a company’s primary
requirements, why abandon that for a potentially costly, painful, risky investment into a new
system? This is especially true if a company is not IT-friendly.

36
3.2.2.3 Slow speed (or loss) of Internet connection & down time of cloud servers
Due to the Cloud ERP system being located at a remote location accessible only over the
internet, unavailability of the cloud provider servers or outage of internet service can become a
big disaster. Thus, the potential lack of internet speed, connectivity and server availability can
be a big obstacle for Cloud ERP adoption.
3.2.3 Technical Barriers
3.2.3.1 Security and privacy risks are huge in Cloud ERP
Due to the novelty of cloud ERP systems and the loss of control of data, enterprises may
not be yet ready to hand over their most important and valuable data yet to a third party. Add on
the fact that the data is now in the cloud it makes it even more attractive to hackers. Data
security is one of the most cited concerns of cloud computing. Questions also abound about data
privacy, data lock-in, vendor dependency and vendor lock-in.
3.2.3.2 Customization is difficult in Cloud ERP
Cloud ERP systems are standardized, with each system based on the same code base.
This makes customization more difficult because the environment is stricter and users have less
control. There are various cloud ERP solutions available with differing level of customization
capabilities. As these products and technologies mature, these problems may subside but
nevertheless, customizations are typically known as problem areas in both traditional and cloud
ERP products.
3.2.3.3 Integration is difficult in Cloud ERP
Cloud based systems are standardized and in a strict environment and integration may
involve applications and data on multiple clouds that are private as well as public or even non-
standardized legacy systems. This is becoming less of a problem as cloud service providers

37
abilities and experience increase as well as the advancement of standardized SOA and web
services expand.

38
CHAPTER 4: RESEARCH METHODOLOGY
4.1 Research Design
This will be a quantitative study using a survey to collect data. The proposed research
model is shown below in Figure 11 as a simple, straightforward variance model positing the
identified motives of cloud ERP to the selection of cloud ERP (+ relationship) while the
identified barriers of ERP selection will be depicted as the drivers of the decision not to select (-
relationship).
Figure 11: Research Model
The components of the motives and barriers constructs presented in the UF presented in
Chapter 3 will be measured using a field survey. Yin (2009) states that a survey is an
appropriate method to use when answering “what” types of research questions (a) that do not
require control of behavioral events, and (b) when the focus of the study is on contemporary
events.
The primary goal is to measure the constructs of “Motives” and “Barriers” to the
purchase or selection decision of a cloud ERP system. VARs of CloudERP will be subjects to
complete the survey. Note that there will be no actual measurement of a given customer’s Cloud
ERP purchase decision. The survey will focus on capturing just the components of the motives
construct leading to purchases and more importantly the components of the barriers construct of
the non-purchasers based on the CloudERP VAR survey responses.

39
4.2 Survey Development
The starting point of the survey is the UF presented by Saeed et al. (2012) presented in
Chapter CHAPTER 3: . The next step in the process was to have the survey checked for face
and content validity by ERP experts. Trochim (2008) states that “any time you translate a
concept of construct into a functioning and operating reality (the operationalization) you need to
be concerned about how well you performed that translation” (p. 58). Trochim (2008) further
states that face validity (looking at the operationalization and see whether on its face it seems
like a good translation of the construct) and content validity (checking the operationalization
against the relevant content domain for the construct) are translation validity types that attempt to
assess the degree to which you accurately translate your construct into the operationalization (p.
59).
In order to assess the face and content validity of the UF, I reviewed the UF with
CloudERP personnel and I made some minor wording changes for clarification purposes to some
of the motives and barriers in the UF. Then I reached out to four VAR owners in the SME ERP
industry. The four VARs were selected based on long-time established relationships that I have
had with them during my time in the industry. I sent all four of them an email requesting an hour
meeting (preferably in person if possible). In the email request I explained the purpose of the
meeting along with two attachments: (1) An “Executive Summary” (essentially a document with
the abstract from the dissertation proposal, and (2) a “VAR Feedback” form. The VAR
Feedback form essentially presents the UF along with a column to comment. The feedback form
has additional pages that provide detailed explanations of the specific items in the UF. Also,
subsequent pages were provided at the end of the “VAR Feedback” form that listed additional
prompts/ideas for advantages/disadvantages from the SaaS ERP (Hoseini, 2013), Cloud and
Hosted ERP (Duan et al., 2013) and Traditional ERP (Kamhawi, 2008) advantage/disadvantage

40
frameworks mentioned earlier. I gave them the list of these prompts of the other items to
experts, who were free to read the items on this list, free to comment and/or recommend them for
inclusion in the UF.
I was able to set up meetings with three out of the four ERP VAR owners. Each of the
three VAR owners sold both traditional ERP systems to SMEs as well as Cloud ERP systems.
Each of the VAR owners are resellers of a different Cloud ERP product (one sold Intaact, one
Acumatica, and one NetSuite). Two of these VARS were represented on Accounting Today’s
Top VAR 100 list of US VARs (Accounting Today, 2013). I had them review the documents
that I sent them in preparation for the meetings. I conducted two of the meetings in person. The
third meeting was via phone conversation. Ideally, it would have been preferable to conduct
each interview in person since the nature of the exchange is richer when non-verbal cues of the
interviewee can be observed. But due to the geographical disparity it was most economical to
conduct one of the interviews via telephone. Each of the interviews was audio recorded with the
interviewees’ permission. Each interview lasted between 45 and 75 minutes. The interviews
were semi-structured, using each of the individual UF motives and barrier items as a point of
discussion. I took notes during each interview with particular emphasis on comments and
modifications relating specifically to the UF. The last part of the interview I used to review my
notes specific to each of the motives and barriers in the UF with the interviewee and verify that I
had captured their comments and/or feedback correctly.
At the conclusion of each of the three interviews, I updated a spreadsheet with three
columns for summarizing each of the interviewees’ comments regarding each of the items in the
UF. This was structured exactly like the “VAR Feedback form” but included the three additional
columns of VAR comments. This was useful for presenting and discussing with the staff at
CloudERP who would make the final decision on what went out in the survey.

41
During this same timeframe, I had been working with CloudERP on “demographic” or
descriptive questions that were of interest to them relating to this project. We were going to be
using CloudERP’s VAR channel network to conduct the survey and this was an opportunity to
collect information about their channel partners in addition to their feedback on the Cloud ERP
motives and barriers. After conducting the interviews with the three VARs, I had one last phone
meeting with CloudERP to: (1) review and finalize both the demographic questions, and (2)
review the feedback from the expert VARs relating to the motives and barriers. Before this final
meeting, I presented to them the additional information I collected from the three VAR
interviews in summarized fashion on the VAR feedback form (described earlier). We reviewed,
modified and finalized the demographic questions. We also finalized the motives and barriers.
The final list of motives are shown in Table 4: Final Cloud ERP Adoption Motives below:
Table 4: Final Cloud ERP Adoption Motives
# Saeed et al (2012) Unified UF as Presented Final Framework used in Survey
1 Cloud ERP provide Flexibility for Business
Innovation
M1: Cloud ERP provides Flexibility and Mobility
enabling Business Innovation
2 Cloud ERP allows Faster time to Market for
Products and Services
M2: Cloud ERP provides Rapid Implementation
which allows a company Faster time to Market for
their Products and Services
3 Cloud ERP allow users to Concentrate on their Core
Business
M3: Cloud ERP purchased as SaaS allow users to
Concentrate on their Core Business
4 Cloud ERP Provides Reduced IT Cost for the
Enterprise
M4: Cloud ERP Provides Reduced Ongoing IT Cost
for the Enterprise
5 Cloud ERP is Scalable On-Demand M5: Cloud ERP is Scalable On-Demand
6 Cloud ERP requires Low Capital Expenditure M6: Cloud ERP puchased as SaaS requires Low
Capital Expenditure
7 Cloud ERP Vendors provide High Technical
Reliability
M7: Cloud ERP purchased as Saas has advantage of
providing High Technical Reliability since it is being
Externally and Centrally Managed by Software
Vendor or Service Provider
8 Cloud ERP Vendors provide Automatic Upgrades Not true for CloudERP; therefore dropped from
survey
Cloud ERP Adoption Motives

42
As can be seen in the Table 4 above, the motives presented in the UF remained mostly
intact. Seven out of the eight initial motives were retained with slight modifications. Several of
the modifications involved a basic change for clarification purposes (adding/including
“purchased as SaaS”2 to motive #’s 3, 6 and 7). Additional words were added to the text of
motives #1, 2 and 7 in Table 4 for clarification. Motive #8 (in red) was dropped from the survey
since it was not directly applicable to CloudERP’s business model3 (which allows for customer
specified upgrades). This item should be retained for use in a survey that was to be used for a
SaaS vendor that did provide automatic upgrades. Note that the last column of this table presents
the final motives used in this studies’ survey (except for last “red” row). Each of these motives
is preceded by “M#:” where the # ranges from 1-7. The notation for these motives, M1 through
M7, is presented later in Table 7 in the results section and subsequently used in the coding of the
motive data variables.
The final list of barriers are shown in Table 5: Final Cloud ERP Adoption Barriers below:
2Note that the company that I am working with, CloudERP, is relatively unique to the industry and offers several
different purchasing models. One purchasing option is what is termed “Perpetual”. This occurs when the customer
purchases CloudERP’s software upfront and outright (like traditional system purchases and normally an annual
maintenance fee for software upgrades and support is required) and the customer then can host the software in-house
(private cloud) or pay an ASP to host the system in a cloud environment. Another purchasing CloudERP offers is
the SaaS option which is in-line with the NIST’s SaaS servicing model. Since the survey will be administered to
CloudERP VAR’s it was decided that several of the motives and barriers were applicable to only the SaaS
purchasing option where CloudERP (the vendor) is responsible for the hosting and other technical aspects associated
with the system. 3 CloudERP does not “automatically” upgrade all of their customers on SaaS at the same time. CloudERP is unique
is the “SaaS’ vendor world in that they maintain individual instances of each customer’s installation. That is, they
do not maintain a true, multi-tenant environment (one installation for all customers to run on) which allows the
individual customers the benefit of deciding when to upgrade. Thus, the upgrades are not done “automatically”.

43
Table 5: Final Cloud ERP Adoption Barriers
As can be seen in Table 5 above, the initial set of eight barriers from the Saeed et al.
(2012) UF has had more changes/modifications than the motives. Barriers #2, 4, and 7 (shown
in red) were deemed no longer applicable for the reasons noted and dropped from the survey.
Barriers #3, 5 and 11 (shown in blue) were mentioned during the VAR interviews and
discussions with Acumatica personnel as more formidable barriers and were added. Barrier #’s
1, 6, 8, 9 and 10 (shown in white) were retained from the original UF (some with minor word
# Saeed et al (2012) Unified UF as Presented Final Framework used in Survey
1 Invested too much into On-Premises ERP and
Other Systems so they do not want to buy Cloud
ERP
B1: Already Invested too much into On-Premises
ERP and Other Systems so they do not want to buy
Cloud ERP
2 Lack of Early Adopters because of Cloud ERP's Low
Awareness
Removed; Disagree; More awareness; Lack of
product depth, community, and ISV functionality;
Cloud ERP has Functionality limitations
3 N/A B2: Traditional ERP systems have Hosting Options
with Internet Service Provider's (ISPs) that
provides many benefits touted by cloud ERP
4 Cloud ERP has Potential Problems with
Government Regulations regarding the Secure
Data Storage
Removed; not applicable to most SME's; audited
regulatory environments/HIPAA may be
established at hosting provider/ISP and may be
benefit
5 N/A B3: Cloud ERP has Functionality Limitations and
Depth due to Lack of Community and ISV's
6 Current Traditional ERP and Other Systems already
Support Business Strategy so No Need to Invest in
Cloud ERP
B4: Current Traditional ERP and Other Systems
already Support Business Strategy so No Need to
Invest in Cloud ERP
7 Possible Slow speed of Internet Connection &
Down Time of Cloud System Servers are Inherent
Risks in Cloud ERP
Removed; not really an issue any more;
Speed/connectivity has not been an issue for our
clients"; Not as common; one VAR gave example
of remote location that this applied to but said
otherways really N/A
8 More Security and Privacy Risks related to Cloud
ERP
B5: More Security and Privacy Risks are related to
Cloud ERP
9 Customization is Difficult in Cloud ERP B6: Customization is Difficult in Cloud ERP
10 Integration is Difficult in Cloud ERP B7: Integration is Difficult in Cloud ERP
11 N/A B8: Cloud ERP purchased as Saas ERP has Perpetual
Ongoing Subscription Expenses
Cloud ERP Adoption Barriers

44
modifications for clarity). Note that the last column of this table presents the final barriers used
in this current study’s survey (except for the mentioned “red” rows that were removed). Each of
these barriers is preceded by “B#:” where the # ranges from 1-8. The notation for these barriers,
B1 through B8, is presented later in Table 12 in the results section and subsequently used in the
coding of the barrier data variables.
The motives listed in Table 4 and barriers listed in Table 5 were included in the survey in
three ways. First, I introduced each set (of Motives/Barriers) with the following: “Please select
the extent to which you agree/disagree that the items listed below are Motives [Barriers] for
selecting a Cloud ERP System”. In this instance, a 7 point likert scale (Strongly Disagree to
Strongly Agree) was used to measure the “magnitude” or “intensity” of the subjects response. A
similar likert type of scale/measure is what has been traditionally used CSF stream of ERP
literature, although quite often the scale just measured the level of importance of a particular
CSF without a zero point or scale that allowed for disagreement (e.g., you only had the ability to
rate it low on importance). Note that by including a scale with a zero point I can measure and
test for significance as to whether subjects significantly agree or disagree with the proposed
motives and barriers. Second, in addition to this “magnitude” type of measure I asked an
additional question for each motive or barrier “What Percentage of your Prospects considers the
issues listed below to be an Important Selection Criterion in their Purchase Decision for a Cloud
ERP System?”. I did this in an attempt to capture another dimension of the construct, frequency,
in hopes of being able to add depth of understanding and ability to evaluate the listed motives
and barriers. Lastly, after each of the initial motive and barrier “magnitude” sections, I included
an open-ended question that will allow VARs to add any additional motives and/or barriers that
they feel were important but not listed on the survey.

45
After receiving IRB approval, I updated the survey on the Qualtrics software survey
platform. Next, I performed a pilot study of the survey for design, readability, flow, and
functionality. I sent the pilot test survey out to fellow colleagues in my EDB cohort, members of
my dissertation committee, as well as members on the staff at CloudERP. In total, 10 people
responded and reviewed the online survey. I made minor modifications to the survey based on
their feedback before finalizing the survey. The final survey is shown in Appendix D – Cloud
ERP Final Survey.
4.3 Selection of Study Participants
The study is as an engaged scholarship research project in collaboration with CloudERP.
CloudERP gave me a list of all contacts of their US partners in their CRM system. In total, I
received 601 contact names and email addresses. Unfortunately, it was not possible to identify
these contacts company’s relationship (VAR, ISV, both VAR and ISV or Other) to Acumatica
nor was each individual’s role, job or position within their organization listed. This current study
is interested in the VAR Owners and/or Salespersons that will be able to provide us insights into
the motives and barriers of their prospects purchase decisions. So in order to control for this, the
first two questions on the survey asked (1) “What is your company's relationship with
CloudERP?”, and (2) “What is your position/job/role within your company (choose all that
apply)?”. I used these two questions to filter the responses for the analysis presented later in the
Results section.
4.4 Data Collection
I used Qualtrics to administer the survey. I uploaded participants name and email
addresses supplied by CloudERP into the Qualtrics software. I used Qualtrics to email out a
request to take the survey (shown in Appendix D – Cloud ERP Final Survey) as well as the
reminder emails to participants who had not yet completed the survey. Qualtrics sent the email

46
request with a signature and reply address of the Director of Marketing from CloudERP. The
subject line was “CloudERP Commissioned Research Study – Motives & Barriers to Cloud ERP
Selection” (or a slight variation for the reminder emails). The body of the email mentioned that
“CloudERP is working with Georgia State University on this project and encourages your
participation” along with reasons for participating and the option to receive a summary of the
research results. The initial email and opening date for the survey was January 16, 2014 and the
closing date of the survey was February 9, 2014. Daily response rates are shown for this time
period in Table 6: Daily Survey Responses below:
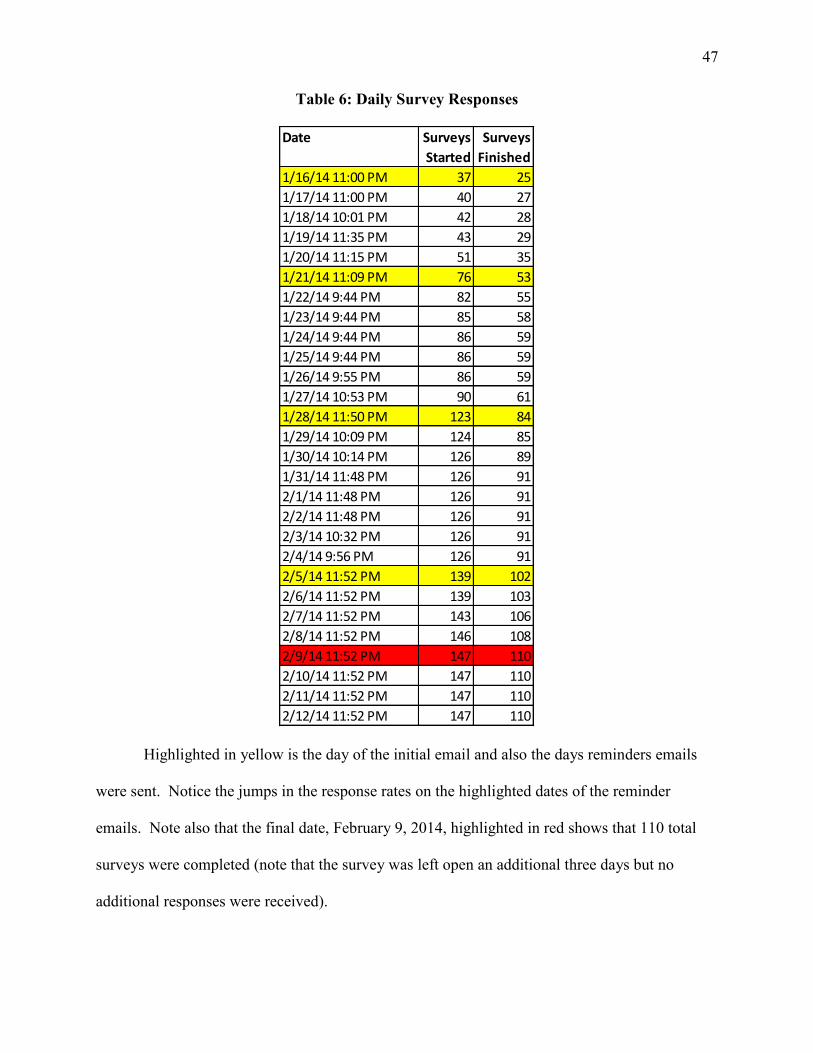
47
Table 6: Daily Survey Responses
Highlighted in yellow is the day of the initial email and also the days reminders emails
were sent. Notice the jumps in the response rates on the highlighted dates of the reminder
emails. Note also that the final date, February 9, 2014, highlighted in red shows that 110 total
surveys were completed (note that the survey was left open an additional three days but no
additional responses were received).
Date Surveys
Started
Surveys
Finished
1/16/14 11:00 PM 37 25
1/17/14 11:00 PM 40 27
1/18/14 10:01 PM 42 28
1/19/14 11:35 PM 43 29
1/20/14 11:15 PM 51 35
1/21/14 11:09 PM 76 53
1/22/14 9:44 PM 82 55
1/23/14 9:44 PM 85 58
1/24/14 9:44 PM 86 59
1/25/14 9:44 PM 86 59
1/26/14 9:55 PM 86 59
1/27/14 10:53 PM 90 61
1/28/14 11:50 PM 123 84
1/29/14 10:09 PM 124 85
1/30/14 10:14 PM 126 89
1/31/14 11:48 PM 126 91
2/1/14 11:48 PM 126 91
2/2/14 11:48 PM 126 91
2/3/14 10:32 PM 126 91
2/4/14 9:56 PM 126 91
2/5/14 11:52 PM 139 102
2/6/14 11:52 PM 139 103
2/7/14 11:52 PM 143 106
2/8/14 11:52 PM 146 108
2/9/14 11:52 PM 147 110
2/10/14 11:52 PM 147 110
2/11/14 11:52 PM 147 110
2/12/14 11:52 PM 147 110

48
CHAPTER 5: RESULTS
5.1 Survey Response Rates
As previously mentioned, CloudERP provided a mailing list of all contacts in their CRM
system. The initial list contained 601 contacts. After doing some preliminary scrubbing of the
database for some obvious bad records (e.g., 12 records were eliminated due to missing or bad
email address or name), the survey was emailed to 589 individuals using Qualtrics on January
16, 2014. Of these 589 email addresses, there were 12 (in addition to the 12 that reduced the
initial dataset from 601 to 589) records with the same person’s name but two different email
addresses. Assuming that the same individual was not going to reply twice there is another 12
contacts that effectively reduced the initial persons emailed. Additionally, there were 70 email
addresses that were “bounced” back as undeliverable (I logged these addresses for tracking
purposes). This effectively gave us a maximum number of “good” contacts of 507 (589 – 12 –
70 = 507). As noted earlier in Table 6: Daily Survey Responses, the result was 110 surveys
completed. Of these 110 “completed” survey responses, four were very incomplete (initially
started and most of the answers were left blank including all of the barrier and motives answers
left unanswered) and were not included. Thus, there were essentially 106 completed surveys.
This computes into a response rate of either 21.70% (110/507 = .2170) or 20.91% (i.e., 106/507
= .2091)
The CloudERP CRM database did not break down the contacts as to their company
relationship (e.g., VAR or ISV or Other) and the position of the contact (e.g., Owner, Sales
Person, Marketing, Project Manager, Consultant, Programmer, Other, etc.). The demographic
portion of the survey had two questions to identify the respondents that were of interest to this
research project. One question had the respondent select their companies relationship to

49
CloudERP (single answer question, with four options: (1) VAR, (2) ISV, (3) VAR and ISV, (4)
Other). This project is only interested in the respondents that were members of VARs so
answers (1) or (3) had to be selected. Out of the 106 completed surveys, 101 were VARs (i.e.,
they selected 1 or 3). In addition, there was a question that asked for the respondent’s role(s)
within the company (multiple selections were allowed). Of the positions mentioned earlier, this
current study is interested in persons that are interacting with the prospects during the sales
process, which would be the Owners and Sales Persons. There were a total of 68 VAR
respondents that were Owners or Sales Persons (49 of these persons were VAR Owners)4. Thus,
out of the 106 usable survey responses, I am conducting the remaining analyses on the 68
observations that are from VARs and also selected either “Owner” or “Sales” as their
role/position.
5.2 UF Motives and Barriers Questions
5.2.1 Motives
Table 7 below presents the list of the final seven motives used in the survey along with
their respective “short code” M1 – M7. These codes are referenced in the results and elsewhere
in the paper.
4 It is worth noting that it could be argued that Marketing persons in VARs should be included but it is questionable
whether they have direct contact and interaction with the prospects. In addition, this would only increase the
resulting usable sample size from 68 to 71. I elected not to include the “Marketing” persons (i.e., those who selected
“Marketing” but did not select either “Owner” or “Sales”).

50
Table 7: List of Motives and Codes
Table 8 below is a summary of descriptive statistics for the Motives. Generally the
descriptive statistics and histograms (not shown) for the motives support a rather “normal”
distribution (although some left skewness tendencies exist due to the nature of the likert scale
being “cut-off” on the right side of the distribution). Absolute value of skewness scores above
one are an indicator or a skewed distributions. Also, a skewness score or kurtosis score of more
than three times their respective standard deviations indicate possible non-normal distributions
(whereas the skewness determines the “skew” or offset of a distribution, the kurtosis measures
the “flatness” of a distribution). In addition to t-tests, I use non-parametric tests (Wilcoxon
Signed Rank Test) to alleviate any potential concerns presented by non-normality of these
variables.
Code Complete Motive Question
M1 Cloud ERP provides Flexibility and Mobility enabling Business
Innovation
M2 Cloud ERP provides Rapid Implementation which allows a company
Faster time to Market for their Products and Services
M3 Cloud ERP purchased as SaaS allow users to Concentrate on their
Core Business
M4 Cloud ERP Provides reduced ongoing IT Cost for the Enterprise
M5 Cloud ERP is Scalable On-Demand
M6 Cloud ERP puchased as SaaS requires Low Capital Expenditure
M7 Cloud ERP purchased as Saas has advantage of providing High
Technical Reliability since it is being externally and centrally
managed by Software Vendor or Service Provider
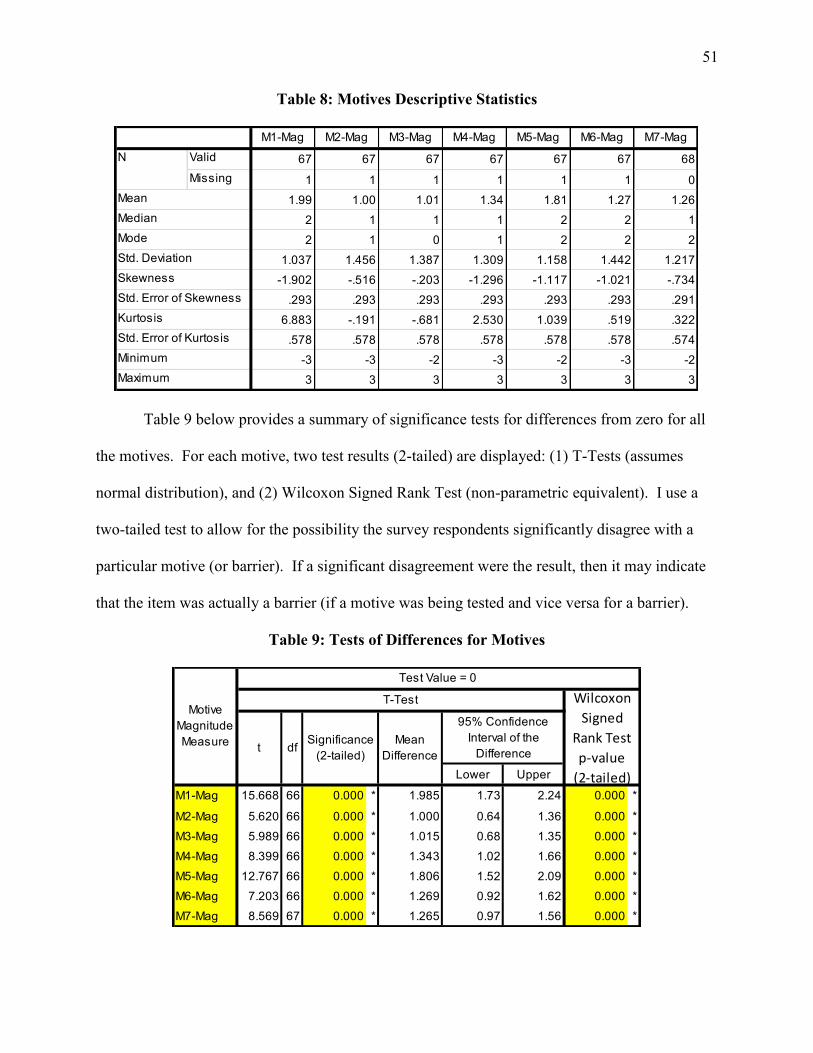
51
Table 8: Motives Descriptive Statistics
Table 9 below provides a summary of significance tests for differences from zero for all
the motives. For each motive, two test results (2-tailed) are displayed: (1) T-Tests (assumes
normal distribution), and (2) Wilcoxon Signed Rank Test (non-parametric equivalent). I use a
two-tailed test to allow for the possibility the survey respondents significantly disagree with a
particular motive (or barrier). If a significant disagreement were the result, then it may indicate
that the item was actually a barrier (if a motive was being tested and vice versa for a barrier).
Table 9: Tests of Differences for Motives
M1-Mag M2-Mag M3-Mag M4-Mag M5-Mag M6-Mag M7-Mag
Valid 67 67 67 67 67 67 68
Missing 1 1 1 1 1 1 0
1.99 1.00 1.01 1.34 1.81 1.27 1.26
2 1 1 1 2 2 1
2 1 0 1 2 2 2
1.037 1.456 1.387 1.309 1.158 1.442 1.217
-1.902 -.516 -.203 -1.296 -1.117 -1.021 -.734
.293 .293 .293 .293 .293 .293 .291
6.883 -.191 -.681 2.530 1.039 .519 .322
.578 .578 .578 .578 .578 .578 .574
-3 -3 -2 -3 -2 -3 -2
3 3 3 3 3 3 3
Std. Error of Kurtosis
Minimum
Maximum
Median
Mode
Std. Deviation
Skewness
Std. Error of Skewness
Kurtosis
N
Mean
Lower Upper
M1-Mag 15.668 66 0.000 * 1.985 1.73 2.24 0.000 *
M2-Mag 5.620 66 0.000 * 1.000 0.64 1.36 0.000 *
M3-Mag 5.989 66 0.000 * 1.015 0.68 1.35 0.000 *
M4-Mag 8.399 66 0.000 * 1.343 1.02 1.66 0.000 *
M5-Mag 12.767 66 0.000 * 1.806 1.52 2.09 0.000 *
M6-Mag 7.203 66 0.000 * 1.269 0.92 1.62 0.000 *
M7-Mag 8.569 67 0.000 * 1.265 0.97 1.56 0.000 *
Test Value = 0
Wilcoxon
Signed
Rank Test
p-value
(2-tailed)
Significance
(2-tailed)
Motive
Magnitude
Measuret df
Mean
Difference
95% Confidence
Interval of the
Difference
T-Test

52
Note that ALL Motives magnitude measures (M1 – M7) are significantly different than
zero for both sets of difference tests (alpha = .05, two-sided). Setting distribution assumptions
aside, the more conservative Wilcoxon Signed Rank Tests agree with the T-test showing that the
VARs significantly agreed with all motives tested in the survey.
All seven motives tested in the survey are supported as shown in Table 9: Tests of
Differences for Motives. These motives span the major trends and shifts touted as benefits of the
cloud. “Cloud computing represents a convergence of two major trends in information
technology: (a) IT efficiency, … and (b) business agility” (Marston et al., 2011, p. 177). It
represents both a technology and an economic shift in an organization’s use of IT resources,
offering the potential for significant savings in both IT expenditures and resources (Rosenberg &
Mateos, 2011). In a rapidly changing, competitive marketplace products and skills become
outdated, especially with the pace of technological advancements. SMEs have limited resources
and are at a disadvantage. “Cloud computing has the potential to play a major role in addressing
inefficiencies and make a fundamental contribution to the growth and competitiveness…[of]
SMEs” (Sahandi et al., 2013, p. 1). This new strategy provides for business agility and acts as a
catalyst for more innovation allowing SMEs to implement new strategic ideas at a faster pace in
order to gain a competitive advantage over their competition (Sahandi et al., 2013).
Overwhelmingly, the VARs surveyed agreed with all of the espoused motives of cloud ERP
selection.
5.2.1.1 Additional Motives
After the survey participants were asked the set of questions regarding the extent to
which they agree/disagree with the UF motives, they had the opportunity to fill in an open ended
question “Please List any Additional Motives (Incentives or Advantages) for selecting a Cloud
ERP system that you feel are important and are not listed above (or comments regarding the ones

53
listed above).” Below in Table 10 is the summary of answers that they provided. The majority
of these are not really “additions” but can be categorized under one of the already existing
motives or barriers codes (see reason column).
Table 10: Additional Motives
In Table 10 above, I coded each of the items that was answered as “Additional Motives”
in the open-ended survey question. Each of these items “fit” into one (or more) of the existing
Additional Motives Reason
Mobile apps go hand in hand with webbased ERP. M1
Integration with social media, other collaboration software and LOB applications makes more
sense when ERP is cloud based.
M1
TCO M4,M6
Most users want browser based software. M1
Cash preservation ... some companies do not want to shell out a large, up front payment for on
Premise
M6
Rapid growth environments, in particular, venture-back or PE-back operations, are ripe for Cloud
ERP solutions as their exit strategy may focus on acquisition, in which case they will likely
assume the ERP solution of the acquirer.
M2
I think it's faster to have a cloud-based setup simply because hardware choices do not have to be
made, servers do not have to be purchased and configured, and 'the new ERP' system doesn't
look like a threat to an existing IT department.
M2
Can turn on a cloud ERP deployment very quickly and move into a proof of concept M2
Easier to customize and integrate , data security , allows more users to access the system since it
is not a per users license.
B5,B6,
B7
Total cost of software ownership is lower over time. M4,M6
Designed for browsers and accompanies by a mobile app. M1
Licensing methods could encourage organizations to more easily encourage and number of
nontraditional users to more easily gain access to system
M1
With ease of remote access another motive would be mobility of workforce and ease of
interface compared to other remote desktop access solutions.
M1
Cloud ERP's ability to integrate with other solutions in the market place is key. Being web
services enabled creates a common platform for integration. Building connectors to solutions
like Salesforce.com is key to success.
B7
Inability to recruit skilled IT personnel for internal projects. M7
Ability to handle multiple locations more effectively M1
Different platform access. M1
Allows users to work from anywhere with any device. M1
Access from anywhere . M1
These "Motives" are quite situational. For some organizations, High Technical Reliability may be
easily achieved using traditional on-premise ERP. Others, however, may not be able to achieve
that internally. Other motives, that again are situational, may include Security, Disaster
Recovery, Accessibility.
M7,B2,
B4,B5
Platform independence, geographic independance M1
Performance, reliability, and accessibility M1,M5,
M7
Supporting any browser or device is as big as the above reasons. M1
SaaS is great if the provider actually provides a strong reliable backbone. So far, I don't get that
warm fuzzy feeling of this.
M7
From a SAAS provider viewpoint, I am anxious to start actively selling in this market. I believe
that it will increase the profitability of my company by reducing my technical support staff costs.
M7
The flexibility of providing deployment across hardware platforms and browsers and the ease of
access to information that Cloud ERP provides.
M1

54
motives and barriers that were already presented. Table 11 below shows a ranking of the most
frequently coded motive/barriers from this analysis.
Table 11: Summary of Additional Motives
Albeit this is already an existing motive, different wordings, flavors and variations of
“flexibility and mobility enabling business innovation” distinctly stood out from the rest.
5.2.2 Barriers
Table 12 below presents the list of the final eight barriers used in the survey along with
their respective “short code” B1 – B8. These codes are referenced in the results and elsewhere in
the paper.
Code Description Qty
M1 Cloud ERP provides Flexibility and Mobility enabling Business Innovation 14
M7 Cloud ERP purchased as Saas has advantage of providing High Technical Reliability since it is
being externally and centrally managed by Software Vendor or Service Provider
5
M2 Cloud ERP provides Rapid Implementation which allows a company Faster time to Market for
their Products and Services
3
M6 Cloud ERP puchased as SaaS requires Low Capital Expenditure 3
M4 Cloud ERP Provides reduced ongoing IT Cost for the Enterprise 2
B5 More Security and Privacy Risks related to Cloud ERP 2
B7 Integration is Difficult in Cloud ERP 2
M5 Cloud ERP is Scalable On-Demand 1
B2 Traditional ERP systems have hosting options with Internet Service Provider's (ISPs) that
provides many benefits touted by cloud ERP
1
B4 Current Traditional ERP and Other Systems already Support Business Strategy so No Need to
Invest in Cloud ERP
1
B6 Customization is Difficult in Cloud ERP 1
M3 Cloud ERP purchased as SaaS allow users to Concentrate on their Core Business 0
B1 Already Invested too much into On-Premises ERP and Other Systems so they do not want to buy
Cloud ERP
0
B3 Cloud ERP has Functionality limitations and depth due to Lack of community and ISV's 0
B8 Cloud ERP purchased as Saas ERP has perpetual ongoing Subscription expenses 0
35Total

55
Table 12: List of Barriers and Codes
Table 13 below is a summary of descriptive statistics for the barriers. Generally, the
descriptive statistics and histograms (not shown) for the barriers DO NOT support a “normal”
distribution (generally the histograms are rather flat and/or bi-modal). Absolute value of
skewness scores above one are an indicator or a skewed distributions. Also, a skewness score or
kurtosis score of more than three times their respective standard deviations indicate possible non-
normal distributions (whereas the skewness determines the “skew” or offset of a distribution the
kurtosis measures to “flatness” of a distribution). In addition to t-tests, I use non-parametric tests
(Wilcoxon Signed Rank Test) to alleviate any potential concerns presented by non-normality of
these variables.
Code Complete Barrier Question
B1 Already Invested too much into On-Premises ERP and Other
Systems so they do not want to buy Cloud ERP
B2 Traditional ERP systems have hosting options with Internet
Service Provider's (ISPs) that provides many benefits touted
by cloud ERP
B3 Cloud ERP has Functionality limitations and depth due to Lack
of community and ISV's
B4 Current Traditional ERP and Other Systems already Support
Business Strategy so No Need to Invest in Cloud ERP
B5 More Security and Privacy Risks related to Cloud ERP
B6 Customization is Difficult in Cloud ERP
B7 Integration is Difficult in Cloud ERP
B8 Cloud ERP purchased as Saas ERP has perpetual ongoing
Subscription expenses

56
Table 13: Barriers Descriptive Statistics
Table 14 below provides a summary of significance tests for differences from zero for all
the motives. For each barrier, two test results (2-tailed) are displayed: (1) T-Tests (assumes
normal distribution), and (2) Wilcoxon Signed Rank Test (non-parametric equivalent).
Table 14: Tests of Differences for Barriers
For the barriers, both t-tests and non-parametric tests show that B1, B3 and B8 are
significantly different from zero. Unlike the motives where seven out of seven were statistically
significant, VARs only agreed with three of the eight barriers as shown in Table 14: Tests of
B1-Mag B2-Mag B3-Mag B4-Mag B5-Mag B6-Mag B7-Mag B8-Mag
Valid 67 68 67 67 67 67 67 68
Missing 1 0 1 1 1 1 1 0
.94 .26 .60 -.03 .46 -.22 -.10 1.47
1.00 1.00 1.00 0.00 1.00 0.00 0.00 2.00
1 1 2 1 2 1 1 2
1.424 1.431 1.679 1.576 1.820 1.748 1.742 1.419
-.671 -.264 -.421 -.452 -.350 .144 -.048 -.794
.293 .291 .293 .293 .293 .293 .293 .291
-.307 -1.065 -1.013 -.899 -1.135 -.972 -1.215 -.173
.578 .574 .578 .578 .578 .578 .578 .574
-2 -3 -3 -3 -3 -3 -3 -2
3 3 3 2 3 3 3 3
Minimum
Maximum
Mode
Std. Deviation
Skewness
Std. Error of
SkewnessKurtosis
Std. Error of Kurtosis
N
Mean
Median
Lower Upper
B1-Mag 5.406 66 0.000 * 0.940 0.59 1.29 0.000 *
B2-Mag 1.525 67 0.132 0.265 -0.08 0.61 0.119
B3-Mag 2.910 66 0.005 * 0.597 0.19 1.01 0.004 *
B4-Mag -0.155 66 0.877 -0.030 -0.41 0.35 0.796
B5-Mag 2.081 66 0.041 * 0.463 0.02 0.91 0.058
B6-Mag -1.048 66 0.298 -0.224 -0.65 0.20 0.241
B7-Mag -0.491 66 0.625 -0.104 -0.53 0.32 0.503
B8-Mag 8.545 67 0.000 * 1.471 1.13 1.81 0.000 *
Barrier
Magnitude
Measure
Test Value = 0
T-Test Wilcoxon
Signed
Rank Test
p-value
(2-tailed)
t dfSignificance
(2-tailed)
Mean
Difference
95% Confidence
Interval of the
Difference

57
Differences for Barriers above. Of these three significant barriers, two of these (barriers B3 and
B8) were added by this current study as a result of the face and content validity checks with the
expert VARs and personnel from CloudERP.
Barrier B3 is significant. This barrier relates to the cloud ERP functionality limitations
and product depth due to lack of community and ISV’s. This should be somewhat expected for
new technology, especially in the early stages. This type of barrier (B3) is always going to be an
issue with newer technology as it takes time for members of a community (e.g., customers,
vendors, consultants, users, etc.) to get up the learning curve, accept, adopt, figure out their roles,
etc. Over time I would anticipate that this barrier slowly erodes as the market grows and
matures.
Barriers B1 (already have invested too much in their current system) and B8 (perpetual
and/or ongoing SaaS subscription expenses) both deal with cost factors. B1 sounds very similar
to the “sunk cost phenomenon”. The decision to continue operating with their current system,
sinking money into upgrades, patches, and add-on products versus investing in a new ERP
system are typical symptoms of an “Escalation of Commitment” situation. This would be
interesting to see how much this sunk cost “trap” plays a role in the SME selection decision
process.
Barrier B8 impacts a TCO analysis. This is very similar to an individual’s decision to
buy or lease a car. Leasing a car was slow to catch on and is not for everyone. Vendors need to
be careful about how the ongoing subscription costs compare to the traditional model of
purchasing the software upfront. One VAR mentioned as a comment in the additional barriers
section that “Although it is difficult to highlight all the costs associated with maintaining a server
in-house, the typical small to medium sized business sees the cost of SaaS far exceeding the cost
of traditional on Premise [traditional ERP] after about 3-years.” This break-even period is

58
particularly susceptible to the currently low interest rate environment where SME business
owners might rather finance and purchase the ERP software upfront versus the ongoing
subscription costs required by SaaS.
For B5, the T-test provides a significant result while the more conservative Wilcoxon
Signed Rank Test does not. Figure 12 below shows that the distribution is for B5 is bi-modal
and does not meet the test for normality. Thus, barrier B5, “More Security and Privacy Risks” is
not significant. This security/privacy issue is controversial. Some people feel uncomfortable
“handing over” their data and information to somebody else (i.e., the owners of the cloud where
you store your data). Others realize that the professionals running and monitoring the cloud
infrastructure that their data is stored on probably do a better job of securing data than their
internal SME resources can provide (since the cloud company is in the business of storing and
monitoring data while they are probably not).
Figure 12: Barrier 5 Histogram
Another interesting point is that B4, B6 and B7 all have negative means and median
values equal to zero. In particular, B6 and B7 deal with difficulties of customization and

59
integration in the cloud. It appears that VARs feel that customers no longer view these
technological aspects as obstacles.
B2 and B4 are not significant. These barriers deal with traditional ERP systems already
providing benefits (hosting and strategic) similar to the cloud. VARs reportedly feel that
objections by customers that traditional ERP systems offer similar advantages provided by the
cloud are no longer significant hurdles either.
5.2.2.1 Additional Barriers
After the survey participants were asked the set of questions regarding the extent to
which they agree/disagree with the UF barriers, they had the opportunity to fill in an open ended
question “Please List any Additional Barriers (Objections, Disincentives or Disadvantages) for
selecting a Cloud ERP system that you feel are important and are not listed above (or comments
regarding the ones listed above).” Below in Table 15 is the summary of answers that they
provided. The majority of these are not really “additions” but can be categorized under one of
the already existing barriers or motives codes (see reason column).

60
Table 15: Additional Barriers
In Table 15 above, I coded each of the items that was answered as “Additional Motives”
in the open-ended survey question. Most of these items “fit” into one (or more) of the existing
motives and barriers that were already presented. I added a few categories for those items that
Additional Barriers Reason
Lack of security in the cloud is a perception, not the reality, that needs to be addressed with
potential clients.
B5
Cloud ERP systems are mostly generic, and not customized enough for an industry. B1
Best of breed systems satisfy the customer's needs 90%. B1,B2,B4
Change of management (procedures) is always very hard to achieve with people. Risk,
Change
Data securty, data recovery for migration, data storage off shore, access to data (database level)
for reporting/analysis.
Data,
B3,B5
Some customers are concerned about who "owns" their data when it is in the cloud. This can be
one of the bigger barriers when dealing with users that are used to a traditional system where
their data is always inside their network.
Data,
B5
Although it is difficult to highlight all the costs associated with maintaining a server in-house, the
typical small to medium sized business sees the cost of SaaS far exceeding the cost of traditional
onPremise after about 3-years.
B8
Many clients, although willing to pursue the cloud for some line of business applications, may
find the notion of a cloud-based ERP solution from a relatively unknown vendor to be too risky.
Risk,B5
The CRM is not very robust need more ISVs such as commissions calculator. Also there are
request for interface with MS Outlook and MS office.
B3
Fetting infrastructure as a service (hosted servers) is a competing factor to this as well. B2
Lack of functionality. Not a mature product. Bugs. B3
Reputation B3
Functionality B3
Cloud ERP does not eliminate the need for IT services. In fact, it might increase it. M4,M7
There is a dependency on the internet that did not exist when the old ERP systems were
deployed on a client server environment.
Risk,
Internet
Many traditional VARs have business models that are dependent on selling and supporting on-
premise solutions. The VAR channel is confused, and continues to confuse the buyer.
VAR,B3
SaaS providers, or more specifically Cloud Infrastructure providers have confusing and constantly
evolving pricing models. As an example, no business owner wants to think about how much
Bandwidth I need to consume in a month. Work through the pricing model of almost any SaaS
provider and they contain add-on services that "may apply". The market needs to figure out how
to eliminate these.
Vendor,
VAR, B3
Can access historical data if make a change Vendor,
B3
In SaaS, inability to have access to the database management system for timed backup, restores
when needed, and deeper customizations are not easily, if at all, available
Vendor,
B3,B6
Rapid change of a new company like CloudERP are barriers for partners and customers. CloudERP
does not feel like Microsoft or IBM. CloudERP still lacks depth of features especially in the
project modules that should be added and do not require ISV's.
Vendor,
B3
Most companies are leery of becoming completely dependent on the internet. Risk,
Internet
Annual subscription costs typically have a longer ROI than traditional Perpetual licenses unless
the entire IT philosophy at the customer's company has changed.
B8
Loss of control -- if performance is inadequate you are totally dependent upon the host
company, data backups are totally dependent, when downtimes (for maintenance, etc.) occur is
totally dependent, upgrades (when they occur, how often, etc.)
Risk,
Control,
M7
Price is an issue for smaller companies. They often have broad requirements but don't have the
budget to afford all they need.
Imp Cost,
B8
Fund Accounting B3

61
did not fit into an existing motive or barrier category. Table 16 below shows a ranking of the
most frequently coded motives/barriers from this analysis.
Table 16: Summary of Additional Barriers
The existing barrier “ERP Functionality Limitations due to depth of community” was
also expressed again as a frequent barrier when the survey participants were given an opportunity
to list additional barriers. Also, the category of “risk” which did not fit into the original list of
barriers appeared five times.
Code Description Qty
B3 Cloud ERP has Functionality limitations and depth due to Lack of community and ISV's 11
Risk Problems associated with risk 5
B5 More Security and Privacy Risks related to Cloud ERP 4
Vendor Vendor specific items 4
B8 Cloud ERP purchased as Saas ERP has perpetual ongoing Subscription expenses 3
B1 Already Invested too much into On-Premises ERP and Other Systems so they do not want to buy
Cloud ERP
2
B2 Traditional ERP systems have hosting options with Internet Service Provider's (ISPs) that
provides many benefits touted by cloud ERP
2
M7 Cloud ERP purchased as Saas has advantage of providing High Technical Reliability since it is
being externally and centrally managed by Software Vendor or Service Provider
2
Data Data ownership, control or access to data 2
Internet Issues related to internet 2
VAR VAR specific item 2
B4 Current Traditional ERP and Other Systems already Support Business Strategy so No Need to
Invest in Cloud ERP
1
B6 Customization is Difficult in Cloud ERP 1
M4 Cloud ERP Provides reduced ongoing IT Cost for the Enterprise 1
Change Problems dealing with change 1
Control Loss of control 1
Imp Cost Implementation Cost 1
B7 Integration is Difficult in Cloud ERP 0
M1 Cloud ERP provides Flexibility and Mobility enabling Business Innovation 0
M2 Cloud ERP provides Rapid Implementation which allows a company Faster time to Market for
their Products and Services
0
M3 Cloud ERP purchased as SaaS allow users to Concentrate on their Core Business 0
M5 Cloud ERP is Scalable On-Demand 0
M6 Cloud ERP puchased as SaaS requires Low Capital Expenditure 0
45Total

62
5.2.3 Other Data Analysis
5.2.3.1 Frequency Measures
In addition to measuring the “Magnitude” dimension of the motives and barriers listed in
the UF, I attempted to assess a “Frequency dimension for the components of the motives and
barriers construct. On the survey, the following question was by asked for each of the motives
and barriers: “What percentage of your prospects considers the issues listed below to be an
important selection criterion (can be either positive or negative criterion) in their purchase
decision for Cloud ERP system?” These were measured using a slider scale with the possible
answer range from zero to 100.
I ran Spearman (non-parametric) 2-tailed correlations to test if the two different
dimensions (magnitude and frequency) were captured. I checked to see if the “magnitude”
measure for each of the items (e.g., M1-Mag) was correlated with its “twin” (e.g., M1-Freq). If
they were not, different aspects of the respective motive and barrier components were being
captured. Unfortunately, Table 17 and Table 18 below show that all the magnitude measures for
each of the individual motive and barrier components was significantly correlated with its
“twin”. For motives, the correlations range from .321 to .608 whereas the barrier correlations
range from .366 to . 803. The percentage of overlapping variance between magnitude and
frequency is moderate. The “red” highlights in these two tables show extreme correlations in
cells where that correlation is higher for a “non-twin” measure than it is for the related twin
measure.

63
Table 17: Spearman Correlations - Motive Magnitudes and Frequencies
M1-Freq M2-Freq M3-Freq M4-Freq M5-Freq M6-Freq M7-Freq
Cor Co .602**
.293* 0.247 0.226 0.207 -0.003 .271
*
Sig. (2-t) 0 0.021 0.053 0.075 0.106 0.982 0.033
N 63 62 62 63 62 64 62
Cor Co 0.111 .628**
.401**
.272* 0.133 0.066 0.23
Sig. (2-t) 0.387 0 0.001 0.031 0.303 0.603 0.073
N 63 62 62 63 62 64 62
Cor Co 0.129 .331**
.563** 0.132 0.101 0.204 .282
*
Sig. (2-t) 0.315 0.009 0 0.304 0.435 0.106 0.026
N 63 62 62 63 62 64 62
Cor Co .444**
.333**
.325**
.680** 0.2 0.146 .296
*
Sig. (2-t) 0 0.008 0.01 0 0.118 0.249 0.02
N 63 62 62 63 62 64 62
Cor Co .304* 0.081 0.2 0.158 .444
** 0.102 0.21
Sig. (2-t) 0.015 0.533 0.119 0.215 0 0.421 0.102
N 63 62 62 63 62 64 62
Cor Co 0.071 0.155 .301* 0.072 0.002 .440
** -0.017
Sig. (2-t) 0.581 0.23 0.017 0.575 0.99 0 0.894
N 63 62 62 63 62 64 62
Cor Co 0.17 0.161 .412** 0.016 0.184 .284
*.321
*
Sig. (2-t) 0.178 0.207 0.001 0.902 0.15 0.022 0.01
N 64 63 63 64 63 65 63
Spearman
's rho
M1-Mag
M2-Mag
M3-Mag
M4-Mag
M5-Mag
M6-Mag
M7-Mag
*. Correlation is significant at the 0.05 level (2-t).
**. Correlation is significant at the 0.01 level (2-t).

64
Table 18: Spearman Correlations - Barrier Magnitudes and Frequencies
The ranked means (from high to low) of the motive magnitude and frequency measures
are shown in Figure 13 and the barrier magnitude and frequency measures are shown in Figure
14. These figures demonstrate how the frequency measure means tend to “follow” their
respective magnitude means for both motives and barriers. This evidence combined with the
significant correlations presented above leads me to conclude that the magnitude and frequency
measures are moderately correlated.
B1-Freq B2-Freq B3-Freq B4-Freq B5-Freq B6-Freq B7-Freq B8-Freq
Cor Co .621** 0.22 0.189 .252
* -0.036 0.088 0.115 0.083
Sig. (2-t) 0 0.084 0.146 0.049 0.778 0.492 0.372 0.517
N 62 63 61 62 64 63 62 63
Cor Co 0.235 .631**
.267*
.315*
.277* 0.192 0.172 0.02
Sig. (2-t) 0.064 0 0.036 0.012 0.026 0.129 0.178 0.875
N 63 64 62 63 65 64 63 64
Cor Co 0.157 .324**
.803** 0.236 0.073 0.244 .262
* 0.047
Sig. (2-t) 0.224 0.01 0 0.065 0.568 0.054 0.04 0.717
N 62 63 61 62 64 63 62 63
Cor Co .326**
.435**
.264*
.677**
.335** 0.084 0.14 0.093
Sig. (2-t) 0.01 0 0.04 0 0.007 0.511 0.279 0.468
N 62 63 61 62 64 63 62 63
Cor Co 0.095 0.22 0.162 .283*
.571** 0.189 0.155 0.153
Sig. (2-t) 0.46 0.083 0.212 0.026 0 0.137 0.23 0.232
N 62 63 61 62 64 63 62 63
Cor Co 0.089 .295* 0.243 0.187 .274
*.366
**.300
* 0.024
Sig. (2-t) 0.494 0.019 0.059 0.145 0.028 0.003 0.018 0.851
N 62 63 61 62 64 63 62 63
Cor Co 0.052 .322* 0.242 0.131 0.16 .421
**.472
** 0.074
Sig. (2-t) 0.69 0.01 0.06 0.309 0.207 0.001 0 0.564
N 62 63 61 62 64 63 62 63
Cor Co 0.001 -0.065 0.175 0.006 .247* 0.023 -0.05 .502
**
Sig. (2-t) 0.993 0.607 0.174 0.962 0.047 0.857 0.696 0
N 63 64 62 63 65 64 63 64
B5-Mag
B6-Mag
B3-Mag
B4-Mag
Spearman
's rho
B1-Mag
B2-Mag
B7-Mag
B8-Mag
*. Correlation is significant at the 0.05 level (2-t).
**. Correlation is significant at the 0.01 level (2-t).

65
Figure 13: Motive Magnitude and Frequency Mean Ranking Comparison
Figure 14: Barrier Magnitude and Frequency Mean Ranking Comparison
5.2.3.2 Factor Analysis
Multiple variations of factor analysis were run on the motives and barrier magnitude
items in hopes of uncovering the “IT Efficiency” and “Agility” dimensions (Marston et al., 2011,
p. 177) discussed previously. Unfortunately, a “clean” convergence using confirmatory factor
analysis on these two factors was not obtained. Exploratory factor analysis did not provide any
better results. Depending on the rotation methods selected, convergence sometimes was not
obtained. In other cases the factor patterns that emerged were not “clean”, with some measures
loading on multiple factors and/or the measures loading on the same factors not intuitively
explainable as to their grouping.
Motive Mean Std Dev Motive Mean Std Dev
M1 1.99 1.04 M1 66.69 23.82
M5 1.81 1.16 M5 63.68 27.27
M4 1.34 1.31 M7 58.78 28.07
M6 1.27 1.44 M6 58.65 29.78
M7 1.26 1.22 M4 56.52 27.27
M3 1.01 1.39 M2 49.44 27.46
M2 1.00 1.46 M3 48.00 29.34
Motives Frequency MeasureMotives Magnitude Measure
Barrier Mean Std Dev Barrier Mean Std Dev
B8 1.47 1.42 B8 70.30 23.70
B1 0.94 1.42 B1 57.94 27.34
B3 0.60 1.68 B5 57.57 29.06
B5 0.46 1.82 B3 54.39 25.93
B2 0.26 1.43 B4 48.98 28.15
B4 -0.03 1.58 B2 45.14 25.57
B7 -0.10 1.74 B7 43.87 28.97
B6 -0.22 1.75 B6 42.34 27.06
Barriers Magnitude Measure Barriers Frequency Measure

66
5.3 Demographic Descriptives
Note that the following descriptives are based on the 68 observations who are VARs of
CloudERP and selected their position/job/role as either “Owner” and/or “Sales”. The first two
question, (1) “What is your company’s relationship with CloudERP (choose one)?”, and (2)
“What is your Position/Job/Role within your company (choose all that apply)?”, were used to
filter the 106 usable responses to get to the 68 observations of interest for this current study. The
overall breakdown of the 106 responses is shown in a Company Relationship by Job/Position
matrix in Table 19 below:
Table 19: Company Relationship by Position Matrix
Table 19 adds up to 167 (instead of the n = 106) due to the fact that the Job/Position/Role
question is a “Choose all that Apply” questions so a single person could choose two or more
answers for that question. The cells highlighted in blue are the observations of interest in this
current study. These blue observations of interest are further broken down in Table 20: Final
Company Relationship by Position Matrix below:
VAR ISV VAR/ISV Other TOTAL
Owner 41 1 8 0 50
Sales 25 0 6 0 31
Project Mgr 18 1 3 1 23
Marketing 8 0 2 0 10
Consultant 25 1 8 0 34
Technical 6 1 5 1 13
Other 4 1 1 0 6
TOTAL 127 5 33 2 167
Company Relationship
Position/
Role
Position \ Relationship
n = 106

67
Table 20: Final Company Relationship by Position Matrix
Note that Table 20 shows a “Adj for Dups” (Adjustment for Duplicates) line to reconcile
the initial “80” pre-Total, netting out the twelve duplicate responses to get to the 68 final surveys
of interest. We can see that 56 of the final subjects was an Owner and/or Salesperson from a
VAR and the other twelve were Owner and/or a Salesperson from a VAR/ISV. Likewise, 49
owners are part of the final responses, 31 salespersons, and 12 classified themselves as both
Owners and Salespersons.
The table below, Table 21: Descriptive Statistics for Demographics Variables, provides
summary statistics for the remainder of the demographic questions and will be referenced in their
corresponding section below (red highlights identify high values of Skewness and/or Kurtosis for
the related demographic variable). Initially, I show tables/charts of response patterns of the
demographic questions in Sections 5.3.1–5.3.8. Note that the variables highlighted in yellow are
ordinal variables where distributions for each category and graphs are shown in their respective
section. The variables highlighted in blue are ratio measures.
VAR VAR/ISV TOTAL
Owner 41 8 49
Sales 25 6 31
Pre-TOTAL 66 14 80
- Adj for Dups 10 2 12
TOTAL 56 12 68
Company Relationship
Position/
Role
Position \ Relationship
n = 68

68
Table 21: Descriptive Statistics for Demographics Variables
Finally, sections 5.3.9-5.3.13 contains a summary of some of the multiple answer and
open-ended questions regarding verticals markets and industries.
5.3.1 Number of Employees
The survey question was “How Many Employees are in your Company?” This is an
ordinal measure with its categories and related response numbers shown below in Table 22 and
Figure 15. The kurtosis measure (-1.29) from Table 21 is more than two standard deviations.
This means that the distribution of responses is relatively “flat” compared to a normal
distribution. Figure 15 depicts this with the bars at the extremes above the normal curve and the
majority of the bars in the middle below the normal curve.. It appears that there is a heavy
“weighting” in both tails of the distribution (a lot of real small companies as well as a lot of large
companies). This violates the normal distribution assumption.
Number of
Employee
s
Time
Selling
ERP
Time
Selling
Cloud
ERP
# of ERP
Clients
# of Cloud
ERP
Sales
# of Last
Year ERP
Sales
Last Yr
Cloud
Sales %
Next Yr
Cloud
Sales %
Valid 68 68 68 68 68 67 65 66
Missing 0 0 0 0 0 1 3 2
3.72 4.50 3.69 4.75 2.66 6.25 22.08 42.77
4 5 4 6 3 4 10 40
4 5 4 6 3 2 0 50
1.78 1.14 1.37 1.79 1.30 6.79 30.34 28.89
-0.14 -2.28 -0.52 -1.12 0.62 2.20 1.64 0.61
0.29 0.29 0.29 0.29 0.29 0.29 0.30 0.29
-1.29 3.94 -0.45 -0.27 0.19 4.99 1.68 -0.41
0.57 0.57 0.57 0.57 0.57 0.58 0.59 0.58
5 4 5 5 5 30 100 100
1 1 1 1 1 0 0 0
6 5 6 6 6 30 100 100
Mode
Std. Deviation
Skewness
Statistic \ Variable =>
N
Mean
Median
Std. Error of Skewness
Kurtosis
Std. Error of Kurtosis
Range
Minimum
Maximum

69
Table 22: Number of Employees
Figure 15: Number of Employees
5.3.2 Time/Years Experience Selling ERP Software
The survey question was “How long has your company been selling ERP Software?”
This is an ordinal measure with its categories and related response numbers shown below in
Table 23 and Figure 16. The skewness and kurtosis measures for this variable from Table 21 are
both red meaning that violations of a normal distribution have occurred. The distribution for this
variable is heavily skewed left as can be seen in Table 23. Most of the companies/persons
# of Employees Frequency Percent
1-3 10 14.7
4-6 12 17.6
7-10 5 7.4
11-15 18 26.5
16-25 6 8.8
> 25 17 25.0
Total 68 100.0

70
selling ERP software who have responded to this current study have been doing this for a long
time (79.4% for over ten years).
Table 23: Time Selling ERP
Figure 16: Time Selling ERP
5.3.3 Time/Years Experience Selling Cloud ERP Software
The survey question was “How long has your company been selling Cloud ERP
Software?” This is an ordinal measure with its categories and related response numbers shown
below in Table 24 and Figure 17. The skewness and kurtosis measures for this variable from
Time Selling ERP Frequency Percent
1 year or less 4 5.9
2-3 years 3 4.4
4-6 years 2 2.9
7-10 years 5 7.4
> 10 years 54 79.4
Total 68 100.0

71
Table 21 are both within tolerance levels and the distribution shown in Figure 17 support the
looks of a normal distribution.
Table 24: Time Selling Cloud ERP
Figure 17: Time Selling Cloud ERP
5.3.4 TOTAL ERP Client Base
The survey question was “How many TOTAL ERP clients does your company have?”
This is an ordinal measure with its categories and related response numbers shown below in
Table 25 and Figure 18. The absolute value of the skewness measure (-1.12) from Table 21 is
greater than 1 (and is also more than three standard deviations). This means that the distribution
Time Selling Cloud ERP Frequency Percent
Brand New 7 10.3
< 6 months 7 10.3
6 - 12 months 10 14.7
1-2 Years 24 35.3
3-4 years 16 23.5
> 4 years 4 5.9
Total 68 100.0

72
of responses is heavily skewed left compared to a normal distribution. This is reminiscent of the
“How long have you been selling ERP software?” question which is heavily skewed left with
most companies selling ERP for over 10 years. A majority of the respondents companies
(58.8%) have more than 50 ERP clients. These results also reflect the results of the“How many
employees are in your company?” question which shows that over 50% of the companies having
more than 10 employees (and 25% of the companies having over 25 employees).
Table 25: Number of ERP Clients
Figure 18: Number of ERP Clients
# of ERP Clients Frequency Percent
< 5 7 10.3
5 - 10 5 7.4
11 - 20 4 5.9
20-30 6 8.8
30-50 6 8.8
> 50 40 58.8
Total 68 100.0

73
5.3.5 Cloud ERP Sales Quantity
The survey question was “How many CLOUD ERP sales has your company made?”
This is an ordinal measure with its categories and related response numbers shown below in
Table 26 and Figure 19. The kurtosis and skewness numbers from Table 21 do not show any
alerts but the data in Table 26 and Figure 19 show that this is skewed right. Over 22% of the
respondents have not had any cloud ERP sales, thus cutting off the tail on the left side of the
distribution. From a visual perspective, this variable appears to violate the normality
assumption.
Table 26: Number of Cloud ERP Sales
Figure 19: Number of Cloud ERP Sales
# of Cloud ERP Sales Frequency Percent
0 15 22.1
1 - 2 16 23.5
3 - 5 22 32.4
6 - 10 10 14.7
11 - 20 2 2.9
> 20 3 4.4
Total 68 100.0

74
5.3.6 TOTAL ERP Systems Sold Last Year
The survey question was “How many TOTAL ERP systems did you sell LAST YEAR?”
This is a ratio measure with a mean value of 6.25 (from Table 21). A histogram of the responses
is shown below in Figure 20. This shows a distribution that is skewed right, with a cutoff on the
left at the 0 point. It also flattens to zero then has a rise in the right tail. The kurtosis and
skewness numbers from Table 21 are both highlighted in red giving warnings about the measure
being non-normal. Thus, the normality assumptions for this variable are not supported.
Figure 20: Histogram of Number of Last Year ERP Sales
5.3.7 Cloud ERP Percentage of LAST Year ERP Sales
The survey question was “What PERCENTAGE of your LAST year ERP sales were
CLOUD ERP systems?” This is a ratio measure with a mean value of 22.08 (from Table 21). A
histogram of the responses is shown below in Figure 21. This shows a distribution that is
skewed right, with cutoffs at the 0 and 100 points. The kurtosis and skewness numbers from
Table 21 are both highlighted in red giving warnings about the measure being non-normal.

75
Thus, the normality assumptions for this variable are not supported. Also, from a visual
inspection of the data it appears that a handful of respondents did not pick up on the term
“Percentage” in this question and the next question. It appears from their “unusual” percentage
numbers that they continued answering these two questions in terms of quantities instead of
percentages.
Figure 21: Last Year Cloud Sales Percentage
5.3.8 Cloud ERP Percentage of NEXT Year ERP Sales
The survey question was “What PERCENTAGE of your NEXT year ERP sales do you
predict will be CLOUD ERP systems?” This is a ratio measure with a mean value of 42.77
(from Table 21). A histogram of the responses is shown below in Figure 22. This shows a
slightly flat distribution that is skewed right, with cutoffs at the 0 and 100 points. Although the
kurtosis and skewness numbers from Table 21 do not meet the warning criteria, visual inspection
of the data shows that the normality assumptions for this variable are not supported.

76
Figure 22: Next Year Cloud Sales Percentage
5.3.9 Specialization in any particular verticals/industries
The survey question was “Does your company target or specialize in selling ERP
software in any particular verticals/industries (choose all that apply)?” Figure 23 shows the a bar
chart of the responses. Note that this is a “Choose all that Apply” question so the total number of
responses is greater than the 68 total survey respondents since each respondent can choose more
than one answer. Table 27 lists the seven vertical/industries specified by those who chose the
“Other” option.

77
Figure 23: VAR Specialization by Vertical/Industry
Table 27: "Other" specified Industries
5.3.10 Successful Verticals/Industries Selling Cloud ERP Software
The survey question was “What three verticals/industries have you had success in selling
Cloud ERP software?” There were a total of 111 responses. Table 28 shows the responses in
descending order.
Vertical/Industry
Automotive repair
Breweries
Construction
Ecommerce or etail
Government - Fund Accounting
Healthcare
Oil & Gas

78
Table 28: Successful Verticals/Industries
5.3.11 Reasons for Success in Verticals/Industries
The survey question was “Why do you think that you have had success in selling Cloud
ERP to these verticals/industries?” There were a total of 50 responses which are shown in Table
29 below. A majority of these answers mimicked or were similar to the motives (and barriers)
tested in the UF. A lot of these “reasons for success” can be categorized under one of the already
existing motives or barriers codes (see reason column).
Qty Industry/Vertical
29 Distribution
20 Marketing Professional Services
12 Not For Profit
8 Financial Services
6 Manufacturing
4 Software/Technology
2 Food and Beverage
2 Medical/Clinics
2 Oil & Gas
2 Project Accounting
1 Agricultural
1 Biotech
1 Construction
1 CRM
1 Discrete Manufacturing
1 Ecommerce or Etail
1 Education
1 Financial Reporting
1 Fitness Center
1 General Accounting
1 Governmental entities
1 Healthcare
1 Home Improvement
1 Hospitality
1 Investment Management
1 Life Sciences
1 Marketing
1 Media
1 Mining
1 MRP
1 Municipalities
1 Real estate
1 Retail
1 Video Equipment Manufacturing

79
Table 29: Reasons for Success in Verticals/Industries
Reasons for Success in Verticals/Industries Reason
Minimal up front costs, ease of beginning implementation M2,M6
Drivers were old outdated systems; Clients want more flexibility M1,M7
Webbased ERP available anywhere anytime; Customized; ERP (CRM) enabled to double revenue
and profit
M1,M7
Ease of access M1,M7
Lots of Intelllectual Property, references and Situational Fluency VAR
Lower cost of infrastructure, ease of maintenance for users M4,M6,
M7
No IT Dept needed M4,M7
The customer's desire to avoid the headaches of maintaining a server and the financial means to
address that goal.
M3,M7
Perceived lower cost of ownership - independent of industry. M4,M6,
M7
Ability of team members to understand the industry as well as apply previous experience in
these industries.
VAR
Relationship with clients and low cost of implementation M2,VAR
Customer satisfaction. People trust me. New opportunities come from CFO's who move around
occasionally to new companies. And I watch Linked In and CFO Selections to see when other
opportunities might be there.
VAR
Extensive experience selling ERP systems into these verticals over the last 16 years VAR
Client's seek latest technology wants the ability to deploy off premise also seek flexibility in
customization and Integrate with existing platforms.
M1,M7,
B6,B7
This particular group has offices around the world and needed a system that could consolidate
and be accessed around the world,
M1
They appreciate the lighter IT footprint M4,M7
Client had investor cash. Client needed to have NO infrastructure. Client was aggresive. M2,M6,
M7
The success was not related to the vertical. It was due to the companies focus on outsourcing the
hosting of their applications. They did not wish to have in-house servers, IT staff or have the
need to manage the servers and applications internally.
M3,M7
Acumatica's platform, technology and toolset are the top in the market place. M3,M7
Just starting but it is where our greatest knowledge/expertise lies VAR
Becoming more popular B3
Our experience in using these software packages VAR
Market and needs experience VAR
They know their pain point well. They have a budget M4,M6
Functionality of the software B3
Experience and market demand for cloud VAR
Access to the data from anywhere on any device. M1
For our sales, the specific vertical has not had any correlation to whether they purchase cloud or
non-cloud.
N/A
Product Features provide enterprise productivity M1
Flexibility in deployment and user count M1,M7
Our company size and skill set VAR
We have a very diversified background and can leverage that experience with these multiple
industries
VAR
Multi-office, multi-national, remote workers, outsourcing mentality. M1,M3,
M7
Supportable, Customizable, Scalable. B6,M5,
M7
Expertise in working with ERP software and Business in these verticals, being able to understand
client's requirement and mapping the solution
VAR
Value proposition of the cloud. Distribution expertise M4,M6,
VAR
Our experience. Software fit and functionality. Price point B3,M4,
M6,VAR
Domain knowledge and experience VAR
Mobility and infrastructure requirements M1,M7
The value of Total Cost of Ownership. The ability to implement quickly and without having to
worry about maintaining the infrastructure as well as performing maintenance.
M2,M4,
M6,M7
90% of our sales have come from referrals. Once we are referred in, we position our experience
in implementing, customizing and supporting the systems to meet prospects needs.
VAR
Marketing people are familiar with the cloud and need to have access to their projects/jobs in
remote locations.
M1
More technically advanced; High Growth - recognize value of outsourcing non-core functions such
as infrastructure management
M1,M3,
M7
Customers did not want to manage solution on site M7
Customers had minimal IT investment. M6
Generally startups or early stage development organizations look to Cloud first. M2,M3,
M6,M7
Strength of product/knowledge of the industry VAR
All features in one system no add-ons B3
Many client options with a web based application B3,M1

80
In Table 29 above, I coded each of the items that was answered as “Reasons for
Vertical/Industry Success” in the open-ended survey question. Most of these items “fit” into one
(or more) of the existing motives and barriers that were already presented. I added a few
categories for those items that did not fit into an existing motive or barrier category. Table 30
below shows a ranking of the most frequently coded motives/barriers from this analysis.
Table 30: Summary of Success Reasons
The most cited reason for industry success was motive seven relating to the infrastructure
and systems maintenance that SaaS vendors provided. This was followed closely by VAR
specific reasons, in particular, their industry specific knowledge was cited for their ability to sell
CloudERP in specific verticals/industries. Then the recurring motive of “mobility and
flexibility” showed up as the third reason for industry specific success.
Code Description Count
M7 Cloud ERP purchased as Saas has advantage of providing High Technical Reliability since it is being
externally and centrally managed by Software Vendor or Service Provider
20
VAR VAR specific reasons 17
M1 Cloud ERP provides Flexibility and Mobility enabling Business Innovation 13
M6 Cloud ERP puchased as SaaS requires Low Capital Expenditure 10
M4 Cloud ERP Provides reduced ongoing IT Cost for the Enterprise 8
M3 Cloud ERP purchased as SaaS allow users to Concentrate on their Core Business 6
M2 Cloud ERP provides Rapid Implementation which allows a company Faster time to Market for
their Products and Services
5
B3 Cloud ERP has Functionality limitations and depth due to Lack of community and ISV's 5
B6 Customization is Difficult in Cloud ERP 2
M5 Cloud ERP is Scalable On-Demand 1
B7 Integration is Difficult in Cloud ERP 1
N/A Not Applicable 1
B1 Already Invested too much into On-Premises ERP and Other Systems so they do not want to buy
Cloud ERP
0
B2 Traditional ERP systems have hosting options with Internet Service Provider's (ISPs) that provides
many benefits touted by cloud ERP
0
B4 Current Traditional ERP and Other Systems already Support Business Strategy so No Need to
Invest in Cloud ERP
0
B5 More Security and Privacy Risks related to Cloud ERP 0
B8 Cloud ERP purchased as Saas ERP has perpetual ongoing Subscription expenses 0
89Total

81
5.3.12 Problem Verticals/Industries Selling Cloud ERP Software
The survey question was “What three verticals/industries have you had challenges or
problems in selling Cloud ERP software?” There were a total of 80 responses. Table 31 shows
the responses in descending order. A lot of the top industries listed below as “Challenging” also
appeared in Table 28 in “Successful” industries list.
Table 31: Challenging Verticals/Industries
5.3.13 Reasons for Problems in Verticals/Industries
The survey question was “Why do you think that you have had challenges in selling
Cloud ERP to these verticals/industries?” There were a total of 44 responses which are shown in
Qty SUMMARY
18 Manufacturating
8 Government
7 Distribution
7 Retail
6 Financial Services
5 Software
4 Food
3 Medical
3 Service Management
2 Field Services
2 Healthcare
2 Not for Profit
1 Business Intelligence
1 Document Management
1 Ecommerce
1 EDI
1 Landscaping
1 Large resellers
1 Legal
1 Pharmaceuticals
1 POS
1 Professional Services
1 Project Accounting
1 Rental and booking agency
1 Staffing

82
Table 32 below. A majority of these answers mimicked or were similar to the barriers tested in
the UF. A lot of these “problems” can be categorized under one of the already existing barrier
codes (see reason column).

83
Table 32: Reasons for Challenges in Verticals/Industries
Reasons for Difficulty in Verticals/Industries Reason
CPAs are technology laggards and still a few years behind the cloud ERP curve. Also - some
accountants and IT are OK with other apps in the cloud - but still NOT ERP
Risk,
B3
Not customized enough. Best of breed solutions were more productive. B1,B4,
B6
Older systems - customer isn't ready for change...too much "red tape." Change,
B1
Do not value investing in Technology Value,
B1,B4,B8
Does not fit the cloud paradigm B3
Customer already has a server an light IT staff and total cost of ownership after 3-years is cheaper
with onPremise. There still exists some fear of internet downtime or trusting that data will be
kept safe and secure in some foreign hosting site.
Risk,
Internet,
B5,B8
Have not sold cloud ERP yet VAR,B3
Size and age of our company VAR,B3
I believe that to provide the best service you need to have prior experience (of some type) to
provide value to the industry vertical. In my case Manufacturing would be a challenge. No
experience.
VAR,B3
Clients seek a proven legacy product with many references from exiting users. Not ready to take
the leap for a newer technology.
Risk,B3
In both cases OtherCloudERP was a considered more accomplished system . For the rental
company it was a case of Portuguese language screens and accounting, for the software it was
because the Contracts module needed to be linked to projects which it is not in Acumatica.
Vendor,
B3
Older erp systems are more established. Hesitancy on the part of customers to try something
new.
Risk,B4
Old school thinking. Value,
Risk,B4
Cost of the cloud ERP we sell (CloudERP) was a barrier. It could only compare to something like
Dynamics GP with a user license sale of 20 to 25 users. Not viable for the typical SMB market.
Vendor,
B8
Lack of functionality in the Cloud solutions. The legacy solutions have more mature offerings and
are supplemented by add-on products for these verticals.
B3,B4
There's functionality that they each need specific to their industry and the product is not there
yet.
B3
Cloud ERPs don't do these well B3,B4
Lack of references B3
It's harder due to the field service technicians (oil field workers) and being able to show an ROI
which is easily calculated.
VAR
I don't think it's industry-related. N/A
Not real knowledge and experience VAR,B3
Regulations Regs
Lack of functionality of the software B3
Constraints of only cloud deployment Vendor
Do not see Industry as a challenge in selling Cloud ERP. N/A
For our sales, the specific vertical has not had any correlation to whether they purchase cloud or
non-cloud.
N/A
Lack of features, market penetration/risk Risk,B3
Clients desire for more established software vendors Risk,
Vendor,
B3
Point Blank for CloudERP: Financial Reporting. Vendor
The challenges is the pricing. When it comes down to the monthly fees it is still cheaper to own
the software and servers.
B8
ERP software's doesn't cover the width and depth of certain verticals and without having tight
integration with base makes it harder to sell and show value to customer
B3,B4
Manufacturing is not as complete as it needs to be, even though the price point is great! /
Software companies tend to think they know more. / Food and Beverage tend to only go with
mainstream industry specific solutions.
Risk,B3,
B4
Products are not ready/mature. B3
People still dont understand the requirements necessary for cloud tech, they are also hesitant
since it is fairly new
Risk,B3
Software industry thinks that they know everything and can do an implementation by
themselves. We don't target the Retail vertical and are thus not adequately equipped to sell into
that space.
Imp
Cost,
B3
The manufacturing option is missing some key features and the total ERP package price has been
an issue for both manufacturing and non-manufacturing prospects. We have not had any leads in
the software world.
Vendor,
B3
ERP not designed for government. Fear of losing control of data. Performance issues. Govt,
Risk,
Data,B3
Typically, data entry in Cloud ERP is slower than on premise B3
Concerns about connectivity. Reliance on internet. Security. Risk,
Internet
Functionality to connect with outside systems. B7
Integration with WMS B3,B7
Security and protection of proprietary data Data,B5
Features B3
For the smaller companies, Cloud ERP seems to be too expensive. For the larger companies
which could afford it, key features are usually lacking.
B3,B8

84
In Table 32 above, I coded each of the items that was answered as “Reasons for
Difficulty in Vertical/Industry” in the open-ended survey question. Most of these items “fit” into
one (or more) of the existing barriers that were already presented. I added a few categories for
those items that did not fit into an existing barrier category. Table 33 below shows a ranking of
the most frequently coded motives/barriers from this analysis.
Table 33: Summary of Problem Reasons
Overwhelmingly, the most prevalent item cited as a problem in penetrating specific
vertical deals with the lack of functionality of cloud ERP software. This is expected with the
Code Description Count
B3 Cloud ERP has Functionality limitations and depth due to Lack of community and ISV's 26
Risk Risk concerns 11
B4 Current Traditional ERP and Other Systems already Support Business Strategy so No Need to
Invest in Cloud ERP
8
Vendor Vendor (CloudERP) specific reasons 6
B8 Cloud ERP purchased as Saas ERP has perpetual ongoing Subscription expenses 5
VAR VAR specific reasons 5
B1 Already Invested too much into On-Premises ERP and Other Systems so they do not want to buy
Cloud ERP
3
N/A Not Applicable 3
B5 More Security and Privacy Risks related to Cloud ERP 2
B7 Integration is Difficult in Cloud ERP 2
Value Challenges assessing value 2
Internet Internet concerns 2
Data Data related problems 2
B6 Customization is Difficult in Cloud ERP 1
Change Change management concerns 1
Imp Cost Implementation Cost 1
Govt Governmental problems 1
Regs Problems with regulations 1
M1 Cloud ERP provides Flexibility and Mobility enabling Business Innovation 0
M2 Cloud ERP provides Rapid Implementation which allows a company Faster time to Market for
their Products and Services
0
M3 Cloud ERP purchased as SaaS allow users to Concentrate on their Core Business 0
M4 Cloud ERP Provides reduced ongoing IT Cost for the Enterprise 0
M5 Cloud ERP is Scalable On-Demand 0
M6 Cloud ERP puchased as SaaS requires Low Capital Expenditure 0
M7 Cloud ERP purchased as Saas has advantage of providing High Technical Reliability since it is
being externally and centrally managed by Software Vendor or Service Provider
0
B2 Traditional ERP systems have hosting options with Internet Service Provider's (ISPs) that
provides many benefits touted by cloud ERP
0
82Total

85
lack of maturity of such new technology and should dissipate over time. The second most cited
problem deals with risk. SME’s are known to be risk averse and apparently the VARs are seeing
this in their reluctance to be on the “bleeding edge” of new technology.

86
CHAPTER 6: DISCUSSION
Small to Mid-size Enterprises (SMEs) typically are slow/late to adopt new technologies
due to a conservative bias and cost factors. Implementation of a new Enterprise Resource
Planning (ERP) system is a major, costly undertaking for a company of any size let alone SMEs,
but there is the potential for huge paybacks touted by advantages afforded by the cloud. Cloud
based ERP technology, especially for SMEs, is relatively new and poses a potential large risk-
reward payoff. These SMEs are currently functioning with their existing systems so why would
they want to risk switching to "Bleeding Edge" Cloud ERP technology?
This current study sheds light on this question and contributes to the prior ERP literature.
The stream of ERP systems research is very mature but reviewers have identified a few
particular research areas that are consistently cited as lacking throughout the literature relating to
research applicable to SMEs, a lack of theory, and a need for research into cloud-based
applications and/or SaaS offerings (Addo-Tenkorang & Helo, 2011; Grabski et al., 2011). This
paper adds methodological, empirical and theoretical contributions to this existing stream of
research about the motives and barriers in the selection of cloud ERP systems for SME’s. In
particular, this research paper proposes to help bridge these gaps by testing the UF of the motives
and barriers to the selection of cloud based ERP systems by Saeed et al. (2012) using a survey of
VARs of CloudERP, a SME cloud ERP system.
6.1 Methodological Contribution
From a methodological standpoint I use VARs as subjects in the survey. This is unique
in studying the selection of new technology, particularly in order to assess barriers to ERP
selection. In the past, adoptions of new technologies have been studied using theories such as
the Technology Acceptance Model (TAM) (Davis (1989), Venkatesh et al. (2003)), Diffusion of

87
Innovation (DOI) (Agarwal & Prasad, 1998; Cooper & Zmud, 1990; Crum et al., 1996),
Information Success (IS) Model (Delone, 2003; DeLone & McLean, 1992); and the Marketing
Satisfaction Model applied to Application Service Providers (ASP) (Susarla et al., 2003). These
are the predominant models used in the IS literature to study the adoption of a wide variety of
technologies. Each of these models presumes purchase of the ERP system to measure the impact
of some independent variables (IV’s; e.g., CSF’s) and their impact on a dependent variable (DV)
from one of the models specified (e.g., Satisfaction, Implementation Success, etc.). These
variables would have to be measured post system selection decision. Thus, implicit in these
models is the fact that the given system has already been selected or purchased. Hence, key
variables in these models may have little relation to the actual selection decision process and
criteria since their success (or outcome) dimension relies on post-selection factors that may not
be related to the selection criteria (e.g., quality of service provider, estimate of project budget,
quality of software, etc.). Therefore, we would be looking at DV measures that most likely have
been influenced by other variables or factors introduced post system selection. In addition, these
models would be only looking at “adopters” who decided to select (purchase or adopt) the
software. By using these models we would never get any feedback or measurement of potential
barriers to selection by “non-adopters” (lost customers) who chose not to purchase the ERP
system.
Similarly, prior ERP research has focused primarily on an ERP’s implementation success
and the relevant critical success factors (CSFs) important throughout the various stages of an
ERP’s lifecycle (Addo-Tenkorang & Helo, 2011; Grabski et al., 2011; Schlichter &
Kraemmergaard, 2010). The focus of these studies has been on post-selection variables and the
success or failure of the ERP’s adoption or implementation. Inherent in these studies are firms
who already selected ERP technology, which provides no insight into any potential barriers that

88
prevent selection. Also, the dependent variable (DV) in these studies has typically been the
success of the implementation or customer satisfaction which is heavily influenced by a
multitude of CSF’s and other factors that may not reflect the actual criteria (or motives) used for
the selection decision.
To address this measurement timing issue, this current study proposes using Value Added
Resellers (VARs) of SME Cloud ERP software (CloudERP) as subjects in the study. The use of
VAR’s better serves the purpose of this current study, which is to explore the motives and
barriers of Cloud ERP software selection which occur and are captured earlier in the decision
process (pre-purchase). VARs have the expertise, experience and are in contact with both
prospects (who turn into customers or purchasers) and non-purchasers during the sales cycle.
Arguably, the VARs are in the best position to evaluate and provide feedback about both the
motives as well as barriers to the Cloud ERP selection decision. This is especially important in
uncovering barriers to selection, which, by definition, cannot be studied during the software
implementation phase, which occurs post software selection.
6.2 Theoretical Contribution
I constructed a survey to test and assess the constructs of motives and barriers presented
in the by Saeed et al. (2012) UF. I converted the motives and barriers presented into statements
that are measured on a seven-point likert scale ranging from disagree to agree. Then I subjected
these motives and barriers to face and validity checks (Trochim, 2008) via three expert VARs as
well as CloudERP personnel. Based on the expert VARs and CloudERP feedback, one motive
was dropped since it was not applicable to CloudERP’s business model. Also, three barriers that
were deemed no longer relevant or applicable were removed. More importantly, three additional
barriers were identified and added to the UF during this process.

89
Thus, the theoretical UF by Saeed et al. (2012) was operationalized as a survey and tested
in the field which has not been done. Additional benefits of this process accrued during the face
and content validity checks. Experts in the field provided feedback that led to additions to and
deletions of motives and barriers in the UF to reflect the current cloud ERP market environment.
Table 34 below shows the final UF model tested in the study and the overall results
(“Sig” column). This can be used as a starting point for future researchers to use and test for
changes in the rapidly evolving technology phenomenon called the cloud that we are now
experiencing.

90
Table 34: Final UF Tested
6.3 Empirical Contribuition
The results and findings from the survey provide insights into the motives and barriers of
cloud ERP software selection. All seven motives tested in the survey are supported as shown in
Table 9: Tests of Differences for Motives. These motives span the major trends and shifts touted
as benefits of the cloud. “Cloud computing represents a convergence of two major trends in
information technology: (a) IT efficiency, … and (b) business agility” (Marston et al., 2011, p.
Code Motive Sig
M1 Cloud ERP provides Flexibility and Mobility enabling Business
Innovation
Yes
M2 Cloud ERP provides Rapid Implementation which allows a company
Faster time to Market for their Products and Services
Yes
M3 Cloud ERP purchased as SaaS allow users to Concentrate on their
Core Business
Yes
M4 Cloud ERP Provides reduced ongoing IT Cost for the Enterprise Yes
M5 Cloud ERP is Scalable On-Demand Yes
M6 Cloud ERP puchased as SaaS requires Low Capital Expenditure Yes
M7 Cloud ERP purchased as Saas has advantage of providing High
Technical Reliability since it is being externally and centrally
managed by Software Vendor or Service Provider
Yes
Code Barrier Sig
B1 Already Invested too much into On-Premises ERP and Other Systems
so they do not want to buy Cloud ERP
Yes
B2 Traditional ERP systems have hosting options with Internet Service
Provider's (ISPs) that provides many benefits touted by cloud ERP
No
B3 Cloud ERP has Functionality limitations and depth due to Lack of
community and ISV's
Yes
B4 Current Traditional ERP and Other Systems already Support Business
Strategy so No Need to Invest in Cloud ERP
No
B5 More Security and Privacy Risks related to Cloud ERP No
B6 Customization is Difficult in Cloud ERP No
B7 Integration is Difficult in Cloud ERP No
B8 Cloud ERP purchased as Saas ERP has perpetual ongoing Subscription
expenses
Yes

91
177). It represents both a technology and an economic shift in an organization’s use of IT
resources, offering the potential for significant savings in both IT expenditures and resources
(Rosenberg & Mateos, 2011). In a rapidly changing, competitive marketplace products and
skills become outdated, especially with the pace of technological advancements. SMEs have
limited resources and are at a disadvantage. “Cloud computing has the potential to play a major
role in addressing inefficiencies and make a fundamental contribution to the growth and
competitiveness…[of] SMEs” (Sahandi et al., 2013, p. 1). This new strategy provides for
business agility and acts as a catalyst for more innovation allowing SMEs to implement new
strategic ideas at a faster pace in order to gain a competitive advantage over their competition
(Sahandi et al., 2013). Overwhelmingly, the VARs surveyed agreed with all of the espoused
motives of cloud ERP selection.
On the other hand, VARs only agreed with three of the eight barriers to cloud ERP
selection that were tested in the survey as shown in Table 14: Tests of Differences for Barriers.
Of these three significant barriers, two of them (barriers B3 and B8) were added as a result of the
face and content validity checks with the expert VARs and personnel from CloudERP from this
current study.
Barrier B3 is significant. This barrier relates to the cloud ERP functionality limitations
and product depth due to lack of community and ISV’s. This should be somewhat expected for
new technology, especially in the early stages. This type of barrier (B3) is always going to be an
issue with newer technology as it takes time for members of a community (e.g., customers,
vendors, consultants, users, etc.) to get up the learning curve, accept, adopt, figure out their roles,
etc. Over time I would anticipate that this barrier slowly erodes as the market grows and
matures.

92
Barriers B1 (already have invested too much in their current system) and B8 (perpetual
and/or ongoing SaaS subscription expenses) both deal with cost factors. B1 sounds very similar
to the “sunk cost phenomenon”. The decision to continue operating with their current system,
sinking money into upgrades, patches, and add-on products versus investing in a new ERP
system are typical symptoms of an “Escalation of Commitment” situation. This would be
interesting to further investigate and see how much this sunk cost “trap” plays a role in hindering
the SME selection decision process.
Barrier B8 impacts a TCO analysis. This is very similar to an individual’s decision to
buy or lease a car. Leasing a car was (and still is) slow to catch on and is not for everyone.
Vendors need to be careful about how the ongoing subscription costs compare to the traditional
model of purchasing the software upfront. One VAR mentioned as a comment in the additional
barriers section that “Although it is difficult to highlight all the costs associated with maintaining
a server in-house, the typical small to medium sized business sees the cost of SaaS far exceeding
the cost of traditional on Premise [traditional ERP] after about 3-years.” This break-even period
is particularly susceptible to the currently low interest rate environment where SME business
owners might rather finance and purchase the ERP software upfront versus the ongoing
subscription costs required by SaaS.
These barriers may reflect cost constraints and risk aversion of SMEs. “Due to their
limited resources, budgets and their high sensitivity to costs, when SMEs take the first step into
implementing an ERP system, they need to think about many things, foremost the cost of
adoption. Literature suggests that most ERP implementations fail due to inaccurate and
optimistic budget and schedule estimations, as well as, anticipating indirect costs beforehand is
problematic” (Haddara, 2012, p. 250). Elragal and Haddara (2010) state “sometimes benefits in
relation to costs are not important or unattainable. For example, when an SME’s budget is

93
crossed, it does not matter how much benefits it will gain through dedicating more money to the
project, as it might be out of the required resources already” (p. 99). ERP implementations are
notorious for cost overruns. Switching to a cloud ERP system still entails a relatively big, initial
upfront cost of an implementation. This represents risk, especially to any prospective purchaser
that has had a previously painful ERP implementation experience.
Lastly, another factor may be the result of SMEs inability to accurately value the benefits
accruing from IT Efficiency and Cloud ERP agility. This would definitely impact a TCO
analysis. From the results of the Sahandi et al. (2013) study, it seems that the potential
advantages of cloud computing exist for SMEs to reduce costs and increase agility but it may
take some time for the bandwagon phenomenon to occur since knowledge and awareness of
cloud computing must increase. It will also take time for SMEs to gain trust and confidence with
the vendors and to gain confidence in security issues (Sahandi et al., 2013). Also note that “risk”
was identified in the open-ended questions for (a) “Additional Barriers” (see Table 16), and (b)
“Reasons for Problems in Verticals/Industries” (see Table 33). To help reduce this
risk/uncertainty and more accurately assess the potential expected benefits of a new cloud ERP
technology/system, the following three major actors in this community can improve by:
1) VARs: increase product knowledge; increase technical knowledge; capitalize on
industry/vertical specialization/knowledge and expertise
2) SMEs/End Users: dedication and commitment to learning/understanding and valuing
technology and change, increase company’s dynamic (sophistication and innovation)
capabilities; understand how to capture benefits; understand how to value benefits
3) Software Vendors: increase the quality and reliability of the software, increase product
knowledge (of VARs and End Users) through training, documentation, manuals, etc.,
create software that is easy to customize and integrate; make the software
understandable/intuitive and easy to use; continue investment on innovation in and
flexibility of the software; provide SaaS pricing that properly and fairly incorporates
current interest rate and risk so pricing and payback is in line with traditional purchasing
options (i.e., “perpetual” or purchase upfront licensing options)

94
Overall, having all motives supported and only three of the eight barriers (of which only
one was from the original Saeed et al. (2012) UF) shows that a shift in cloud ERP technology is
occurring. This points to cloud ERP technology becoming more dependable and that the
public’s understanding, awareness and reliance on this new technology has increased.
6.4 Contribution to Practice
Finally, this current study was conducted as an engaged scholarship project. I worked
with CloudERP and expert VARs in order to look at, modify, and operationalize the Saeed et al.
(2012) UF framework of motives and barriers to the selection of cloud ERP systems. This will
help provide insight for VARs and the software vendor, CloudERP, into what motivates
purchasers of their software and more importantly, what obstacles or barriers prevent prospects
from buying. A knowledge of the barriers will help VARs know how to navigate these obstacles
during the sales cycle.
After completion and/or as a follow-up to this current study, I will work with CloudERP
to develop a win/loss questionnaire or survey to be administered to a VAR after each lead is
closed (either in a sale or lost opportunity). Also, if possible the actual lead will be asked to
complete a similar questionnaire or survey so we can get more direct observations for a further,
in-depth study. Collection and analysis of this type of data at “closure” of the lead will further
help CloudERP better understand and manage their lead pipeline, and in turn help them prepare
and train their VAR network on selling Cloud ERP software to SMEs. The more frequent and
timely collection of this information will help overcome the “smoothed” or average responses of
the VARs captured in this current study.

95
CHAPTER 7: CONCLUSION
7.1 Recommendations for Future Research
Technology changes occur swiftly, more rapid than the research publication process
occurs. By the time studies are conducted and publications result, chances are technology has
changed or morphed into the next stage leaving current research out of date. For example,
already “social ERP” is being mentioned as an adaptation to address integrating social media into
the organizations overarching ERP system. Due to rapid changes such as these, a more efficient
way to disseminate this information needs to be addressed.
Also, Cloud ERP is here to stay. This phenomenon impacts multiple disciplines, from
Information Systems to Accounting to even Management, Operations, and Organizational
Behavior. More theory and a more comprehensive theoretical framework needs to be used to be
able to address all of these disciplines needs. Swanson and Ramiller (1997), p. 462, present an
“Institutional Production of Organizing Visions”. This model discusses the idea of the
Organizing vision as a “community discourse”. Of particular interest to our study is the
“Innovation Adoption and Diffusion” process. Swanson and Ramiller (1997), pp. 467-468,
discuss this in detail:
“Although a variety of players makes up the discourse community, the organizing vision
specifically addresses the application of technology within prospective adopter
organizations…even here the organization rarely acts alone [(e.g., vendors, consultants,
subcontractors, etc.)]…Their experiences in implementation…provide feedback through
various channels into the community discourse that builds the organizing
vision…Diffusion also has important reciprocal effects on the development of the
organizing vision…From the adopter’s point of view, the organizing vision provides a
“solution” of some kind, but it is an unfinished one that must be assembles and tailored to
fit the particular organization’s situation.”

96
Such a comprehensive framework and viewpoint would provide a good lens to view a
major technological change as it swiftly moves through its’ lifecycle and impacts and/or is
impacted by a variety of players within a community.
Lastly, classification of SMEs is typically defined by one of several different metrics
such as total revenue (ranging anywhere from less than $50 million or even less than $100
million in annual sales), number of employees (ranging anywhere from less than 250 or even less
than 500 employees) and/or ownership structure. There is not a consistent definition of a SME
and these criterion often vary by industry. Companies that are included in the SME classification
can vary drastically in size and nature. For example, the nature of sophistication, technology
requirements and budget for an ERP system of a ten person firm with $1 million in sales differs
drastically compared to that of a company with 250 employees and $50 million in revenue. This
is too large of a market segment to be treated as homogeneous. While this study changes the
focus away from traditional ERP research which has been primarily concerned with larger firms,
future ERP research needs to have finer divisions within the SME ERP market.
7.2 Limitations
Since this engaged scholarship study is working with only one company (CloudERP), the
subjects are going to be VARs of only one particular brand of cloud ERP software. This brings
with it the typical external validity threats associated with a typical field survey. That is, there
will be generalizability issues if trying to extend the results of the study to motives and barriers
in the selection of other cloud ERP software.
Also, cloud ERP offerings (as do traditional ERP) differ between vendors. For example,
CloudERP has more advanced, hybrid purchase options: (1) SaaS (rent the software and
hosted/maintained by CloudERP), (2) Perpetual (purchase the software and host/maintain where
you like), and (3) Subscription On Premise (SOP; rent the software and host/maintain where you

97
like). The variety of purchase choices that CloudERP provides allows for a wide variety of
deployment options (e.g., SaaS with CloudERP, private cloud, public cloud, hybrid cloud) that
most other typical cloud ERP systems do not have or allow for (either as an option or by
applying the strict cloud definition). These options from this particular vendor may have
introduced results that magnified differences from standard cloud software offerings, which by
NIST definition, require SaaS and multi-tenancy (not implemented by CloudERP).
Lastly, this current study utilizes VARs as subjects as conduits of information that they
are assessing from contact with their leads during the sales process. The survey answers will be
“smoothed” or averaged perceptions made by the VARs about their prospective leads (some
purchasers of the software and some not).

98
CHAPTER 8: REFERENCES
8.1 Appendix A – Additional ERP Selection Papers
Table 35: Additional ERP Selection Papers
Authors Type of Study Companies Selection Factors/Processes
Considered
Summary/Comments/Abstract
Stefanou (2001) Literature review
combined with 9
Interviews
N/A 13 Strategic Level Factors
12 Operational Level Factors
5 Requirements vs. 10 Constraints
ERP Product, Vendor and Support Services Evaluation
The evaluation has to be both
quantitative and qualitative and
requires an estimation of the perceived costs and benefits
throughout the life-cycle of ERP systems.
Verville and
Halingten (2002b)
Case study Large - 4
companies
Influence of Users most
notable
5 Prominent Characteristics emerged
This paper focuses on the
influences and characteristics of
the enterprise resource planning (ERP) acquisition process
(ERPAP).
Bryson and Sullivan
(2003)
Theoretical
/Analytical
N/A 7 General Risk Items
5 Vendor Risk Items
They develop a framework of
transaction costs for ERP outsourcing to ASPs. They then
set up an analytical model for
evaluation of ASP contracts using TCE.
Verville and
Halingten (2003a)
Case study Large - 4
companies
Table of Internal Information
Sources
Table of External Information Sources
The focus of this paper is on the
information search process and its
sources which affected the acquisition
process.
Verville and
Halingten (2003b)
Case study Large - 4
companies
Planning
Information Search Selection
Evaluation
Choice Negotiations
This paper depicts the six
principal processes and many of the constituent activities, issues,
dynamics, and complexities that
pertain to the acquisition of ERP software. The results from this
study contribute to the
identification of processes that are part of this type of acquisition.
Wei and Wang
(2004)
Theoretical
/Analytical
N/A Project FactorsSoftware
System FactorsVendor
Factors
This paper presents a
comprehensive framework for
combining objective data obtained from external
professional reports andsubjective data obtained from internal
interviews with vendors to select
a suitable Enterprise Resource Planning (ERP) project.
Ahierarchical attribute structure is
proposed to evaluate ERP projects systematically. In addition, fuzzy
set theory is used and an example
provided.

99
Luo and Strong (2004)
Theoretical Framework; Case
Study Application
Universities Process Change Capabilities of Org
Technical Change Capabilities of Org
Customizability of Software
They advance a framework for supporting management decision-
making about customization choices and the capabilities
required to accomplish them.
They identify various customization possibilities for
business processes, as well as
ERP systems and the technical capabilities required for technical
ERP customization options and
process change capabilities needed for process customization.
Wei et al. (2005) Theoretical Framework; Case
Study Application
N/A Fundamental Objective HierarchySystem
criteriaVendor criteria
This study presents a comprehensive framework for
selecting a suitable ERP system. The Analytical Hierarchy Process
framework can be used to
construct the objectives of ERP selection to support the business
goals and strategies of an
enterprise, identify the appropriate attributes, and set up a
consistent evaluation standard. A
real-world demonstration shows feasibility.
Baki and Çakar
(2005)
Literature Review,
Survey plus
Interviews
59 Turkish
Manufacturers
Functionality
Technical Criteria
Cost Service and Support
Vision
System Reliability Compatibility with other
systems
Ease of customization Market Position of the
Vendor
Better Fit with Org Structure
Domain Knowledge of
Suppliers
References of the Vendor Fit with Parent/Allied Org
Systems
Cross-Module Integration Implementation Time
Methodology of the
Software Consultancy
Survey results determined that fit
with parent/allied organization
systems was most important criteria. Other significant factors
were cross-module integration,
compatability with other systems and references of the vendor.
Verville et al. (2005) Case study Large - 3
companies Acquisition Process Factors:Planned and Structured ProcessRigorous ProcessDefinition of all RequirementsAccurate InformationPeople Related Factors:Clear and Unambiguous AuthorityCareful Selection of the Acquisition Team MembersPartnership ApproachUser ParticipationUser Buy-In
Studying three companies that
recently completed the acquisition process, they identified ten factors
critical to the successful outcome
of acquiring an ERP solution.
Deep, Guttridge,
Dani, and Burns (2008)
Literature review
and practical experience in
managing
selection process
Make to
Order SMEs Plan Identify Evaluate Select
Develops a selection framework
for Made to Order (MTO) SMEs. A workbook is developed to
provide a structured ERP
selection process.

100
Uzoka, Abiola, and Nyangeresi (2008)
Survey Varies TAM Information Success Model Significant Variables: System Quality Information Quality Software Support Firm Size
The article examines the selection of ERP by organizations using an
extension of the technology acceptance model (TAM) using
elements of the information
systems (IS) success model. The study evaluated the impact of
system quality, information
quality, service quality, and support quality as key
determinants of cognitive
response, which influences ERP system purchase/use.
Venkataraghavan and Sundarraj (2011)
Literature Review N/A Application Oriented CriteriaService Oriented Criteria
They take a look as SaaS based ERP (SERP) and develop a SERP
selection framework by integrating characteristics from
both the underlying SaaS and
ERP application.

101
8.2 Appendix B – Hosted vs. On-Premise vs. Cloud ERP Framework
Table 36: Hosted vs. On-Premise vs. Cloud ERP (Duan et al, 2013)

102
8.3 Appendix C – SaaS ERP Advantages/Disadvantages Framework
Figure 24: SaaS ERP Advantages (Hoseini, 2013)
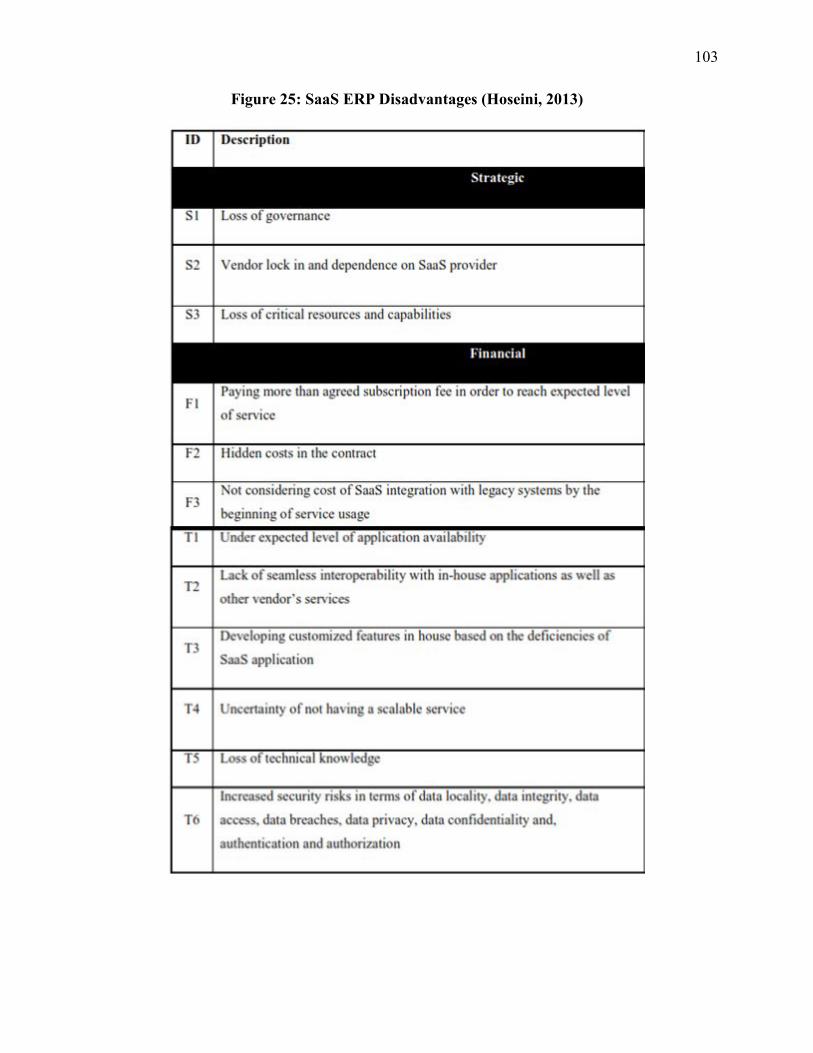
103
Figure 25: SaaS ERP Disadvantages (Hoseini, 2013)

104
8.4 Appendix D – Cloud ERP Final Survey

105

106

107

108

109

110

111

112

113

114
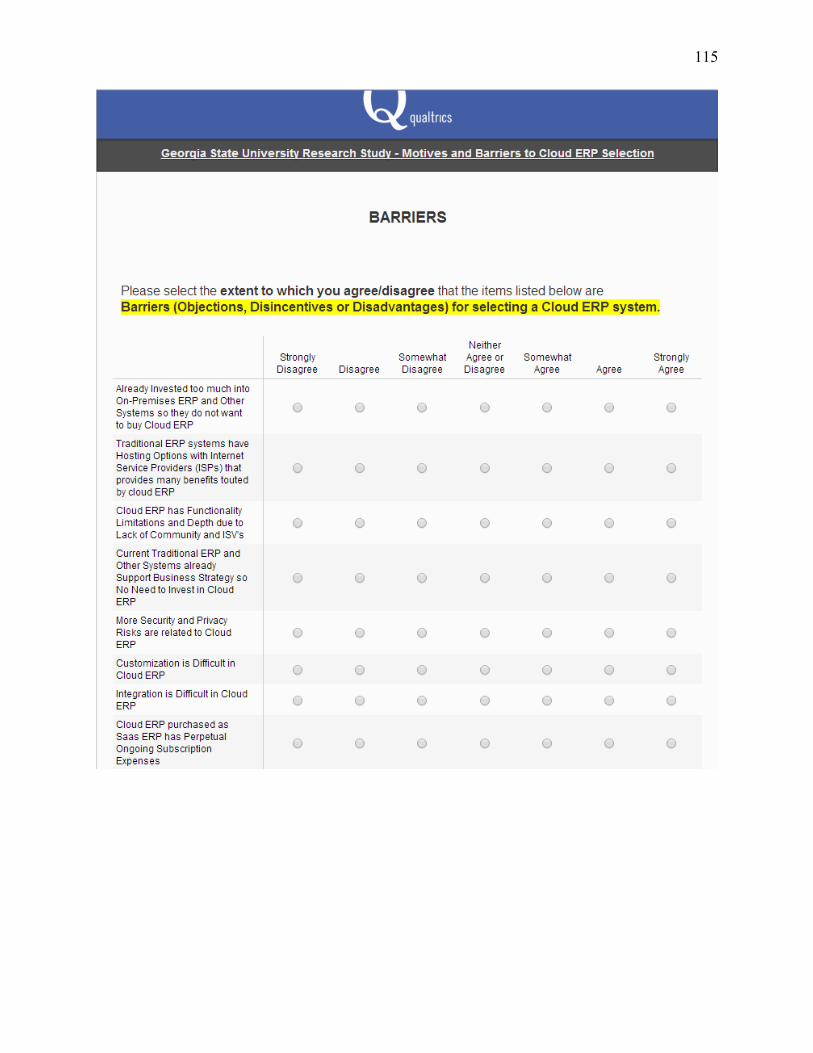
115

116

117

118

119

120

121

122

123
8.5 Bibliography
Accounting Today. (2013). VAR 100 - Annual Ranking of the Top Resellers. Retrieved March,
2014, 2014, from
http://digital.accountingtoday.com/accountingtoday/special_report_var_100#pg1
Addo-Tenkorang, R., & Helo, P. (2011). Enterprise Resource Planning (ERP): A Review
Literature Report. Proceedings of the World Congress on Engineering and Computer
Science (WCECS 2011), II.
Agarwal, R., & Prasad, J. (1998). A conceptual and operational definition of personal
innovativeness in the domain of information technology. Information Systems Research,
9(2), 204-215.
Ahmad, M. M., & Pinedo Cuenca, R. (2013). Critical success factors for ERP implementation in
SMEs. Robotics and Computer Integrated Manufacturing, 29(3), 104-111.
Al-Mashari, M. (2000). Constructs of process change management in ERP context: A focus on
SAP R/3. Proceedings of 2000 Americas Conference on Information Systems, 977-980.
Alali, F. A., & Yeh, C. L. (2012). Cloud computing: Overview and risk analysis. Journal of
Information Systems, 26(2), 13-33.
Baki, B., & Çakar, K. (2005). Determining the ERP package-selecting criteria: the case of
Turkish manufacturing companies. Business Process Management Journal, 11(1), 75-86.
Bernroider, E., & Koch, S. (2001). ERP selection process in midsize and large organizations.
Business Process Management Journal, 7(3), 251-257.
Botta-Genoulaz, V., Millet, P. A., & Grabot, B. (2005). A survey on the recent research literature
on ERP systems. Computers in Industry, 56(6), 510-522.

124
Bryson, K.-M., & Sullivan, W. E. (2003). Designing effective incentive-oriented contracts for
application service provider hosting of ERP systems. Business Process Management
Journal, 9(6), 705-721.
Cooper, R. B., & Zmud, R. W. (1990). Information technology implementation research: a
technological diffusion approach. Management Science, 36(2), 123-139.
Crum, M. R., Premkumar, G., & Ramamurthy, K. (1996). An assessment of motor carrier
adoption, use, and satisfaction with EDI. Transportation Journal, 35(4), 44-57.
Cumbie, B., Jourdan, Z., Peachey, T., Dugo, T., & Craighead, C. (2005). Enterprise Resource
Planning Research: Where Are We Now and Where Should We Go from Here? JITTA,
7(2), 21.
Currie, W. L. (2004). The organizing vision of application service provision: a process-oriented
analysis. Information and Organization, 14(4), 237-267.
Davenport, T. H. (1998). Putting the enterprise into the enterprise system. Harvard Business
Review, 76(4), 121-131.
Davis, F. D. (1989). Perceived usefulness, perceived ease of use, and user acceptance of
information technology. MIS Quarterly, 319-340.
Deep, A., Guttridge, P., Dani, S., & Burns, N. (2008). Investigating factors affecting ERP
selection in made-to-order SME sector. Journal of Manufacturing Technology
Management, 19(4), 430-446.
Delone, W. H. (2003). The DeLone and McLean model of information systems success: a ten-
year update. Journal of Management Information Systems, 19(4), 9-30.
DeLone, W. H., & McLean, E. R. (1992). Information systems success: the quest for the
dependent variable. Information Systems Research, 3(1), 60-95.

125
Duan, J., Faker, P., Fesak, A., & Stuart, T. (2013). Benefits and Drawbacks of Cloud-based
versus Traditional ERP Systems. Paper presented at the Proceedings of the 2012-13
Course on Advanced Resource Planning, Tilburg, The Netherlands.
Elragal, A., & Haddara, M. (2010). The use of experts panels in ERP cost estimation research. In
J.E. Quintela Varajao et al (Ed.), Enterprise Information Systems (pp. 97-108): Springer
Berlin - Heidelberg.
Esteves, J., & Bohorquez, V. (2007). An updated ERP systems annotated bibliography: 2001-
2005. Communications of the Association for Information Systems, 2007(19), 386-446.
Esteves, J., & Pastor, J. (2001). Enterprise Resource Planning Systems Research: An Annotated
Bibliography. The Communications of the Association for Information Systems, 7(8), 1-
52.
Fichman, R. G. (2004). Going beyond the dominant paradigm for information technology
innovation research: Emerging concepts and methods. Journal of the Association for
Information Systems, 5(8), 314-355.
Gattiker, T. F., & Goodhue, D. L. (2005). What Happens after ERP Implementation:
Understanding the Impact of Interdependence and Differentiation on Plant-Level
Outcomes. MIS Quarterly, 29(3), 559-585.
Grabski, S. V., Leech, S. A., & Schmidt, P. J. (2011). A review of ERP research: A future
agenda for accounting information systems. Journal of Information Systems, 25(1), 37-
78.
Haddara, M. (2012). Exploring ERP Adoption Cost Factors. Computer Technology and
Application, 3(3), 250-261.
Hoseini, L. (2013). Advantages and Disadvantages of Adopting ERP Systems Served as SaaS
from the Perspective of SaaS Users. (Masters Dissertation), School of Information and

126
Communication Technology, KTH. Retrieved from http://www.diva-
portal.org/smash/get/diva2:647780/FULLTEXT01.pdf
Jansen, W., & Grance, T. (2011). Guidelines on security and privacy in public cloud computing.
NIST special publication, 1-70. http://csrc.nist.gov/publications/nistpubs/800-144/SP800-
144.pdf
Jeyaraj, A., Rottman, J. W., & Lacity, M. C. (2006). A review of the predictors, linkages, and
biases in IT innovation adoption research. Journal of Information Technology, 21(1), 1-
23.
Kamhawi, E. (2008). System Characteristics, Perceived Benefits, Individual Differences and Use
Intentions: a Survey of Decision Support Tools of ERP Systems. Information Resources
Management Journal, 21(4), 66.
Kim, W. (2009). Cloud Computing: Today and Tomorrow. Journal of object technology, 8(1),
65-72.
Luo, W., & Strong, D. M. (2004). A Framework for Evaluating ERP Implementation Choices.
IEEE Transactions on Engineering Management, 51(3), 322-333.
Marston, S., Li, Z., Bandyopadhyay, S., Zhang, J., & Ghalsasi, A. (2011). Cloud computing—
The business perspective. Decision Support Systems, 51(1), 176-189.
Mell, P., & Grance, T. (2011). 800-145: The NIST definition of cloud computing. NIST special
publication, 1-7. http://csrc.nist.gov/publications/nistpubs/800-145/SP800-145.pdf
Moon, Y. B. (2007). Enterprise resource planning (ERP): A review of the literature.
International Journal of Management and Enterprise Development, 4(3 SRC -
GoogleScholar), 235-264.
NIST Tech Beat. (2011). Final Version of NIST Cloud Computing Definition Published.
Retrieved Sept 26, 2013, from http://www.nist.gov/itl/csd/cloud-102511.cfm

127
Rao, S. S. (2000). Enterprise resource planning: business needs and technologies. Industrial
Management & Data Systems, 100(2), 81.
Rashid, M. A., Hossain, L., & Patrick, J. D. (2002). The evolution of ERP Systems: A historical
perspective. In L. Hossain, J. D. Patrick & M. A. Rashid (Eds.), Enterprise Resource
Planning: Global opportunities & challenges (pp. 1-16). Hershey, Pennsylvania: Idea
Group Publishing.
Rosenberg, J., & Mateos, A. (2011). The Cloud at your Service. Greenwich, CT: Manning
Publications Co.
Saeed, I., Juell-Skielse, G., & Uppström, E. (2012). Cloud enterprise resource planning adoption:
Motives & barriers. Advances in Enterprise Information Systems II: Proceedings of the
Fifth International Conference on Research and Practical Issues of Enterprise
Information Systems (CONFENIS 2011), Aalborg, Denmark, October 16-18, 2011, 99-
122.
Sahandi, R., Alkhalil, A., & Opara-Martins, J. (2013). Cloud Computing From SMEs
Perspective: A Survey Based Investigation. Journal of Information Technology
Management, 24(1), 1-12.
Schlichter, B. R., & Kraemmergaard, P. (2010). A comprehensive literature review of the ERP
research field over a decade. Journal of Enterprise Information Management, 23(4), 486-
520.
Shehab, E. M., Sharp, M. W., Supramaniam, L., & Spedding, T. A. (2004). Enterprise resource
planning: An integrative review. Business Process Management Journal, 10(4), 359-386.
Stefanou, C. J. (2001). A framework for the ex-ante evaluation of ERP software. European
Journal of Information Systems, 10(4), 204-215.

128
Susarla, A., Barua, A., & Whinston, A. B. (2003). Understanding the service component of
application service provision: empirical analysis of satisfaction with ASP services. MIS
Quarterly, 27(1), 91-123.
Swanson, E. B., & Ramiller, N. C. (1997). The organizing vision in information systems
innovation. Organization Science, 8(5), 458-474.
Trochim, W. M. K. D., James P. (2008). Research Methods Knowledge Base (Third ed.). Mason,
Ohio Atomic Dog/Cengage Learning.
Uzoka, F., Abiola, R., & Nyangeresi, R. (2008). Influence of Product and Organizational
Constructs on ERP Acquisition Using an Extended Technology Acceptance Model.
International Journal of Enterprise Information Systems, 4(2), 67.
Venkataraghavan, K., & Sundarraj, R. P. (2011). A Selection Framework for SaaS-Based
Enterprise Resource Planning Applications. Proceedings of the International Conference
on Information Technology Systems and Management (ITSM-2011). 8.
Venkatesh, V., Morris, M. G., Davis, G. B., & Davis, F. D. (2003). User acceptance of
information technology: Toward a unified view. MIS Quarterly, 425-478.
Verville, J., Bernadas, C., & Halingten, A. (2005). So you're thinking of buying an ERP? Ten
critical factors for successful acquisitions. Journal of Enterprise Information
Management, 18(6), 665-677.
Verville, J., & Halingten, A. (2002a). An investigation of the decision process for selecting an
ERP software: The case of ESC. Management Decision, 40(3), 206-216.
Verville, J., & Halingten, A. (2002b). A qualitative study of the influencing factors on the
decision process for acquiring ERP software. Qualitative Market Research, 5(3), 188.
Verville, J., & Halingten, A. (2003a). Information searches: a two-dimensional approach for ERP
acquisition decision. Journal of information science, 29(3), 203-209.

129
Verville, J., & Halingten, A. (2003b). A six-stage model of the buying process for ERP software.
Industrial Marketing Management, 32(7), 585-594.
Wang, P., & Swanson, E. B. (2007). Launching professional services automation: Institutional
entrepreneurship for information technology innovations. Information and Organization,
17(2), 59-88.
Wei, C.-C., Chien, C.-F., & Wang, M.-J. J. (2005). An AHP-based approach to ERP system
selection. International journal of production economics, 96(1), 47-62.
Wei, C.-C., & Wang, M.-J. J. (2004). A comprehensive framework for selecting an ERP system.
International journal of project management, 22(2), 161-169.
Wood, B. (2010). ERP vs. ERP II vs. ERP III Future Enterprise Applications. Retrieved
09/21/2013, 2013, from http://www.r3now.com/erp-vs-erp-ii-vs-erp-iii-future-enterprise-
applications/
Yin, R. K. (2009). Case study research: Design and methods (Fourth ed. Vol. 5): Sage.