motion. chapter four: motionmotion 4.1 position, speed and velocity 4.2 graphs of motion 4.3...
TRANSCRIPT
MOTION

Chapter Four: Motion
4.1 Position, Speed and Velocity
4.2 Graphs of Motion4.3 Acceleration

Section 4.1 Learning Goals
Explain the meaning of motion.Describe an object’s position relative to a reference point.
Use the speed formula.Tell the difference between speed and velocity.
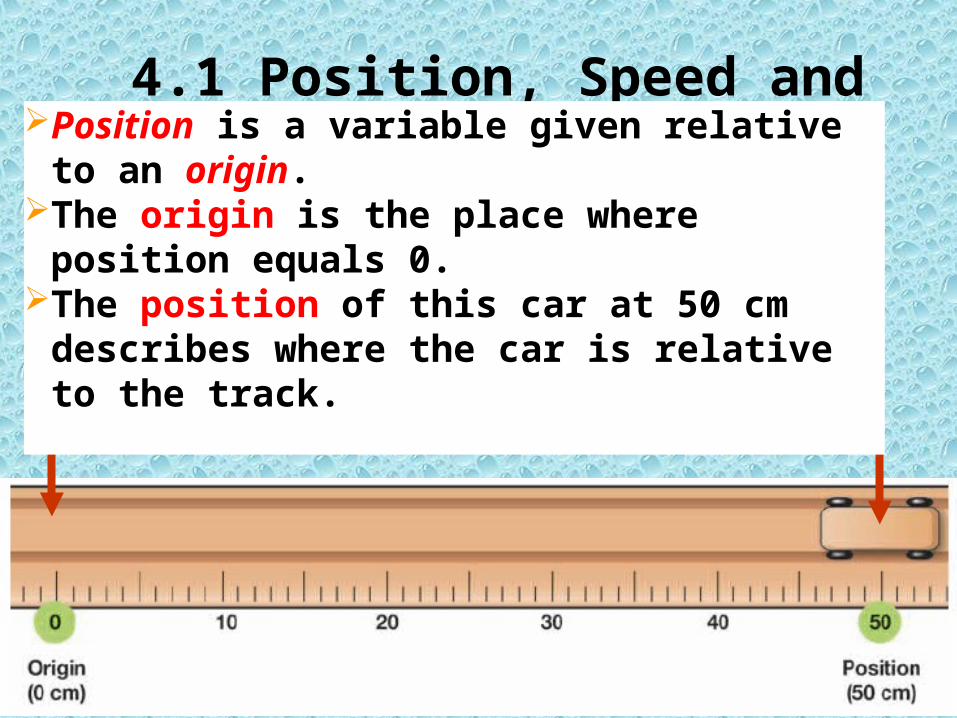
4.1 Position, Speed and VelocityPosition is a variable given relative to
an origin.The origin is the place where position
equals 0.The position of this car at 50 cm
describes where the car is relative to the track.
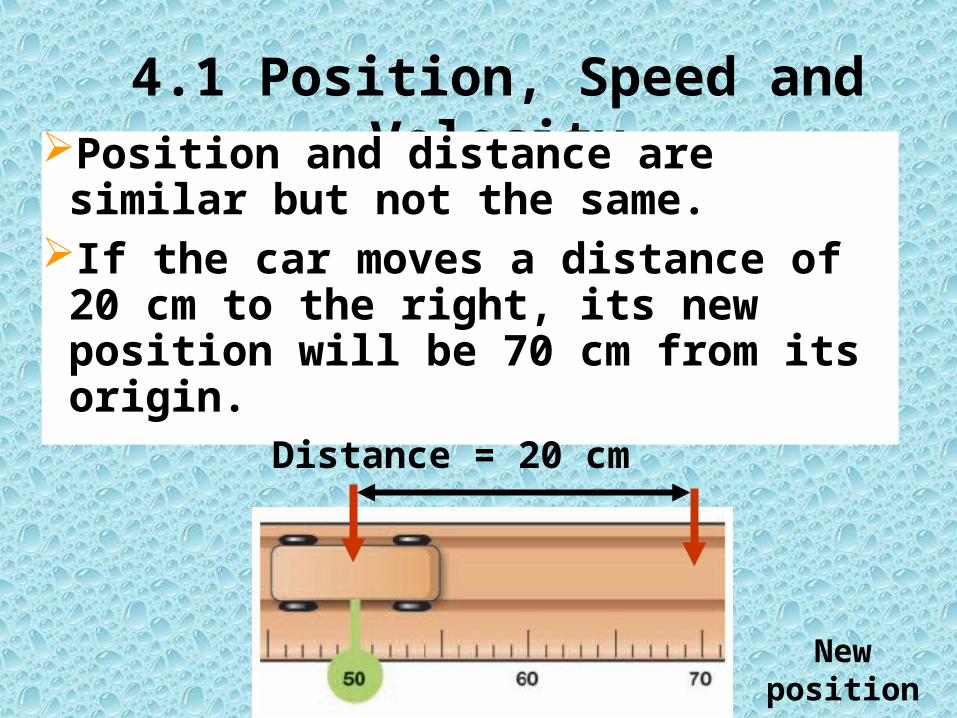
4.1 Position, Speed and VelocityPosition and distance are similar
but not the same.If the car moves a distance of 20 cm to the right, its new position will be 70 cm from its origin.
Distance = 20 cm
New position
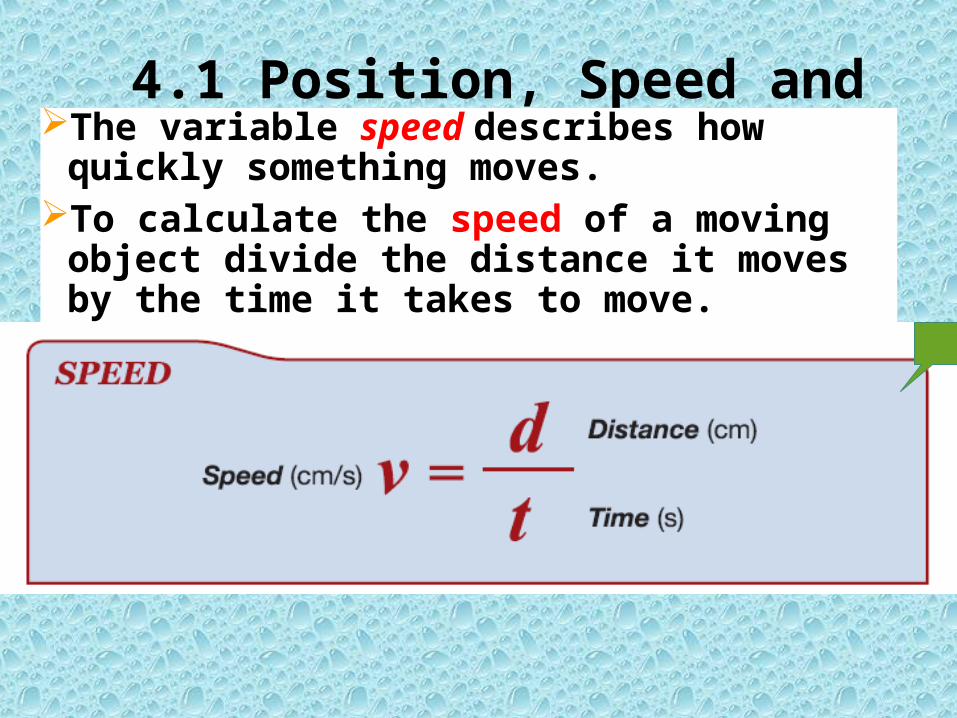
4.1 Position, Speed and VelocityThe variable speed describes how
quickly something moves. To calculate the speed of a moving
object divide the distance it moves by the time it takes to move.

Put these are on your best friend!!
Word Map
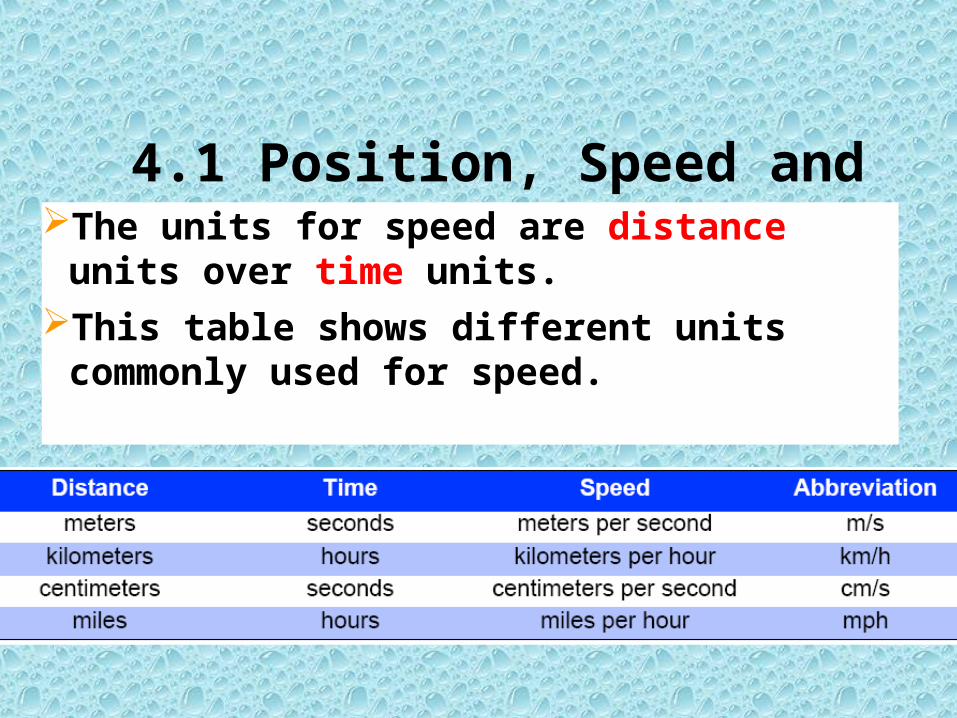
4.1 Position, Speed and VelocityThe units for speed are distance units
over time units.This table shows different units
commonly used for speed.
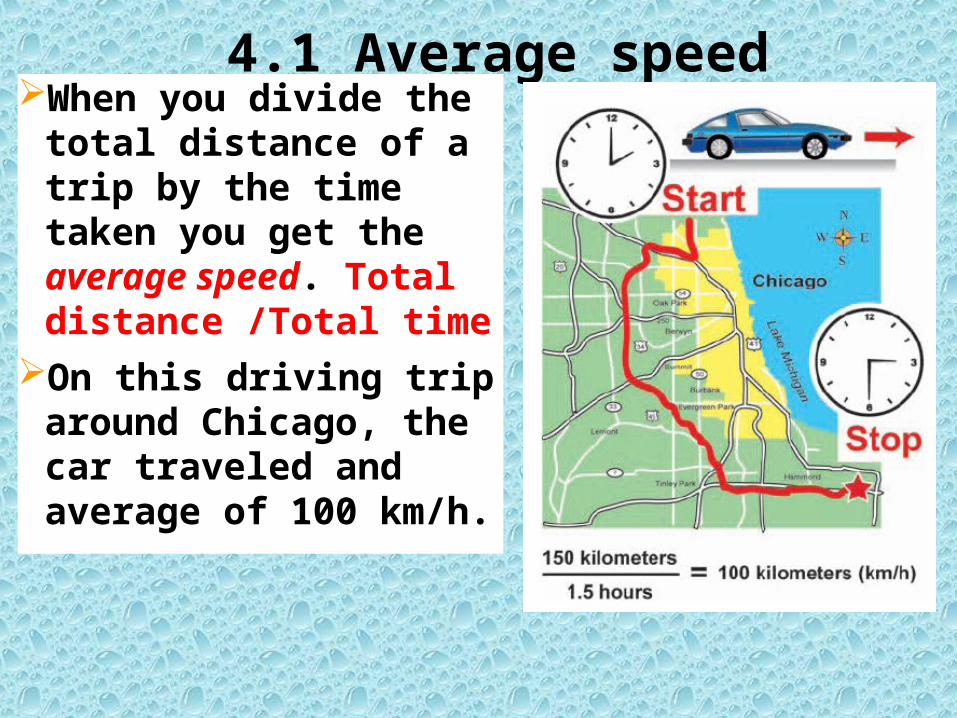
4.1 Average speedWhen you divide the
total distance of a trip by the time taken you get the average speed. Total distance /Total time
On this driving trip around Chicago, the car traveled and average of 100 km/h.
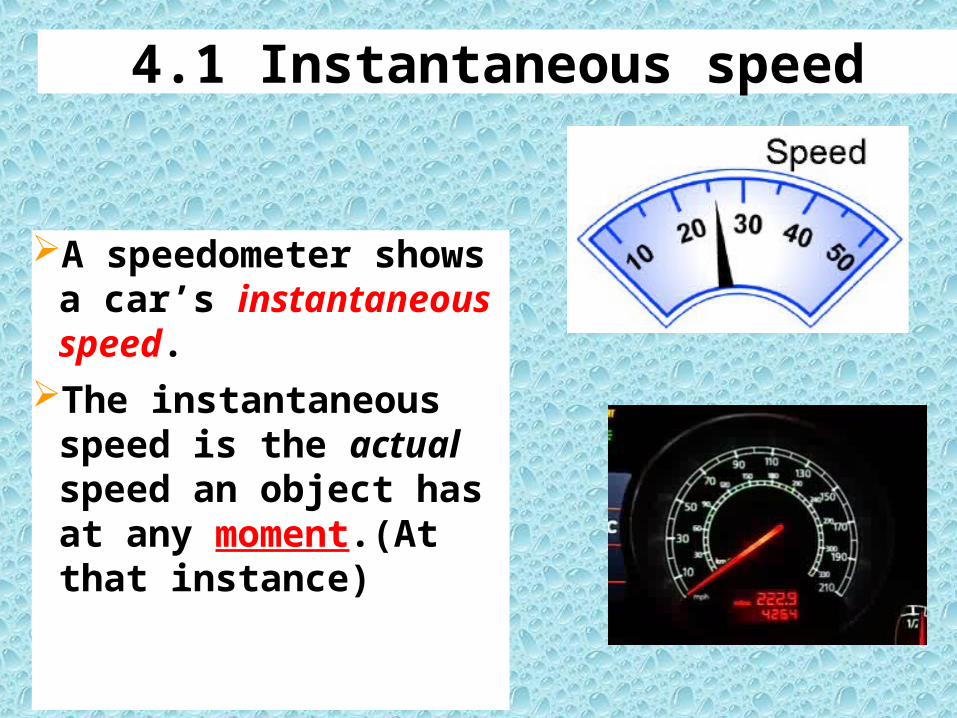
4.1 Instantaneous speed
A speedometer shows a car’s instantaneous speed.
The instantaneous speed is the actual speed an object has at any moment.(At that instance)
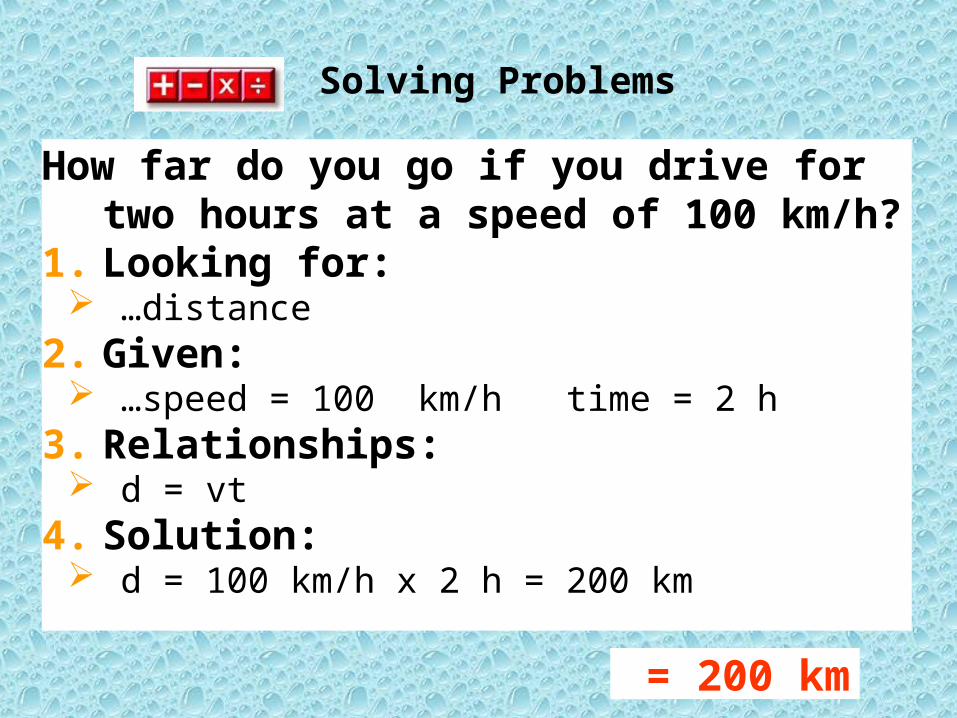
How far do you go if you drive for two hours at a speed of 100 km/h?
1. Looking for: …distance
2. Given: …speed = 100 km/h time = 2 h
3. Relationships: d = vt
4. Solution: d = 100 km/h x 2 h = 200 km
= 200 km
Solving Problems
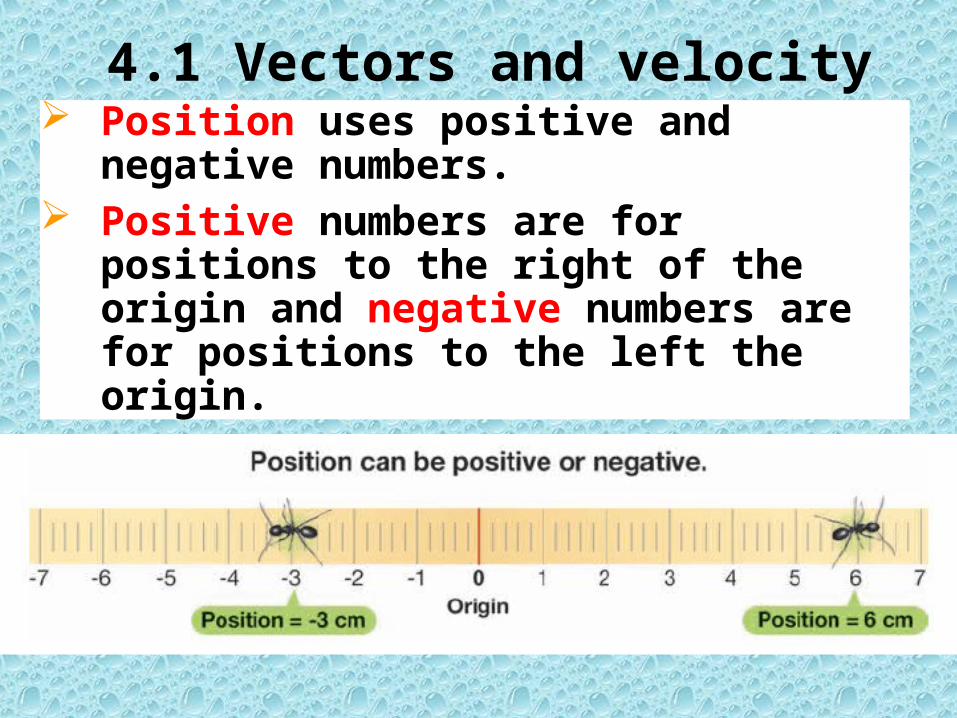
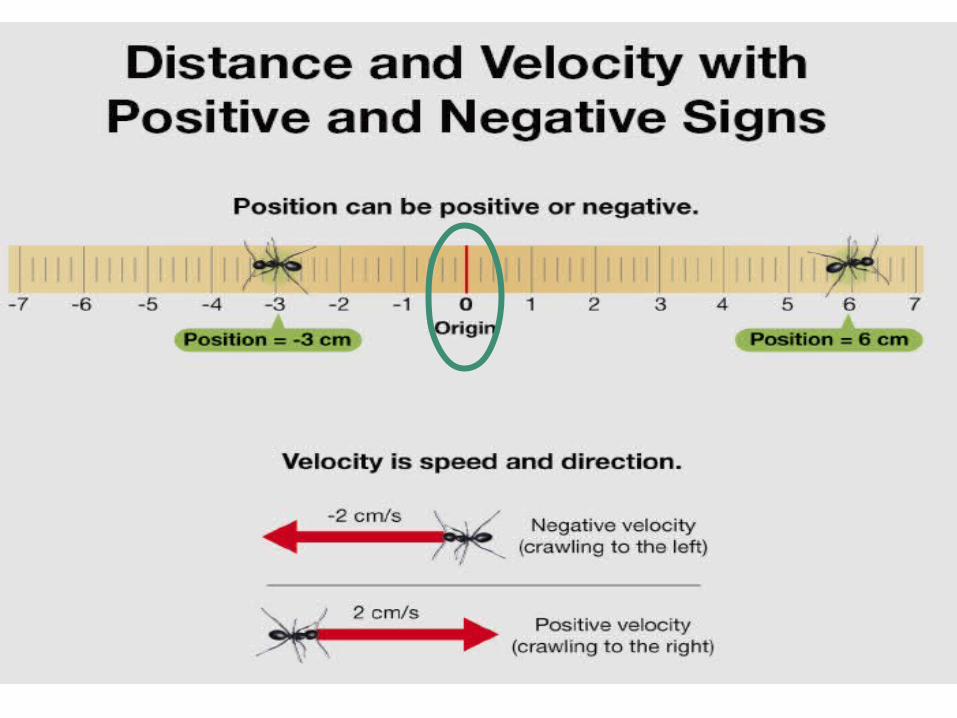
4.1 Vectors and velocity Position uses positive and
negative numbers. Positive numbers are for
positions to the right of the origin and negative numbers are for positions to the left the origin.

Speed

4.1 Vectors and velocity
Distance is either zero or a positive value.
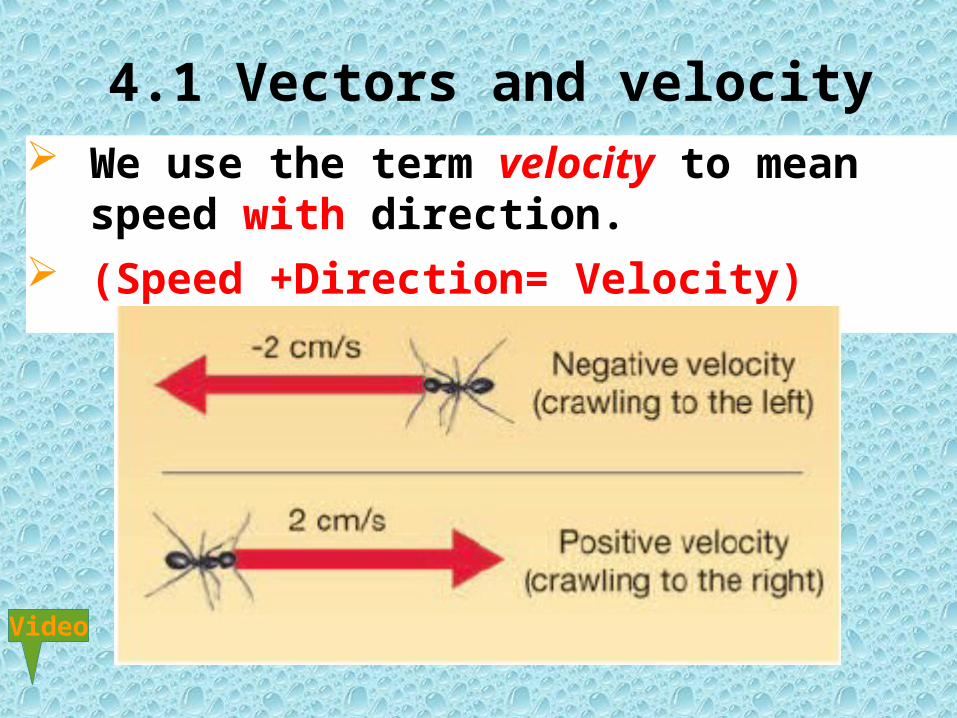
4.1 Vectors and velocity We use the term velocity to mean
speed with direction. (Speed +Direction= Velocity)
Video

4.1 Keeping track of where you are 1
Pathfinder is a small robot sent to explore Mars.
It landed on Mars in 1997.
Where is Pathfinder now?
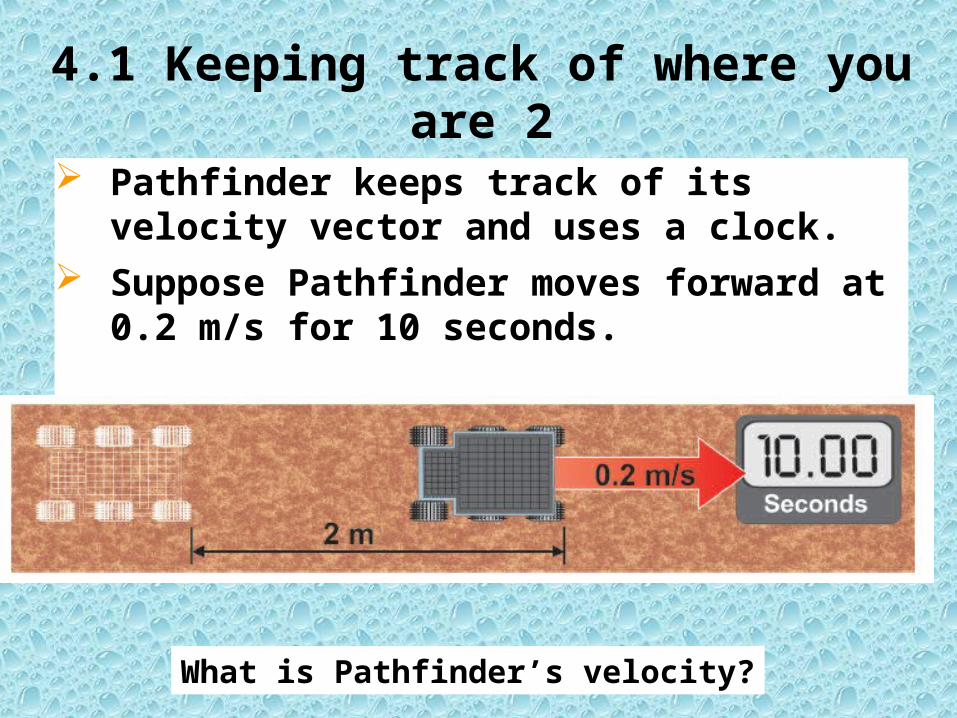
4.1 Keeping track of where you are 2
Pathfinder keeps track of its velocity vector and uses a clock.
Suppose Pathfinder moves forward at 0.2 m/s for 10 seconds.
What is Pathfinder’s velocity?

4.1 Keeping track of where you are 3 Suppose Pathfinder goes backward
at 0.2 m/s for 4 seconds.
What is Pathfinder’s change in position?
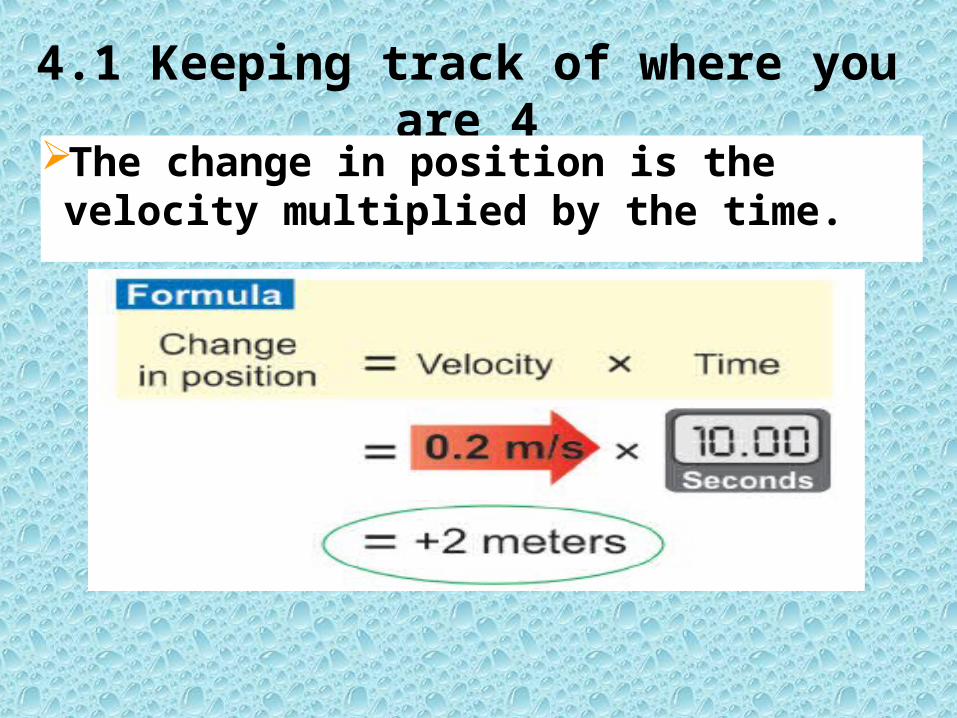
4.1 Keeping track of where you are 4
The change in position is the velocity multiplied by the time.

4.1 Keeping track of where you are 5
Each change in position is added up using positive and negative numbers.
Pathfinder has a computer to do this.
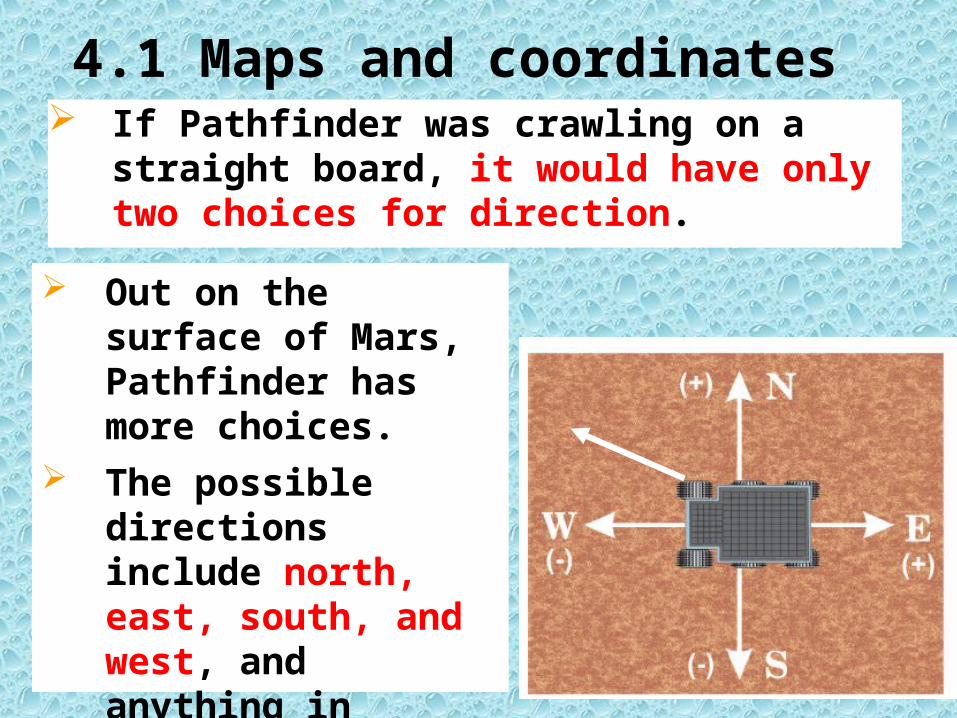
4.1 Maps and coordinates If Pathfinder was crawling on a
straight board, it would have only two choices for direction.
Out on the surface of Mars, Pathfinder has more choices.
The possible directions include north, east, south, and west, and anything in between.

4.1 Maps and coordinates A graph using north−south and
east−west axes can accurately show where Pathfinder is.
This kind of graph is called a map.
Street maps often use letters and numbers for coordinates.
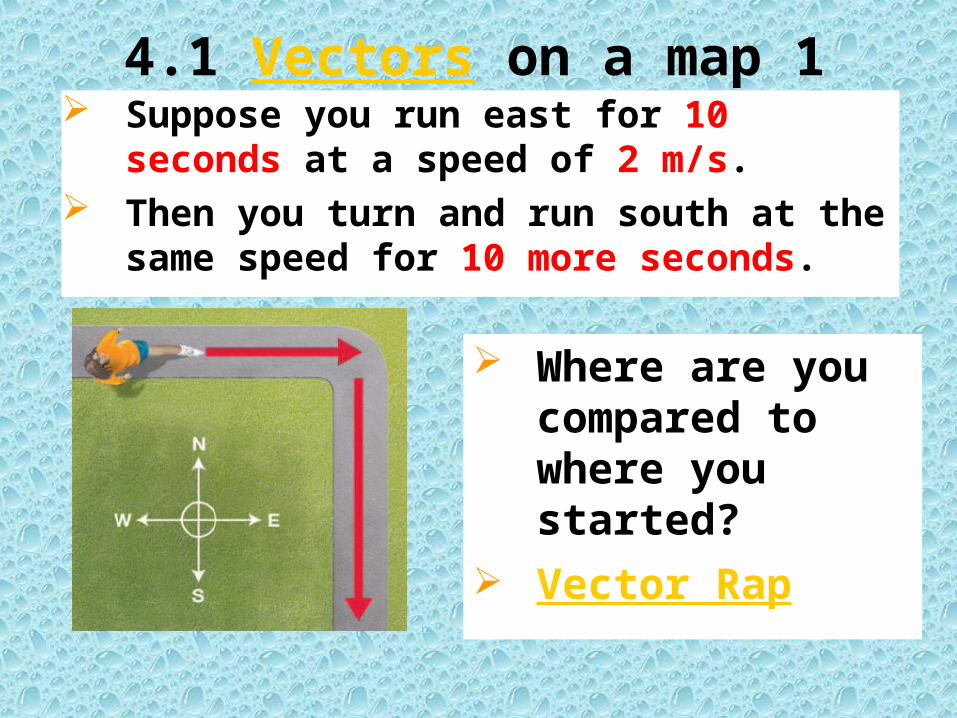
4.1 Vectors on a map 1 Suppose you run east for 10
seconds at a speed of 2 m/s. Then you turn and run south at the
same speed for 10 more seconds.
Where are you compared to where you started?
Vector Rap
4.1 Vectors on a map 2
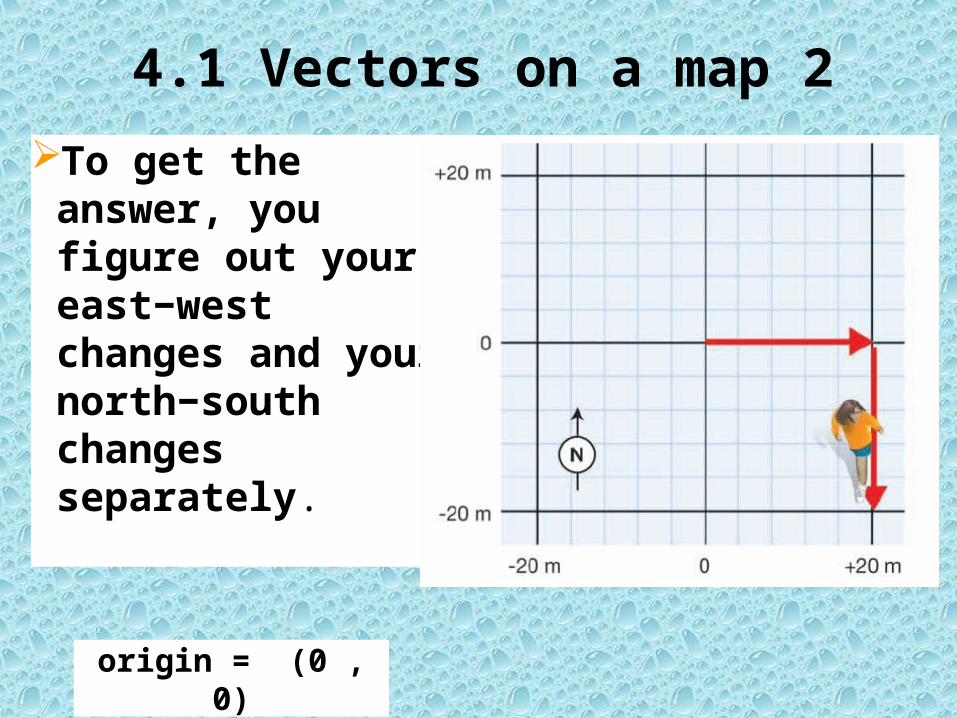
To get the answer, you figure out your east−west changes and your north−south changes separately.
origin = (0 , 0)
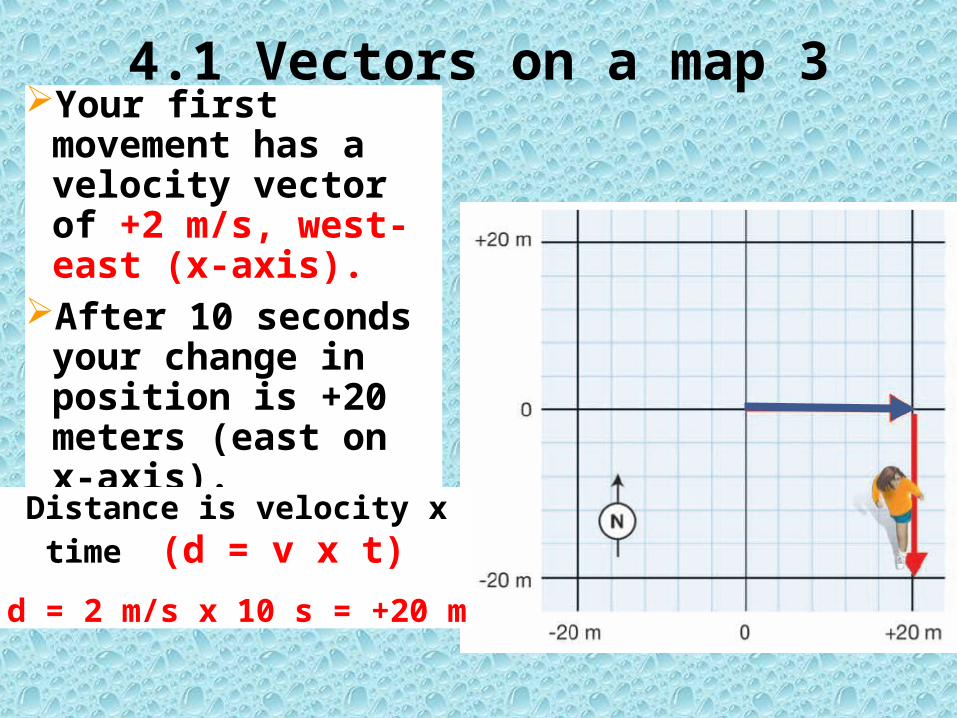
4.1 Vectors on a map 3Your first
movement has a velocity vector of +2 m/s, west-east (x-axis).
After 10 seconds your change in position is +20 meters (east on x-axis).Distance is velocity x
time (d = v x t)
d = 2 m/s x 10 s = +20 m
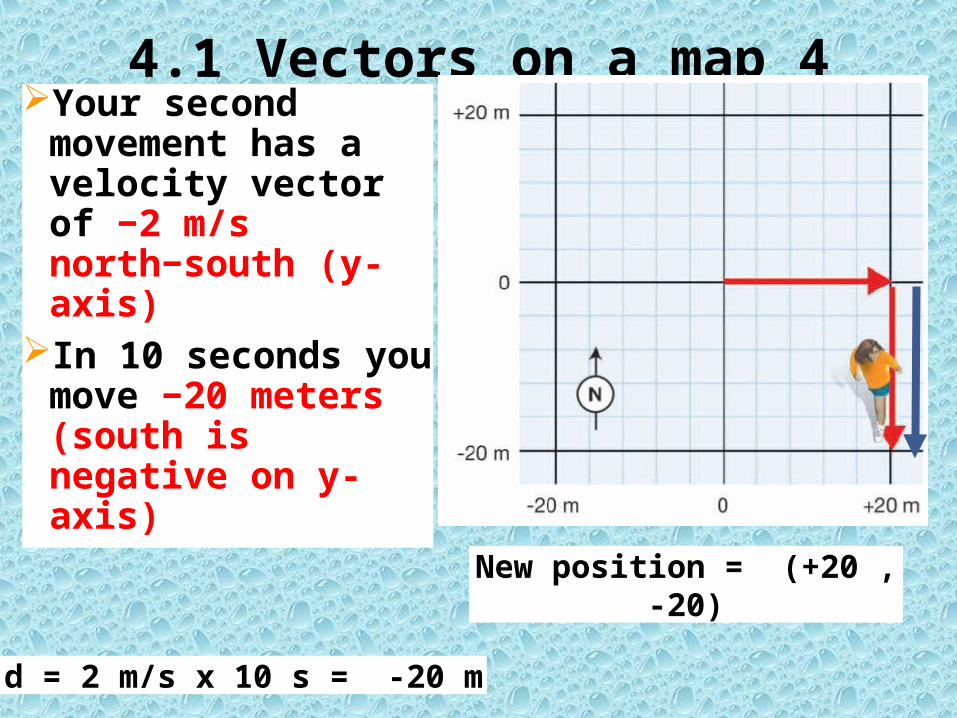
4.1 Vectors on a map 4Your second
movement has a velocity vector of −2 m/s north−south (y-axis)
In 10 seconds you move −20 meters (south is negative on y-axis)
d = 2 m/s x 10 s = -20 m
New position = (+20 , -20)

A train travels at 100 km/h heading east to reach a town in 4 hours. The train then reverses and heads west at 50 km/h for 4 hours. What is the train’s position now?
1. Looking for: …train’s new position
2. Given: …velocity = +100 km/h, east ; time = 4 h …velocity = -50 km/h, west ; time = 4 h
3. Relationships: change in position = velocity × time
Solving Problems
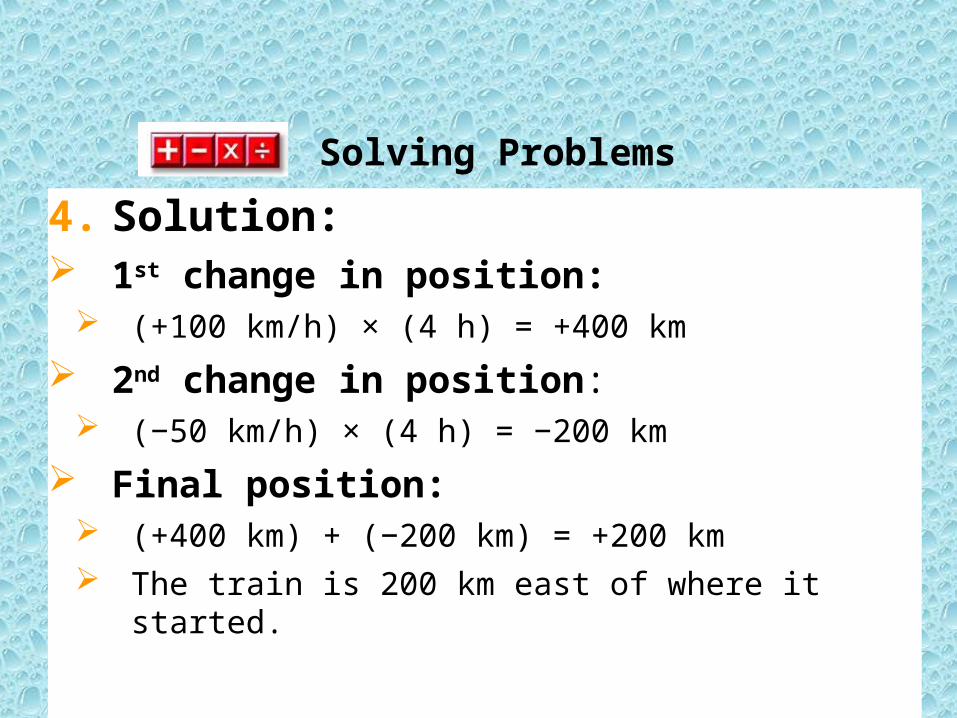
4. Solution: 1st change in position:
(+100 km/h) × (4 h) = +400 km
2nd change in position: (−50 km/h) × (4 h) = −200 km
Final position: (+400 km) + (−200 km) = +200 km The train is 200 km east of where it started.
Solving Problems

Chapter Four: Motion
4.1 Position, Speed and Velocity
4.2 Graphs of Motion4.3 Acceleration
Section 4.2 Learning Goals
Construct and analyze graphs of position versus time, and speed versus time.
Recognize and explain how the slope of a line describes the motion of an object.
Explain the meaning of constant speed.
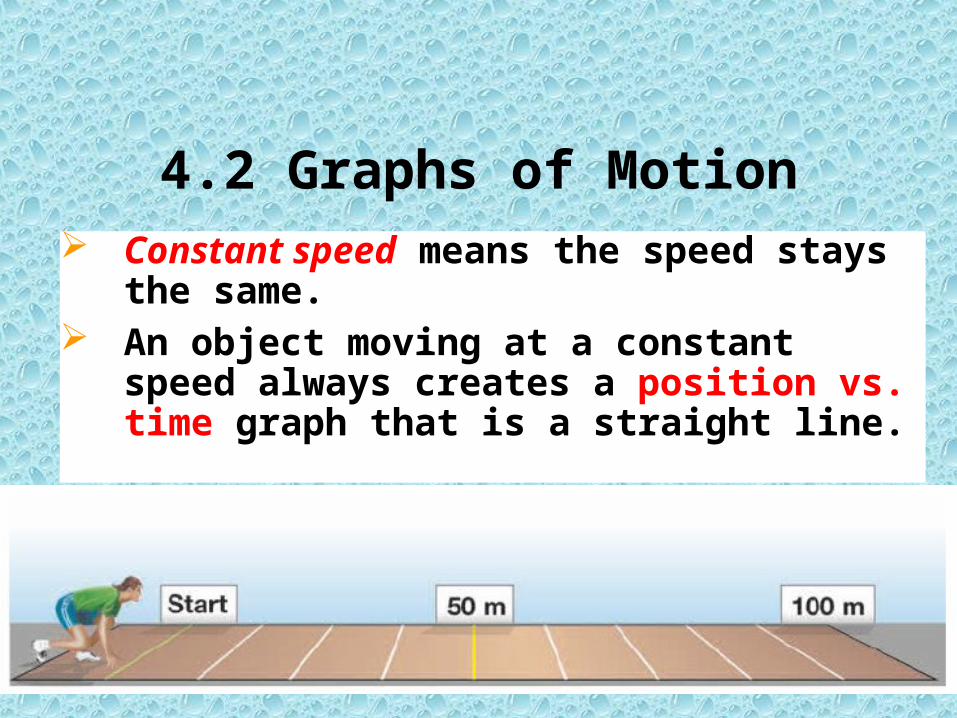
4.2 Graphs of Motion Constant speed means the speed
stays the same. An object moving at a constant speed
always creates a position vs. time graph that is a straight line.

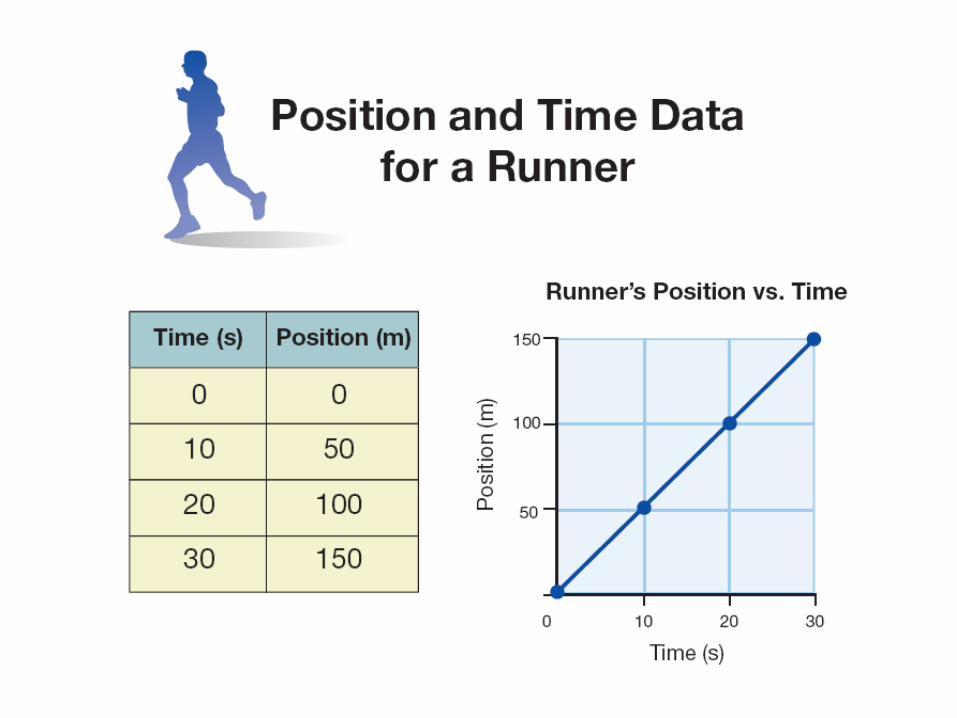
4.2 Graphs of Motion The data shows
the runner took 10 seconds to run each 50-meter segment.
Because the time was the same for each segment, you know the speed was the same for each segment.

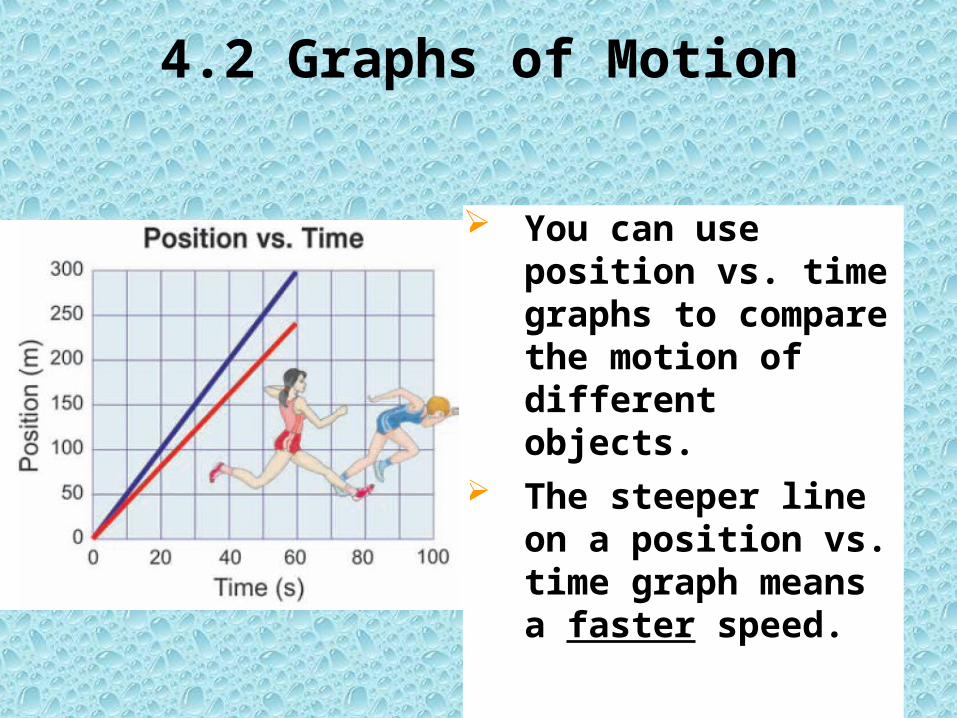
4.2 Graphs of Motion
You can use position vs. time graphs to compare the motion of different objects.
The steeper line on a position vs. time graph means a faster speed.
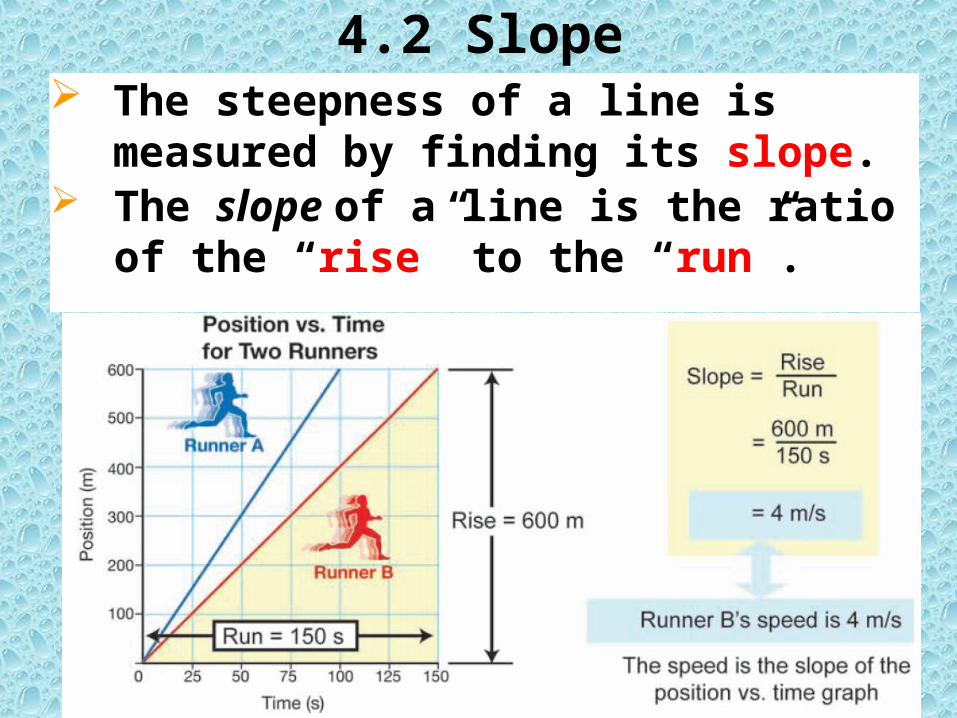
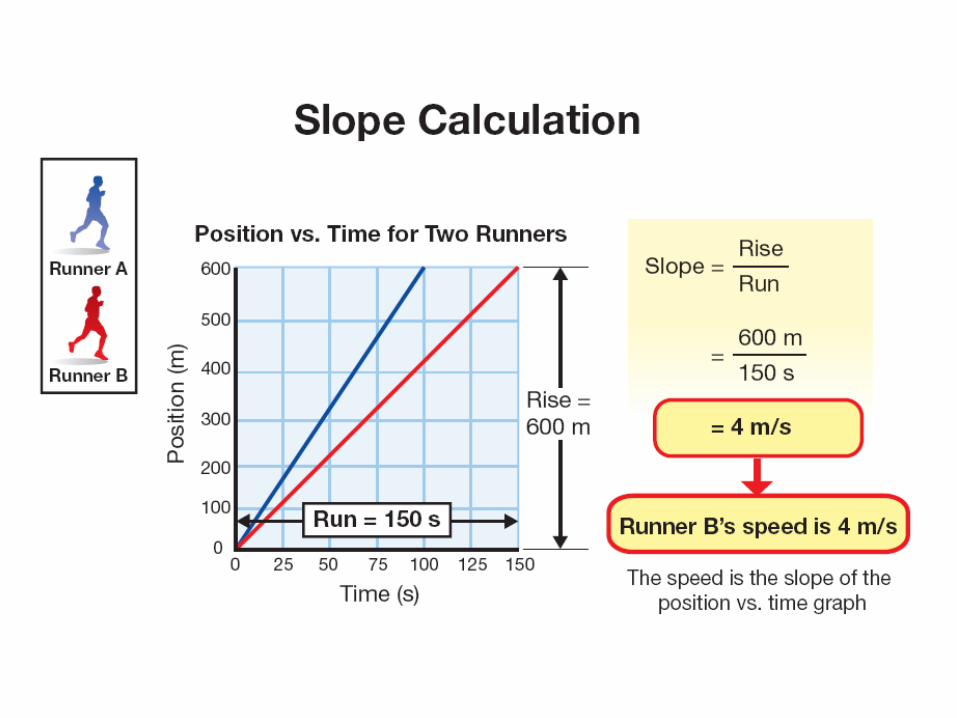
4.2 Slope The steepness of a line is
measured by finding its slope. The slope of a line is the ratio of
the “rise” to the “run”.

4.2 Graphs of changing motion
Objects rarely move at the same speed for a long period of time.
A speed vs. time graph is also useful for showing the motion of an object that is speeding up or slowing down.

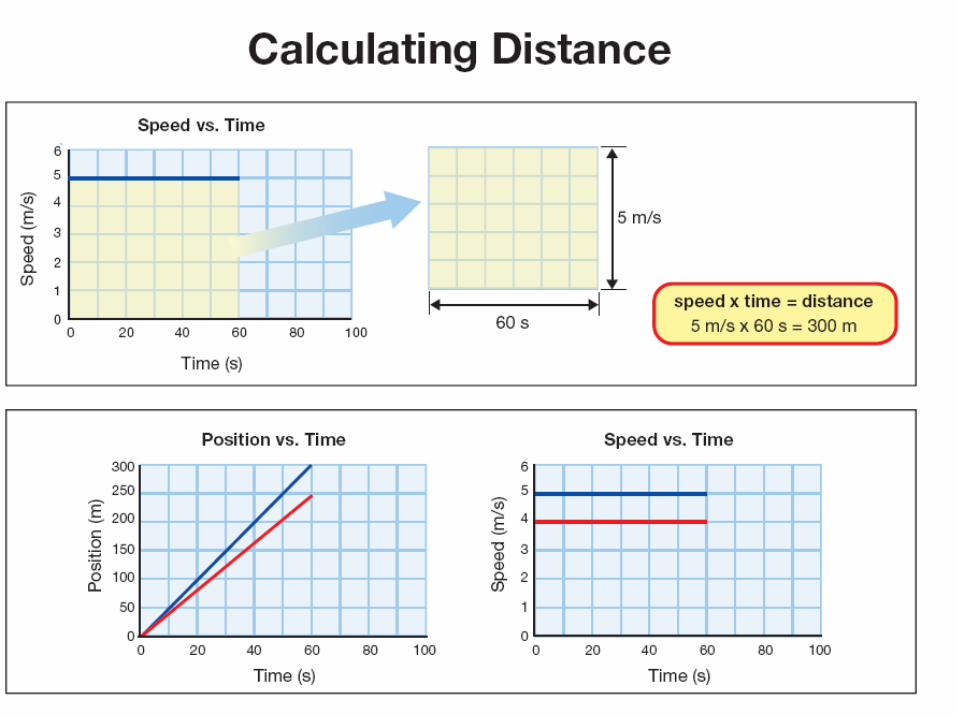
4.2 Graphs of changing motion On the graph, the length is equal
to the time and the height is equal to the speed.
Suppose we draw a rectangle on the speed vs. time graph between the x-axis and the line showing the speed.
The area of the rectangle is equal to its length times its height. Fill
In graph
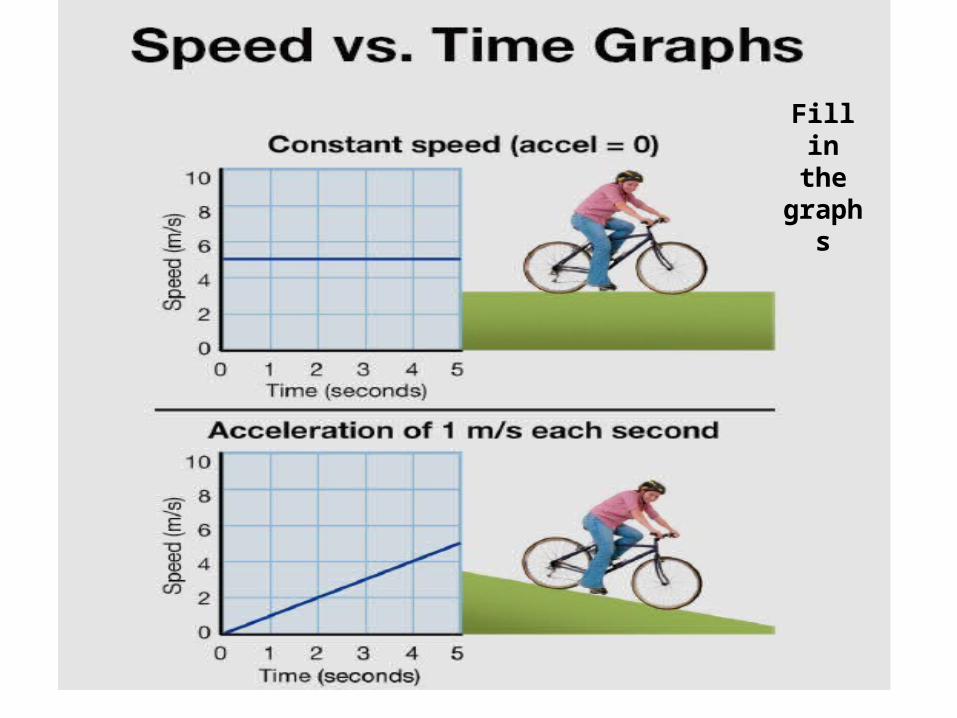
Fill in the
graphs


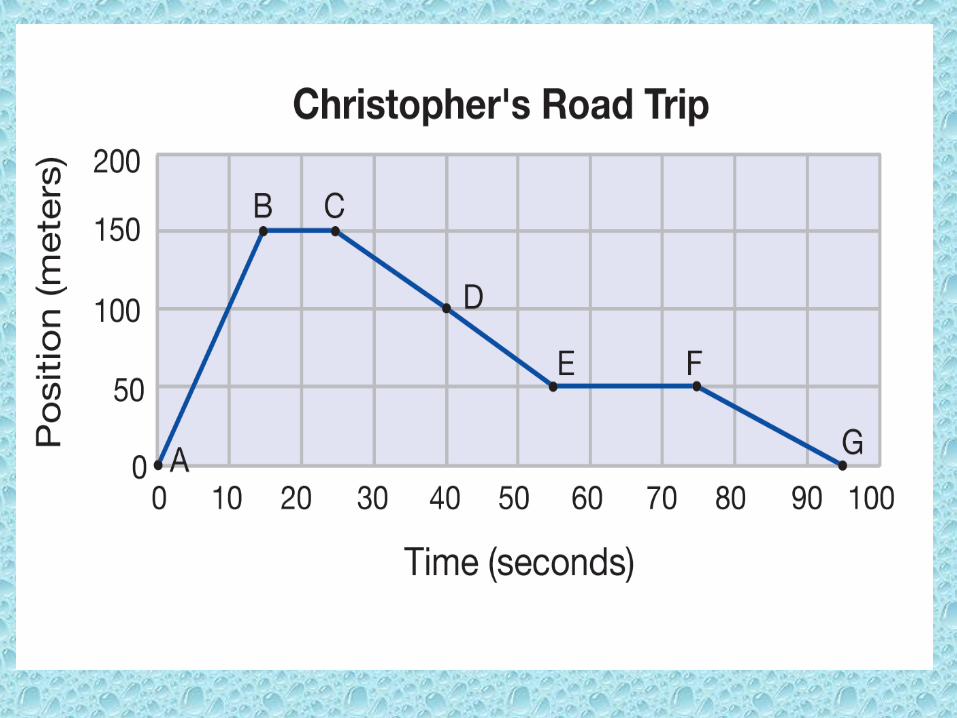
Christopher’s Road Trip Christopher borrowed his mother’s car to run a quick errand. Use the graph to answer questions about his trip.
1.How far did Christopher’s car travel between points A and B?
2.How much time did it take for Christopher to travel from point A to point B?
3.Describe the motion of Christopher’s car between points B and C.
4.What is the speed of the car between points A and B?
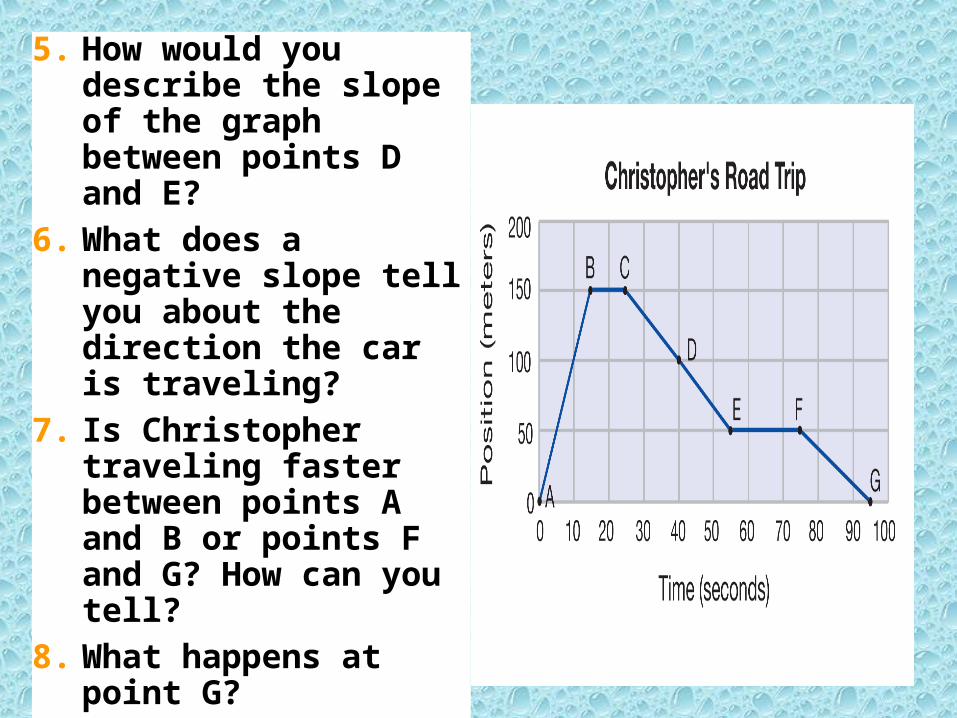
5. How would you describe the slope of the graph between points D and E?
6. What does a negative slope tell you about the direction the car is traveling?
7. Is Christopher traveling faster between points A and B or points F and G? How can you tell?
8. What happens at point G?

Chapter Four: Motion
4.1 Position, Speed and Velocity
4.2 Graphs of Motion4.3 Acceleration
Section 4.3 Learning Goals
Define acceleration.Determine acceleration by mathematical and graphical means.
Explain the role of acceleration in describing curved motion and objects in free fall.
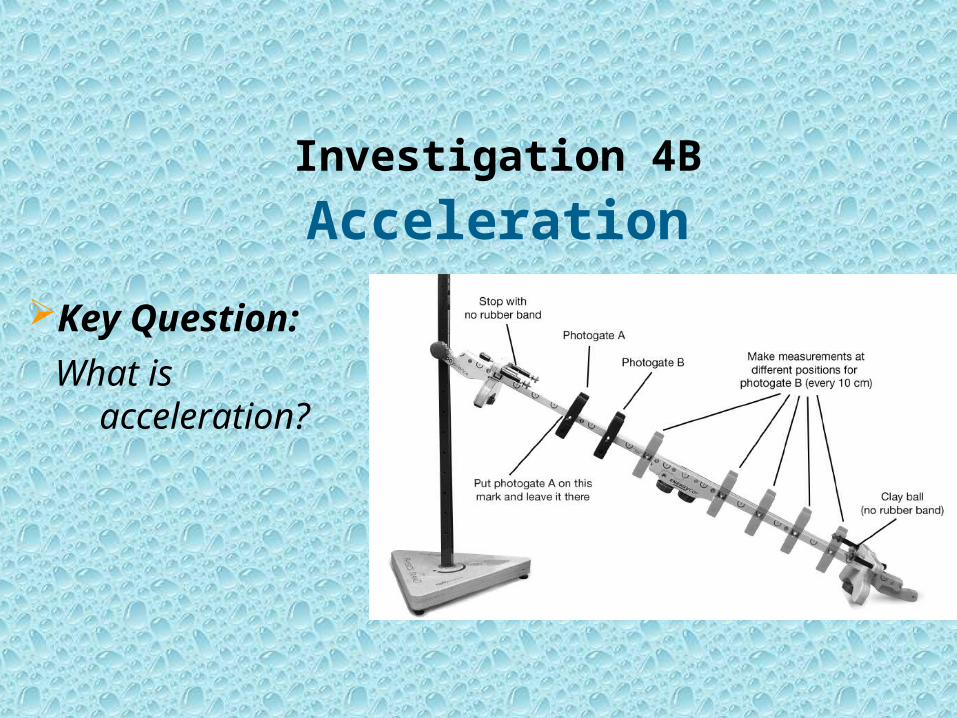
Investigation 4B
Key Question:
What is acceleration?
Acceleration


4.3 Acceleration 1If your speed increases by 1 meter per
second (m/s) for each second, then your acceleration is 1 m/s per second.
Acceleration is the rate at which your speed (or velocity) changes.

4.3 Acceleration 2Acceleration causes the line to slope
up on a speed vs. time graph. Acceleration is easy to spot on a speed vs. time graph.
What is the bike’s acceleration?
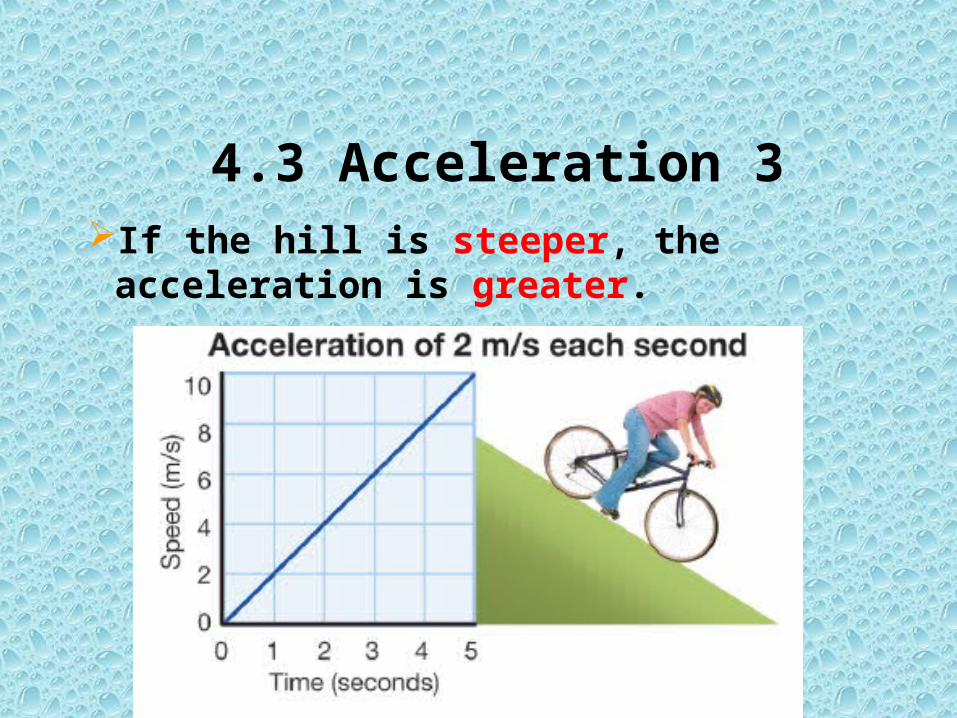
4.3 Acceleration 3If the hill is steeper, the
acceleration is greater.

4.3 Acceleration 4There is zero acceleration at constant
speed because the speed does not change.
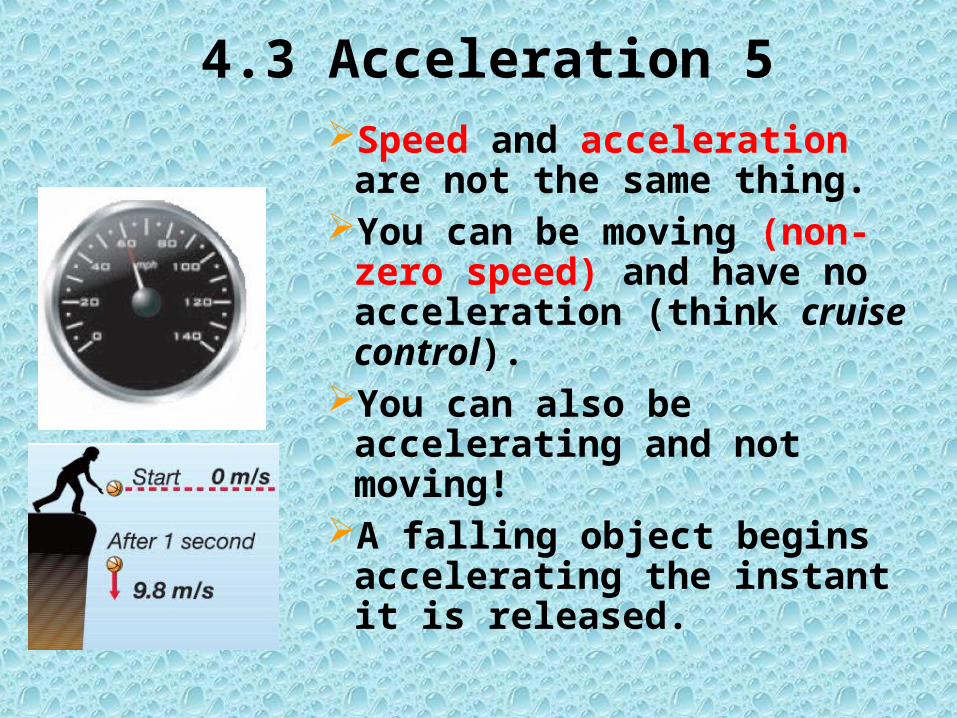
4.3 Acceleration 5Speed and acceleration
are not the same thing. You can be moving (non-
zero speed) and have no acceleration (think cruise control).
You can also be accelerating and not moving!
A falling object begins accelerating the instant it is released.

Positive and negative Accel.
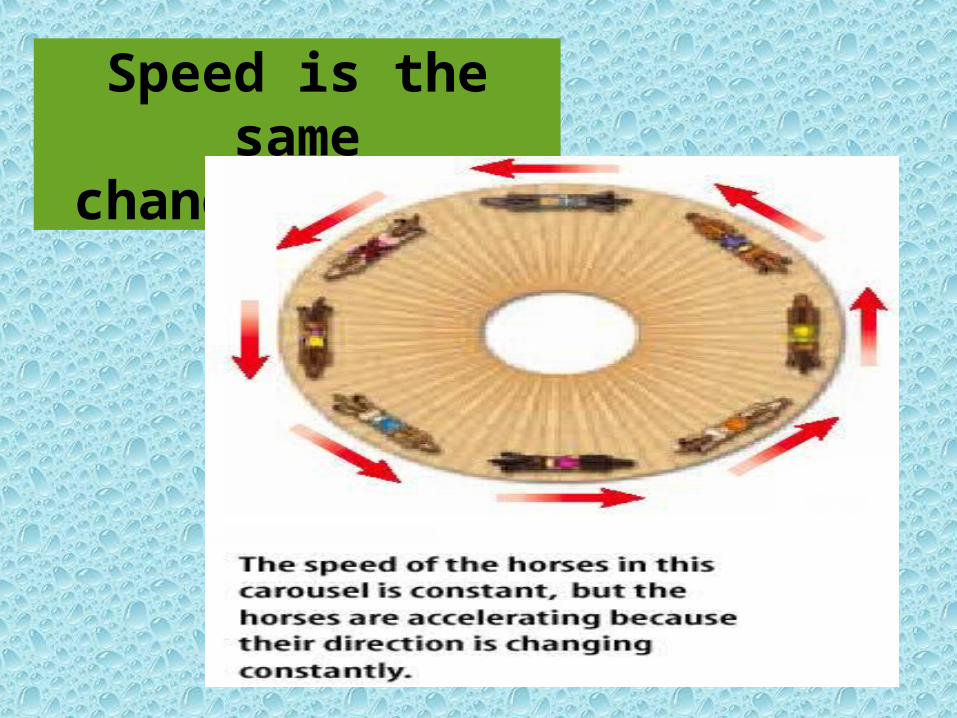
Speed is the same
changing Accel
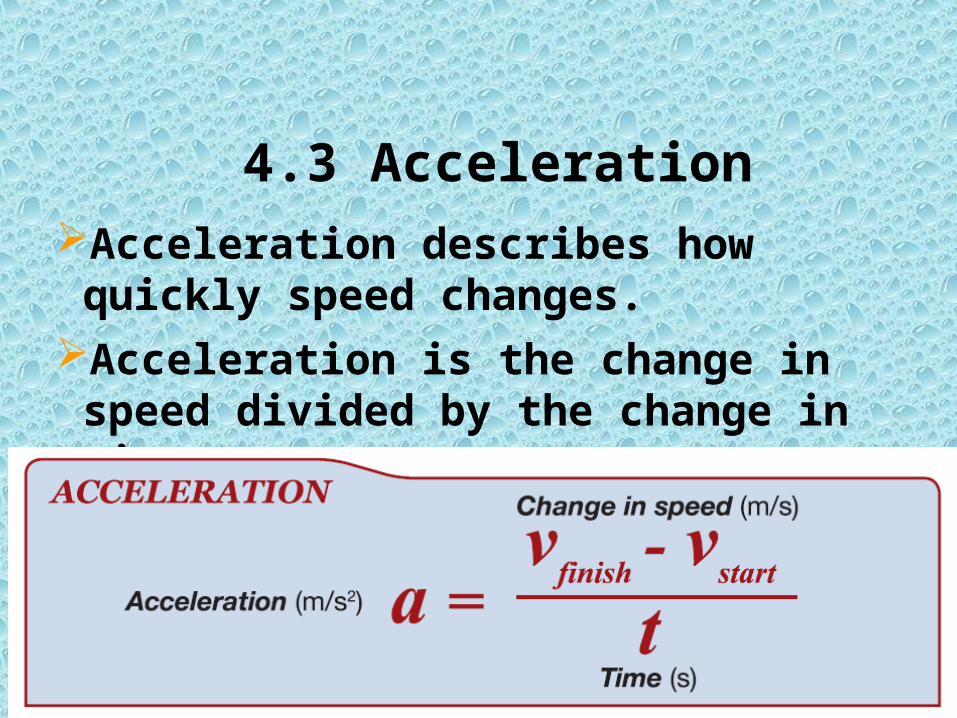
4.3 AccelerationAcceleration describes how quickly speed changes.
Acceleration is the change in speed divided by the change in time.

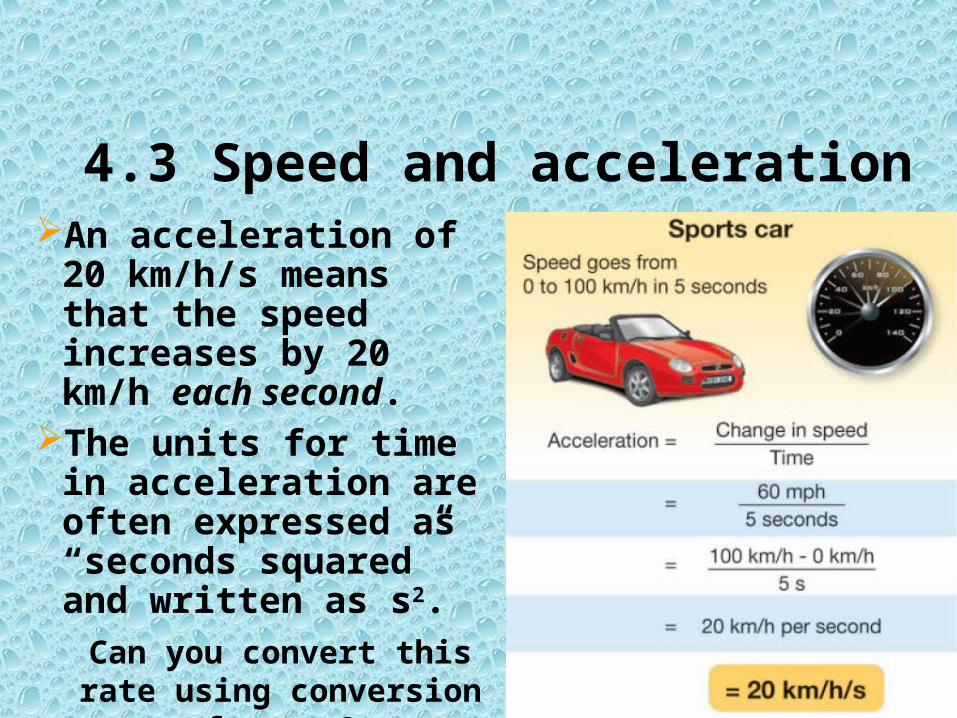
4.3 Speed and accelerationAn acceleration of
20 km/h/s means that the speed increases by 20 km/h each second.
The units for time in acceleration are often expressed as “seconds squared” and written as s2.
Can you convert this rate using conversion
factors?
Solving Problems
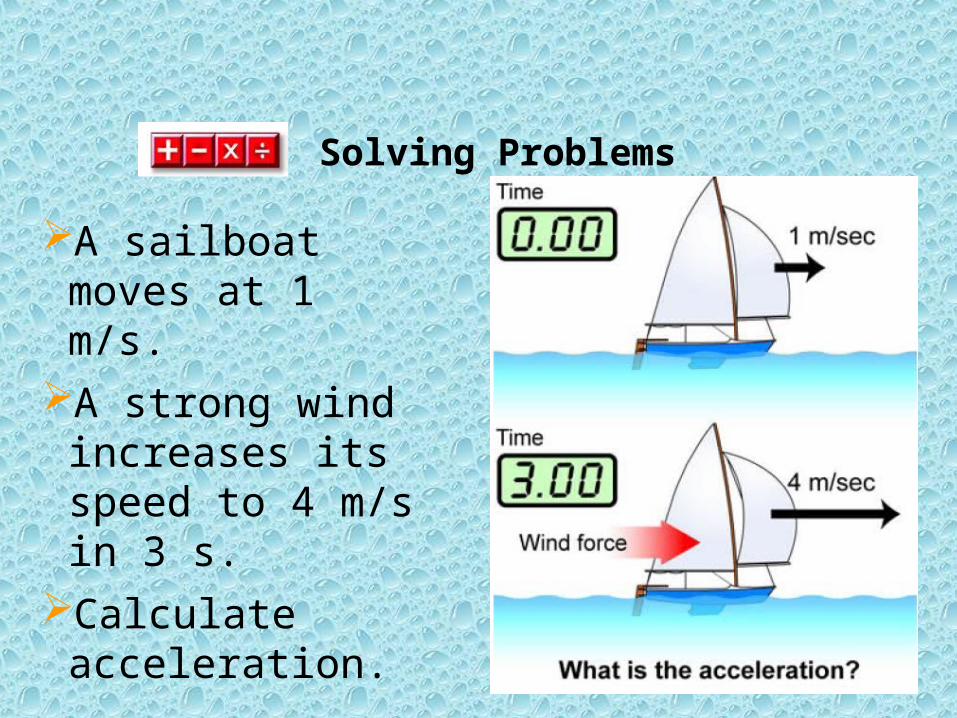
A sailboat moves at 1 m/s.
A strong wind increases its speed to 4 m/s in 3 s.
Calculate acceleration.

1. Looking for: …acceleration of sailboat
2. Given: …v1 = 1 m/s; v2 = 4 m/s; time = 3 s
3. Relationships: a = v2 – v1/t
4. Solution: a = (4 m/s – 1 m/s)/ 3 s
= 1 m/s2
Solving Problems

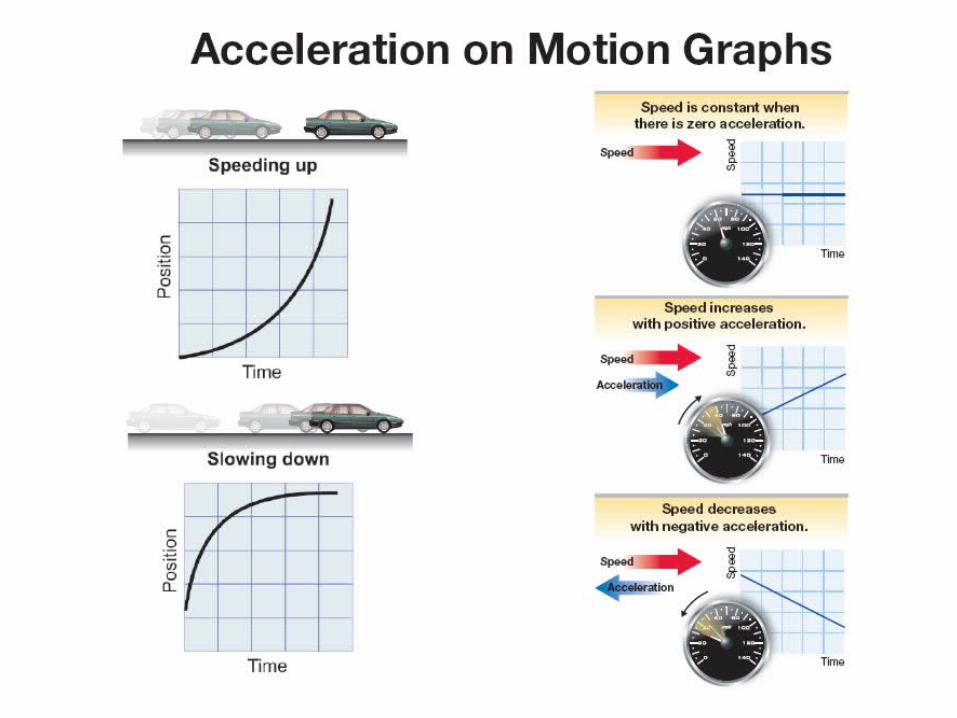
4.3 Acceleration on motion graphsThe word “acceleration” is used
for any change in speed, up or down.
Acceleration can be positive or negative.
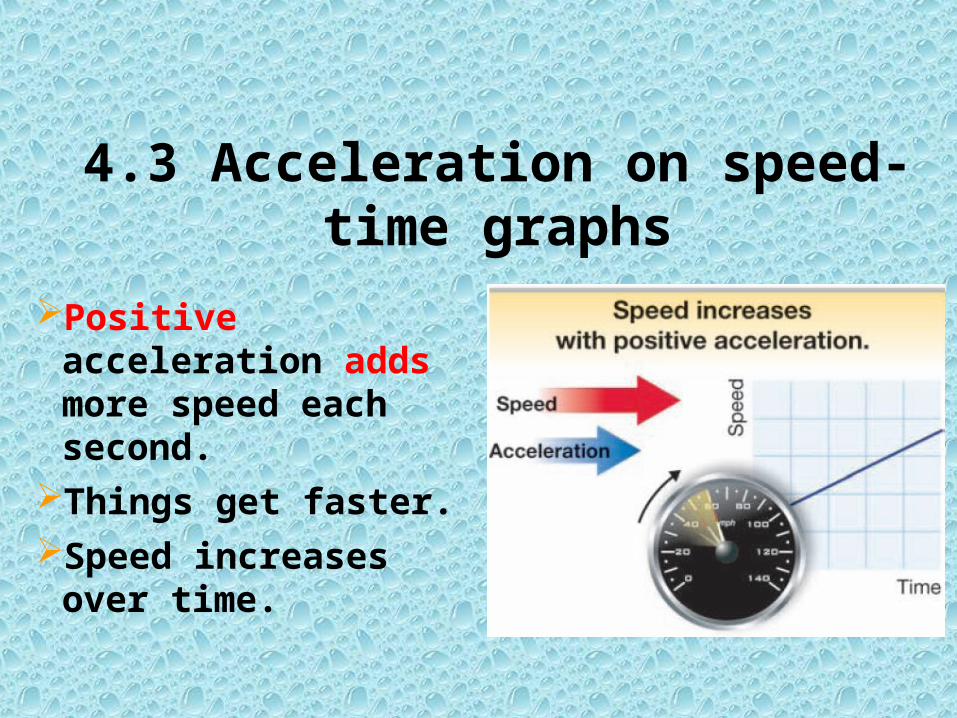
4.3 Acceleration on speed-time graphs
Positive acceleration adds more speed each second.
Things get faster. Speed increases
over time.

4.3 Acceleration on speed-time graphs
Negative acceleration subtracts some speed each second.
Things get slower. People sometimes
use the word deceleration to describe slowing down.
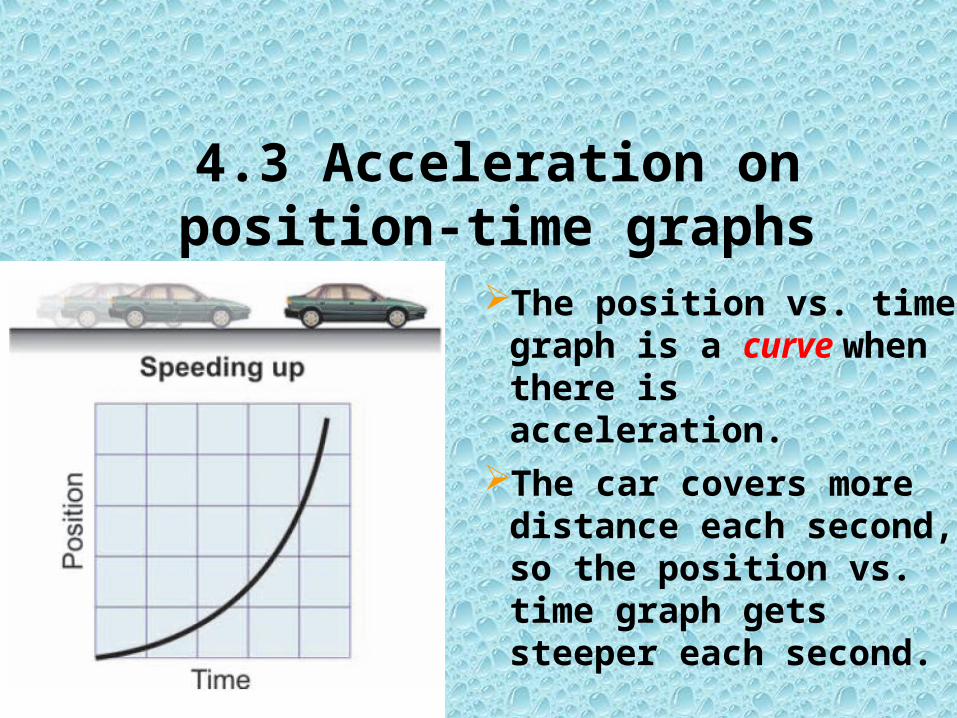
4.3 Acceleration on position-time graphs
The position vs. time graph is a curve when there is acceleration.
The car covers more distance each second, so the position vs. time graph gets steeper each second.
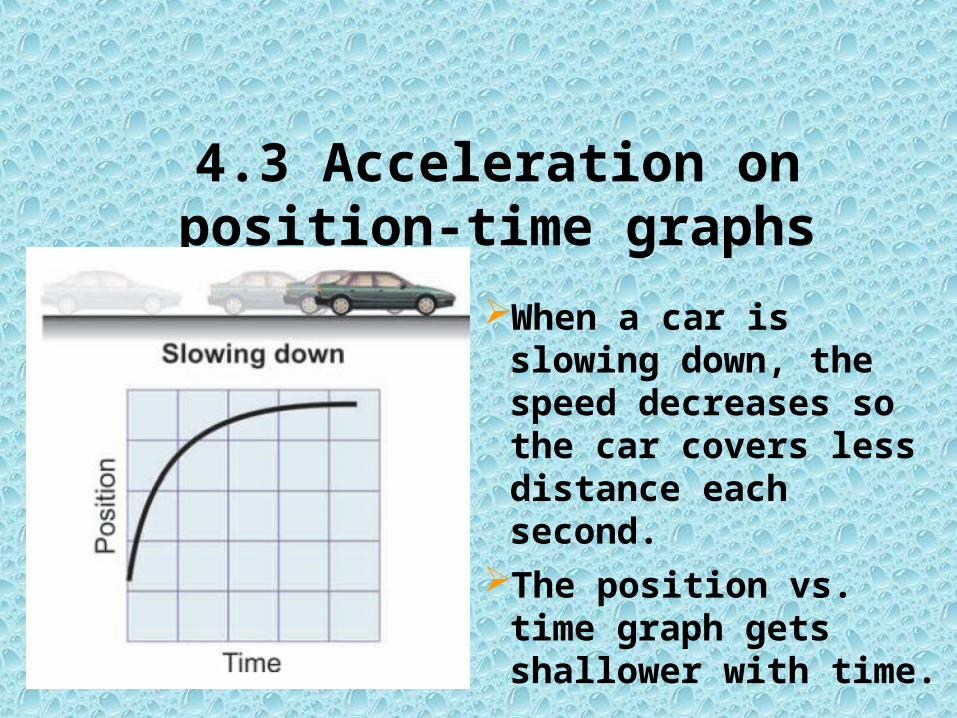
4.3 Acceleration on position-time graphs
When a car is slowing down, the speed decreases so the car covers less distance each second.
The position vs. time graph gets shallower with time.

4.3 Free fall
An object is in free fall if it is accelerating due to the force of gravity and no other forces are acting on it.
Free
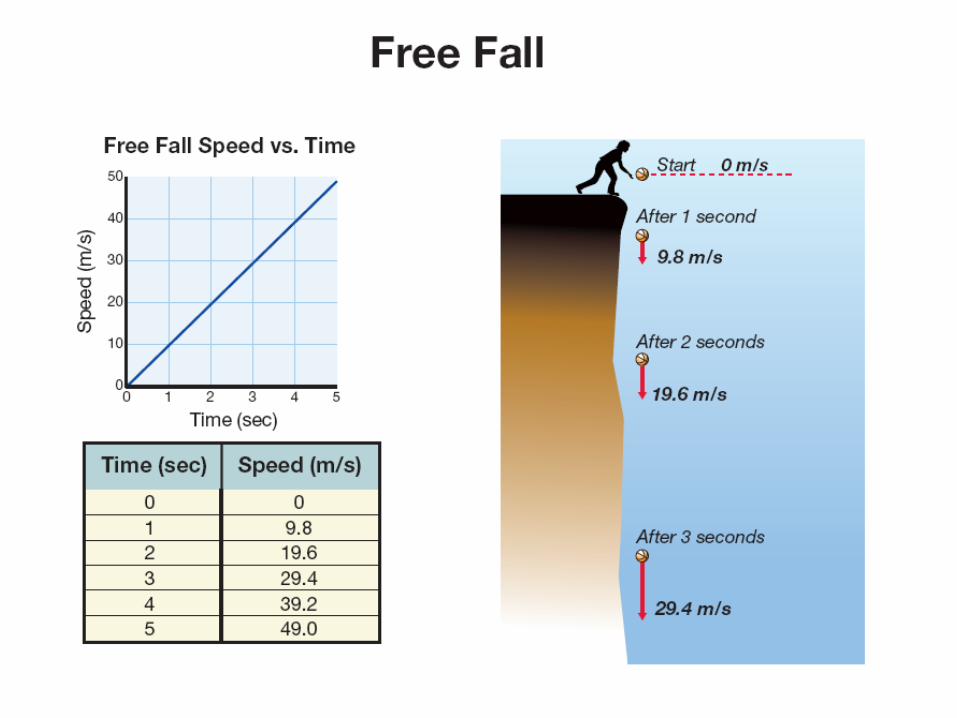
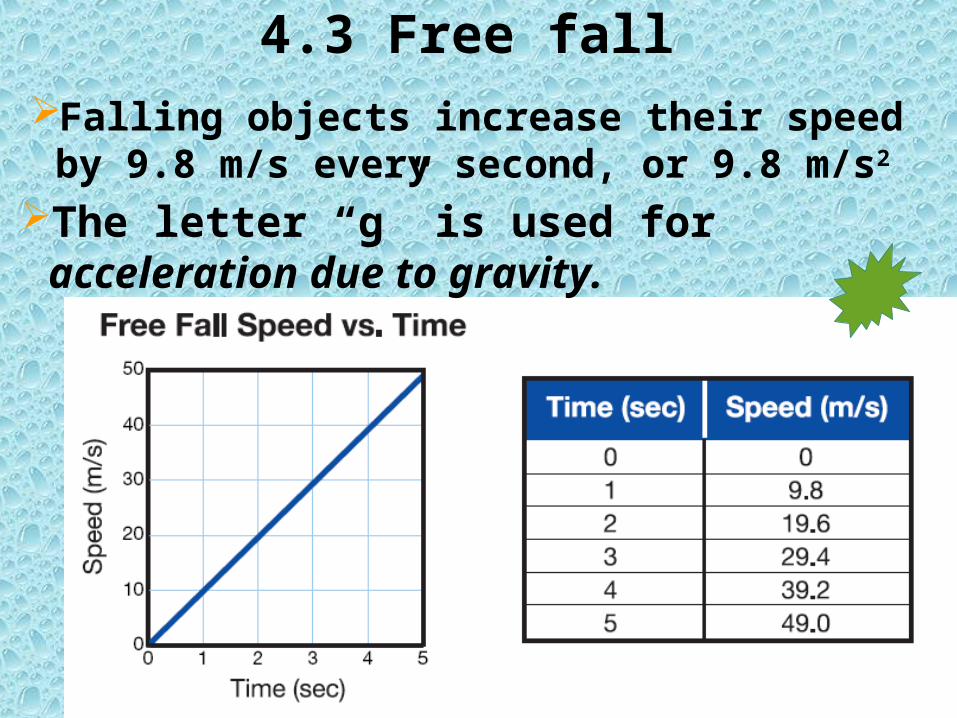
4.3 Free fallFalling objects increase their speed by 9.8 m/s every second, or 9.8 m/s2
The letter “g” is used for acceleration due to gravity.
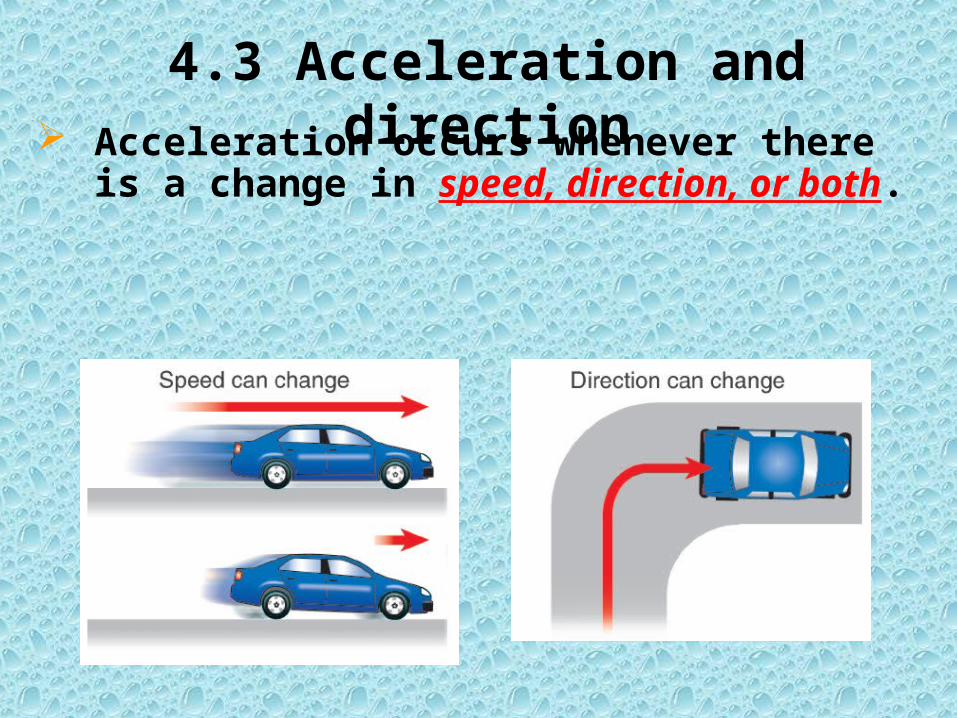
4.3 Acceleration and direction Acceleration occurs whenever there
is a change in speed, direction, or both.
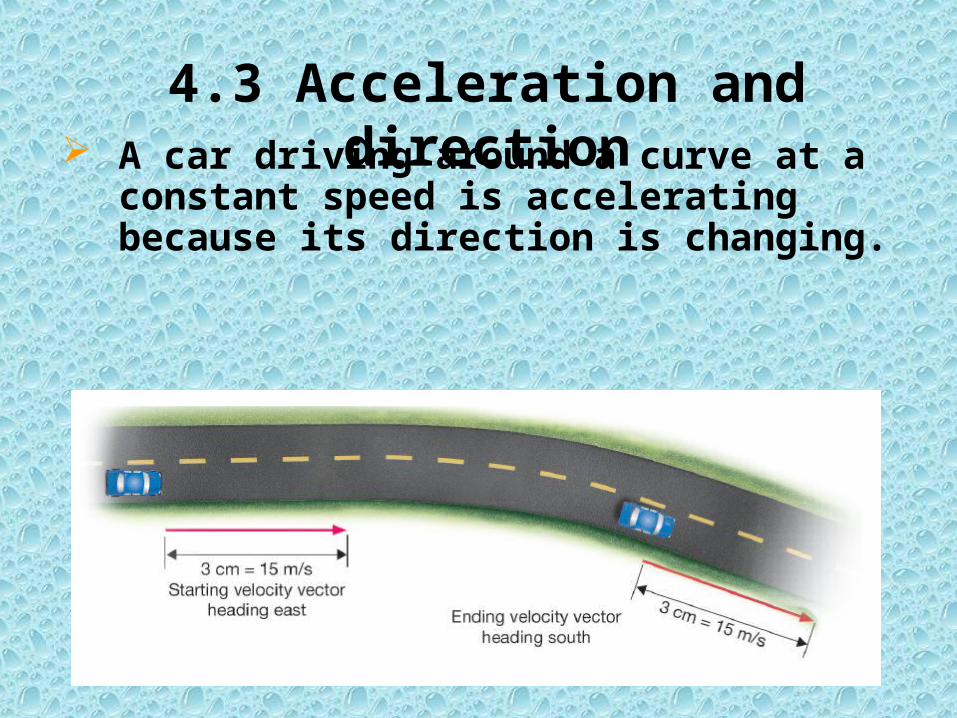
4.3 Acceleration and direction A car driving around a curve at a
constant speed is accelerating because its direction is changing.
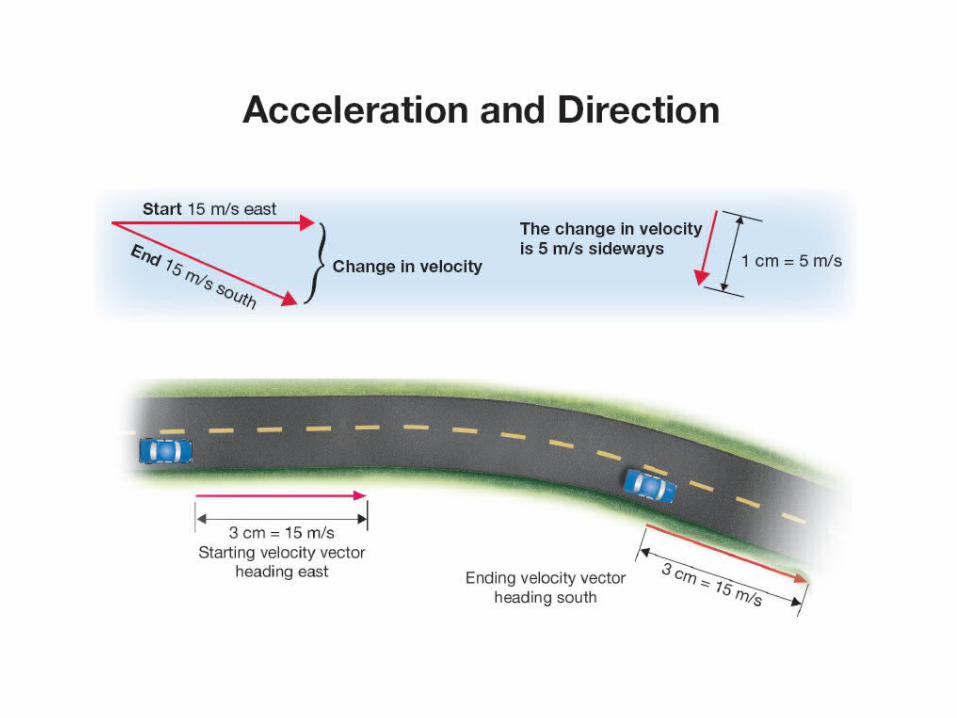
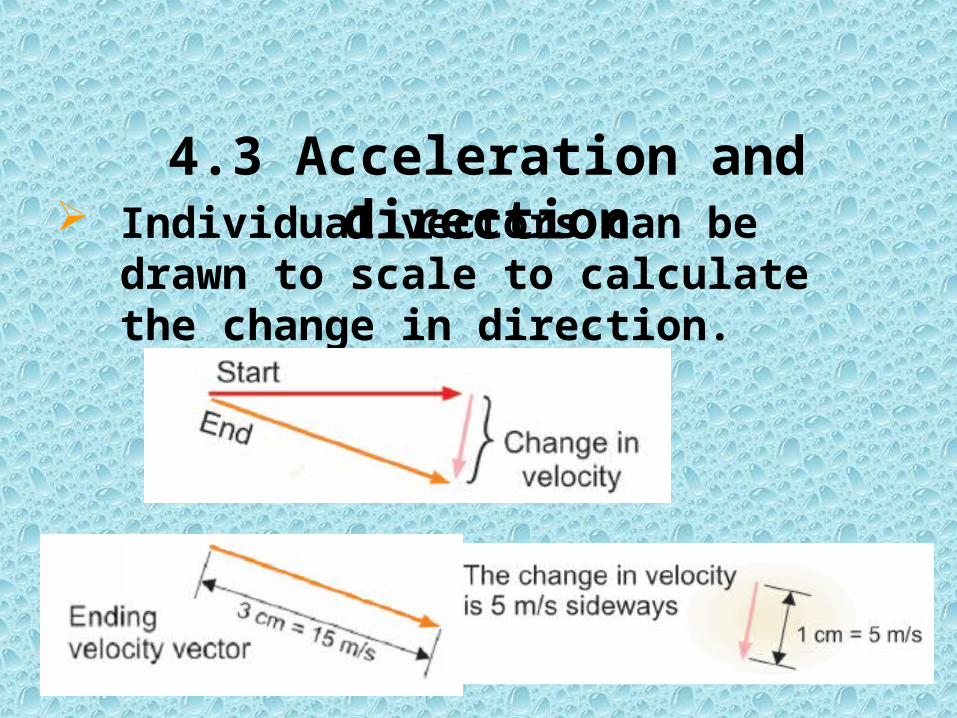
4.3 Acceleration and direction Individual vectors can be drawn
to scale to calculate the change in direction.

4.3 Curved motionA soccer ball is an
example of a projectile.
A projectile is an object moving under the influence of only gravity.
The path of the ball makes a bowl-shaped curve called a parabola.
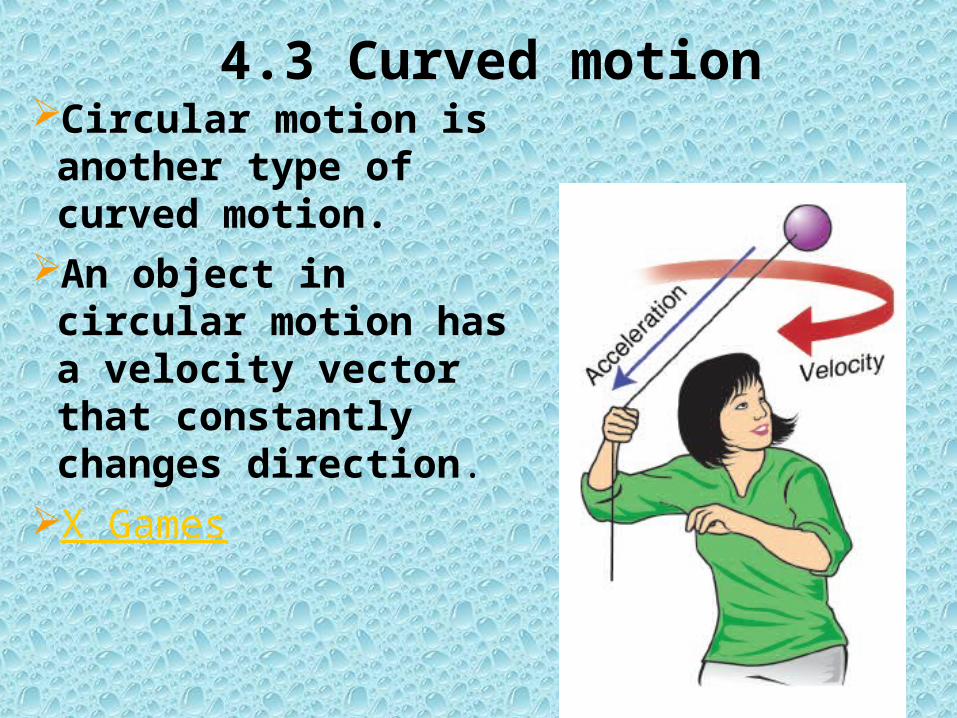
4.3 Curved motionCircular motion is another type of curved motion.
An object in circular motion has a velocity vector that constantly changes direction.
X Games

High Tech Animal Trackers
Satellite tagging research studies have led to many new laws and guidelines governing human activities around endangered species.
The more we learn about how animals interact with their environments, the better decisions we can make about how we use the oceans.