most sensitive - swrcb.ca.gov · regional board report -28 february 16 2001 final sediment cleanup...
TRANSCRIPT

Regional Board Report-26 February 16 2001
Final Sediment Cleanup Levels
NASSCO Southwest Marine Shipyards
EVALUATION OF MOST SENSITIVE BENEFICIAL USE
The environmental threat associated with contaminated sediments is caused by the
tendency of many chemical substances discharged into marine waters to attach to
sediment particles and thus accumulate to high concentrations in the bay bottom
sediments The bottom sediments support biologicalcommunities of benthic or bottom
dwelling organisms e.g worms clams bottom feeding fish that live in and eat marine
sediment The marine sediments may also serve as spawning habitat for many pelagic
species that inhabit the water column e.g invertebrates and fish The elevated
concentrations of chemicals in the sediment may cause acute mortality or can affect the
reproductive behavior egg hatching characteristics and the early life development of
these organisms In addition to acute mortality and abnormal development phenomena
contaminated sediments can also lead to the accumulation of contaminants in organisms
due to the effects of bioaccumulation In addition biomagnification of the contaminants
can occur in the food chain when smaller contaminated organisms are consumed by
higher trophic level species including humans
fundamental step in the development of cleanup levels is the identification of the most
sensitive beneficial use to be protected The Regional Board is making the assumption
that the benthic community covered under the marine habitat beneficial use MARrepresents
the most sensitive beneficial use needing protectionfrom contaminated
sediment at NASSCO and Southwest Marine shipyards This assumption is based on the
intimate contact and long duration of contact in some cases entire life cycles The
Regional Board also recognizes that there is potential threat to human health through
three principal pathways of exposure The primary and by far the most significant being
the consumption of fish and shellfish contaminated by chemicals in the sediment through
the processes of bioaccumul ation and biomagnification
The table below is derived from 40 CFR part 131 also known as the California Toxics
Rule CTR and lists the numeric criteria established in the CTR that are protective for
human health and saltwater organisms The established human health criteria specifically
take into account human health risks due to bioaccumulation
SARO6 5995

Regional Board Report 27 February 16 2001
Final Sediment Cleanup Levels
NASSCO Southwest Marine Shipyards
Table
Establishment of Numeric Criteria for
Priority Toxic Pollutants for the State of California
Protection of Organisms Protection of Human Health g/Lin Saltwater .tg/L
Constituent Acute Chronic Water and Organism consumption
organism only
consumption
Copper 4.8 3.1 1300
Lead 210 8.1
Zinc 90 81
Mercury 0.050 0.051
PCB 0.03 0.00017 0.00017
Source 40 CFR Part 131 Water Quality Standards Establishment orNumeric Criteria for Priority Toxic
Pollutants for the State or California
No promulgated criteria
The table provides the maximum concentrations of pollutant that can be found in the
water without resulting in adverse effects For example no copper toxicity to saltwater
organisms should occur if chronic copper concentrations in the saltwater are equal to or
less than 3.1 micrograms per liter p.g/L Further no adverse human effects should
occur to humans drinking liters day of untreated water and eating 6.5 grams daily of
fish or shellfish see calculations below from source of water that has less than 1300
ggIL of copper
The CTR established the human health criteria EFIC using various equations For
example to calculate the KHC for PCB when water and organisms are consumed the
following equation was used
HIHC RFxBWx1000v.tg/mgqlxWhereRF Risk factor 10BW Body Weight 70 kg
ql Cancer slope factor per mg/kg-dayWC Water Consumption 2L/day untreated surface water
FC Total Fish and Shell Fish Consumption 0.0065 kg/day
BCF Bioconcentration Factor 31200
BCFs are used to relate pollutant residues in aquatic organisms to the pollutant
concentration in ambient waters For lipid soluble pollutants the BCF is calculated from
SAR065996

Regional Board Report-28 February 16 2001
Final Sediment Cleanup Levels
NASSCO Southwest Marine Shipyards
the weighted average percent lipids in the edible portionsof fish and shellfish which is
about 3% For non-lipid soluble compounds the BCE is determined empirically As
indicated by the CTR criteria mercury and PCBs are significantly bioaccumulative
while zinc copper and lead are generally not significant bioaccumulators Data such as
those from the US Department of Health indicate that copper lead and zinc have BCFs
that are typically lower than 300 PCB and mercury have high BCFs the BCE is 31200
for PCBs and 3765 for mercury in estuarine coastal waters
In addition to ingestion of organisms that have bioaccumulation of pollutant two other
pathways of exposure to contaminated sediments are
Direct contact with contaminated sediments by swimmers or divers
Incidental ingestion of contaminated sediment or associated water by swimmers
or divers
However available literature suggests that even when conservative assumptions about
direct human exposure are used risks associated with dermal contact and incidental
ingestion of contaminated sediments are minimal and contribute less to the total risk than
other pathways such as fish consumption
As indicated by the CTR Regional Board staff is aware that mercury and PCBs axe
significantly bioaccumulative therefore it is.required that NASSCO and Southwest
Marine conduct bioaccumulation tests to address human health risks Mercury was
identified as chemical of concern at NASSCO and mercury and PCBs were identified
as chemical of concerns at Southwest Marine
CLEANUP LEVEL OPTIONS
Regional Board staff has considered six options for establishing final sediment cleanup
levels at NASSCO and Southwest Marine The six options consist of the following
Option Background Reference Station
Option Effects Range Median
Option Campbell Shipyard Shelter Island Boatyard ART Levels 20%
Safety Factor Pre-Sampling Program
Option 4- Campbell Shipyard Shelter Island Boatyard ART Levels PmSampling Program
Option Site-SpecificAET Levels Comprehensive Chemical Analysis
Option No Action
Each option was evalpated based on the degree of environmental protection provided by
the cleanup levels costs associated with cleanup activities dredge volume percentage of
SAR065997
Regional Board Report -29 February 162001
Final Sediment Cleanup Levels
NASSCO Southwest Marine Shipyards
leasehold dredged pros/cons associated with dredging to the respective cleanup levels
and the outcome for selecting each proposed option The cleanup levels dredge volume
percentage of leasehold dredged and estimated costs for each option are summarized in
Tables and
Regional Board Staff also considered four other cleanup level options prior to selecting
the proposed six options These cleanup level options were discussed in staff report
dated February 17 1999 Establishment of Shipyard Sediment Cleanup Levels for
NASSCO and Southwest Marine and is presented in Appendix The four options
include the cleanup levels developed for the boatyards in Americas Cup Harbor Paco
Terminals Teledyne Ryan Aeronautical and the Bay Protection and Toxic Cleanup
Program
Option Background Reference Station
Regional Board Staff considered the use of three reference stations REF-Ol REP-
02 and REF-03 as the background reference station These reference stations are
designated as NPDES sampling locations for all shipyard and boatyard facilities
located in San Diego Bay and are located in areas that would not be influenced by
shipyard discharges Reference station REF-Ol is located on the west side of San
Diego Bay off the Naval Ocean Systems Center pier reference station REF-02 is
located on the north side of San Diego Bay at the Cortez Marina in Harbor Islands
west basin and reference station REF-03 is located on the northeast side of San
Diego Bay at the end on the Broadway pier
Regional Board Staff conducted statistical analysis using the Students t-test to
compare the sediment conditions from the three NPDES reference stations to the
sediment conditions at NASSCO and Southwest Marine from urban runoff
Sediment conditions from urban runoff is evaluated on yearly basis at NASSCO
and Southwest Marine as required by the NPDES monitoring programs for the
shipyards Station NSS-STD-OI is sampled in the vicinity of stornidrain SW-9 and
is located on the south side of the NASSCO facility near Chollas Creek Station
SWM-STD-01 is sampled in the vicinity of stormdrain SW-4 and is located near the
bulkhead between Piers and at Southwest Marine
The objective of the statistical analysis was to identify reference station that most
closely represents sediment conditions that would exist within the NASSCO and
Southwest Marine leaseholds prior to waste discharges per Resolution No 92-49
Policies and Procedures for investigation and Cleanup andAbatement of
Discharges under Water Code Section 13304 The sediments in the vicinity of
NPDES stations NSS-STD-Ol and SWM-STD-01 are assumed to be mostly
affected by watershed runoff and have minimal influence by shipyard discharges
The contaminants that were used in the statistical analysis consist of five metals
SAR065998

CALIFORNIA REGIONAL WATER QUALITY CONTROL BOARD
SAN DIEGO REGION
IN RE THE MATTER OF
TENTATIVE CLEANUP AND ABATEMENTORDER NO R9-2011-0001
_________________
EXHIBIT BOOK TWO OF THREE TO THE
10 DEPOSITION OF DAVID BARKER
11 Volume IV
12 San Diego California
13 2011
14
15
16
Reported By Anne Zarkos RPR CRR17 CSR No 13095
PeternReporliing
Truth and Technology TranscribedTrial Presentation
530 Street 800 649 6353 toll free
Suite 350 619 260 1069 telGlobal Reach
San Diego CA 619 688 1733 fax Complex Cases
92101
Accurate Fast

INDEXWITNESS DAVID BARKER VolEXAMINATION PAGE
MR RICHARDSON
EXHIBITSMARKED FOR IDENTIFICATION PAGE
1201 NASSCOs Third Amended Notice of 16
Videotaped Deposition of
David Barker eight pages
1202 NASSCOs First Amended Notice of 23
Videotaped Deposition of San Diego10 Regional Water Quality Control Board
Cleanup Teams Persons Most
11 Knowledgeable for Designated Subject
Matters seven pages12
1203 San Diego Water Board Cleanup Teams 34
13 Amended Witness Designations three
pages14
1204 Resolution No 2001-02 five pages 69
15
1205 Letter and Certified Mail receipt to 70
16 Mike Chee of NASSCO from
John Robertus of RWQCB dated
17 June 2001 eight pages18 1206 RWQCB Guidelines for Assessment and 72
Remediation of Contaminated
19 Sediments in San Diego Bay at NASSCO
and Southwest Marine Shipyards20 dated June 2001 42 pages21 1207 Article from EcotoxicoJ.ogy 106
327-229 1996 entitled
22 Presentation and interpretation of
Sediment Quality Triad data23 13 pages24 1208 SWRCB Resolution No 92-49 as 117
Amended on April 21 1994 and
25 October 1996 21 pages
Peterson Reporting Video Litigation Services
cont1209 RWQCB Cleanup and Abatement Order 119
No 95-21 for Campbell Industries40 pages
1210 Regional Board Cleanup Teams 122
Responses Objections to DesignatedParty NASSCOs Second Set of SpecialInterrogatories 17 pages
1211 RWQCB Cleanup and Abatement Order 123
No 86-92 for Teledyne RyanAeronautical pages
1212 RWQCB Cleanup and Abatement order 127
No 89-18 for Eichenlaub Marine14 pages
10
1213 RWQCB Order No 91-91 Rescinding 129
11 Cleanup and Abatement Order No88-70 for Shelter Island Boatyard
12 12 pages13 1214 RWQCB Cleanup and Abatement Order 131
No 88-79 for Bay City Marine14 16 pages15 1215 RWQCB Addendum No to Cleanup and 132
Abatement Order No 89-31 for16 Driscoll Custom Boats 17 pages17 1216 RWQCB Addendum No to Cleanup and 134
Abatement Order No 88-78 for
18 Kettenburg Marine Corporation andWhittaker Corporations four pages
19
1217 RWQCB Cleanup and Abatement Order 13520 No 89-32 for Koehier Kraft Company
21 pages21
1218 RWQCB Cleanup and Abatement Order 13622 No 88-86 for Mauricio and Sons
Inc 18 pages23
1219 RWQCB Cleanup and Abatement Order 13724 No 85-91 for Paco Terminals Inc
20 pages25
Peterson Reporting Video Litigation Services

cont1220 NASSCO Whole Yard Bathymetry Survey 153
one page
1221 Technical report entitled Total 164
Maximum Daily Loads for Dissolved
Copper Lead and Zinc in Chollas
Creek Tributary to San Diego Baydated May 30 2007 eight pages
1222 EPA document entitled Contaminated 166
Sediment Remediation Guidance for
Hazardous Waste Sites nine pages
1223 Report entitled Sediment Assessment 170
Study for the Mouths of Chollas and
Paleta Creek San Diego dated
10 May 2005 13 pages
11
12
13 ALL EXHIBITS FOR ALL VOLtThES TO BE BOUND SEPARATELY
14
15
16
17
18
19
20
21
22
23
24
25
Peterson Reporting Video Litigation Services

INDEXWITNESS DAVID BARKER Volume
EXAMINATION PAGE
MR RICHARDSON 216
MS EVANS 391
MS REYNA 404
MS WITKOWSKI 412
EXHIBITS10 MARKED FOR IDENTIFICATION PAGE
11 1224 Attachment of Tentative Cleanup 293
and Abatement Order No12 R9-2011-0001 entitled Polygons
Targeted for Reinediation two pages13
1225 RWQCB Addendum No to Cleanup and 308
14 Abatement Order No 88-79 for Bay
City Marine Inc 16 pages15
1226 SWRCB revised of document entitled 311
16 UST Case Closure Summary nine
pages17
1227 Data table with test results from 318
18 2001/2002 and 2009 investigations
for Chemicals of Concern one page19
1228 Data tables for copper mercury 319
20 HPAR PCBs and tributyltin five
pages21
1229 Donceptual Work Plan for Campbell 356
22 Shipyard prepared by Anchor
Environmental dated March 200223 27 pages24
25
Peterson Reporting Video Litigation Services
213

EXHIBITS1230 RWQCB Staff Report on the 361
Establishment of Shipyard Sediment
Cleanup Levels for NASSCO and
Southwest Marine Inc dated
February 17 1999 six pages
1231 RWQCB Final Report for Shipyard 366
Sediment Cleanup Levels NASSCO
Southwest Marine Shipyards dated
February 16 2001 34 pages
1232 RWQCB Addendum No to Cleanup and 381
Abatement Norder No 85-91 for
Paco Terminals Inc 13 pages
1233 RWQCB Staff Report for Cleanup and 387
10 Abatement Order No 98-08 for The
Aerostructures Group of BF Goodrich
11 Aerospace and The BF Goodrich
Company dated March 26 199812 17 pages13 1234 PowerPoint slides from San Diego Bay 389
Contaminated Marine Sediments
14 Assessment and Remediation Workshop
dated June 18 2002 27 pages15
16
17 ALL EXHIBITS TO BE BOUND SEPARATELY
18
19
20
21
22
23
24
25
Peterson Reporting Video Litigation Services
214

INDEXWITNESS DAVID BARXER
EXMilNAT ION PAGEMS WITKOWSKI 438
BROWN 487
BENSHOOF 566
EXHIBITSMARKED FOR IDENTIFICATION PAGE
1235 Anchor QEA L.P Cost Estimate for 464
Remedial Footprint San Diego10 Shipyards Sediment Site
July 12 2010 two pages11
1236 Regional Board Cleanup Teams 512
12 Responses Objections to Designated
Party San Diego Unified Port13 Districts First Set of Request for
Admissions 26 pages14
1237 Letter to John Robertus from 530
15 Thomas Mulder of ENV America dated
June 15 2005 eight pages16
1238 Economic Considerations of Proposed 555
17 Amendments to the Sediment QualityPlan for Enclosed Bays and Estuaries
18 in California dated January 201176 pages
19
1239 RWQCB Staff Report on the 576
20 Establishment of Shipyard Sediment
Cleanup Levels for NASSCO and21 Southwest Marine Inc dated
February 17 1999 12 pages22
1240 Record of Written Conimunications 583
23 Between SWM and RWCB During
Development of the DTR24 Chronological Index dated
February 28 2011 66 pages25
Peterson Reporting Video Litigation Services
435

cont1241 Email from Craig Carlisle to Tom Alo 586
and David Barker dated July 252003 one page
1242 Letter with attachment to 594
David Barker from Lane McVey of
NASSCO dated November 200430 pages
1243 Ogden Environmental and Energy 635
Services report entitled Final
Report Site Reinediation Marine
Railway Removal Project Southwest
Marine Shipyard dated
December 1998 11 pages10 1244 Excerpt from Ogden Environmental and 650
Energy Services report entitled11 Final Report Site Remediation
Marine Railway Removal Project12 Southwest Marine Shipyard dated
December 1998 nine pages13
1245 Southwest Marine NPDES Permit 663
14 Marine Sediment Monitoring and
Reporting Annual Report dated
15 August 2000 15 pages16 1246 Intermal Memorandum dated April 29 666
1991 one page17
1247 Excerpt from Ogden Environmental and 673
18 Energy Services report entitled
Final Report Site Remediation
19 Marine Railway Removal Project
Southwest Marine Shipyard dated
20 December 1998 six pages21
22
23
24
25
Peterson Reporting Video Litigation Services
436

INDEXWITNESS DAVID BARKER
EXAMINATION PAGE
MR BENSHOOF 689
MR HANDMAC HER 897
MR WATERMAN 906
EXHIBITSMARKED FOR IDENTIFICATION PAGE
1248 Southwest Marine Inc Technical 702
Report Section F.1a-c dated
10 November 17 1998 21 pages11 1249 Aerial photograph dated 1970-1973 715
one page12
1250 Aerial photograph dated 1964 724
13 one page14 1251 Aerial photograph dated 1969 728
one page15
1252 Aerial photograph dated November 27 732
16 1978 one page17 1253 Aerial photograph dated 1978 735
one page18
1254 Aerial photograph dated July 15 737
19 1975 one page20 1255 Aerial photograph dated 1981 738
one page21
1256 Aerial photograph dated 1981 738
22 one page23 1257 Aerial photograph dated February 26 741
2003 one page24
1258 Email from Ruth Kolb to Lisa Honma 758
25 dated November 21 2005 one page
Peterson Reporting Video Litigation Services
684
cont1259 Aerial photograph dated December 30 762
2003 one page
1260 Storm water map one page 763
1261 Excerpt from Ogden Environmental and 777
Energy Services report entitled
Final Report Sediment
Characterization Study and
Remediation Plan Southwest Marine
Shipyard San Diego Californiadated December 1998 14 pages
1262 Woodward-Clyde document entitled 778
.appendix SAIC Sediment Sampling
Report January 13 1991 25 pages10
1263 1950 Certified Sanborn Map 78511
1264 1956 Certified Sariborn Map 795
12
1265 1959 Certified Sariborn Map 796
13
1266 1965 Certified Saxthorn Map 796
14
1267 1976 Certified Sanborn Map 79915
1268 Maps of San Diego Marine 800
16 Construction shipyard facilitiesfour pages
17
1269 Bechtel document entitled 802
18 Preliminary Assessment dated
November 22 1993 20 pages19
1270 Fax from Ruth Kolb to Craig Carlisle 808
20 dated November 22 2005 three pages21 1271 RWQCB Fact Sheet for Discharges from 825
Ship Construction Modification22 Repair and Maintenance Facilities
and Activities Located in the
23 San Diego Region nine pages24 1272 Letter to Jill Tracy of SDGE from 29
Jason Conder Ph.D of Environ25 dated February 10 2011 ten pages
Peterson Reporting Video Litigation Services
685

cont1273 Figures from Environ Report 829
eight pages
1274 Spreadsheet entitled Soil Sample 851
Analytical Results one page1275 Excerpt from Underground Storage 857
Tank Closure Report prepared byTN Associates dated Novenber 132006 six pages
1276 Memorandum with attachments from 858
TN Associates to SDGE dated
February 2011 16 pages
1277 Spill/Illicit Discharge Log 884
10 two pages11 1278 Environmental Affairs Spill/Illicit 885
Discharge Report Form two pages12
1279 RWQCB Resolution No R92007-0043 924
13 14 pages14 1280 Campbell Sediment Remediation 932
Aquatic Enhancment report dated15 July 2003 235 pages16 1281 Anchor Environmental document 934
entitled Construction Quality17 Assurance Report and Documentation
of Construction Completion dated18 June 2008 50 pages19 1282 Ninyo Moore document entitled 935
Long-term Monitoring and Reporting20 Plan Sediment Remediation and
Aquatic Enhancement Project former21 Campbell Shipyard San Diego
California dated April 20 200522 46 pages23 1283 Printout from RWQCB 401 Water 938
Quality Certification 23 pages24
25
Peterson Reporting Video Litigation Services
686

cont
1284 EPA Superfund Record of Decision for 945
Commencement Bay dated 1989
12 pages
1285 EPA Superfund Record of Decision for 947
Puget Sount Naval Shipyard Complex
dated 2000 11 pages
10
11
12
13
14
15
16
17
18
19
20
21
22
23
24
25
Peterson Reporting Video Litigation Services
687
1232

FXHIB1T NO
e-
CALIFORNIA REGIONAL WATER QUALITY CONTROL BOARD
SAN DIEGO REGION
ADDENDUM NO TO CLEANUP AND ABATEMENT ORDER NO 85-91
PACO TERMINALS INC
NATIONAL CITY
SAN DIEGO COUNTY
The California Region.al Water Quality Control Board San Diego Region hereinafter
Regional Board finds thar
On December 12 1985 the Regional Board Executive Officer issued Cleanup and
Abatement Order No 85-91 Paco Terminals Inc. National City San Diego County
Order No 85-91 contained findings establishing that copper ore loading and
storage operations at Paco Terminals Inc had resulted in discharges of inorganic
copper ore to San Diego Bay The inorganic copper ore consisted of rendered
form of cupric ferrous sulfide ore known as chalcopyrite The discharges of
copper ore to San Diego Bay were in direct violation of discharge prohibitions
contained in Order Nos 79-72 and 84-50 Waste Discharge Requirements for Paco
Terminals Inc National City San Diego County Order No 5-91 directed Paco
TerminaLs to submit report identifying the lateral and vertical extent of copper
ore in sediments oea Paco Terminals and cost estimates associated with three
cleanup alternatives to remove the copper ore from San Diego Bay
In March 1986 Paco Terminals inc submitted report entitled Eyaluatlon of
the Impact of Copper Ore In the Marine Eniironment In the Vicinity of Paco
Terminals Inc the Benefcial Uses of San Diego Bay prepared by Westec
Services Inc hereinafter referred to as the March 1986 Westec Report The
March 1986 Westec Report was submitt .d in response to Directive of Cleanup and
Abatement Order No 85-91 and was continuation of previous report submitted by
Paco Terminals Inc to the Regional Board in September 195 The March 1986
Westec Report presented an evaluation of the cost and feasibility of three
alternative cleanup options provided additional information on the vertical and
horizontal distribution of copper contaminated sedimenl3 and presented an
evaluation of the effects of the copper contaminated sediments on the marine
habitat beneficial use the beneficial use potentially most affected by the copper
ore discharge of San Diego Bay
In August 198$ and January 1986 Westec Services Inc conducted sediment sampling
in San Diego Bay to establish the vertical and horizontal distribution of the
copper ore in the bay sediments The study area extended approximately nautical
mile north and south and 0.5 nautical miles west of Paco Terminals Inc. The
vertical profile of copper ore in the bay sediments was obtained by collecting
core samples at different sites in the study area The vertical core sediment
samples were col1eced to depths up to the maximum core penetration depth The
maximum vertical core sample depths ranged from 12 inches to 52 inches The
horizontal distribution of copper ore in the bay sediments was determined based on
34 Station Sites sampled in August 1985 and 77 stations sampled in January 1986
CUT 003387

Addendum No to-2-
Order No 5-9I
One vertic3l core sample collected at Station C- 16 immediately adjacent to the
Paco Terminals Inc pier face contained copper concentration of 12.500
milligrams per kilogram mg/kg at the top portion and 4780 mg/kg in the bottom
portion at depth of 40 inches Copper concentrations determined at the
remaining sample sites located 240 480 720 1500 and 3000 feet from the pier
face ranged from 3.0 to 9.0 mg/kg- With the exception of the vertical core sample
collected from Station G-16 the vertical core sample values showed that the
copper contamination in the affected bay sediments decreased markedly with depth
and thus was primarily surface phenomena
The surflcial sediment samples collected to determine the surficial areal extent
of the copper ore contamination revealed that copper concentrations at stations
15 16 22 and 23 along the Paco Terminals Inc pier face ranged from 2300 mg/kg
to 28.600 mg/kg surface sediment sample collected at Station adjacent to
the mouth of storm drain tributary to Paco Terminals Inc had copper
concentration of 9300 mg/kg Copper concentrations in sediment samples collected
along the Paco Terminals Inc pier face and adjacent to the storm drain pipe were
markedly higher than elsewhere in the study area Sample stations located from
250 to 750 feet from the pier face Stations 10 II 12 17 18 19 24 and 26
had copper concentrations ranging from 47 mg/kg to 372 mg/kg Sample stations
located 1500 to 3000 feet from the pier face Station-s 13 14 20 21 27 and 28
had copper concentratiOns ranging from 29 mg/kg to 45 mg/kg Sediment sample
stations located approximately 0.5 miles to the north and south of Paco Terminals
Inc had copper concentrations ranging from 118 mg/kg to 141 mg/kg and 209 mg/kg
to 325 mg/kg
Directive 1a of Cleanup and Abatement Order No 85-91 required Paco Terminals
Inc to examine the cost and feasibility of removal and/or treatment of the copper
contaminated sediment to attain sediment copper concentratiOnS essentially
equivalent to the copper concentrations occurring prior to commencement of
operations by Paco Terminals Inc. In April 1979 Regional Board staff collected
sediment samples adjacent to 24th Street Marine Terminals prior to the occupation
of the site by Paco Terminals Inc The site was occupied by Paco Terminals Inc
in early 1980 The six sediment samples collected by Regional Board staff at
that time had copper concentrations ranging from 91.7 mg/kg to 177.9 mg/kg The
average copper concentration of the six sediment samples was 110 mg/kg
Directive 1a of Cleanup and Abatement Order No 85-91 stated that any other data
obtained by Paco Terminals Inc to describe the copper concentrations occurring in
the sediments prior to 1980 would be considered if sufficient documentation were
provided The March 1986 Westec Report stated that baseline copper
concentrations were as high as 398 mg/kg in the vicinity of 24th Street Marine
Terminal prior to the occupation of the site by Paco Terminals Inc. This
conclusion was based on bioassay studies conducted on bay sediments at the nearby
32nd Street Naval Station Piers through by the Naval Oceans Systems Center
in 1979 in support of proposed dredging project Sediment copper
concentrations contained in the Naval Ocean Systems Center studies show that
copper concentrations averaged 385 mg/kg at Navy Piers to 13 in 1979 Navy
Piers 10 to 13 which were included in the Paco Terminals Inc study area had
sediment copperconcentratiOfls ranging from 27 mg/kg to 397.8 mg/kg In 1982
Lockheed Ocean Science Laboratories conducted bioassay of sediments midway
CUT 003388

Addendum No to-3.
Order No 5-9l
between the 24th Street Marine Terminal and Navy Pier 13 in support of proposed
dredging project The average sediment copper conCentratiOn determined at this
location in the Lockheed Ocean Science Laboratories studies was 290 mg/kg
The sediment copper concentratiOn of 397.8 mg/kg referenced itt Finding No
occurred on the south side of Navy Pier 10 near the shoreline approximately 4000
feet north of Paco Terminal Inc. Navy Pier 13 is located approximately 1200
feet north of Paco Terminals Inc. The copper concentrations for Navy Pier 13
contained in the 1979 Naval Ocean Systems Center study referenced in Finding
ranged from 27 mg/kg to 161 mg/kg with an average copper concentration of 116
mg/kg The Regional Board does not believe that the 1979 Naval Ocean Systems
Center and the 1982 Lockheed Ocean Science Laboratories data referenced in Finding
conclusivelY demonstrate that the level of copper concentrations existing at
24th Street Marine Terminal in 1979 prior to the occupatiOn of the site by Paco
Terminals Inc could be characterized by copper concentration of 385 mg/kg The
Naval Ocean Systems Center data cited in the March 1986 Westec report indicates
that the average copper concentration in sediments adjacent to Navy Pier 13
located approximately 1200 feet north of the 24th Street Marine Terminal averaged
116 mg/kg in 1979 prior to the occupation of the 24th Street Marine Terminal
site by Paco Terminals Inc. The Lockheed Ocean Systems Center study sediment
data collected in 1982 after the occupation of the 24th Street Marine Terminal
site by Paco Terminals Inc at an area approximatelY 600 feet north of storm
drain receiving storm runoff from Paco Terminals Inc indicates that sediment
copper concentrations in that area increased to 290 mg/kg The increase of copper
in the bay sediment in that area may have been the result of the discharge of
storm runoff containing elevated concentratiO of copper to the storm drain
during storm events The Regional Board believes that the Regional Board staff
data collected in 1979 in the bay sediments adjacent to the 24th Street Marine
Terminal and referenced in Finding is the best available data to establish
baseline copper concentrations existing at that point prior to the occupation of
the site by Paco Terminals Inc. Accordingly the Regional Board flnth that the
baseline coppe concentration existing in sediments adjacent to the 24th Street
Marine Terminal prior to the commencement of operations at the site by Paco
Terminals Inc was 110 mg/kg
Directive 1b of Cleanup and Abatement Order No 85-91 directed Paco Terminals
Inc to examine the cost and feasibility of removing the copper ore contaminated
sediment to attain six-month median copper concentration of ug/1
daily maximum copper concentration of 20 ug/t and an instantaneous maximum
copper concentration of 50 ugJl in San Diego Bay waters This copper water quality
objective was obtained from the Water Quality Control Plan Ocean Waters of
CalIfornia 1983 hereinafterreferred to as the Ocean Plan adopted by the State
Water Resources Control Board on November 17 1983 The Ocean Plan is applicible
in its entirety to point source dischargesof waste to ocean waters The plan is
not applicable to waste discharges to enclosed bays such as San Diego Bay The
Water Quality Control Policy for the Enclosed Bays sod Estuaries of CalIfornia
1914 hereinafter referred to as the Bays and Estuaries Policy adopted by the
State Water Resources Control Board on May 16 1974 contains water q.uality
standards applicable to waste discharges to enclosed bays and estuaries such as
San Diego Bay The Bays and Estuaries Policy requires that discharges of
municipal wastewaters and industrial process waters to enclosed bays and estuaries
CUT 003389

Addendum No to-4-
Order No 85-91
be phased out at the earliest practicable date The Bays and Estuaries policy
does not Contain numerical water Quality standards for waste discharges tO bays
and estuaries The beneficial uses of San Diego Bay are similar if not identical
to those of the ocean San Diego Bay waters are in hydrologic continuity to
waters of the open oceart however the bay waters are generally subject to less
dilution than ocean waters Thus the water quality standard to protect the
beneficial uses of San Diego Bay waters should be at least as stringent as the
standards ifl the Ocean Plan which provide for the protection of open ocean
waters Accordingly the Regional Board believes that in the absence of numerical
water quality standards specifically applicable to San Diego Bay any cleanup
level selected by the Board should not cause the Ocean Plan water quality standard
for copper to be exceeded in bay waters in order to provide for the protection of
the beneficial uses of San Diego Bay
10 The March 1986 Westec Report contained an evaluation of the extent to whkh the
copper ore in the bay sediment may be migrating from the sediments into the bay
water column Sample station 43 which had sediment copper concentration of
19800 mg/kg was selected as the sampling point for the evaluation Westec
Services Inc felt that this station represented the worst case situation in that
this station had the highest sediment copper concentration in the study area based
on the results of sampling conducted by Westec Services Inc on January 29 1986
Westec Services believed that if copper concentrations in the water column fell
below the copper water quality objective referenced in Finding it was
reasonable to a.ssume that copper coOcentrations in the water column overlying
sediments with copper concentratiOn.S lower than Station 43 would also not exceed
the copper water quality objectivereferenced in Finding WesteC Services Inc
also believed that the worst case siruation would occur at high tide in San
Diego Bay when copper-laden water from other possible discharge sources located
between the bay entrance and Paco Terminals Inc would enter the back bay and
influence bay water samples collected adjacent to Paco Terminals Inc Each water
column sample collected was filtered through 0.45 micron filter to remove the
particulate matter Westec Services Inc analyzed the ample which passed through
the filter to obtain the total dissolved copper Concentr3tiOO Westec Srvice3
Inc also analyzed the particulate matter retained on the 0.45 micron filter to
obtain the total particulate copper concentratiOft
11 The average concentration of total dissolved copper in the water at Station 43
ranged from ugh meter from the bay bottom under low tide conditions to
ugh two meters from the bay bottom under high tide conditions Westec Services
the maintained that these totaL dissolved copper concentratiOns were less than
the copper water quality objectivereferenced in Finding The average total
particulate copper concentration in the water at Station 43 ranged from ug/l
meters from the bay bottom under low tide conditions to 1$ ugh two meters from
the bay bottom under high tide conditions Wesiec Services Inc maintained that
the total particulate copper concentration was less than the 50 ugh instantaneous
maximum water quality objective referenced in Finding Compliance with the
copper water quality objective referenced in Finding is only determined through
analyses of water samples for total recoverable copper as defined in Title 40
Code of Federal Regulations Part 136 40 CFR 136 Total recoverable copper is
defined as the concentration of copper determined on an unfiltered sample after
vigorous digestion or the sum of the copper condentrations in both the filtrable
CUT 003390

Addendum 4o to-5-
Order l4o 5-91
nd nonfilterable sample fractions Accordingly it is incorrect to measure
compliance with the copper water quality objective referenced in Finding by
comparing the objective with only the copper concentration found in the filter-able
sample and excluding the copper concentration found in the nonfilter-able sample or
vice-verSa Compliance with the copper water quality objective cart only be fully
determined through comparison with the total recoverable copper concentration of
the Station 43 sample results this v1ue is obtained by summing the copper
concentration found in the filterable and nonfilterable sample fr-actions The
average total recoverable copper concentratiOn-S for Station 43 determined by the
Regional Board by summing the filterable and nonfilterable copper concentration-s
reported by Westec Services Inc. ranged from 10 ug/l meters from the bay
bottom under low tide conditions to 21 ugh two meters from the bay bottom at
high tide conditions The average total recoverable copper concentrations did
not exceed the instantaneous maximum copper water quality objective of 50 ugh
which applies to grab sample determinations However the average total
recoverable copper concentration did exceed the six month median copper water
quality objective of ugh under both high tide and low tide conditions
Cornpliance with the six month median objective is rriea.sured by calculating the
median of daily values during any 180 day period While one day sample event is
insufficient to determine compliance with six month median copper water quality
objective it is significant to note that the ug/ six month median objective
was exceeded under both high and low tideconditiOn5 Additional sample values
would be required to fully confirm that th copper ore contaminated sediment is
causing the ugJl six month meflan objective to be exceeded in the water column
12 The March 1986 Westec Report contained data on the copper concentrations in the
interstitial water lying in the bay sediment immediately adjacent to the sediment
grains The sampling plan was designed tO evaluate the worst case conditions by
conducting the sampling at Station 43 which had the highest sediment copper
concentration of the Januzry 1986 sediment samples Four replicate samples were
collected by Westec Services Inc by inserting syringes intO the bay sediment and
withdrawing water sample The samples were filtered through 0.45 micron
filter to remove particulates thus sample analysis only determined the total
dissolved copper concentration in the interstitial water The total dissolved
copper concentration in the interstitial water ranged from 80 ugh to 480 ugh
with an average concentration of 214 ug/L
13 The Regional Board compared the interstitial water concentrations referenced in
Finding 12 with the Ocean Plan copper water quality objective referenced in
Fidinj Under this approach it was assumed that the interstitial water was the
primary source of contaminants to benthic biota It was also assumed that the
exceedance of the six month median copper Water quality objective of ugh in the
interstitial water could adversely affect benthic biota and thus also adversely
affect the marine habitat beneficial use of San Diego Bay Based on the
interstitial water copper concentrations discussed in Finding 12 the Regional
Board believed that the existing sediment copper concentration appeared to be
causing the interstitial water concentrations to greatly exceed the ugh copper
water quality objective and threatening tO adversely affect benthic biota in
the copper ore contamination area By letter dated July 31 1986 the Regional
Board directed Paco Terminals Inc to collect additional interstitial water
samples to determine the areal extent of elevated copper concentrations in the
CUT 003391

Addendum No to-6-
Order No 85-91
interstitial waters Paco Terminals Inc was also directed to gather sufficient
data to define the relationship between sediment copper concentration and
interstitaI water copper concentration
14 By letter dated September II 198 Paco Terminals Inc objected to the Regional
Boards appiication of the Ocean Plan copper whet quality objective referenced in
Finding to interstitial water Paco Terminals Inc maintained that interstitial
waters from most sediments from ernbayments typically exceed Ocean Plan limits for
many chemical variables such as sulfides ammonia and biological oxygen demand
because the interstitial water is relatively restricted compared to the overlying
water column with reduced opportunity for dilution The Regional Board believes
that concentrations of some chemical constituents would be expected to be
naturally greater in interstitial water than in the overlying water column
However Paco Terminals Inc has not demonstrated that the interstitial water
copper concentrations in the affected area are within the range of concentrations
which could b-c expected to naturally occur
15 On March 24 1987 Paco Terminals Inc submitted report prepared by Westec
Services Inc entitled Evaluation or Copper in laterstitial Water front Sediments
at Paco Terminals San Diego lay Phase I1hereinafter referred to as the March
1987 Westec Report The stated objectivesof this report were to define the
relationship between copper concentrations in the sediment and interstitial water
and if such correlation does exist use the correlation to detirmine the
horizontal distribution of copper in the interstitial water adjacent to Paco
Terminals Inc. Westec Services Inc collected 36 core samples on February
1987 at distances upto 170 feet from the Paco Terminals Inc pier face Westec
Services Inc reported that due to probable interferences from salts in the sea
water interstitial water samples had to be diluted with deionized water to reduce
the interference The dilution process reduced the level of detection for copper
from ugJl to 20 ug/L Thus the interstitial water copper concenuanon could
not be compared with the Ocean Plan ugh copper water quality objective due to
the reduction in the level of detection to 20 ugh The interstitial water
concentrations ranged from 20 ugh to 300 ugh one of the 36 interstitial water
samples was not analyzed due to an insufficient sample volume The sediment
copper concentration ranged from 21 ug/l to 21700 ujfl
16 The March 1987 Westec Report contained the results of linear regression
analysis of the data referenced in Finding 15 The purpose of the evaiuation was
to determine if there was statistically significant relationship between copper
concentrations in the interstitial water and the sediment Two correlation
relationships between the copper concentration in the interstitial waxer and
sediment were developed One of the correlation relationships employed all 35
sample results The second correlation relationship employed only 33 sample
results two sample results were removed from consideration because of possible
sample contamination Both corTelation relationships assumed that 16 sample
results with reported interstitial water copper concentrations of 20 ugh were
actually 20 ug/l worst case assumptiolL The sediment copper concentrations at
CUT 003392

.7-
Addendum No to
Order No. 5-91
which the 50 ugh instantaneous maximum Ocean Plan Copper water quality objectile
is attained in the interstitial water as predicted by the two correlation
relationships are presented below
LinearNumber Sediment
Regression Correlationof Copper
nalvsii yjj.i mpk1 2ncefltr1tiOfl
0.369 35 -3.950 mg/kg
0.593 33 7050 mg/kg
Westec Services Inc believed that AnalysiswhiCh determined that removing the
copper contaminated sediment to copper concentratiOn of 7050 mg/kg would result
in interstitial water concentr3tiO of 50 ugh was the best estimate due to the
highercorrelation value
17 The March 197 Westec Report did not establish clearly defined relationship
between the sediment copper concentr2tiOn and either the Ocean Plan copper water
quality objective six-month median limitatiOfl of ugh or the daily maximum
limitation of 20 ugh However 35 shown in Finding 16 the available data does
indicate that relatiol2.shiP exists between the Ocean Plan copper water quality
objective instantaneous maximum limitation of .50 ugh and the sediment copper
concentration Based on the regression analysisreferenced in Finding 16 an
interstitial water copper concentration of 50 ugh is associated with sediment
copper concentration of 7050 mg/kg The Regional Board believes that Jthough
the available data do not provide clearly defined relationship between the six-
month median copper concefltratiOfl limit of ugh and particular sediment copper
concentratiOn the data indicates that the sediment copper concentration
corresponding to the Ocean Plan six month median concentration limit would likely
be no greaterthan 1000 mg/kg
IS The March. 196 Westec Report examined the effects of the copper contaminated
sediment on the bcnthic biota in the vicinity of Paco Terminals Inc The report
characterized the bertthic community as impoverished with low numbers of species
and individuals and low species diversity The reportfound that 93.5 percent
of
the area influenced by the copper contaminated sediment was already influenced by
shipyrd operations and other harbor activities prior to the commencement of
operations at Paco Terminals Inc The impoverished condition of the benthic
community was attributed in partto disturbances from harbor activities such as
ship movement with the attendant propeller wash and scour and maintenance
dredging The impoverished condition of the benthic community was cited as
historic condition iii that it had been noted in other studies in the general
vicinity of 24th Street Marine Terminal jfl 1974 and 1977- prior to the
commencement of operations by Paco Terminals Inc No statistically significant
relationshiP between sediment copper concentration and total number of species
total number of individuals and species diversity was found
19 The March 1986 Westec Report does not conclusively demonstrate that the copper
ore does not have the potential to adversely affect benthic communities As
previouslystated in Finding the vitality of the benthiC community was
CUT 003393

Addendum No to-8-
Order No 85-9
depressed prior to the deposition of copper ore in the sediment It is possible
thaI direct correlation between sediment with high copper concentratiOn and
benthic community indices might be found in areas which have more diverse benthic
communities The Regional Board also believes that some of the environmental
stresses which were responsible for the depressed condition of the benthic
community prior to the commencement of operations by Paco Terminals Inc may be
reduced in the future Improved controls over anti-fouling boat hull paints and
painting techniques and other changes in vessel activities could provide
conditions conducive to an increase in the diversity and numbers of marine
organisms in the vicinity of Paco Terminals Inc However if copper ore i.s allowed
to remain on the floor of San Diego Bay in the present high concentrations the
potential vitality of future biological communities might be limited long after
other environmental stresses have been reduced or eliminated
20 By let-icr dated September II 1987 Paco Terminals Inc submitted information
pertaining to the potential for migration of the copper ore contaminated sediment
to other portions of San Diego Bay It was reported that the probability for
5igniflcant migration of the copper contaminated sediment is low due to the
following factors
The copper ore is very dense and sinks rapidly Any copper ore re-suspended
by tidal action or ship propeller wa.sh wQuld probably not travel very far
before sinking to the bay bottom
Tidal currents adjacent to 24th Street Marine Terminal are generally low
The number of large vessels capable of re-su.spending the copper ore
contaminated sediment while passing over the area is small due to its
Iocatrnn near the terminus of the main San Diego Bay navigation channet and
review of 10 sets of quarterly NPDES permit monitoring reports covering the
period 1985 1987 and other data indicates that the copper ore contamina ed
sediment is not migrating
The Regional Board believes that migration of the copper ore contaminated sediment
can be expected to remain quite slow unless increases tidal currents and/or
vessel activities occur However any dredging activities in the area near Paco
Terminals could contribute 5gnificantly to the migration of the copper ore
within the bay
21 The March 1986 Westec Report evaluated State Mussel Watch data contained in the
California State Mussel Watch Report 1981-1983 Data provided by the State
Mussel Watch Program shows that mussels held at Station 882 located adjacent to
Paco Terminals Inc had some of the highest copper concentrations found in the
mussel watch program The mussel watch sample results dry weight showed an
average copper concentration of 58 ug/g in January 1982 60.3 ug/g in December
1982 78.7 ug/g in January 1984 and $8.1 ug/g in January 1985 All mussel
watch sampling data at Station 882 exceeded both the 85 and 95 percentElevated
CUT 003394

Addendum No to -9-
Order No 5-91
Data Level EDL1 for copper of 12 ug/g dry weight and 24.4 ug/g dry weight
respectively thus the mussel copper concentrations represent very elevated
concentrations Westec Services Inc citing data from the 1981-83 Mussel Watch
conclude that 38.4 percent reduction in copper concentration found between
depurated2 and undepurated mussel samples collected from Station 882 is due to the
elimination of inorganic particulate matter in the mussel digestive tract With
the particulate copper removed the remaining results provide more accurate
reflection of ictual copper concentrations in the mussel tissue Wenec Services
Inc maintains that much of the copper found in the tissues of the mussels held at
Station 882 is from discharges from the nearby shipyard operations
22 The Regional Board believes that because the sediment near Paco Terminals Inc
contains high proportion of copper ore any sediment which is found within the
digestive tract of mussels at Station 882 might also contain high proportion of
copper ore As noted in Finding 21 the effect of this ingested sediment on the
analytical results for Station 882 was documented in the 1911-13 Mussel Watch
During that program ten mussel watch stations including Station $82 were
selected statewide and were analyzed in both depurated and non-depurated
condition Depuration was found to reduce copper COflCeOtI2tiOflS at Station 82 by
38.4% while reductions found at the other nine stations ranged between 7.5 and
25.1% and averaged only 13.2% Subsequent Mussel Watch samples have not been
depurated
23 As previously stated in Finding 21 Westec Services Inc believes that the high
State Mussel Watch copper concentrations found near Paco Terminal Inc may be due
in large pan to the proximity of the terminal to the 32nd Street Naval Station
and other commercial ship repair facilities These vessel repair areas start at
Pier 13 of the 32nd Street Naval Station approximately 1000 feet north of the
24th Street Marine Terminal and extend approximately three and one-half miles
north to the Coronado Bridge Five Mussel Watch stations have been located In
that area during the Mussel Watch Program Of these five stations Station Nos
886 and $87 are near the NASSCC ship repair facility approximately miles north
of Paco Terminals Station No 815 is located at Buoy 30 on the west side of the
navigation channel approximately 1.5 miles north Paco Terminals Station No 882.6
is located at the extension of Sampson Street approximately miles north of Paco
Terminals and Station No 82.4 is located near the end of Pier 13 less than 2000
feet north of Paco Terminals Since Station No 82.4 is located at the extreme
south end of the vessel repair facilities less than 2000 feet from Paco
Terminals ore transfer facility any copper-based anti-fouling paints which
The Elevated Data Level EDL has been developed by the State Mussel Watch Program
to identify locations where levels of toxic substances are significantly higher
than the levels measured statewide The 85 or 95 percent EDL is that
concentration of substance that equals or exceeds $5 or 95 percent of all State
Mussel Watch measurements of the substance in the same mussel type throughout the
State
Depuration is process whereby mussels are placed in aerated or circulating
cean sea water essentially free of trace metals and synthetic organic
compounds as soon after sample collection as possible
CUT 003395
Addendum No to-10-
Order No 85-91
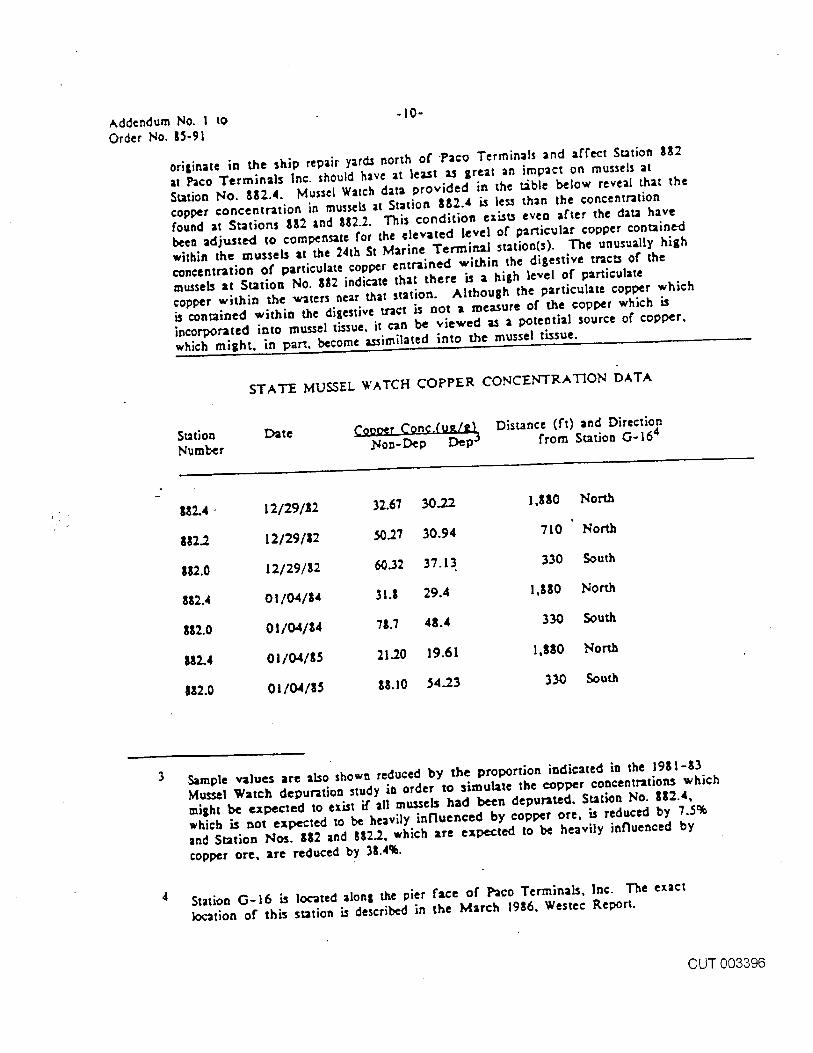
originate in the ship repair yardsnorth of -Paco Terminals and affect Station 82
at Pco Terminals Inc should have at least as great an impact on mussels at
Station No 882.4 Mussel Watch data provided in the table below reveal that the
copper concentration in tnussets at Station 882.4 i.s less than the concentratiOn
found at Stations 882 and 882.2 This conditiOn exists even after the data have
been adjusted to compensate for the elevated level of particular copper contained
within the mussels at the 24th St Marine Teruiinai statiOns The unusually high
concentratiOn of particulate copper entrained within the digestive tracts of the
nussels at Station No 82 indicate that there is high level of particulate
copper within the waters near that station Although the particulate copper which
is contained within the digestive tract is not measure of the copper which is
incorporated intO mussel tissue it can be viewed as potential source of copper
which might in part become assimilated into the mussel tissue
STATE MUSSEL WATCH COPPER CONCENTRAflON DATA
Station Date çQpper Conc.u/ Distance It and Direction
NumberJJon-Dep Dep from Station G-16
882.4 12/29/Z2 32.67 30.22 1880 North
882.2 12/29/2250.27 30.94 710 North
12/29/82 60.32 37.13 330 South
882.4 01/04/84 31.8 29.4 1880 North
812.0 01/04/847$.7 48.4 330 South
$82.4 01/04/8521.20 19.61 1880 North
882.0 01/04/85 $8.10 54.23 330 South
Sample values are also shown reduced by the proportiOn indicated in the 1981-83
Mussel Watch depuration studyorder to simulate the copper concentrations which
might be expected to exist if all mussels had been depurated Station No 882.4
which is not expected to be heavily influenced by copper ore is reduced by 7.5%
and Station Nos 882 and 882.2 which are expected to be heavily influenced by
copper ore are reduced by 38.4%
Station 016 is located along the pier face of Paco Terminals Inc The exact
location of this station is described Ifl the March 1986 Westec Report
CUT 003396

Addendum No to-Il-
Order No 35-9%
24 The March 1986 Westec Report examined the cost and feasibility of five different
cleanup options for removal of the copper contaminated sediment to sediment copper
concentrations of 110 mg/kg 350 mg/kg and 1000 mg/kg The five cleanup option-s
in order of increasing cost were dredging of sediment with ocean disposal of
the dredged materiaL dredging of sediment with disposal at Otay Sanitary
Landfill dredging of sediment with truck shipment to mine for reclamation of
copper ore dredging of sediment followed by rail shipment to mine for
reclamation of copper ore and dredging of sediment with disposal at Casnialia
landfilL The projected costs to achieve the three alternative cleanup levels is
summarized as follows
Sediment
Copper Dredge aeanup
ConcentratiQflVolumi Cost Ranae
110 mg/kg 575186 yds3 $3709094 $176547735
350 mg/kg 246481 yd.s3 Sl661358 $75727434
1000 mg/kg 57402 yd.s3 $472922 $17722649
The method to be employed by Paco Terminals Inc for disposal of the dredged
copper ore sediment is not known at this time Westec Services Inc reported that
from an operational logistic and cost viewpoint ocean disposal of the dredged
material was the most feasible alternative at this time However significant
problems -could arise in obtaining the necessary dredge spoil ocean disposal permit
from the Army Corps of Engineers Land disposal of the dredged material is also
possibility however significant problems could arise in transporting large
amounts of dredge material by truck and in pining approval to dispose of the
material in 1.aridfilL Two of the dredge spoil disposal options involved
returning the copper ore contaminated sediment to the mine where it originated for
reclamation of the copper ore These disposal options would be contingent on the
quality of the copper ore and in potential for reclamation using the leaching
process employed at the mine
25 The preponderance of evidence in this matter demonstrates that operations at Paco
Terminals Inc resulted in the discharge of copper ore so San Diego Bay in direct
violation of waste discharge requirements prescribed by the Regional Board and
contained in Order Not 79-72 and 84-50 Therefore under the terms and
conditions of Cajifornia Water Code Section 13304 the Regional Board is not
required to demonstrate that the copper ore contaminated sediment is causing or
is threatening to cause condition of pollution in San Diego Bay in order to
require its removal from the waterS of the state However the Regional Board
believes that the copper ore contaminated sediment is threatening to adversely
affect the marine habitat beneficial use of San Diego Bay The Regional Boards
review of the available information indicates that the copper ore contaminated
sediment significantlycontributes to the very elevated copper concefltfltiOfls
found in mussels at Mussel Watch Station 8$2 The copper ore contaminated
CUT 003397

Addendum No to -12-
Order No 5-91
sediment also appears to have caused the exceedance of Ocean Ptan copper water
quality objectives in both the water column and interstitial water of the affected
portion of San Diego Bay
26 The Regional Board in determining the appropriate level of cleanup iii this
matter is guided by the State Water Resources Control Boardi Resolution 68-26
Stateeat of Policy with Respect to Malotainlig High Quality of Waters in
California This policy provides that existing water quality be maintained when
it is reasonable to do so This policy further provides that any change in water
quality be consistent with maximum public benefit and not unreasonably affect
beneficial uses The Regional Board has determined that discharges of copper ore
from Paco Terminals Inc have resulted in change in water quality in the
affected portion of San Diego Bay the change in water quality threatens to
adversely affect the marine habitat beneficial use of San Diego Bay The Regional
Board based on the available information is directing Paco Terminals Inc to
remove the copper ore contaminated sediment from the affected portion of San Diego
Bay to attain cleanup level sediment copper concentration of less than 1000
mg/kg This cleanup level represent.s less than 200 percent removal of the copper
ore contaminated sediment The Regional Board lua.s determined that this cleanup
level is reasonable consistent with maximum public benefit and will not
unreasonably affect beneficial uses
27 This enforcement action is exempt from the provision.t of the California
Environmental Quality Act Public Resources Code Section 21000 ci seq in
iccordance with Section 15321 Chapter Tide 14 California Administrative
Code
It is hereby ordered that pursuant to California Water Code Section 13304
Paco Terminals Incorporated shall reduce the sediment copper concentration in
the affected portion of Diego Bay identified in the March 1986 Westec Report
to sediment copper concentration l.ss than 1000 mg/kg by January 1989
Paco Terminals Inc thall submit technical report to the Regional Board no later
than February 1988 containing discussion of the proposed procedures to
cleanup the copper contaminated sediment The report shall contain detailed rime
schedule for completion of all activities associated with the cleanup of the
copper ore contaminated sedimenL The report shall also include the sampling
procedures that will be used to determine the completion of the cleanup
Paco Terminals Inc shall submit cleanup progress reports to the Regional Board on
quarterly basis until in the opinion of the Regional Board Executive Officer
the cleanup of the copper contaminated sediment has been completed The progress
reports shall include information on the percent completion of the cleanup
project the sranxs of requests for permits and their expected approval dates
any anticipated deviation from the time schedule submitted in accordance with
CUT 003398

Addendum No to -IOrder No 5-91
Directive of this Addendum and dany other relevant information The progress
reports shall be submitted in accordance with the following reporting schedule
Reporting Period Report Due
January February March ApriI 30
April May June July 30
July August September October 30
October November December January 30
Paco Terminals Inc shall no later than December 198 submit post-cleanup
sampling plan to verify the attainment of the prescribed cleanup standards in the
area of sediment copper contamination identified in the March 1986 Westec Report
Upon approval of the sampling plan by the Regional Board Executive -Officer Paco
Terminals Inc shall collect and analyze the samples prescribed in the sampling
plan The post-cleanup sample results shall be submitted to the Regional Board no
later than April 1989
Directive No of Cleanup and Abatement Order No 5-91 is hereby rescinded
PROVISIONS
1. Paco Terminals Inc shall submit to the Regional Board on or before each
completion date report of compliance or noncompliance wIth the specific task
It noncompliance is being reported the reasons for such noncompliance and an
alternative compliance schedule shall be stated The discharger shall notify the
Regional Board by letter upon return to compliance with the time schedule
OrderedbyL
Ladin Delaney
Executive Officer
Dated November 13 197
DTBGBPLKM
CUT 003399

1233

CALORNIA REGIONAL WAR QUALiTY CONTROL BOARDSAN DIEGO REGION
STAFF REPORTFOR
CLEANTJP AND ABATEMENT ORDER NO 98-08
ISSD TO
THE AEROSTRUCTTJRES GROUPOF BF GOODRICH AEROSPACE
formerly ROIIR INCAND
THE BF GOODRICH COMIPAINY
Written By
Karen Travis Zachary
Water Resource Control Engineer
Site Mitigation and Cleanup Unit
March 26 1998
EXHIBIT NO_________
4kLq
CUT 006668

ExECTJTrVE S1JMMARY
Cleanup and Abatement Order CAO No 98-08 was issued to require the Aerostructures Group of
BF Goodrich Aerospace formerlycalled Rohr Inc Rohr and Rohrs owner The BF Goodrich
Company of Ohio to address the effects of contaminated discharges to San Diego Bay and sitewide
ground water contamination San Diego Bay waters flow in and out the storm waxer conveyance
system beneath Rohrs operations daily Rohr has affirmed that approximately 113 of the storm
water conveyance system has been cleaned to date Areas of known ground water contamination are
in close proximity to these storm drains and other potential preferential pathways and may explain
the elevated levels of mem.als reported in storm water/tidal water at Rohrs propertyline While some
areas of petroleum chlorinated solvent and metals contamination have been identified arid
characterized over many years the sources and sitewide extent of all known problems have not been
sound The SDRWQCB has asked Rohr in coordination with the County of San Diego for
improved assessment efforts including performing sitewide assessment and Rohr has not
responded voluntarily
In addition to the direct and continuing threat to the beneficial uses of San Diego Bay there are
additional reasons why GAO No 98-08 has been issued
Longstanding concerns about historic discharges or infiltration of contamination into the
aged storm water conveyance system serving the site
Sensitive riparian areas including National Wildlife Refuge lie on three sides of their
facility
The City of Chula Vista and Port of San Diego has active redevelopment plans for the
Chu.la Vista waterfront area
Rohr has already publicly disclosed to shareholders that the SDRWQCB was
conducting an investigation and
Potential for site management instability due to recent merger with BF Goodrich
Because protection of the beneficial uses of San Diego Bay and riparian areas are critical the primary
focus of this limited order is to assess both the storm water quality and the integrity of the storm
water conveyance system Presently in addition to requiting improved storm water testing already
required by the General Industrial Storm Water Permit and investigation of the storm water
conveyance system itself CAO No 98-08 requires submissions of environmental due diligence
information compilation of isolated monitoring data and development of sitewide assessment
workplan to prepare for holistically addressing the ground water contamination Rohr already has an
extensive amount of environmental due diligence data an onsite environmental staff and
sophisticated maps to employ in their efforts to comply with the CAO Once the required
submissions are made and the prospective scope of environmental problems becomes known future
requirements may or may not be issued
CUT 006669

Cleanup and Abatement Order No 98-08 Page
.erostructures Group of BF Goodrich Aerospace formerly Rohr Inc Vlarch 26 1998
and The BF Goodrich Company
BACKGROtJNI ANTI AGENCIES CURRENTLY 1VOLVED
Rohr J.nc.Rohr was founded in Chula Vista as Rohr Aircraft Corporation in 1940 Still
headquartered in Chula Vista Rohr has continuously engineered and manufactured structural
assemblies for aircraft for nearly 60 years In fiscal 1996 Rohr reported total revenue of 77 million
and was public corooration listed on the New York Stock Exchange Rohr has eight operations
acilities across the United States that variously perform engineering design tooling manu.faczuring
assembly and delivery of aircraft engine components Rohr also operates internationally and manages
an overhaul and repair presence spanning three continents
Rohrs Chula Vista operational activities include metal parts fabrication degreasing cleaning
anodi.thig plating chemical milling conversion coating and painting as well as leading edge
manufacturing technologies nc and lead foundry and sludge treatment/recycling facility also
operate onsite In September 1997 Rohr announced pending stock acquisition by BFGoodrieli
Company of Richfield Ohio In December 1997 BFGoodrich finalized the transaction and
incorporated Rohr into the corporation as the Aerostructures Group of the Aerospace Division or
BFGoodrich Since the merger Rohr has continued operations under the name Aerosiructures
Group ofBFGoodrich Aerospace hereinafter Rohr
Rohr has operated continuously at this Chula Vista waterfront iocatioa In the early 950s the Chula
Vista shoreline was expanded by land created from Bay fill By the rnid-1960s Rohr had expandeil
westward onto the new tidelands Subsequent fill activities over the years has resulted in thepresent
shoreline configuration Rohr has historically owned or leased up to 176 contiguous acres in Chuia
Vista By 1969 Rohr had constructed 47 buildings Today Rohr controls approximately 160 acres
although not all the existing buildings are in use
Rohr is currently regulated by the County Department of Environmental Healths Industrial
Compliance Program Department of Toxic Substances Control DTSC the Air Pollution Control
District and the SDRWQCB Rohr is currently under t.he Industrial Activities Storm Water General
Permit NTPDESNo CAS00000J and has been since July 1993 Since 1988 Rohrs known ground
water contamination cleanup activities have been overseen by the County of San Diegos Local
Oversight Program until July 1997 when Ro hr transferred several cases to the SDRWQCB
Presently the Site Mitigation and Cleanup Unit has taken responsibility for non-tank and chiorinaten
solvent issues while the County Site Assessment and Mitigation Unit continues toward resolution of
tank-related petroleum and one hexavalent chrome contaminant issUes
In addition to experience with local cleanup oversight Rohr has been directly involved in number of
larger environmental cleanups In September 1997 Rohr SEC 10-K disclosed that Rohr has been
involved iii the Stringfellow and Casmalia CERCLA Superfund cleanups and with the Rio Bravo
Deep Injection Well Disposal Site State Superfund cleanup Rohr reported that the resolution of
these matters will not have material adverse effect on the finandal position or results of
operations In the 10-K Rohr also disclosed that the DTSC was demanding $30000 in npaid cost
recovery that was still outstanding and that this was after DTSC had accepted reduced moneta
CUT 006670

Cleanup and Aha.ement Order No 98..08 Page
Aerostructur Group of BF Goodrich Aerospace formerly Rohr Inc March 26 l99
and The BF Goodrich Company
claim settlement on the site year earlidr Additional disclosures regarding Rohr Chula Vista
headquarters facility describes that investigations such as spills and underground tank closures are
typically conducted and named the SDRWCB and the County of San Diego as two agencies that were
already conducting certain investigations Rohr reports that they intend to cooperate filly with the
various regulatory agencies
SiTE DESCRIPTION
The site subject to this order is approximately bounded by Street to the North Street to the
South Bay Boulevard to the East and Sandpiper Way to the West Approximately half of the Site is
publicly owned primarily by the San Diego Unified Port District The balance is privately owned
primarily by Rohr narrow strip of land owned by San Diego Gas and Electric and San Diego and
Arizona Eastern railway bisects the Site just South ofBay Boulevard tidal marsh protected as
National Wildlife Refige lies immediately west of Rohrs corporate office buildings
The sire elevation is between approximately -8 feet above mean sea level throughout the site The
ground water is shallow to below surface and the ground water flow gradient is east/southeast
towards San Diego Bay There are currently no public or private water supply wells located at the
site or west of Interstate in the suitounding area Any sustained well production of shallow ground
water at the site would likely result in saltwater intrusion However there are ongoing studies by the
Sweetwater Authority and the County Water Authority just east of Interstate Sin Chula Vista on the
viability of ground water storage and deep water supply production within the San Diego Formation
The San Diego Formation is large geologic formation lying approximately 50 feet beneath the
surface alluvium and is over 800 feet thick The San Diego Formation underlies the site
APPLICABLE WATER QUALITY OBJECTIVES
The Site is located within the La Nacion Hydrologic Subarea liSA 9.12 of the Sweetwater
Hydrologic Unit Water Quality Control Plan for the San Diego Region Basin Plan as amended
which was adopted by the SDRWQCB on September 1994 The designated beneæciai uses for
ground water established by the Basin Plan in liSA 9.12 include
Agricultural Supply AGRIndustrial Service Supply Th1D
Municipal and Domestic Supply MUNBecause of the direct threat to San Diego Bay requirements that address surface water concerns will
be the initial focus of this order Federal and State drinking water standards called Maximum
Contaminant Levels MCLs are used for the protection of municipal beneficial use of ground water
In fact water quality standards for protecting many surface water beneficial uses e.g marine aquatic
life are generally more stringent than drinking water standards applied to ground water
CUT 006671

Cleanup and Abatement Order No 98-08 agc
Aerostructuies Group of BE Goodrich Aerospace fomieriy Roiir vLzrch 998
and The Goodrich Company
The following are desiiated surface water beneficial uses have been established in the Basin Plan for
Sweetwater River HSA 9.12 of the Sweetwater River Watershed
Industrial Service Supply ThTh
Potential Contact Water Recreation RECINon-contact Water Recreation REC2Waj-rn Freshwater Habitat WARMWildlife Habitat WILD
The Recreation and Habitat beneficial uses are the primary focus of protectionin this Order
The following are designated beneficial uses of San Diego Bav
Commercial and Sportfishing COMMContact Water Recreation RECEstuarine Habitat ESTLndustrial Service Supply NDMarine Habitat MARMiation of Aquatic Organisms MIGR
Navigation NAVNon-contact Water Recreation çRCPreservation ofBiolocal Iabitats of Special Significance BIOL
Rare Threatened or Endangered Species RAREShellfish Harvesting SHELLWildlife Habitat WILD
The Commercial Recreation Habitats and Rare Species beneficial uses are the primary focus of
protection in this Order
The following are USEPA VaionaI Ambienz Water Qua/fry Criteria Saftwater Aquatic LJe
Protection standards which may apply to non-storm water discharges as receiving water quality
objectives for San Diego BayMicrograms/Liter uziL
Cons rztuents Din Average l-Bour
Averae
Arsenic
Cadmium
Chromium Hexavalent
Copper
Cyanide
Lead
Mercury inorganic
Nickel
Selenium
Silver
50 1100
40
100
CUT 006672

Cleanup and AbaLement Order No 98-08
Aerostnictures Group of BE Goodrich Aerospace formerly Rchr Inc
and The BF Goodrich Company
Constituents DavAveroge 1-Hour
Average
Zinc 86 95
Page
March 26 1998
The following are select 1997 California Ocean Plan Standards which may apply to non-storm water
discharges as either effluent limits or receiving water quality objectives or both for San Diego Bay
Micro grams/L2ter r/L and Milliv-ams/Liter m/L.
Cons tihients Daily Mhxzmum Ln.rranraneous
Maximum
Total Chlorine Residual .ig/L 60
Cyanide 1ig/L 10
Phenolic Compounds igL 120 300
Chlorinated Phenolics igL 10
Grease and Oil mg/L 75
Settleable Solids mgIL 3.0
Acute Toxicity TUa 2.5
Chronic Toxicity TUcoHnounits 6.Oto9.O
The California Toxics Rule 62 FR 42193 Proposed Section 131.38 Establishment of Numeric
Criteria for Priority Toxic Pollutants for rhe State of Calfornia proposed by US Environmental
Protection Agency as replacement for the rescinded SWRCB Enclosed Bays and Estuaries and
Inland Surface Water Policies may be adopted in the tüture Other water quality standards already
established but not listed here may also apply
Pursuant to SWRCB Resolution No 63-16 the SDRWQCB is required to ensure that Dischargers
are required to clean up and abate the effects of discharges in manner that promotes the attainment
of background water quality or the highest water quality which is reasonable if background levels can
not be restored considering all demands being made and to be made on those waters and the total
values involved beneficial and detrimental economic and social tangible and intangible any
alternative levels less stringent than background shall
be consistent with the maximum benefit to the people of the state
not unreasonably affect the present and anticipated beneficial use of such water and
not result in water quality ess than that prescribed in the Water Quality Control Plans
and Policies adopted by the State and Regional Water Boards
SWRCB regulations governing waste discharges to land contained in the California Code of
Regulations CCR Tide 27 require that cleanup and abatement actions intended to contain waste at
the place of release shall implement the applicable provisions of that chapter to the extent feasible
CUT 006673

Cleanup and Abatement Order No 98-08 Page
Aerostructurea Group of BF Goodrich Aerospace formerly Rohr Inc March 26 1998
and The BF Goodrich Company
CCR Title 27 20090d CCR Title 27 20400 will be considered in establishing cleanup Leveis
and undertaking corrective actions where discharges of waste are subject to CWC $13304
Pursuant to SWRCB Resolution No 92-49 the SDRWQCB may require Rohr to conduct
investigations to determine the nature and horizontal and vertical extent of discharges
progressive sequence The phased sequence is typically comprised of the following steps
preliminary site assessment
soil and water investigation
proposal and selection of cleanup and abatement action to evaluate feasible and
effective cleanup and abatement actions
implementation of cleanup and abatement action and
monitoring of short-and long-term effectiveness of cleanup and abatement
The requirements of this order to date are for the preliminary site asses.sinenl phase Rohr has
relatively large site sigiiif cant amount of isolated data and apparently few environmental due
diligence reports so the SDRWQCB is initially requin.ng that all available records be compiled and
evaluation on sitewide approach One of the requirements in this order is to develop site
assessment workplan for review and approval to initiate the next phase of soil and water
investigation Once the required submittais are reviewed and any immediate mitigation measures
needed are taken then phased invstigation that considers all site issues including cost-
effectiveness environmental impacts and redevelopment priorities will be addressed
VIOLATIONS
Based on the chronology of events and known contaminant concentrations existing in the
environment at the Site Rohr has caused or permitted to be caused condition of pollution in both
surface waters and ground water Specifically Rohr has discharged chlorinated solvents metals and
fuel hydrocarbons to soil and ground water in multiple locations and metals into the storm water
conveyance system serving the site Other wastes associated with metal melting metal casting metal
parts fabrication degreasing cleaning anodizing plating chemical milling conversion coating
painting and sludge treatment/recydlirig activities may have been discharged Discharges of waste
from the storm water conveyance system SWCS whether from within the system or inltrative are
carried to San Diego Bay by daily tidal flux and storm water Discharges of waste from Robr have
caused an exceedance of water quality objectivesin ground water and surface water
EVDENCTE OF VIOLATIONS
1952 San Diego Regional Water Pollution Control Board report entitled Frrent Effectsarid
Limitation.s of Waste Disposal into San Diego Bay described the then Rohr Aircraft Company as
discharging industrial wastes directly into San Diego Bay The report noted the now Rohr had its own
separate storm drain system that discharged into the Bay Wastes listed as being discharged include
CUT 005674

Cleanup and Abatemnit Order No 98-08 Page
Aerosuiictures Group of BF Goodrich Aerospacc formerly Rohr Inc March 26 1998
and The BF Goodrich Company
metal-treating rinse solutions paint oils and solvents Sewage and potentially other wastes from Rohr
were apparently processed by the City of Chula Vista and discharged to the Bay in close prodrnity to
the Site In 1963 the City of Chula Vista joined the then San Diego Metropolitan Wastewater system
and ceased discharging to the Bay After 1963 through today the City of Chula Vista no longer had
any storm drain or other point source drainage system discharging to the Bay It is not known if or
when Rohr stopped discharging processwastes into its separate storm drain system
In May 1974 the State Water Resources Control Board SWRCB adopted Waer Quality Control
Policy for the Enclosed Bays and Estuaries of Californiathat essentially prohibited the discharge of
industrial wastewaters exclusive of clean brine into enclosed bays and estuaries Subsequently Rohr
applied to the SDRWQCB for an NPDES permit to discharge up to 22500 gallons per day of filtered
brine via storm drain to San Diego Bay In 1976 NPDES Order No 76-3 was adopted. The
permit was renewed twiceOrder Nos 81-30 and 85-42 entit1edNaiionalPolluiit Discharge
Elimination System KPDES Order No 85-42 CA0107859 Waste Discharge Requiremenr.s for Rohr
Industries Inc. Pursuant to these Orders from 1976 to 1994 Rohr was required to implement Best
Management Practices for eliminating non-storm water discharges to all storm drains However the
Monitoring Program Requirements were limited to sampling lbr conventional pollutants
In 1989 San Diego Bay storm drÆiu outfall sediment study was conducted by the San Diego State
University Foundation on behalf of the SDRWQCB The sediment sampling was conducted outside
storm drains around San Diego Bay The Foundations reportcommented on the high concentration
an the combination of chromium zinc nickel and copper in one sample taken from natural Bay
channel outside of one of Rohrs storm water outfalls arid recommended that metal fabrication
point source be investigated
Since 1987 the San Diego County Department of Environmental Health Site Assessment and
Mitigation Unit County SAJM has opened nine cases of the reported releases from Rohr Of the
nine cases six involve fuel hydrocarbons discharged via tanks or stimps one involves chromium
releases from below-grade salt bath and two were opened from prior cases because chlorinated
solvents were discovered General practice by the County SAIM is to oversee each release cleanup at
given site as isolated events County SAIM generally oversees smaller sites than Rohrs large area
and Rohrs release cases were located fairly broadly over the site Apparently since 1994 only the
tank cases have been actively overseen and of those only fuel hydrocarbons and the obvious chrome
salt bath constituent releases have been investigated Rohr has consistently declined the County
SAiM and SDRWQCB requests to sample for chlorinated solvents in ground water at fuel release
case sites
In May 1991 the San Diego Countys Hazardous Materials Management Division County v1MDobserved zinc-contaminated wastewater entering storm drain east of Building This problem was
described by the County as recurring and first found in 1987 In June the SDRWQCB joined
the County HMv1D to have Rohr address zinc waste inside the storm drain system Analytical results
CUT 006675

C1up and Abatement Order No 98-08 Page
Aerostructures Group of BF Goodrich Aerorpace formerly Rohr tac March 26 1998
and The BF Goodrich Company
of storm drain sediment samples indicated that Priority Pollutant Toxic Metals were present in over
35 locations within the storm water conveyance system Several samples exceeded the Total
Threshold Limit Concentration which would characterize the sediment as hazardous waste By letter
Rohr acknowledged the storm water conveyance system contamination and proposed remedial
actions inciuding accelerating storm drain cleanout plans removing various pipelines from the system
and investigating both upgradient sources and possible contamination from corning on-site via the
bay and estuary Rohr reported in July 1992 that portion of their storm drains had been pressure
washed and some drain inlets sealed To date no evidence that adequately verifies the deee of
cleanliness has been received by the SDRWQCB Rohr recently concluded that one third of its
known storm drain system has been pressurewashed and that storm drain catchment basin cleanouts
are conducted periodically
Rohr notified the SDRWQCB in July 1991 that it no longer requir.p .ejLkHSe the
brjne4ischare was repp tq pjy wer The
the SWRCB General Industrial
1ctivüies Storm waterPennit Order No 1-13 DWQ Industrial Storm Water Permitsinc there
waste to enter the storm watçr conyeyacern- On April 1992 the
SWRCB received Rohrs Industrial Storm Water Permit applicationDue to continuinjSDRWQCB
oncems over storm drain contamination and other outstanding issues tFiWB did not .dopt
4nOrderResczndingOFder iTo 83-4jor Rohr Tndustries Inc until October 13 1994
--
Frm 1992 San Diego Bay sediment sampling study some sample stations in proximity to the Site
sediment were assigned low priority ranking relative to other stations in the Bay However the
Chemisti Toxicity and Benthic Community Conthrions in Sediments in the San Diego Bat Region
Final Report dated September 1996 recommended that toxicity identification evaluation be
considered in the future for Station No 90036 the station approximately 400 feet from Rohr storm
water Outiall This recommendation was based on the fact that 1992 sediment and porewater
toxicity testing was questionable and no benihic community analysis was known to have been
performed for the area
In 1996 and 1997 the County HMIvLD has been concerned about the large number of above ound
and underground tanks that Rchr continues to claim are exempt from specific state regulations in
August 1997 County HM1YD inspector observed the filling of large vaults up to 25 feet deep that
formerly held 10000 -25000 gallon tanks of Trichloroetharie The inspectors concern was whether
proper closure sampling had been performed to ensure that no releases had affected the soil and
-ound water beneath the deep vaults Over 25 tanks are the subject of ongoing discussions with
County HMMD andRohr
In 1997 the San Diego Unified Port District Port in conjunction with the City of Chula Vista
Redevelopment Agency issued proposed changes to the Ports Master Plan for tidelands within the
City of Chula VIsta Two proposed redevelopment scenarios involving the Site including lands
CUT 006676

Cleanup and Abatement Order No 98-08 Page
Aerostnctures Group of SF Goodrich Aerospace formerly Rohr Inc March 26 1998
and The SF Goodrich Company
presently occupied by Rohr are described in the Chula Vina Bu mess Park Expansion and Port
Master Plan Amendment Environmenral Impact Report dated July 1997 The scenarios involve
establishing biomedical/pharmaceutical technology park and resort hotel facilities while planning to
preservemarsh areas and encourage further public use of the waterfront The Port Master Plan
Amendment was recently approved Currently the Port and City of Chula Vista Redevelopment
Agency are actively negotiating with prospective developers arid tenants and are planning to begin
significant street and utility improvements at the Site
10 In 1998 the SDRWQCB discovered that the U.S National Wildlife Service has performed ecological
and sediment monitoring of its wildlife preserves in both the Sweetwater and Tijuana River Marshes
from 1989 to 1992 There are two monitoring points in the study within the FG Street Marsh
located just west of Rohr The ecological and sediment data from the intended study is still in raw
form due to ftinding redirections However review of the raw data indicates that priority pollutant
metal concentrations in the sediment of the FG Street Marsh ranked among the highest
concentrations consistently observed during the monitoring period Specifically cadmium chromium
copper nickel and ric were found to be elevated The study needs to be completed prior to
reaching any conclusions from the data however no funding is foreseen in the near fl.jrure
FTJ.1DITGS OF SURFACE WATT CONTAMINATION
11 Since 1993 Rohr has submitted Annual Reports of storm water monitoring results pursuant to the
Industrial Storm Water General Permit superceded in April 1997 by updated SWRCB Order No 97-
03-DWQ Rohr has delineated four primary catchment basins for the storm water conveyance
system SWCS Rohrs SWCS outfall openings are variously lying within the FG Street Marsh
from to 30 feet into identified tidal marine ecologies and from approximately 400 to 1500 feet of
San Diego Bay The SWCS from Rohr primarily drains to San Diego Bay and to and several marsh
areas tributary to San Diego Bay from six pipes ranging in size from 42 to 84 in diameter Tidal
waters of San Diego Bay are reportedly present inside the storm drains over 1000 feet inland beneath
the Site The SWCS collects runoff only from lands within the Site with two minor exceptions
There are apparently two upgradient or incoming drainage areas that contribute runoff to the
system One incoming storm drain collects runoff from single block of Lagoon Drive The other
incoming storm drain apparently collects runoff from limited portion of Interstate Currently
Rohr collects storm water samples from six primary outfalls near the boundaries of its operating
area and also samples incoming storm water stations
12 Rohr recently aclmowledged that some of the storm water samples are diluted to greater or lesser
degree by water from San Diego Bay Storm water sampling results inRohrs Annual Reports
consistently show elevated concentrations of Total Dissolved Solids TDS and Priority Pollutant
Toxic Metals Metals in nearly all samples Many samples have TDS concentrations equivalent to
seawater concentrations In other words Rohr confirmed that its samples results are representative
of storm water commingled with tidal water beneath its site Rohr explains that they had thought the
CUT 006677

Cleanup and Abatement Order No 98-08
Aerostructures Group of BF Goodrich Aerospace formerly Rohr lnc
and The BF Goodrich Company
taich 2.b 199
permit required that storm water had to be sampled at the property line permit requires
sampling at locations which are representative of runoff from site during the storm The incoming
storm water samples from Lagoon Drive and Interstate have low IDS concenations lii addition
Rohr has not specifically acknowledged the level of metals concentrations in its samples There has
been no decrease in metal concentrations in the commingled storm water/Bay water leaving its
property since Rohr began sampling in 1992/93 Of the incoming storm water sample results the
Lagoon Drive location shows relatively low metals and the Interstate location has elevated metals
concentrations
13 The following are the results of commingled storm water/Bay water from recent Rohr Annual
Reports submitted under the above described Industrial Storm Water General Permit The sample
results from the two identified incoming storm water dows are also listed Because there are
presently no numerical water quality standards for storm water runoff For comparison purposes the
1996 USEPA Naflonal Industrial Sionn Water Parameter Benchmark Values Benchmark VaIues
are listed alongside of Roh.r These Benchmark Values represent the national averages of reported
storm water quality results for industrial sites across the nation
Constituent
Oil and Grease rngiL
Tot Susp.Solids mg/LCadmium j.iglL
Total Chromium .ig/L
Copper ig/LLead jagiL
Silver .ig/L
Zinc .ig/L
flutoing Coric
Rohr
17-
34-315
38
760
740
-1700
57
20-810
Incoming Conc
LCOOii Dr mr 1-5
4i
72 ce. s-
100 S5 100
10 10- 100
100 75- 100
100 50-410
200 5- 100i60- 590
USEP14 Nat Indusrnal
Benchmark Values
mgiL 7.3 mgL100 rnL 163 rngiL
ii awL
no value
$3.6 iL31.5 uwL
31.3 ugL
awL
USEPA compiled these Benchmark Values for comparison or benchmarldng purposes Benchmark
Values are.jpromuIgated water quality standards or objectives for protecting water bodies
Review and comparison of these results have lead the SDRWQCB to suspect that despitedilution
effect of tidal water with Rohr storm water nmof the metals concentrations are at anomalously
high levels There is very likely additional sources of contamination that have not yet been identified
The water quality impacts to San Diego Bay and nearby marshes are of significant concern
The USEPA has collected multi-sector industrial storm water permit data front states and compiled the data
into national averages fcr use as Thenctimarks for general comparison purposes California RWQCBs use these
publishedstatistics for reviewing industry Sampling Reducuon Cerfication applications
Statistics from the USEPA National Storm Water Permit results solely from industries in Standard Industrial
Classificaon Codes that manufacture transportation equipment and industrial or commercial machinery
CUT 006678

Cimip and Abatement Order No 98-08
Aemstiiclmes Group of BF Goodrich Aerospace formerly Rohr Inc
and The BF Goodrich Company
Page 10
March26 1998
14 In an effort to compare Rohrs storm drain discharge quality with other San Diego Bay outfall
discharges two City of Sari Diego municipal storm drain outfalls were selected for comparison One
outfall is located at California Street and one is located at Crosby Street closer to Rohr Although
these are municipal outfalls with multiple land users discharging into the system they both discharge
to the Bay and have similarly sized drainage basins with significant proportion draining from
industrial and commercial operations previous finding related compared other industrial site
dischargers with Rohrs data
The chart on the following page displays some stonn drain outfill discharge quality results for
comparison with Rohr
Mean Values Measured At Outfalls During Storm Events
1996/97 Rainy Season
Constituent San Diego Ailunicipal San Diego Municipal Rohr
Storm Drain at Storm Drain at rrnple Date
Crosby Sii-eet California Street 11/21/96
1/26/96 Composite 11/21196 Composite Grab
One Drain from One Drain from Six Drains measured
..118 acres 648 acres 15% is from total of166 ac
-.52% is commercial commercial and estimated 90%
industrial land use industrial land use commiindustrial
Tot Dis Solids mg/L 24 52 19900
Tot.Suso.Solids rng/L 28 66 161
Cadmium j.tg/L 0.7 Dissolved 0.4 Total Recov 12 Total Recov
Copper iig/L 10 15 59
Lead J.LWL 17 73
Zinc uwL 120 60 1203
While the municipal storm drain datasets are not directly comparable it is red flag that single
industrial facility might be causing greater impacts to marine waters than municipal storm drains
FThLNGS OF GROUND WATER CONTAMINATION
Ground water flow direction at the Site flows west-southwest towards San Diego Bay Depth to
ground water reportedly rangesfrom to feet below ground surface Ground water elevation
beneath the Siteranges
from mean sea level to feet aoove mean sea level Rohr study has
documented tidal influence on ground water elevation near Building 57 Contaminated ground water
may be hydrologically connected to San Diego Bay through saturated soils may follow subsurface
preferential pathways or may be entering andlor is influenced by marine and fresh waters in the storm
water conveyance system
CUT 006679

Cleanup and Abatement Order No 98-OS Page 11
Aerosm.ictures Group of BF Good.nch Aerospace formerly Rohr lflC vlarch 26 1998
and The BF Goodrich Company
16 The following are some of the most elevated ground water concentrations reported to date
micrograms per liter igfL day average
Constituent Max Conc.at Rohr California MCLs Natl Ambient Saltwater Ag Life Std
Arsenic
Barium 00C
Chromium Hexavalent 1800 50 Total
Copper -0 $00Lead
Nickel 540 J0
Zinc no MCLBenzene -6
Trichioroethene 320.000
11 1-Trichloroethane .10.000
cis 12-Dichloroethene 50000
Vinyl Chloride 25000 0.5
are USEPA Primary Madmum Contaminant Leve
Some of the above contaminant concentrations exceed drinking water standards for municipal
beneficial use of ground water If it is determined that contaminated ground waxer is hydrologically
connected to suriace waters all of the above concentrations would also indicate exceedances of water
quality objectives for both the neighboring tidal marshes and for San Diego Bay
CONCLUSIONS
There is significant amount of evidence on isolated areas ground water contamination and both
direct and indirect evidence that more extensive ground water contamination exists Despite almost
10 years of worldng on contaminant releases at the site little is known about the historic sources of
discharges that have affected ground water quality There is also significant amount of water
quality data on the commingled storm wateriBay water Analytical laboratory results on priority
pollutant metals from SWCS samples indicate that Rohr has anomalously elevated concentrations
over and above that of others in similar industries and above comparable municipal storm water
discharge quality Rohrs SWCS ultimately discharges to San Diego Bay and because of the shallow
gradient of the aged SWCS discharges not only during storm events but daily due to tidal flux
Because storm water runoff from industrial activities has not been tested separately from tidal waters
to date the SDRWQCB does not know storm water runoff is contaminated prior to reaching the
storm drains or if other flows or wastes within the storm drains corithbute most of the contamination
Based on recent site inspections by multiple environmental agencies the SDRWQCB has reason
believe that the quality ofRohfs storm water runoff may turn out to be normal as compared to
CUT 006680

C1nup and Abatement Order No 98-08 Page 12
Aerostructures Group of BF Goodrich Aerospace formery Rohr Inc March 26 1998
and The BF Goodrich Company
benchmark levels for similar facilities and that storm water runoff is not the main source of the
priority pollutant metals found in the storm drain discharges subsurface source or sources of todc
metals possibly contaminated soil and ground water is suspected of contibuting to the high metals
concentrations Found in the storm drains
subsurface sources is suspected because the inteity of the SWCS is uniciown the groundwater
is shallow and contaminated in many areas and San Diego Bay waters ebb and flow daily within the
storm drains and tidal influence has been shown in ground water in at least one portion of the site
It is generally accepted that if the conditions are right ground water will flow in and along many
subsurface preferential pathways e.g baclc5lled utility trenches throughout site Historic releases
of zinc and other contaminants into the SWCS have been documented Further the SDRWQCB has
evidence to suspect that other constituents including chlorinated solvents polyaromaric
hydrocarbons other volatile and semi-volatile organic compounds and other more exotic aerospace
metals may be present in both the ground water and in the SWCS Since the SWCS has not been
üllv assessed or cleaned historic contaminant sources likely still remain in portions of the SWCS
The SDRWQCB finds the need for Rohr to investigate the site and discover/determine the ectent of
impacts to the environment
CUT 006681

-Ione
Rgure
Regional Location of Froect Sfte
Notto Scae
CUT 006682
ajIbrcc
laJLey Cmer
--
P-iomai
Lake Herl$flaw \...-
Suihenaaa
_-
amora
vcene
eserc.r
-e.ertr
Escondido
Encibs
DeL
Pwav
LJoIa
SN DIEGO COUNTY
2trefr

CUT 006683

ji
1k
fl
SI
LI
\F.5
RJ
SS
SS
SS

1234

Regional Water Quality Control Board San Diego Page of
Home Water Issues Programs Shipyards Sediment
San Diego Region San Diego Bay Contaminated Marine Sediments
Assessm ent and RernediationW
On June 18 2002 Regional Board staff held public workshop to update the Regional Board members on current
efforts to address contaminated marine sediments in San Diego Bay Regional Board members in attendance were
Vice Chairman Gary Stephany Ms Terese Ohio Ms Janet Keller and Mr Eric Anderson
View the Workshop Agenda and Slide Presentations
Conditions of Use Privacy Policy
Copyright 2009 State of California
The Board is one of six boards departments and offices under
the umbrella of the California Environmental Protection Agency
CaIIEPA OEHHA SWRCB
EXHIBIT NO
J3a
http I/www.waterboards.ca.gov/sandiego/waterjSSUeS/prograrflS/ShipYardS_Sedimeflt/Sedi .. 2/22/2011
Regional Water Quality Control Board San Diego Page of
Home Water lssues Programs Shipyards Sediment
San DieoReion June 18 2002 Sediment Workshop Presentation
STATE OF CALIFORNIA
REGIONAL WATER QUALITY CONTROL BOARDSAN DIEGO REGION
WORKSHOP AGENDA
SAN DIEGO BAY CONTAMINATED MARINE SEDIMENTS
ASSESSMENT AND REMEDIATION
Tuesday June 18 2002
900 am 500 p.m
Water Quality Control Board
Regional Board Meeting Room9174 Sky Park Court
San Diego California
Workshop includes informal discussion of items to be presented for action at future business meeting Persons who
are interested in items on the agenda are urged to attend workshops as they may miss valuable discussion that will
not be repeated at future Regional Board meetings There is no voting at workshops Items requiring Regional Board
action must be scheduled for consideration at Regional Board meetings
Roll Call and Introductions Chairman Minan
Overview arid Perspective David Barker RWQCB
Bight98 Regional Monitoring Study Results Steve Bay SCCWRP
NASSCO and Southwest Marine Contaminated Sediment Assessment and Remediation
Suggested order of presentation
Regional Board Approach Tom Alo RWQCBEnvironmental Group Perspective San Diego Bay Council
Preliminary Results NASSCO Southwest Manne
Southern California Water Research Project Perspective Steve Bay SCCWRPResource Agency Perspective and Involvement Michael Martin Fish Game
Whats Next Craig Carlisle RWQCBSpeaker Discussion
Contaminated Sediment Containment
Campbell Shipyard Remedial Alternatives Tentative-Port of San Diego
Convair Lagoon PCB Cap Craig Carlisle RWQCB
Bay Sediment TMDLs and Toxic Hot Spots Remediation
Current Upcoming TMDLS Alan Monji RWQCBPreliminary Results for Chollas Creek and 7th Street Channel Bart Chadwick SPAWARINavy and Steve BaySOC WRP
http//www.waterboards.ca.gov/sandiego/water_issues/prOgrams/shipyards_sediment/work.. 2/22/2011

Regional Water Quality Control Board San Diego Page of
DoD Sites NASNI Boat Channel and NAB Coronado Charles Cheng RWQCB
SLIC Sites Solar Turbines and Goodrich Aerostructures Peter Peuron RWQCB
Questions and Comments from Interested Persons
Conditions of Use Privacy Policy
Copyright 2009 State of California
The Board is one of six boards departments and offices under
the umbrella of the California Environmental Protection Agency
Cal/EPA ARB QEE QIQ OEHHA SWRCB
http//www.waterboards.ca.gov/sandiegO/Water_iSSUeS/ProgramS/ShiPYards_Sedimeflt/WOrk.. 2/22/2011

Sta
tus
of
Sedim
entC
lean
up
Activitie
sat
Sola
rT
urb
ine
s
Go
od
rich
Aero
str
uctu
res
Pete
rP
euro
n
SLIC
Pro
gra
m
Site
Mitig
ation
Unit
San
Die
go
Regio
nal
Wate
rQ
uality
Contr
olB
oard

Go
od
rich
Aero
str
uctu
res
Ch
ula
Vis
taC
A

Re
gu
lato
ryC
onte
xt
RW
QC
Bis
the
info
rm
allead
agency
Th
eC
alifo
rnia
Depart
mentofF
ish
Ga
me
and
the
US
Fis
hW
ildlife
Serv
ice
are
support
agencie
s

Go
od
rich
Aero
str
uctu
res
Site
Lo
ca
tio
nM
ap

Ae
ria
lV
iew
ofO
utf
all
Estu
ary


Big
Diffe
rences
Betw
een
This
Site
Oth
er
Sedim
ent
Sites
Estu
arine
conditio
ns
Diffe
rent
recepto
rs
Diffe
rent
physic
al
chem
ical
environm
ent
Dynam
icoft
en
non-e
quilib
rium
co
nd
itio
ns
Sm
all
imp
acte
dare
a
Easy
access
tosedim
ent

Pro
cesses
Associa
ted
With
Aero
space
Pro
duction
Activitie
s
Foundry
opera
tions
meta
lm
eltin
gm
eta
l
casting
degre
asin
gpart
scle
anin
gpla
ting
anodiz
ing
milling
and
pain
ting
opera
tions
Hazard
ous
waste
treatm
entunits
Underg
round
sto
rage
tanks

Ma
jor
Conta
min
ant I
mp
acts
Go
od
rich
Aero
str
uctu
res
Ch
1o
rin
ate
dS
olv
ents
TC
EP
CE
TC
Aetc
.Me
tals
chro
miu
mle
ad
zin
c
copper
nic
kel
Pe
tro
leum
Hydro
carb
ons
Be
nze
ne
Poly
nucle
arA
rom
atic
Hydro
ca
rbo
ns

edim
ent
Conta
min
an
ts
Me
ta1
schro
miu
mle
ad
zin
c
copper
nic
kel
Poly
ch1orinate
dB
iphenyls
PC
Bs
Po
lyn
ucle
arA
rom
atic
Hyd
roca
rbo
ns
PA
Hs

Me
tals
Levels
Found
inS
ailfin
Mo
llie
sF
rom
Mars
h200
0D
ata
Chro
miu
mC
opper
Lea
dN
ickel
mg/k
gm
g/k
gm
g/k
gm
g/k
g
Tis
sue
0.8
94.3
90.4
72
0.2
32
0.2
53.9
60.5
30
.42
mg/k
g
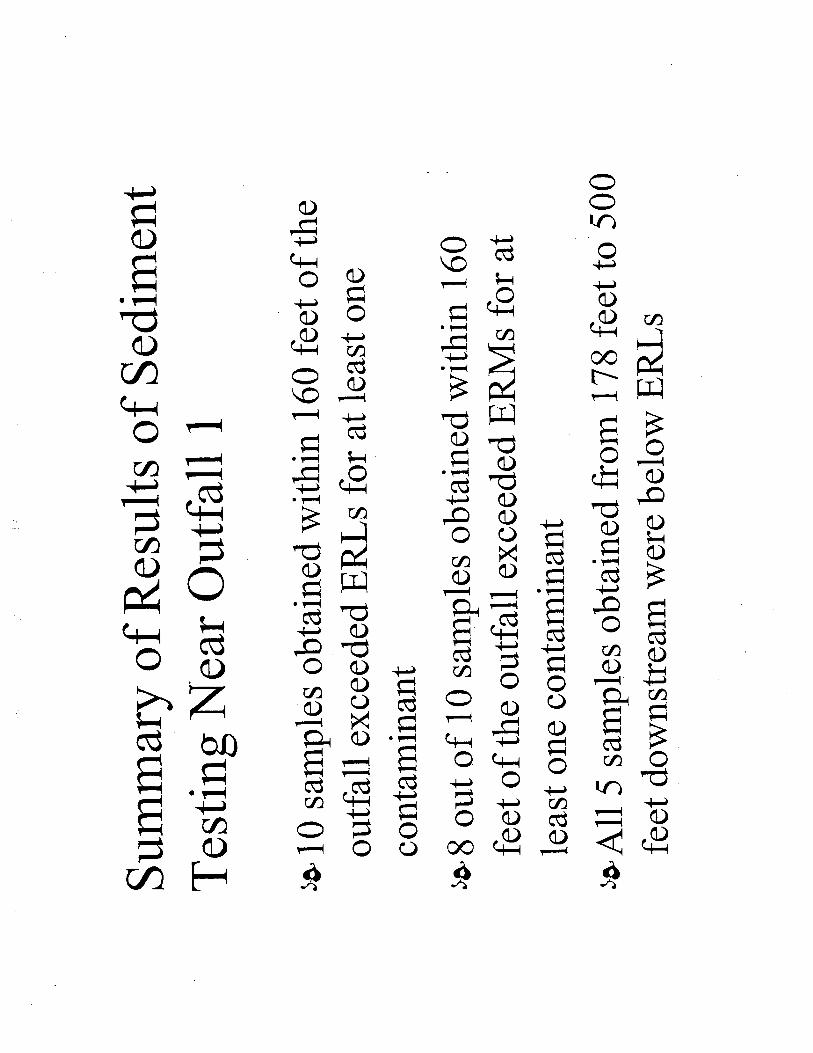
Su
mm
ary
ofR
esults
of
Sedim
ent
Testing
NearO
utf
all
10
sam
ple
sobta
ined
within
160
feet
of
the
outfall
exceeded
ER
Ls
for
at
least
on
e
conta
min
ant
out
of
10
sam
ple
sobta
ined
within
160
feet
ofth
eoutfall
exceeded
ER
Ms
for
at
least
one
conta
min
ant
All
sam
ple
sobta
ined
from
178
feet
to5
00
feet
dow
nstr
eam
were
belo
wE
RL
s

Ae
ria
lVie
wof
Outt
hll
Estu
ary

Sta
tus
of
Sedim
entA
ppro
ach
at
Go
od
rich
Aero
str
uctu
res
Work
pla
nis
cunently
under
revie
wb
y
SD
RW
QC
Bth
eD
epart
ment
ofF
ish
an
d
Gam
eand
the
US
Fis
hW
ildlife
Serv
ice
Th
ew
ork
pla
npro
poses
Additio
nal
site
assessm
ent
Appro
ach
toecolo
gic
al
ris
kbased
on
DT
SC
s
Guid
ance
for
Ecolo
gic
al
Ris
kA
ssessm
ent

Ad
ditio
nalA
ssessm
ent
Resam
pling
todete
rmin
ela
tera
la
nd
vertical
exte
ntofim
pacts
Be
nth
iccom
munity
data
Sam
pling
ofre
fere
nce
are
as
todete
rmin
e
backgro
un
dconcentr
ations

Ris
kA
ssessm
entP
roto
co
l
copin
gA
ssessm
ent
Tie
r Assess
feasib
ility
of
cle
anin
gu
pto
backgro
und
levels
Assess
feasib
ility
of
cle
anin
gu
pto
ER
Ls
Dete
rmin
ebio
accum
ula
tive
ris
ks
usin
gT
RV
s
Tie
r2
-
Sedim
entQ
uality
Triad
Impacts
Assessm
ent
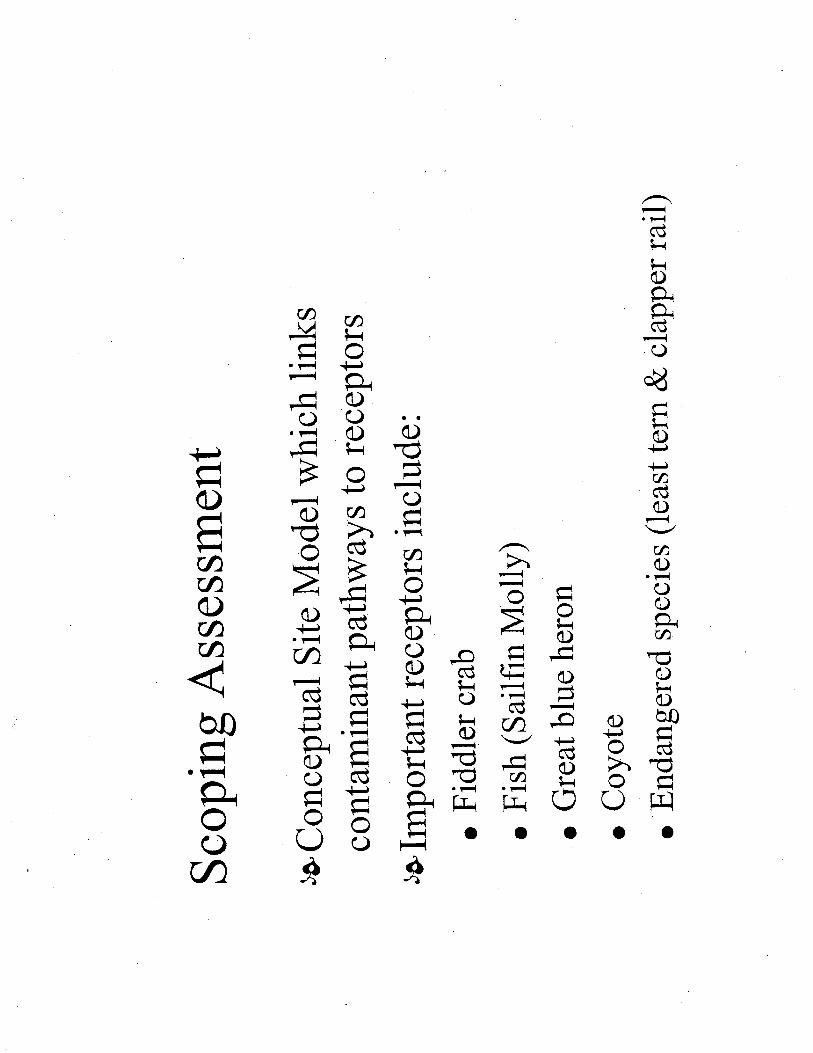
Scopin
gA
ssessm
ent
Conceptu
al
Site
Model
whic
hlinks
conta
min
ant
path
ways
tore
cep
tors
Imp
ort
antre
cepto
rsin
clu
de
Fid
dle
rcra
b
Fis
hS
ailfin
Molly
Gre
atblu
ehero
n
Coyote
Endange
red
specie
sle
ast
tern
cla
pperrail

Tie
rA
ssessm
ento
ffe
asib
ility
of
cle
anin
gup
tobackgro
und
Wi1
1obta
inbackgro
und
sam
ple
sin
sim
ilar
are
as
and
com
pare
with
sedim
ent
ch
em
istr
y
They
pro
pose
Tw
olo
cations
at
Gunpow
der
Poin
t
One
location
near
the
Sw
eetw
ate
rR
iver
If
it
isfe
asib
leth
ey
will
excavate
all
impacts
no
furth
er
actions
requ
ired
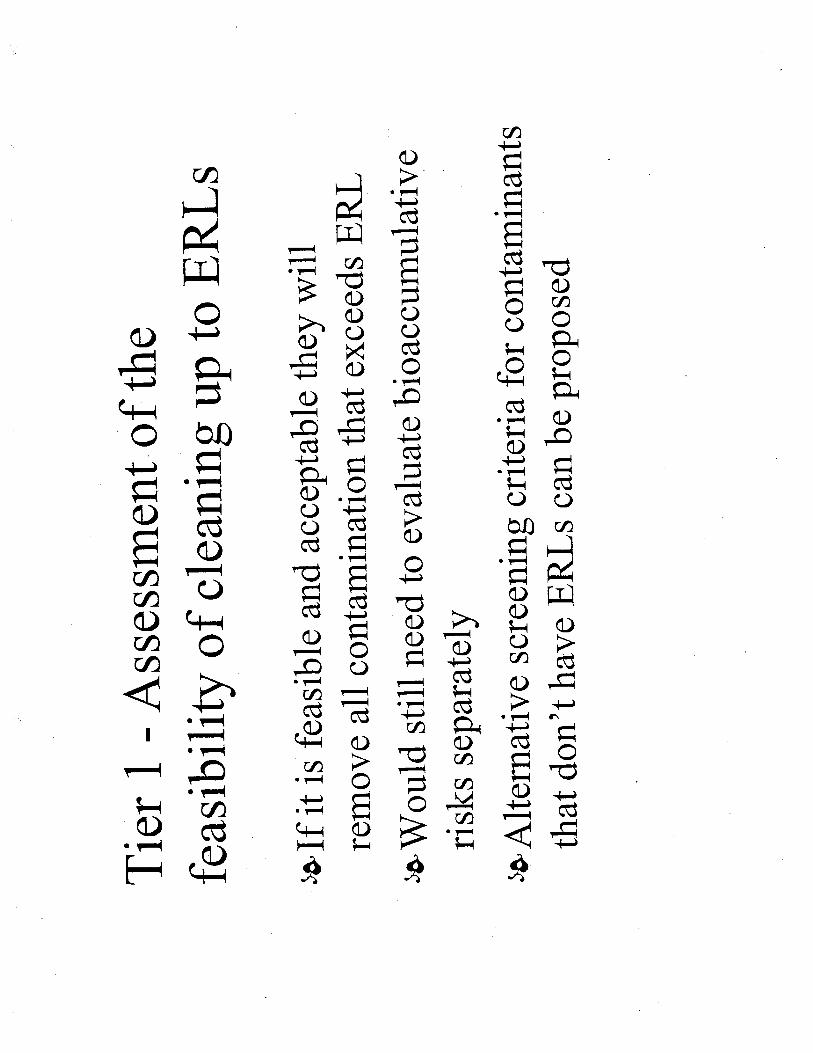
Tie
rA
ssessm
ento
fth
e
fea
sib
ility
ofcle
anin
gup
toE
RLs
Ifit
isfe
asib
leand
accepta
ble
the
yw
ill
rem
ove
all
conta
min
ation
that
exce
ed
sE
RL
Wou1d
stillneed
toevalu
ate
bio
accum
ula
tive
ris
ks
separa
tely
Alternative
scre
enin
gcriteria
for
co
nta
min
an
ts
that
dont
have
ER
Ls
can
be
pro
posed

Tie
rS
cre
enin
gLevel
Asse
ssm
en
t
ofB
ioaccum
ula
tive
Ris
ks
Ris
ks
willbe
dete
rmin
ed
usin
gappro
priate
Toxic
ity
Refe
rence
Valu
es
TR
Vs
Tis
sue
concentr
ations
willbe
calc
ula
ted
usin
gE
PA
sta
ndard
partitionin
gvalu
es
and/o
rm
easure
dtissue
concentr
atio
ns
HQ
Tis
sue
Concentr
ationlT
RV

Possib
leO
utc
om
es
ofT
ier
Scre
enin
gA
naly
sis
No
furth
er
action
Rem
ova
lof
sedim
ent
tom
eet
cle
an
up
levels
Ad
ditio
nalassessm
entofris
ks

Tie
rB
aseline
Ris
kA
ssessm
en
t
Sedim
entQ
uality
Triad
Chem
istr
y
Benth
iccom
munity
analy
sis
Toxic
ity
testing
Possib
1e
outc
om
es
No
furth
er
action
Rem
oval
of
sedim
ent
tom
eet
cle
anup
leve
ls
Additio
nal
Ris
kA
ssessm
ent

Tie
rIm
pacts
Assessm
en
t
Fi1
l any
data
gaps
inT
riad
analy
sis
Bio
acum
mu1ation
tests
may
be
do
ne
Ad
ditio
nal
tissue
tests
may
be
pe
rfo
rme
d

Go
od
rich
Aero
str
uctu
res
Issu
es
Mu
ch
depends
on
dete
rmin
ationof
backgro
und
concentr
ations
diffic
ult
task
Stillneed
tocom
ple
teassessm
entofth
e
exte
ntof
conta
min
ation
Stillneed
toaddre
ss
thre
eoth
er
ou
tfa
lls
at
this
facility

1235

Anchor QEA LP Cost Estimate for Rem edia Footpnnt San Diego ShipyardsJuly 12 2010
Anchor QEA LP
Cost Estimate for Remedial Footprint
ANCHORSan Diego Shipyards Sediment Site -F Ld
July-_DESIGN AND PERMITflNG
Additiona PreDesgn Site Characterization LUMP SUM $348000
Surveys and Engineering DesignLUMP SUM $675000 $675000
PermittingLUMP SUM $400000 $400000 See Note
CEQAERf requiredLUMP SUM $900000 $900000
edwehaveaddedinestimatedcOStSfOrthereParatiOflandSUbmittal0faflE
CONSTRUCTION PREPARATION
CONSTRUC11ONMobilizations and Demobilizations $300000 $900000 Estimate assumes work is completed in construction seasons
SEASONS
Demolition LUMP SUM $500000 $500000 Includes demolition of dormant BAE pier
DREDGING
Unconstrained openwater dredging17925 CV $10 $179250 Unit costs are typica for unconstrained dredging outside of shipyard area
outside of easehold area1z5% of dredge area
Constrained dredging from nner ship1ard 125475 CV $18 $2258 550 Higher cost for dredging within easehold line near piers in areas of sh traff etc
with leasehod area875%of dredge area -- --- -- --Dredg ng Surface/SLbsurface Debs 7170 CV $120 $860 400 Unknown quantity Estimates assume 5% of total dredge vo ume Pricing includes landfill disposal
CONSTRUCTION
Engineering Controls silt curtain oil boom SEASONS$32000 $96000 Estimate assumes work is completed in construction seasons
etofdredgingoveronehalftheremedialareaSameutc0stsa5forconStraddrengTromAdditional Dredging as needed for 2nd pass 28100 CV $18 $505800 shiard
MARINE STRUCTURES
No structural retrofit of structures is assumed to be necessary Estimated costs assume setback of dredging
Placement of Quarry Run Rock for Protection of Marine Structures 21887 TON $45 $984915 from marine structures and revetments and placement of quarry run blankets or berms to reinstate lateral
resistance
SEDIMENT OFFLOADING AND DISPOSAL
An off-site sediment staging area will be needed in the vicinity of the project area Location is unknown at
$900000this time Costs assume three-year construction periodAcquisition/Lease of Sediment Offloading Area
Preparation of Sediment Offloadng Area
Rehandling and Dewatering
CONSTRUCTION
SEASONS
171500
$300000
$300000LUMP SUM
CV $25
$300000 Preparation of sediment handling and dewatering area
$4 287Assumes stockpiling of sediments prior to transport to landfill and addition of lime or cement admixture to
500facilitate dewatering
EXHIBIT NO_
R345gof
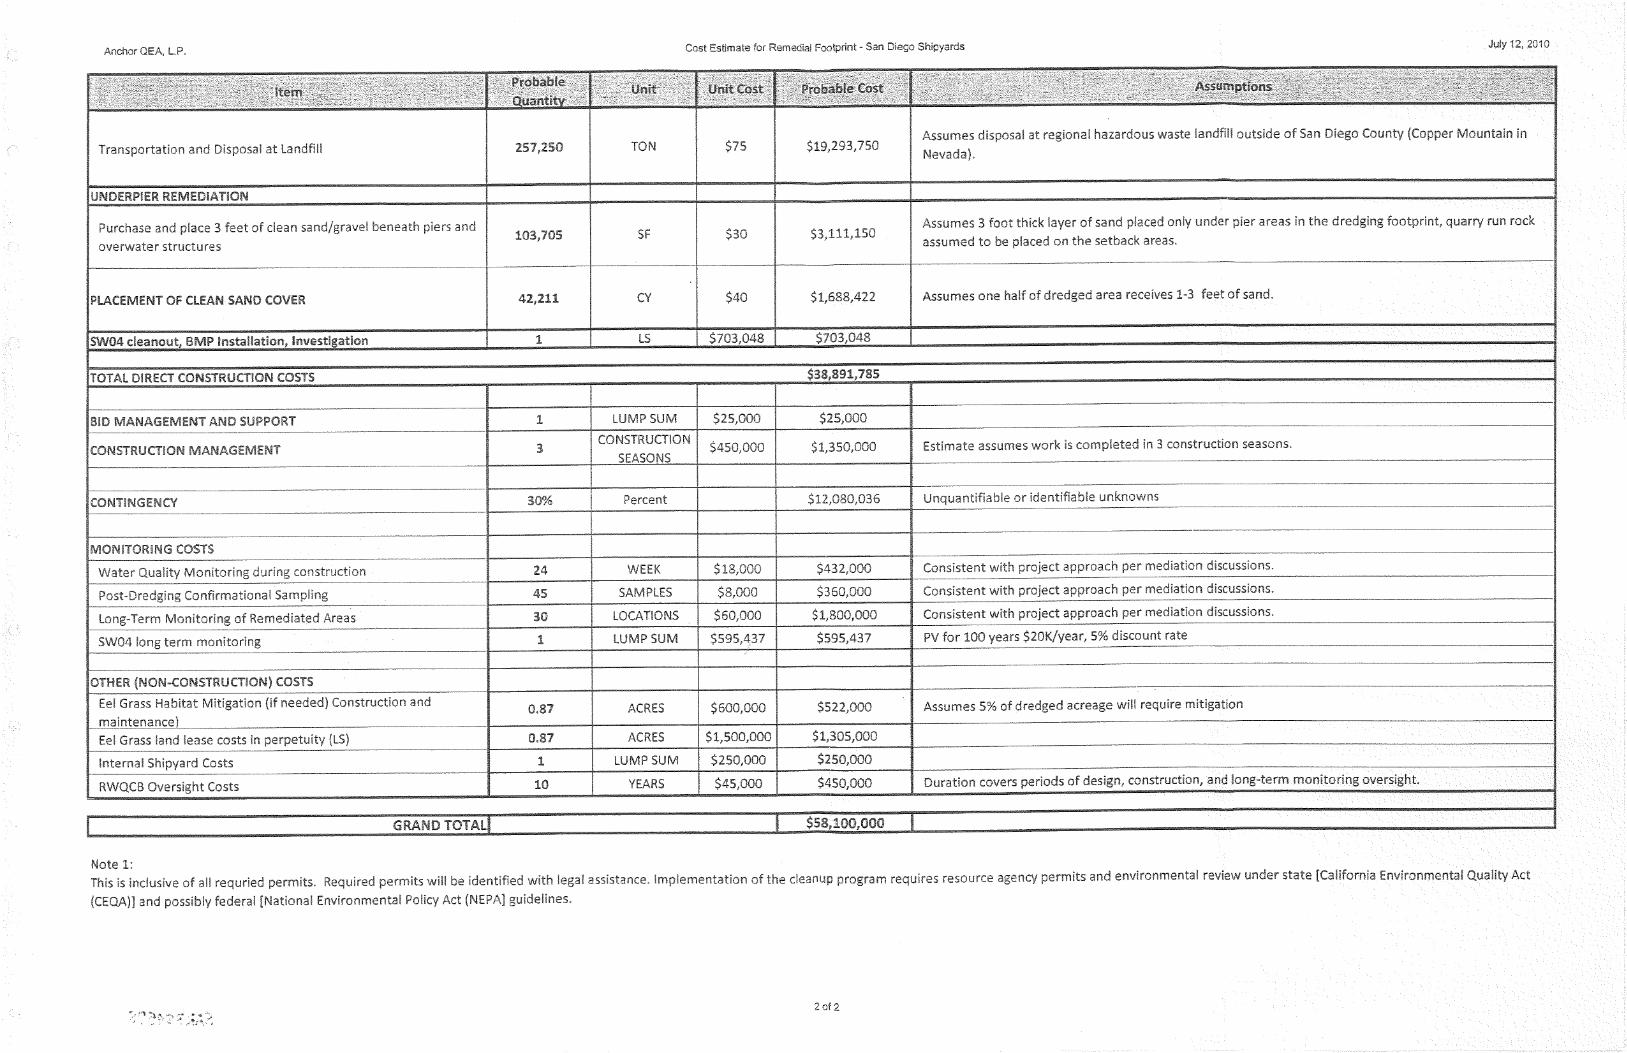

1236

CALIFORNIA REGIONAL WATER QUALITY CONTROL BOARDSAN DIEGO REGION
In the matter of Tentative Cleanup Regional Board Cleanup Teamsand Abatement Order No R9-201 1- Responses Objections to
0001 Formerly R9-2010-0002 Designated Party San Diego Unified
Shipyard Sediment Cleanup Port Districts First Set of Requests
for Admissions
Propounding Party San Diego Unified Port District the Port
Responding Party California Regional Water Quality Control
Board San Diego Region Cleanup Team
Set Number One
Pursuant to the Presiding Officers February 18 2010 Order Issuing Final
Discovery Plan for Tentative Cleanup and Abatement Order No R9-2010-
0002 and Associated Draft Technical Report the Presiding Officers
October 27 2010 Order Reopening Discovery Period Establishing
Discovery Schedule and Identifying Star and Crescent Boat Company as
Designated Party for Purposes of Tentative Cleanup and Abatement Order
R9-201 1-0001 the 10.27.10 Order the Parties August 2010
Stipulation Regarding Discovery Extension and all applicable law
Designated Party the San Diego Water Board Cleanup Team Cleanup
Team hereby responds and objects to the Ports First Set of Requests for
Admissions the Requests as follows
EXHIBIT NO._123t
8a-L--

GENERAL STATEMENT OF OBJECTIONS
The Cleanup Team makes the following general objections whether or not
separately set forth in response to each Request to each and every
Request by the Port all as set forth herein and incorporated specifically
into each of the responses below
Privilege Objection The Cleanup Team objects to each Request to
the extent it requests information protected by the attorney-client
privilege joint prosecution privilege common interest privilege
mediation privilege official information privilege and/or deliberative
process privilege and to the extent it requests information subject tO
the work-product exemption collectively referred to herein as the
privilege or privileged The Cleanup Team contends that all
communications exchanged between it and its counsel are privileged
The Cleanup Team objects to identifying or producing any and all
products of investigations or inquiry conducted by or pursuant to the
direction of counsel including but not limited to all products of
investigation or inquiry prepared by the Cleanup Team in anticipation
of this proceeding based on the attorney-client privilege and/or the
work-product doctrine The Cleanup Team further objects to
providing information subject to or protected by any other privilege
including but not limited to settlement communications the joint
prosecution privilege the common interest privilege the mediation
privilege the official information privilege and/or the deliberative
Cleanup Team Responses to Port RFAs

process privilege Inadvertent provision of privileged information shall
not constitute waiver of said privileges
Scope of Discovery Objection The Cleanup Team objects to each
Request to the extent it purports to impose any requirement or
discovery obligation other than as set forth in Title 23 of the California
Code of Regulations sections 648 et seq the California Government
Code sections 11400 et seq and/or applicable stipulations
agreements and/or orders governing this proceeding including but
not limited to the limitations on the proper subject matter for the
Ports discovery to the Cleanup Team as specifically set forth in the
10.27.10 Order to wit scope of additional disŁovery allowed
by this Order is limited to revisions to the TCAO/DTR released on
September 15 2010 as compared to the December 2009 versions of
these documents The Cleanup Team further objects to instructions
set forth in the Ports DEFINITIONS that are inconsistent with
and/or to the extent they purport to impose obligations on the
Cleanup Team not specifically set forth .in Title 23 of the California
Code of Regulations sections 648 et seq the California Government
Code sections 11400 ºt seq and/or applicable stipulations
agreements and/or orders governing this proceeding
Irrelevant Information Objection The Cleanup Team objects to the
Requests to the extent they are overbroad and/or seek information
that is not relevant to the claims or defenses asserted in this
proceeding and is not reasonably calculated to lead to the discovery
of admissible evidence
Burdensome and Oppressive Obiection The Cleanup Team objects
to each Request to the extent that it seeks information that has
Cleanup Team Responses to Port RFAs

already been provided or that otherwise is equally available to the
Port or is already in the Ports possession which renders the
Request unduly burdensome and oppressive The Cleanup Team
has already provided the Port with copy of the electronic text
searchable administrative record and supplemental administrative
record for this matter Therefore the burden of providing information
that is equally accessible to the Port is no greater on the Port than it
would be on the Cleanup Team and the Cleanup Team will not
provide again the information it has already provided and which is
contained in the electronic text searchable administrative record or
that is otherwise already in the Ports possession custody or control
Overbroad Objection The Cleanup Team objects that certain
Requests are overbroad and are framed in manner that prevents
any reasonable ability to provide responsive information Such
Requests create an unreasonable risk of inadvertent noncompliance
as framed
Cleanup and Abatement Order Proceeding is Ongoing The instant
Cleanup and Abatement Order proceeding is ongoing and the
Cleanup Team expects that additional evidence will be provided by
the Designated Parties hereto in accordance with governing statutes
regulations and applicable hearing procedures While the Cleanup
Teams response to each of these Requests is based on
reasonable investigation and the state of its knowledge as of this
date additional information may be made available to or otherwise
obtained by the Cleanup Team subsequent to the date of this
response These responses are provided without prejudice to the
Cleanup Teams right to supplement these responses or to use in
Qeanup Team Responses to Port RFAs

this proceeding any testimonial documentary or other form of
evidence or facts yet to be discovered unintentionally omitted or
within the scope of the objections set forth herein
OBJECTIONS TO DEFINITIO.NS
The Cleanup Team objects to the defined term DOCUMENT on the
ground and to the extent that it seeks information protected by
settlement confidentiality rules the attorney-client privilege the joint
prosecution privilege the work product doctrine the mediation
privilege the common interest privilege the official information
privilege the deliberative process privilege and/or any other privilege
or confidentiality protection
The Cleanup Team objects to the defined term
COMMUNICATIONS on the ground and to the extent that it seeks
information protected by settlement confidentiality rules the attorney-
client privilege the joint prosecution privilege the work product
doctrine the mediation privilege the common interest privilege the
official information privilege the deliberative process privilege and/or
any other privilege or confidentiality protection
The Cleanup Team objects to the defined term IDENTIFY on the
ground and to the extent it purports to impose requirements and/or
obligations on the Cleanup Team in preparing these Responses not
otherwise required by Title 23 of the California Code of Regulations
sections 648 et seq the California Government Code sections
11400 et seq and/or applicable stipulations agreements and/or
orders governing this proceeding
Cleanup Team Responses to Port RFAs

The Cleanup Team objects to the defined term MS4 SYSTEM as
hopelessly overbroad unduly burdensome not reasonably calculated
to lead to the discovery of admissible evidence and beyond the scope
of permissible discovery The Cleanup Team will respond herein as if
the term MS4 SYSTEM was defined to include those components of
the Municipal Separate Storm Sewer Systems under Order No 2007-
001 NPDES No CASO1 08758 that RELATE TO the Cleanup Teams
bases for naming the Port as DISCHARGER in the CURRENT
TCAO and CURRENT DTR
RESPONSES TO REQUESTS FOR ADMISSIONS
REQUEST FOR ADMISSION NO.1
Admit that the Port District itself never contributed directly to the DISCHARGE of
waste to the SITE
RESPONSE TO REQUEST NO.1
The Cleanup Team objects to this Request on the ground that it is not full and
complete in and of itself in violation of Code of Civil Procedure section 2033.060
subdivision The Cleanup Team further objects to this Request on the ground that it
is vague and ambiguous with respect to the terms Port District itself .and contributed
directly
Subject to and without waiving the preceding objections the Cleanup Team
responds as follows Denied
The Port contributedto the DISCHARGE of waste to the SITE as co-permittee
under its currently applicable MS4 permit and the preceding permits The Port has filed
Reports of Waste Discharge with the Regional Board The Port also contributed to the
DISCHARGE of waste to the SITE because it has the ability and legal responsibility to
Cleanup Team Responses to Port RFAs

control the activities and DISCHARGES of its tenants The Ports tenants
DISCHARGES could not have occurred without the Port allowing the discharging
tenants to operate and conduct the activity on the land The source of the DISCHARGE
is the land controlled by the Port which land held and managed as trust property on
behalf of the People of the State of California Further facts supporting the Cleanup
Teams denial to this Request are set forth in Finding 11 of the TCAO and Chapter 11 of
the DTR and will not be repeated here
REQUEST FOR ADMISSION NO.2
Admit that the Port District itself neve.r DISCHARGED storm water that contained
waste into the City of San Diego MS4 SYSTEM onto the SITE
RESPONSE TO REQUEST NO.2
The Cleanup Team objects to this Request on the ground that it is not full and
corn plºte in and of itself in violation of Code of Civil Procedure section 2033.060
subdivision The Cleanup Team further objects to this Request on the ground that it
is vague and ambiguous with respect to the terms Port District itself contributed
directly and City of San Diego MS4 SYSTEM
Subject to and without waiving the preceding objections the Cleanup Team
responds as follows Denied
The Port is responsible for DISCHARGED storm water that contained waste to
the SITE as co-permittee under its currently applicable MS4 permit and the preceding
permits The Port has filed Reports of Waste Discharge with the Regional Board
Further facts supporting the Cleanup Teams denial to this Request are set forth in
Finding 11 of the TCAO and Chapter 11 of the DTR and will not be repeated here
REQUEST FOR ADMISSION NO.3
Admit that the Port District itself never contributed directly to the DISCHARGE of
storm water containing waste to the SITE through the City of San Diego MS4 SYSTEM
Cleanup Team Responses to Port RFAs

RESPONSE TO REQUEST NO
The Cleanup Team objects to this Request on the ground that it is not full and
complete in and of itself in violation of Code of Civil Procedure section 2033.060
subdivision The Cleanup Team further objects to this Request on the ground that it
is vague and ambiguous with respect to the terms Port District itself contributed
directly and BC1ty of San Diego MS4 SYSTEM
Subject to and without waiving the preceding objections the Cleanup Team
responds as follows Denied
The Port contributed to the DISCHARGE of storm water containing waste to the
SITE as co-perrnittee under its currently applicable MS4 permit and the preceding
permits The Port has filed Reports of Waste Discharge with the Regional Board
Further facts supporting the Cleanup Teams denial to this Request are set forth in
Finding 11 of the TCAO and Chapter 11 of the DTR and will not be repeated here
REQUEST FOR ADMISSION NO.4
Admit that the City of San Diego owns and operates the MS4 SYSTEM Storm
Drain Outfalls identified as SW4 and SW9 in the CURRENT TCAO and CURRENT DTR
that are alleged to have DISCHARGED storm water containing waste onto the SITE
RESPONSE TO REQUEST NO.4
The Cleanup Team objects to this Request on the ground that it is not full and
complete in and of itself in violation of Code of Civil Procedure section 2033.060
subdivision The Cleanup Team further objects to this Request as compound
conjunctive and/or disjunctive in violation of Code of Civil Procedure section 2033.060
subdivision The Cleanup Team further objects to this Request on the ground that it
is vague and ambiguous with respect to the term Storm Drain Outfalls..
DISCHARGED The Cleanup Team further objects to the Request on the ground that
NPDES Permit No CASO1 08758 speaks for itself and is the best evidence of its
contents with regard to ownership and operation of the various components of the MS4
Cteanup Team Responses to Port RFAs
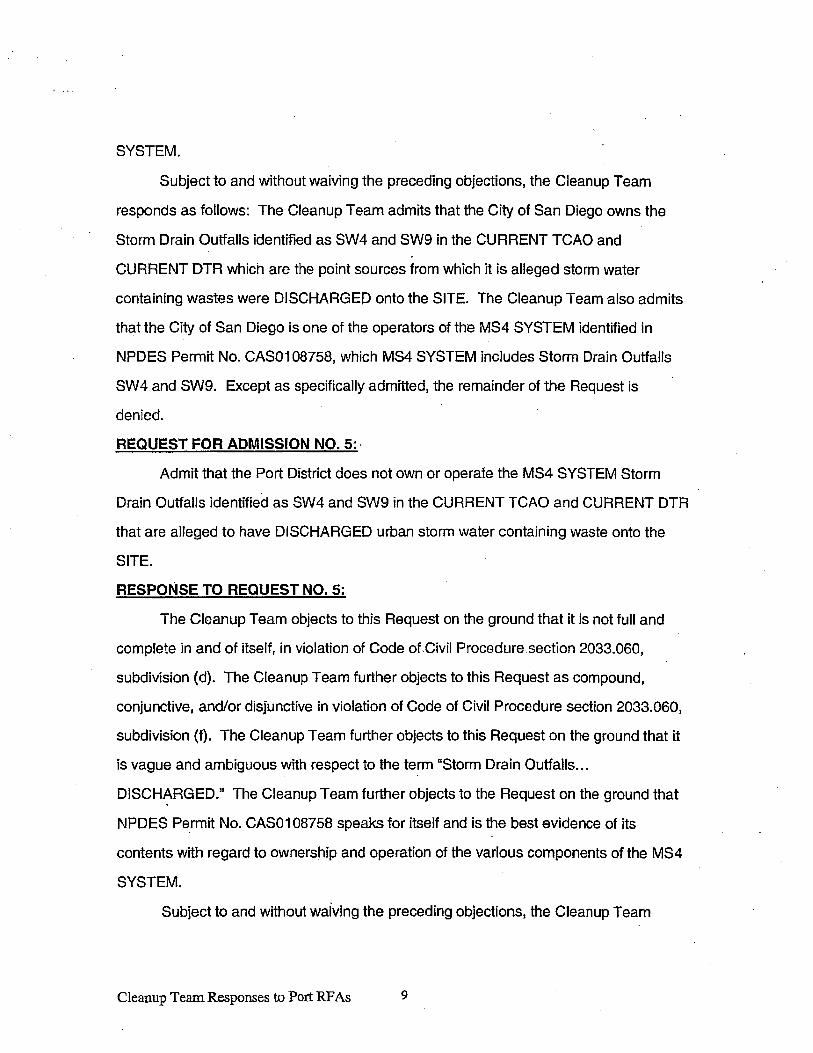
SYSTEM
Subject to and without waiving the preceding objections the Cleanup Team
responds as follows The Cleanup Team admits that the City of San Diego owns the
Storm Drain Outfalls identified as SW4 and SW9 in the CURRENT TCAO and
CURRENT DIR which are the point sources from which it is alleged storm water
containing wastes were DISCHARGEJ onto the SITE The Cleanup Team also admits
that the City of San Diego is one of the operators of the MS4 SYSTEM identified in
NPDES Permit No CASO1 08758 which MS4 SYSTEM includes Storm Drain Ouffalls
SW4 and SW9 Except as specifically admitted the remainder of the Request is
denied
REQUEST FOR ADMISSION NO
Admit that the Port District does not own or operate the MS4 SYSTEM Storm
Drain Ouffalls identified as SW4 and SW9 in the CURRENT TCAO and CURRENT DIR
that are alleged to have DISCHARGED urban storm water containing waste onto the
SITE
RESPONSE TO REQUEST NO.5
The Cleanup Team objects to this Request on the ground that it is not full and
complete in and of itself in violation of Code of Civil Procedure section 2033.060
subdivision The Cleanup Team further objects to this Request as compound
conjunctive and/or disjunctive in violation of Code of Civil Procedure section 2033.060
subdivision The Cleanup Team further objects to this Request on the ground that ii
is vague and ambiguous with respect to the term Storm Drain Outfalls..
DISCHARGED The Cleanup Team further objects to the Request on the ground that
NPDES Permit No CASO1 08758 speaks for itself and is the best evidence of its
contents with regard to ownership and operation of the various components of the MS4
SYSTEM
Subject to and without waiving the preceding objections the Cleanup Team
Cleanup Team Responses to Port RFAs

responds as follows The Cleanup Team admits that the Port does not own the Storm
Drain Outf aIls identified as SW4 and SW9 in the CURRENT TCAO and CURRENT
DTR Except as expressly admitted the Request is denied
REQUEST FOR ADMISSION NO.6
Admit that PERSONS located upgradient from the Port District tidelands have
DISCHARGED urban storm water containing waste into the MS4 SYSTEM FACILITIES
which was conveyed through the Storm Drain Outfalls identified as SW4 and SW9 in the
CURRENT TCAO and CURRENT DTR onto the SITE
RESPONSE TO REQUEST NO.6
The Cleanup Team objects to this Request on the ground that it is not full and
complete in and of itself in violation of Code of Civil Procedure section 2033.060
subdivision The Cleanup Team further objects to this Request as compound
conjunctive and/or disjunctive in violation of Code of Civil Procedure section 2033.060
subdivision The Cleanup Team further objects to the Request on the ground that
NPDES Permit No CASO1 08758 speaks for itself and is the best evidence of its
contents with regard to PERSONS who DISCHARGE to the MS4 SYSTEM The
Cleanup Team further objects to this Request as vague and ambiguous with respect to
the term Port District tidelands The Cleanup Team further objects to this Request as
hopelessly overbroad with respect to PERSONS located upgradient from the Port
District tidelands The Cleanup Team further objects to this Request as beyond the
scope of permissible discovery under the 10.27.10 Order
Subject to and without waiving the preceding objections the Cleanup Team
responds as follows Admit
REQUEST FOR ADMISSION NO.7
Admit that for the tidelands and submerged lands in or adjacent to the SITE that
the State of California has ultimate authority over the Port District to specify the
permitted uses of the SITE how title to the SITE may be held and to whom title to the
Cleanup Team Responses to Port RFAs 10

SITE may revert or be transferred
RESPONSE TO REQUEST NO.7
The Cleanup Team objects to this Request on the ground that it is not full and
complete in and of itself in violation of Code of Civil Procedure section 2033.060
subdivision The Cleanup Team further objects to this Request as compound
conjunctive and/or disjunctive in violation of Code of Civil Procedure section 2033.060
subdivision The Cleanup Team further objects to this Request as vague ambiguous
and grammatically unintelligible The Cleanup Team further objects to this Request on
the ground that the term ultimate authority is vague and ambiguous The Cleanup
Team further objects to this Request on the ground that the San Diego Unified Port
District Act speaks for itself and is the best evidence of its contents.
Subject to and without waiving the preceding objections the Cleanup Team
responds as follows The Cleanup Team lacks information sufficient to form belief as
to whether the State of California has ultimate authority over the Port District to
specify the permitted uses of the SITE how title to the SITE may be held to
whom title to the SITE may revert and to whom title to the SITE may be transferred
and based thereon denies this Request
REQUEST FOR ADMISSION NO.8
Admit that the State of California is in effect the equitable and beneficial property
owner of the tidelands in or adjacent to the SITE
RESPONSE TO REQUEST NO.8
The Cleanup Team objects to this Request on the ground that it is not full and
complete in and of itself in violation of Code of Civil Procedure section 2033.060
subdivision The Cleanup Team further objects to this Request as compound
conjunctive and/or disjunctive in violation of Code of Civil Procedure section 2033.060
subdivision The Cleanup Team further objects to this Request on the ground that
the term is in eftect the equitable and beneficial property owner is vague and
Cleanup Team Responses to Port REAs 11

ambiguous The Cleanup Team further objects to this Request on the ground that the
San Diego Unified Port District Act speaks for itself and is the best evidence of its
contents
Subject to and without waiving the preceding objections the Cleanup Team
responds as follows The Cleanup Team lacks information sufficient to form belief as
to whether the State of California is in effect the equitable owner of the tidelands in
the SITE whether the State of California is in effect the equitable owner of the
tidelands adjacent to the SITE whether the State of California is in effect the
beneficial owner of the tidelands in the SITE and whether the State of California is
in effect the equitable owner of the tidelands adjacent to the SITE and based thereon
denies this Request
REQUEST FOR ADMISSION NO.9
Admit that there were no new facts discovered by YOU between December 2009
and September 2010 to support YOUR revision of the PRIOR TCAO and PRIOR DTR
to name the Port District as DISCHARGER in the CURRENTTCAO and CURRENT
DTR
RESPONSE TO REQUEST NO.9
The Cleanup Team objects to this Request on the ground that it is not full and
complete in and of itself in violation of Code of Civil Procedure section 2033.060
subdivision The Cleanup Team further objects to this Request as compound
conjunctive and/or disjunctive in violation of Code of Civil Procedure section 2033.060
subdivision
Subject to and without waiving the preceding objections the Cleanup Team
responds as follows Denied
With respect to naming the Port as discharger based on its status as an MS4
co-permittee the Cleanup Team determined after December 2009 that its
recommendation to the San Diego Water Board in the PRIOR TCAO and PRIOR DTR
Cleanup Team Responses to Port RFAs 12

that the Port not be named as Discharger was inconsistent with previous State Water
Resources Control Board and SDRWQCB orders concerning the naming of co
permittees in cleanup and abatement orders With respect to naming the Port as
discharger based on its status as trustee/landowner the Cleanup Team determined to
change its recommendation to the SDRWQCB from the PRIOR TCAO based on the
following facts In December 2009 the Cleanup Team believed the Port would
cooperate with the San Diego Water Boards efforts to clean up the Site by contributing
money towards the cost of cleanup including potential insurance proceeds from its
responsible yet absentee and/or non-participating tenants whose policies name the
Port as an additional insured whereas by the time the CURRENT TCAO was issued
the Ports representatives made it clear it does not intend to do so Prior to the
release of the PRIOR TCAO in December 2009 the Port cooperated with the San
Diego Water Boards efforts to clean up the Site by providing expertise to the Cleanup
Team regarding scientific and technical issues whereas by the time the CURRENT
TCAO was issued such coopØration was withdrawn by the Ports representatives
Prior to December 2009 the Cleanup Team believed the Port would cooperate with the
San Diego Water Boards efforts to clean up the Site by identifying and making available
at fair market lease rates potential sediment staging and dewatering locations
whereas by the time the CURRENT TCAO was issued the Ports representatives made
it clear it will not voluntarily do so Prior to December 2009 the Cleanup Team
believed the Port would cooperate with the San Diego Water Boards efforts to clean up
the Site by designating percipient and expert witnesses to testify in support of the
proposed cleanup whereas on July 19 2010 the Ports representatives advised the
San Diego Water Board that the Port was not designating single witness to testify in
support of the cleanup Prior to December 2009 the Cleanup Team believed the
Port would cooperate with the San Diego Water Boards efforts to cleanup up the Site
by assisting both financially and technically with California Environmental Quality Act
compliance whereas by the time the CURRENT TCAO was issued in spite of repeated
Cleanup Team Responses to Port RFAs 13

requests to the Ports representatives by the Cleanup Team for CEQA assistance the
Ports representatives have refused
REQUEST FOR ADMISSION NO 10
Admit that no changed circumstances or conditions occurred from December
2009 to September 2010 to support YOUR revision of the PRIOR TCAO and PRIOR
DTR to name the Port District as DISCHARGER in the CURRENT TCAO and
CURRENT DTR
RESPONSE TO REQUEST NO 10
The Cleanup Team objects to this Request on the ground that it is not full and
complete in and of itself in violation of Code of Civil Procedure section 2033.060
subdivision The Cleanup Team further objects to this Request as compound
conjunctive and/or disjunctive in violation of Code of Civil Procedure section 2033.060
subdivision
Subject to and without waiving the preceding objections the Cleanup Team
responds as follows Denied
With respect to naming the Port as discharger based on its status as an MS4
co-permittee the Cleanup Team determined after December 2009 that its
recommendation to the San Diego Water Board in the PRIOR TCAO and PRIOR DTR
that the Port not be named as Discharger was inconsistent with previous State Water
Resources Control Board and SDRWQCB orders concerning the naming of co
permittees in cleanup and abatement orders With respect to naming the Port as
discharger based on its status as trustee/landowner the Cleanup Team determined to
change its recommendation to the SDRWQCB from the PRIOR TCAO based on the
following changed circumstances In December 2009 the Cleanup Team believed
the Port would cooperate with the San Diego Water Boards efforts to clean up the Site
by contilbuting money towards the cost of cleanup including potential insurance
proceeds from its responsible yet absentee and/or non-participating tenants whose
policies name the Port as an additional insured whereas by the time the CURRENT
Cleanup Team Responses to Port RFAs 14

TCAO was issued the Ports representatives made it clear it does not intend to do so
Prior to the release of the PRIOR TCAO in December 2009 the Port cooperated
with the San Diego Water Boards efforts to clean up the Site by providing expertise to
the Cleanup Team regarding scientific and technical issues whereas by the time the
CURRENT TCAO was issued such cooperation was withdrawn by the Ports
representatives Prior to December 2009 the Cleanup Team believed the Port would
cooperate with the San Diego Water Boards efforts to clean up the Site by identifying
and making available at fair market lease rates potential sediment staging and
dewatering locations whereas by the time the CURRENT TCAO was issued the Ports
representatives made it clear it will not voluntarily do so Prior to December 2009
the Cleanup Team believed the Port would cooperate with the San Diego Water Boards
efforts to clean up the Site by designating percipient and expert witnesses to testify in
support of the proposed cleanup whereas on July 19 2010 the Ports representatives
advised the San Diego Water Board that the Port was not designating single witness
to testify in suppô.rtof the cleanup Prior to Deôember 2009 the Cleanup Team
believed the Port would cooperate with the San Diego Water Boards efforts to cleanup
up the Site by assisting both financially and technically with California Environmental
Quality Act compliance whereas by the time the CURRENT TCAO was issued in spite
of repeated requests to the Ports representatives by the Cleanup Team for CEQA
assistance the Ports representatives have refused
REQUEST FOR ADMISSION NO.11
Admit that in connection with California State Water Resources Control Board
Order No WO 90-3 in the Matter of the Petition of San Diego Unified Port District YOU
advised the State Water Board that the SDRWQCB would take enforcement action
against the Port District only as last resort after the Port had ample opportunity to
compel the Port Districts tenants to comply with SDRWQCB orders
RESPONSE TO REQUEST NO.11
The Cleanup Team objects to this Request on the ground that it is not full and
Cleanup Team Responses to Port RFAs 15

complete in and of itself in violation of Code of Civil Procedure section 2033.060
subdivision The Cleanup Team further objects to this Request as compound
conjunctive and/or disjunctive in violation of Code of Civil Procedure section 2033.060
subdivision The Cleanup Team further objects to this Request on the ground that
the terms in connection with as last resort and ample opportunity are vague and
ambiguous The Cleanup Team further objects to this Request on the ground that it is
irrelevant what the Cleanup Team may have stated to the State Water Resources
Control Board regarding its Order No WQ 90-3 because Order No WQ 90-3 speaks for
itself and is the best evidence of its contents therefore the Request is not reasonably
calculated to lead to the discovery of admissible evidence
Subject to and without waiving the preceding objections the Cleanup Team
responds as follows Denied The Cleanup Team never commented to the State Board
on the cited Order
REQUEST FOR ADMISSION NO 12
Admit that YOUR determination not to name the Port District as Discharger in
the PRIOR TCAO and PRIOR DTR was consistent with previous California State Water
Resources Control Board and SDRWQCB orders concerning the naming of non-
operating public agencies in cleanup and abatement orders
RESPONSE TO REQUEST NO 12
The Cleanup Team objects to this Request on the ground that it is not full and
complete in and of itself in violation of Code of Civil Procedure section 2033.060
subdivision The Cleanup Team further objects to this Request as compound
conjunctive and/or disjunctive in violation of Code of Civil Procedure section 2033.060
subdivision fl
Subject to and without waiving the preceding objections the Cleanup Team
responds as follows The Cleanup Team admits that its recommendation to the San
Diego Water Board in the PRIOR TCAO and PRIOR DTR that it not name the Port as
Cleanup Team Responses to Port RFAs 16

discharger was consistent with previous California State Water Resources Control
Board and SDRWQCB orders concerning the naming of non-operating public agency
landowners in cleanup and abatement orders based on the facts known to the Cleanup
Team as of December 22 2009 Except as expressly admitted the Request is denied
The Cleanup Teams recommendation to the San Diego Water Board in the PRIOR
TCAO and PRIOR DTR that the Port not be named as Discharger was inconsistent
with previous Stale Water Resources Control Board and SDRWQCB order concerning
the naming of co-permittees in cleanup and abatement orders
REQUEST FOR ADMISSION NO 13
Admit that YOUR determination to name Port District as Discharger in the
CURRENT TCAO and CURRENT DTR is inconsistent with previous California State
Water Resources Control Board and SDRWQCB orders concerning the naming of non-
operating public agencies in cleanup and abatement orders
RESPONSE TO REQUEST NO 13
The Cleanup Team objects to this Request on the ground that it is not full and
complete in and of itself in violation of Code of Civil Procedure.sectiori 2033.060
subdivision The Cleanup Team further objects to this Request as compound
conjunctive and/or disjunctive in violation of Code of Civil Procedure section 2033.060
subdivision
Subject to and without waiving the preceding objections the Cleanup Team
responds as follows Denied
New facts and circumstances developed between December 22 2009 and
September 15 2010 that made the Cleanup Teams previous recommendation
inconsistent with previous California State Water Resources Control Board and
SDRWQCB orders concerning the naming of non-operating public agency landowners
in cleanup and abatement orders The facts and circumstances are detailed in the
Cleanup Teams responses to Request Nos and 10 Additionally naming the Port as
Cleanup Team Responses to Port RFAs 17

Discharger based on its status as co-permittee under NPDES Permit No
CAS0108758 is consistent with previous State Water Resources Control Board and
SDRWQCB orders
REQUEST FOR ADMISSION NO 14
Admit that YOU do not allege in the CURRENT TCAO and CURRENT DTR that
any of Port Districts TENANTS at the SITE DISCHARGED waste into the SITE in
violation of any of the TENANTS applicable waste discharge permit requirements that
were issued by YOU since February 1963
RESPONSE TO REQUEST NO 14
The Cleanup Team objects to this Request on the ground that it is not full and
complete in and of itself in violation of Code of Civil Procedure section 2033.060
subdivision The Cleanup Team further objects to this Request as compound
conjunctive and/or disjunctive in violation of Code of Civil Procedure section 2033.060
subdivision
Subject to and without waiving the preceding objections the Cleanup Team
responds as follows Denied
It is violation of each and all of the applicable permits of the Ports TENANTS
as well as the Ports MS4 permit to cause or permit or threaten to cause or permit
waste to be discharged or deposited where it is or probably will be discharged into
waters of the state and creates or threatens to create condition of pollution or
nuisance
REQUEST FOR ADMISSION NO 15
Admit that Campbell Industries nc is the corporate successor of former SITE
TENANT San Diego Marine Construction Corporation formerly known as MCCSD
REPONSETO REQUEST NO 15
The Cleanup Team objects to this Request on the ground that it is not full and
complete in and of itself in violation of Code of Civil Procedure section 2033.060
Cleanup Team Responses to Port RFAs 18
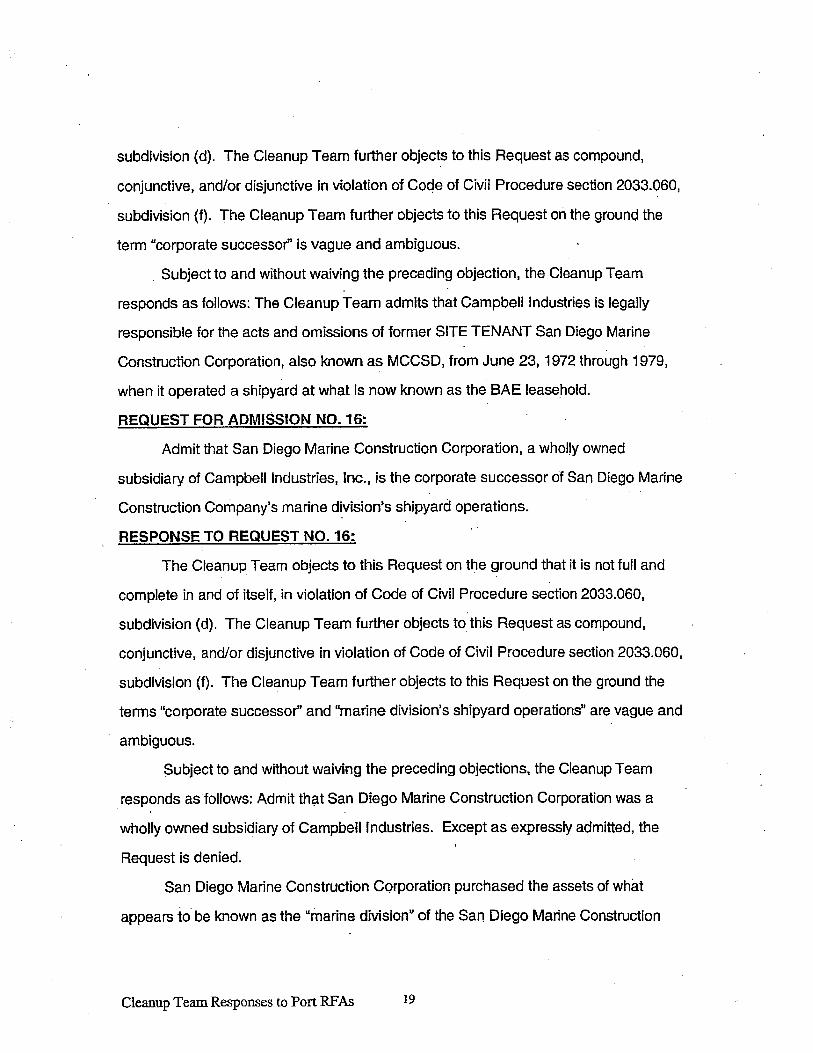
subdivision The Cleanup Team further objects to this Request as compound
conjunctive and/or disjunctive in violation of Code of Civil Procedure section 2033.060
subdivision The Cleanup Team further objects to this Request on the ground the
term corporate successor is vague and ambiguous
Subject to and without waiving the preceding objection the Cleanup Team
responds as follows The Cleanup Team admits that Campbell Industries is legally
responsible for the acts and omissions of former SITE TENANT San Diego Marine
Construction Corporation also known as MCCSD from June 23 1972 through 1979
when it operated shipyard at what is now known as the BAE leasehold
REQUEST FOR ADMISSION NO 16
Admit that San Diego Marine Construction Corporation wholly owned
subsidiary of Campbell Industries Inc is the corporate successor of San Diego Marine
Construction Companys marine divisions shipyard operations
RESPONSE TO REQUEST NO 16
The Cleanup Team objects to this Request on the ground that it is not full and
complete in and of itself in violation of Code of Civil Procedure section 2033.060
subdivision The Cleanup Team further objects to this Request as compound
conjunctive and/or disjunctive in violation of Code of Civil Procedure section 2033.060
subdivision The Cleanup Team further objects to this Request on the ground the
terms corporate successor and marine divisions shipyard operations are vague and
ambiguous
Subject to and without waiving the preceding objections the Cleanup Team
responds as follows Admit that San Diego Marine Construction Corporation was
wholly owned subsidiary of Campbell Industries Except as expressly admitted the
Request is denied
San Diego Marine Construction Corporation purchased the assets of what
appears to be known as the marine division of the San Diego Marine Construction
Cleanup Team Responses to Port RFAs 19

Company
REQUEST FOR ADMISSION NO 17
Admit that the Port Districts TENANT Star Crescent Boat Company is the
corporate successor of the operations of San Diego Marine Construction Companys
boat division known as Star and Crescent Boat Company
RESPONSE TO REQUEST NO 17
The Cleanup Team objects to this Request on the ground that it is not full and
complete in and of itself in violation of Code of Civil Procedure section 2033.060
subdivision The Cleanup Team further objects to this Request as compound
conjunctive and/or disjunctive in violation of Code of Civil Procedure section 2033.060
subdivision The Cleanup Team further objects to this Request on the ground the
term corporate successor of the operations is vague and ambiguous
Subject to and without waiving the preceding objections the Cleanup Team
responds as follows Admit
REQUEST FOR ADMISSION NO 18
Admit that YOU are responsible for issuing permits regulating the discharge of
storm water and other discharge point sources onto the SITE
RESPONSE TO REQUEST NO 18
The Cleanup Team objects to this Request on the ground that it is not full and
complete in and of itself in violation of Code of Civil Procedure section 2033.060
subdivision The Cleanup Team further objects to this Request as compound
conjunctive and/or disjunctive in violation of Code of Civil Procedure section 2033.060
subdivision The Cleanup Team further objects to this Request on the ground that
the term other discharge point sources is vague and ambiguous
Subject to and without waiving the preceding objections the Cleanup Team
responds as follows While the Cleanup Team is not responsible for issuing permits it
admits that the SDRWQCB is responsible for issuing permits regulating the discharge of
Cleanup Team Responses to Port RFAs 20

storm water and other pollutants from point sources to waters of the state including
those waters at the SITE
REQUEST FOR ADMISSION NO 19
Admit That YOU issued permits to the Port Districts TENANTS who are currently
leasing the tidelands in or adjacent to the SITE including San Diego Gas Electric
Company National Steel and Shipbuilding Company and BAE Systems San Diego
Ship Repair Inc regulating the TENANTS storm and waste water DISCHARGES onto
the SITE
RESPONSE TO REQUEST NO 19
The Cleanup Team objects to this Request on the ground that it is notfuU and complete
in and of itself in violation of Code of Civil Procedure section 2033.060 subdivision
The Cleanup Team further objects to this Request as compound conjunctive and/or
disjunctive in violation of Code of Civil Procedure section 2033.060 subdivision The
Cleanup Team further objects to this Request on the ground that the term regulating
the TENANTS storm and waste water DISCHARGES onto the SITE is vague and
ambiguous and that the referenced permits speak for themselves and are the best
evidence of their contents
Subject to and without waiving the preceding objections the Cleanup Team
responds as follows While the Cleanup Team did not issue permits it admits that the
SDRWQCB issued permits to the referenced TENANTS which permits speak for
themselves and are the best evidence of their contents
REQUEST FOR ADMISSION NO 20
Admit that YOU issued storm and waste water DISCHARGE permits to the Port
Districts TENANTS who are currently leasing the tidelands in or adjacent to the SITE
including San Diego Gas Electric Company National Steel and Shipbuilding
Company and BAE Systems San Diego Ship Repair Inc that contained water quality
based effluent limitations which permitted the TENANTS to DISCHARGE waste onto
Cleanup Team Responses to Port RFAs 21

the SITE that contained certain levels of contaminants of concern that are identified in
the CURRENT TCAO and CURRENT DTFI including but not limited to chromium
copper nickel and zinc
RESPONSE TO REQUEST NO 20
The Cleanup Team objects to this Request on the ground that it is not full and
complete in and of itself in violation of Code of Civil Procedure section 2033.060
subdivision The Cleanup Team further objects to this Request as compound
conjunctive and/or disjunctive in violation of Code of Civil Procedure section 2033.060
subdivision
Subject to and without waiving the preceding objections the Cleanup Team
responds as follows While the Cleanup Team did not issue permits it admits that the
SDRWQCB issued some permits to some of the TENANTS referenced in the Request
that contain water quality based effluent limitations for chromium copper nickel and
zinc while other issued permits to the TENANTS referenced in the Request are BMP
based
REQUEST FOR ADMISSION NO.21
Admit that the storm and waste water DISCHARGES that YOU permitted the
Port Districts TENANTS who are currently leasing the tidelands in or adjacent to the
SITE including San Diego Gas Electric Company National Steel and Shipbuilding
Company arid BAE Systems San Diego Ship Repair Inc to DISCHARGE onto the
SITE contained waste that contributed to the alleged contamination of the sediment at
the SITE
RESPONSE TO REQUEST NO.21
The Cleanup Team objects to this Request on the ground that it is not futl and
complete in and of itself in violation of Code of Civil Procedure section 2033.060
subdivision The Cleanup Team further objects to this Request as compound
conjunctive and/or disjunctive in violation of Code of Civil Procedure section 2033.060
Deanup Team Responses to Port RFAs 22

subdivision The Cleanup Team further objects to the Request on the ground that it
is vague ambiguous and grammatically unintelligible
Subject to and without waiving the preceding objections the Cleanup Team
responds as follows Denied
The Cleanup Team does not permit DISCHARGES While the SDRWQCB
issues permits that allow certain DISCHARGES it is violation of each and all of the
applicable permits of the Ports TENANTS as well as the Ports MS4 permit to cause or
permit or threaten to cause or permit waste to be discharged or deposited where it is
or probably will be discharged into waters of the state and creates or threatens to
create condition of pollution or nuisance
REQUEST FOR ADMISSION NO 22
Admit that the Port District does not have authority to impose more stringent
requirements on its TENANTS storm water discharges than those imposed by YOU
RESPONSE TO REQUEST NO. 22
The Cleanup Team objects to this Request as compound conjunctive and/or
disjunctive in violation of Code of Civil Procedure section 2033060 subdivision
Subject to and without waiving the preceding objection the Cleanup Team
responds as follows Denied
The Cleanup Team does not impose requirements on storm water discharges
The Cleanup Team lacks infomiation sufficient to form belief about the scope of the
Ports authority as special government agency that holds and manages land in trust
for the People of the State or as lessor engaged in commercial transaction with its
lessees to impose requirements on its TENANTS storm water discharges and based
thereon denies this Request
REQUEST FOR ADMISSION NO 23
Admit that the Port District has never been cited by YOU for violating the terms of
the current or prior MS4 SYSTEM permits YOU issued to the Port District and the other
Cleanup Team Responses to Port RFAs 23

MS4 SYSTEM co-permitees RELATING TO DISCHARGES onto the SITE
RESPONSE TO REQUEST NO 23
The Cleanup Team objects to this Request on the ground that it is not full and
complete in and of itself in violation of Code of Civil Procedure section 2033.060
subdivision The Cleanup Team further objects to this Request as compound
conjunctive and/or disjunctive in violation of Code of Civil Procedure section 2033.060
subdivision
Subject to and without waiving the preceding objections the Cleanup Team
responds as follows Admit
REQUEST FOR ADMISSION NO 24
Admit that the Port District did not have knowledge of all of the waste
DISCHARGES into the SITE since February 1963 for which YOU seek to hold it
primarily liable
RESPONSE TO REQUEST NO 24
The Cleanup Team objects to this Request on the ground that it is not full and
complete in and of itself in violation of Code of Civil Procedure section 2033.060
subdivision The Cleanup Team further objects to this Request as compound
conjunctive and/or disjunctive in violation of Code of Civil Procedure section 2033.060
subdivision
Subject to and without waiving the preceding objections the Cleanup Team
responds as follows Denied
The Port has sufficient knowledge of the activities of its TENANTS which are
controlled by the terms of its leases with those TENANTS and the mechanics and
operations of the MS4 SYSTEM of which it is co-permittee to name it as
Discharger
Cleanup Team Responses to Port RFAs 24

Dated January 2010 CALIFORNIA REGIONAL WATERQUALITY CONTROL BOARD SANDIEGO REGION CLEANUP TEAM
By
Christian Carrigan
Cleanup Team Responses to Port RFAs 25

SAN DIEGO UNIFIED PORT DISTRICT WRITTEN DISCOVERY RESPONSE
VERIFICATION
David Barker declare
am the Branch Chief of the Surface Waters Basins Branch and Supervising
Water Resource Control Engineer at the California Regional Water Quality Control
Board San Diego Region San Diego Water Board am the designated manager of
the Cleanup Team for the San Diego Water Boards proceedings to consider the
development and issuance of cleanup and abatement order for discharges of metals
and other pollutant wastes to San Diego Bay marine sediments and waters at Site
10referred to as the Shipyard Sediment Site am authorized to make this verification on
behalf of the San Diego Water Boards Cleanup Team
12
have read the foregoing Regional Board Cleanup Teams Responses
13
Objections to Designated Party San Diego Unified Port Districts First Set of Requests
14
for Admissions Regional Board Cleanup Teams Responses Objections to Designated
Party San Diego Unified Port Districts First Set of Requests for Production of
16
Documents and Regional Board Cleanup Teams Responses Objections to
17
Designated Party San Diego Unified Port Districts First Set of Special Interrogatories
18
and know their contents am informed and believe that the matters stated therein are
19true and on that ground certify or declare under penalty of perjury under the laws of the
20State of California that the same are true and correct
21
Dated January 52011
24 David Barker
25
26
27
28
Cleanup Teams Verification of Discovery Responses to Sari Diego Unified Port District

1237

riii
2247SanOegoAvenu9Swie 135
San iego CA 921 10
619280-0730LIJIJJ JUN
Pax 619 260-0725
vw.enVametlC5.COm
Mr John Robertus
Executive Officer
Regional Water Quality Control Board EXHIBIT NO._
9174 Sky Park Court Suite 100 /2_31
San Diego CA 92123
fax 858 571-6972 _______________
rb9agendawaterboards.Ca.goV
June 15 2005
Attn Agenda for Sediment Cleanup
Re Comments on Tentative CAO R9-2005-0126 dated April 29 2005
Dear Mr Robertus
We provide the following comments for consideration by the Regional Water Quality
Control Board RWQCB members and staff Please note that the following technical
comments on the Tentative C`O are summary in nature due to the RWQCB only
releasing summary-level findings without supporting data and calculations references or
citations or Staff Report These comments were prepared by ENY America consultant
toSDGE
Comments on PERSONS RESPONSIBLE Finding SDGEWe disagree with the RWQCB finding that there are data or other technical information
that support naming SDGE as discharger in the Tentative CAO In Finding the
RWQCB makeS statements about SDGEs former operations at Silver Gate powei
plant and concludes that these statements are the basis for naming SDGE as
discharger While the RWQCB does not cite reference for the statements made about
SDGEs operations it appears that the RWQCB has taken these observations from
SDGEs Investigation Order 10 reports prepared by ENV America Incorporated
2004aT and 2004b2
The available data presents compelling argument that SDGE was not and is not
discharger to marine sediments We draw your attention to the primary conclusion from
ENV America 2004a Site Assessment Report Landside Tidelands Lease Area Silver Gate Power Plant
San Diego California July 14 Prepaind for SDGE Provided to RWQCB in July 2004
2ENV America 2004b Technical Report for RWQCB Investigation Order No R9-2004-0026 Silver Gate
Power Plant San Diego California July 14 Prepared for SDGE Provided to RWQCB in Ji1y 2004
\SDGESiIverg2tedmefltS\CAOttntZttVC\ENV comments on Tentative CAO.doc
o3-oOSARI 96043

Comments on Tentative CAO R9-2005-0126
______ June 152005
AMERICA Page2
the JO report and SDGEs pending site assessment work The primary conclusion and
recommendation from SDGEs 10 report was
The Exponent 2003 sediment sampling stations in the SDGE wharf leasehold
and the north portion ofSWMs wharf leasehold were spaced ovet 100feet apart
sparse and there were only three sediment sampling stations in SDGEleasehold The data indicate that SDGE discharges were not cause of
sediment contamination Additional data are recommended to conclude with
certainty that SDGE discharges were not cause of sediment contamination
ENV America 2004b page 34
Recognizing that there is uncertainty SDGE is planning to conduct its own sampling of
bay sediments On May 16 2005 the RWQCB was provided with SDGEs workplan
to independently sample and analyze sediments to determine if SDGE operations
contributed to sediment contamination ENV America 2005 SDGE plans to conduct
sampling in July of 2005 and to publish the results by November 2005
Given that there is little evidence that SDGE was or is discharger the RWQCBshould refrain from considering SDGE to be discharger until SDGE has completed
its own sediment sampling analysis and data evaluation and there are sufficient data to
conclude with certainty whether SDGE was or was not contributor to contamination
in bay sediments
The following explains why specific statements in Finding of the Tentative CAO are
erroneous or misleading
The RWQCB erroneously concludes that operational history and site assessment data
from former wastewater ponds indicates that the ponds discharged or threaten to
discharge PCBs or other contaminants to San Diego Bay The RWQCB correctly states
that SDGE operationsincluded discharging of wastes to holding ponds but the
RWQCB errs when it states that the detection of PCBs in one of two former ponds is
evidence that SDGE was source of PCBs detected in the bay sediments Substantial
data and information refute the RWQCBs linking ofPCBs in bay sediments to SDGE
operations and the data strongly indicate that PCBs and PCTs detected in sediment
originated from releases in the vicinity of the shipyard marine railways and the landward
end of Pier
The concentration trends in the sediment data strongly indicate that the primary
source of PCBs and PCTs in the northern end of Exponent Sediment Investigation
study area was in the vicinity of the shipyard marine railways at the landward end
of Pier ENV America 2004b 2005 inparticular see Figure hi ENV
America which presents and illustrates more complete record of P0data than was presented in Exponents Sediment Investigation
ENV America 2005 Sediment Sampling Workplan Silver Gate Power Plant San Diego California
March 29 Prepared for SDGE Provided to RWQCB on May 16 2005
p\SDCF\silvergate\sedlifleflts\CAO tentative\ENV comments on Tentative cAOt
SARIQSflSS

Comments on entative CAO R9-2005-0 126
June 152005
Page3
PCBs were detected in only two samples from one of SDGEs fonner
wastewater ponds at maximum concentration of 2.8 ppm Aroclor 1260 ENVAmerica 2004a which is concentration far lower than was detected in bay
sediments The maximum concentration of total PCBs detected in bay sediments
in the north end of the Exponent Sediment Investigation study area was 34 ppm
location 3W08 which also had the highest concentration of PCTs ENVAmerica 2005 If the former wastewater ponds were source of PCBs detected
in bay sediments then one would expect to see the highest PCB concentrations in
the former wastewater ponds The concentration trends do not indicate that the
former wastewater ponds were source of PCBs on the contrary the
concentration trends indicate that the shipyard was the primary source of PCBs
The concentration trends indicating that the shipyard is the primary source of
PCBs is consistent with literature about PCBs and ships
PCBs are known problem in the shipbreaking industry and in older
vessels PCBs are encountered in variety of materials including
...rubber products such as hoses plastic foam insulation cables silver
paint habitability paint felt under septum plates plates on top of the hull
bottom and primary paint on hull steel OSHA Fact Sheet
Shipbreaking 2001
PCBs are found throughout older vessels and it is likely your ship
scrapping facility will be faced with managing large quantifies of PCBs
Guide for Ship Scrappers USEPA 31 5-B0-00-00l
The affected soil beneath the former wastewater ponds does not threaten to
discharge to the bay ENV America 2004a demonstrated that the affected
soil of the former wastewater ponds is burial beneath several feet of clean soil
and pavement which means the affectedsoil is not current or potential future
source of contaminated surface runoff if left undisturbed and the
groundwater samples collected from beneath the former wastewater ponds did not
have detectable PCBs PCBs generally do not migrate in groundwater ENV
America 2004a demonstrated that the groundwater concentrations beneath the
former wastewater ponds are below applicable regilatory criteria and there is no
threat to the bay via the groundwater migration pathway
The plant records indicate that fonuer wastewater ponds were used for treatment
or disposal of the power plant bilge trench water and given that no P03s were
detected in the power plants bilge trenches it is unlikely that the source of PCBs
detected in the former wastewater pond was the power plant operations The
power plants bilge trenches were the receiver or collector of many of the low
volume liquid waste discharges from the power house If PCBs had been released
in the power house then it is likely that PCBs would have been detected in the
bilge trenches
P\SDJE\SilvergatC\sedifltfltCAO tcntative\ENV comments on Tentative CAO4oc
SARI 96045

Comments on lentative CAO R9-2005-0126
______ June 15 2005
IIPage4
number of records photographs an engineering drawing and lease records
document that the shipyard subleased the land parcel containing the wastewater
ponds and in the late 960s or early 970s the shipyard operations are appears to
have encompassed the open wastewater pond Records also indicate that the
shipyard constructed decking above the wastewater pond to enable shipbuilding
or ship repair activities to be performed over the pond area
PCBs were not used in appreciable quantities in the power plant and substation
The only known uses of PCBs in the powerhouse were in small closed systems
such as in capacitorsand fluorescent light ballasts similar to the use of PCBs in
many older commercial or residential buildings The transformers in SDGEs
Silver Gate substations and switchyard did not contain PCB dielectric fluids and
contained only trace PCBs
SDGE is continuing to research records on PCB uses and occurrences at Silver Gate
power plant and will provide additional supporting documentation to the RWQCB in
future transmittal
There is no conclusive evidence linking SDGE discharges to contamination in found in
marine sediments The 10 report ENV America 2004b addressed the RWQCBs earlier
allegations4 that SDGEs operations contributed to elevated concentrations of cadmium
chromium mercury nickel and PCTs in marine sediment We note that the RWQCB
through issuing the new Tentative CAO without maintaining earlier allegations concurs
with ENV Americas 2004b conclusion that data indicate that SDGE did not
contribute to elevated concentrations of cadmium mercury nickel and PCTs in marine
sediment
The following comments address the RWQCBs new allegations in the Tentative CAO
that SDGEs non-contact cooling water discharges contributed pollutants to marine
sediments including chromium iron copper total suspended solids TSS and petroleum
hydrocarbon on the basis of waste discharge monitoring records
The patterns of contaminant distribution in sediment do not indicate that the
cooling water discharges were source of contaminants in sediment on the
contrary the concentration trends indicate that the shipyard and City storm water
discharges were the source of contaminants in sediment see Exponent Sediment
Investigation and ENV America 2004b and 2005
SDGEs historical chromium exceedances in cooling water were minor and the
form of chromium found in bay sediments at the shipyard is unlikely to have
come from SDGEs discharges but is likely to have come from shipyard
discharges ENV America 2004b documented that the only known use of
Finding 10 of Investigation Order No R0-2004-0026
p\5DQE\5ilvergate\scdimcnts\CAO tentative\ENv comments on Tentative CAO4oe
SARI 96046

Comments on tentative CAO R9-2005-0126
______ June 152005
AMERICA PageS
chromium at Silver Gate power plant was sodium diebromate which was used as
corrosion inhibitor in the service water system Exponents Sediment
Investigationand Technical Memorandum of April 2004 documented that in
sediments more than 80 percent of the relative mass of chromium was present as
iron-chromium oxide and 60 percent of the relative mass of chromium was
present as chalcopyrite copper-zinc oxide and slag The major source of the
primary chromium forms found in sediment was most likely shipyard wastes
such as sand blasting grit blasting grit is commonly ore slag source of the
mineral chalcopyrite and other forms of chromium alloy steels and other metal
debris most alloy steels contain chromium and stainless steel contains over 10
percent chromium and paint debris chromium is used in many pigments
Major waste streams in current and historical shipyard operations are sand blast
grit steel debris and paint debris
SDGEs historical iron and TSS exceedances in cooling water were minor and
are not relevant because iron and TSS are not rare constituents nor are they
identified as chemicals of concern in the shipyard cleanup
Comment on FACTUAL BACKGROUND
Finding 11 in the Tentative CAO in its entirety states
SEDIMENT QUALITY INVESTIGATION Unless otherwise explicitly
stated the RWQCBs finding and conclusions in this Cleanup and Abatement
Order are based on the data and other technical information contained in the
report prepared by NASSCOs and Southwest Marines consultant Exponent
entitled NASSCQ and Southwest Marine Detailed Sediment Investigation
September 2003
Finding 11 is incorrect We find that the RWQCB in drafting the Tentative CAO
presents data and much other technical information that was not contained in the
Exponent Sediment Investigation For instance the Tentative CAO presents Summary
of Economic Feasibility Evaluation Finding 33 that appears to be based on engineering
calculations by NOAA presented in the following documents
Memorandum from NOAA to RWQCB dated February 23 2005 Re
Calculation of Dredging Volumes at the NASSCO and Southwest Marine
Shipyards for Alternative Remedial Scenarios
Memorandum from NOAA to RWQCB dated March 14 2005 Addendum to
Memorandum dated February 23 2005 Re Calculation of Dredging Volumes at
the NASSCO and Southwest Marine Shipyards for Altemative Remedial
Scenarios
Memorandum from NOAA to RWQCB dated April 12 2005 Re Calculation
of post-dredging area weighted averages at the NASSCO and Southwest Marine
Shipyards for Alternative Remedial Scenarios
P\SDGE\Sitversate\SedilDeflt5CA0 tentative\ENv comments on Tentative CAOAoc
SARI 9Gfl47

Comments on lentative CAO R9-2005-0126
______ Jujie 15 2005
AMERICA Page6
Memorandum from NOAA to RWQCB dated May 12 2005 Re Calculations
of Dredging Volumes at the NASSCO and Southwest Marine Shipyards for Five
Times Baseline Remedial Scenario Using itT PCB and Benzoapyrene BA
We observed that the Sediment Investigation reportavailable to us via posting on the
RWQCB website is dated October 2003 and is not dated September 2003 as cited in
the Tentative CAO We request that the RWQCB provide us copy of the September
2003 report if the citation was correct
Comment on Finding 15 BASELINE SEDIMENT QUALITY CONDITIONS
and Finding 31 BACKGROUND SEDIMENT QUALITYWe note that the RWQCB has published background sediment chemistry levels that are
different than those published in Exponents Sediment Investigation Please explain why
-and how the RWQCB calculated new background concentrations particularly in light of
the extensive plans correspondence and discussion that preceded Exponents
development of background concentrations
Comments on evaluation of baseline risk in
Aquatic life beneficial use impairment Findings 12 to 21
Aquatic-dependent wildlife beneficial use impainnent Findings 22 to 25
Human health beneficial use impairment Findings 26 to 29
We note that the RWQCB and Exponent in evaluating baseline risk used substantially
different assumptions and input values and arrived at substantially different conclusions
about impairment of beneficial uses We found it difficult to review or understand the
RWQCBs risk assessments because the RWQCB did not provide explanations in the
Tentative CAO to explain why and how the RWQCB deviated from project guidance
project plans and Exponents Sediment Investigation results Please explain why and
how the RWQCB chose to use different assumptions and input values for evaluating risk
We noted large number of apparent inadequacies in the risk evaluations and to
minimize the length of these comments we directed our comments to only the human
health risk assessment Findings 26-29 These same comments or similar comments
also apply to the risk assessments the RWQCB performed for aquatic-dependent wildlife
Findings 22-25
The RWQCB incorrectly used fractional intake Flof for the screening Tier and
baseline Tier II human health risk assessments Given that the shipyard area is now and
will continue to be an operating shipyard with strict enforced prohibitions on public
fishing access it is inappropriate to use fractional intake of to conduct risk
assessments using tissue concentrations from fish and shellfish with high site fidelity
The approach used to perform baseline risk assessments in California when there is no
foreseeable change in site use is to conduct risk assessments using reasonable
assumptions and inputs based on the current site use or planned future site use The
RWQCB should recalculate the baseline human health risk assessment using an
appropriate exposure scenario and inputs based on the current and planned site use
p\5flGE\SiIvergate\sedimefltS\CAOteniative\ENv comments on Tentative CAOAoc
SAPIARO4B
_____
on_I entative C`O R9-2005-OI 26
_____ Jtme 15 2005
AMERICA Page7
The RWQCB presents generalized conclusions that do not adequately portraybaseline
risks and possibly incorrectly portray baseline risks For instance the RWQCB in
Finding 29 states that they quantified calculated the baseline carcinogenic risks and
hazard quotients for four assessment areas and one reference background area but the
RWQCB presented only one assumption the Fl of the dozen or more the assumptions
necessary to establish baseline risk assessment and the RWQCB did not present the
quantified results the numerical results except to say that the undisclosed numbers were
above or below particularrisk index number For instance in just one example the
RWQCB in Finding 29 indicates that the concentrations from whole body Sand Bass
caught inside the SWM leasehold had an undisclosed carcinogenic risk number above
xl0 the same fish speciesfrom the background area had an undisclosed carcinogenic
risk number above 1x10⁶ PCBs presented 96 percent of the cumulative cancer risk and
the RWQCB concluded that the area inside the SWM leasehold poses theoretical
increased cancer risk Because the RWQCB did not presented the numerical results from
the risk assessment the RWQCB has not demonstrated whether there is significant
difference between background risk and site risk the RWQCB has not revealed the
amount of increase in the theoretical cancer risk and the RWQCB has presented
insufficient data to contribute to arid initiate meaningful and detailed discussion about
baseline risk We request that the RWQCB publish the full results of the risk assessment
Comment on Finding 33 ECONOMIC FEASIBILITY CONSIDERATIONS
The Tentative CAO does not present quantifiedrisk levels associated with the cleanup
levels of 5x lOx 15x and 20x background for TBT Ba and PCBs In the table iii
Finding 33 the RWQCB indicates that they determined what the long-term effects may
be for cleanup to 5x Ox 5x and 20x background for TBT BaP and PCBs The long-
term effects are ranked on scale of 10 to -5 and the assigned scores appear to be
qualitative scores On project of this magnitude having an abundance of scientific data
the RWQCB should evaluate effects on beneficial uses using scientific relationships
between chemistry and risk i.e quantifiedrisk assessments
Comment on Finding 34 ALTERNATWE SEDIMENT CLEANUP LEVELS
The cleanup levels proposed by the RWQCB are not consistent with Section Il.a.9 of
SWRCB Resolution No 92-49 Policies and Procedures for Investigationand Cleanup
and Abatement ofDischarges Under Water Code Section 13304 which states that the
RWQCB shall.. Prescribe cleanup levels which are consistent with appropriate levels
set by the RWQCB for analogous discharges that involve similar wastes site
characteristics and water qualityconsiderations.. The RWQCB is currently proposing
cleanup levels that are based on baseline risk assessment exposure scenarios and
assumptions that are inconsistent with the current practice in California and the RWQCB
is proposing cleanup levels that are far lower than previously set for analogous projects at
Campbell Shipyard Shelter Island Boat Yard Americas Cup Harbor Paco Terminals
and Teledyne Ryan The RWQCB should revise its risk assessment models to use
appropriate site-specific exposure scenarios and input values consistent with the standard
practicesused in California and the RWQCB should prescribe cleanup levels consistent
with the prior cleanups in San Diego Bay
P\SDE\SilvetgatŒSedilfleflIS\CAO tcntative\ENV comments on Tentative CAO.doo
SARI 96049

Comments on entative CAO R9-2005-0 126
June 152005
Page8
The cleanup levels that the RWQCB is proposing for metals are without precedence and
are probably not practical to achieve in the field We note that the RWQCB is proposing
cleanup levels that are approximately equal to background see table below and appear
to have no foundation in risk assessment The proposed cleanup levels for metals appear
to have been chosen by selecting the predicted residual concentrations that would exist
after cleanup of TBT BaP and PCB We recommend the RWQCB consider using risk-
based cleanup levels for metals and establish cleanup levels only for those metals that
significantly contribute to risk
Chemical Units RWQCB RWQCB CU RWQCB Exponent
proposed level as background background
CU level multiples of 95% UPL 95% UPL
background
Arsenic mg/kg 10 1.33 7.5
Cadrniuni mg/kg 3.03 0.33 0.29
Chromium mg/kg 81 1.42 57 57
Copper mg/kg 200 1.65 121 120
Lead mg/kg 90 1.70 53 48
Mercury mg/kg 0.7 1.23 0.57 0.56
Nickel mg/kg 20 1.33 15 17
Silver mg/kg 1.5 1.36 1.1
ZInc mg/kg 300 1.56 192 210
Tributyltin ug/kg 110 22 5.1
Benzoapyrerie ug/kg 1010 202
PCB total ug/kg 420 84 36
congeners
Thank you for the opportunity to submit these comments
response
Sincerely
ENV America Incorporated
MttThomas ider PC CHg CEO
619 260-0730 extension 21
cc Tom Alo RWQCBKen Rowland SDGEVincent Gonzales Sempra Energy
We look forward to your
P\SDCE\SiIeigatsediments\CAO tentative\ENV comments on Tentative CAOdoc
SARI 4flfl

1238
Appendix
ECONOMIC CONSIDERATIONS OF PROPOSED AMENDMENTS TO THE
SEDIMENT QUALiTY PLAN FOR ENCLOSED BAYS AND ESTUARIES IN
CALIFORNIA
January 2011
State Water Resources Control Board
Division of Water Quality
1001 Street
Sacramento CA 95814
EXHIBIT NO._
J3a/q

Table of Contents
Executive SummaryES-i
Introduction 1-1
1.1 Background 1-1
1.2 Scope of the Economic Analysis1-1
1.3 Organization of the Report 1-2
Baseline for the Analysis 2-1
2.1 Existing Objectives 2-1
2.2 Monitoring 2-1
2.3 Municipal and Industrial Dischargers 2-3
2.4 Storm Water Discbargers 2-4
2.4.1 Municipal Discharges 2-4
2.4.2 Industrial Discharges 2-5
2.4.3 Construction 2-5
2.4.4 Caltrans 2-5
2.5 Nonpoint Sources 2-5
2.5.1 Agriculture 2-6
2.5.2 Forestry2-7
2.5.3 Urban Runoff 2-8
2.5.4 Marina and Recreational Boating2-8
2.5.5 Abandoned and Inactive Mines 2-9
2.5.6 Atmospheric Deposition 2-10
2.5.7 Wetlands 2-11
2.6 Current Impaired Waters 2-li
2.7 Sediment Cleanup and Remediation Activities 2-12
2.7.1 Bay Protection and Toxic Cleanup Program 2-12
2.7.2 TMDLs 2-16
2.7.3 Cleanup and Abatement Orders 2-17
2.7.4 Contaminated Sediment Task Force 2-17
Description of the Amendments 3-1
3.1 Applicability 3-i
3.2 Sediment Quality Objectives 3-1
3.3 Implementation Procedures 3-1
3.4 Monitoring and Assessment 3-2
3.5 Attainment 3-2
Methods of Compliance and Potential Costs 4-1
4.1 Monitoring and Assessment 4-1
4.2 Potential Controls 4-3
4.2.1 Municipal and Industrial Facilities 4-3
4.2.2 Agriculture 4-3
4.2.3 Storm Water 4-4
4.2.4 Marinas and Boating Activities 4-5
4.2.5 Wetlands 4-5
4.2.6 Cleanup and Remediation Activities 4-6
Analysis of Statewide Costs 5-1
5.1 Sediment Quality and Costs in the Absence of the Plan 5-1
5.2 Sediment Quality and Costs under the Plan 5-1
5.3 Uncertainties 5-1
References 6-i
January2011

Appendix Current Narrative Objectives Applicable to Sediment Quality A-i
Appendix Current Water Quality ObjectivesB-i
Appendix Nonpoint Source Plan Management Measures C-i
Appendix Current Toxics 303d Listings and TMDLs D-
Appendix Toxic Hot Spots for Bays and Estuaries E-i
Appendix Control Costs F-i
January2011 ii

List of Exhibits
Exhibit ES-i Potential Incremental impacts Associated with the Proposed Plan Amendments ES-2
Exhibit ES-2 Incremental Sampling Costs to Assess Finfish and Wildlife Health1 ES-3
Exhibit 2-i Summary of Individual-Permitted NPDES Dischargers in California 2-4
Exhibit 2-2 Summary of Current 303d List for Toxics for Bays and Estuaries in California 2-12
Exhibit 2-3 Toxic Hot Spot Ranking Criteria 2-13
Exhibit 2-4 Summary of Actions and Costs to Address High Priority Known Toxic Hot Spots 2-13
Exhibit 3-1 Potential Lncremental Impacts Associated with the Proposed Plan Amendments 3-3
Exhibit 4-1 Incremental Sampling Costs to Assess Finfish and Wildlife Health1 4-1
Exhibit 4-2 Potential Number of Samples to Assess Compliance 4-2
January2011iii

Acronyms and Abbreviations
BAT Best available technology economically achievable
BCT Best conventional pollutant control technology
BMPs Best management practices
BPTCP Bay Protection and Toxic Cleanup Program
CACs County Agricultural Commissioners
CaIEPA California Environmental Protection Agencys
Caltrans California Department of Transportation
CCA California Coastal Act
CCC California Coastal Commission
CCLEAN Central Coast Long-term Environmental Assessment Network
CDF California Department of Forestry
cfs cubic feet per second
CTR California Toxics Rule
CSTF Contaminated Sediments Task Force
CWA Clean Water Act
CWC California Water Code
CZARA Coastal Zone Act Reauthorization Amendments of 1990
DOC Department of Conservation
DPR Department of Pesticide Regulation
DTSC Cal/EPA Department of Toxic Substances Control
EPA U.S Environmental Protection Agency
ERA Ecological Risk Assessment
FPR Forest Practice Rules
1PM Integrated pest management
LCP Local costal plan
LEAs Local Enforcement Agencies
MEP Maximum Extent Practicable
MLOE Multiple lines of evidence
MBNEP Morro Bay National Estuary Program
MMs Management measures
MS4s Municipal separate storm sewer systems
NPDES National Pollutant Discharge and Elimination System
NPS Nonpoint Source
OEHHA Office of Environmental Health Hazard Assessment
OPA Oil Pollution Act
PAHs Polynuclear aromatic hydrocarbons
PBDEs Polybrominated diphenyl ethers
PCBs Polychiorinated biphenyls
Regional Water Board Regional Water Quality Control Board
RHMP Regional Harbors Monitoring Plan
RMP Regional Monitoring Plan
RWB Regional Water Board
SCCWRP Southern California Coastal Water Research Program
SPEI San Francisco Estuary Institute
SIYB Shelter Island Yacht Basin
SMARA Surface Mining and Reclamation Act
SSO Site Specific Objective
SWRCB State Water Resources Control Board State Water Board
January2011iv

SWAMP Surface Water Ambient Monitoring Program
SWMP Storm Water Management Plans
SWPPP Storm Water Pollution Prevention Plan
SQOs Sediment quality objectives
THPs Timber harvest plans
TIE Toxicity identification evaluation
TMDL Total Maximum Daily Load
USDA U.S Department of Agriculture
USFS U.S Forest Service
WDRs Waste discharge requirements
WQBEL Water Quality-Based Effluent Limits
WWQI Westside Water Quality Improvement
January2011

Executive Summary
The State Water Resource Control Board State Water Board staff is proposingamendments to the
states Water Quality Control Plan for Enclosed Bays and Estuaries Part Sediment Quality referred to
in this report as either Part or the Plan The amendments include additional sediment quality
objectives SQOs and implementation procedures that apply to enclosed bays and estuaries in California
This report provides analysis of economic factors related to the Plan amendments
Background
In 2008 the State Water Board adopted SQOs and an implementation policy for bays and estuaries in the
state Part Part integrates chemical and biological measures to determine if the sediment dependent
biota are protected or degraded as result of exposure to toxic pollutants in sediment and to protect
human health Part includes narrative SQOs for the protection of aquatic life and human health
identification of the beneficial uses that these objectives are intended to protect and program of
implementationthat contains specific indicators tools and implementation provisions to determine if the
sediment quality at station or multiple stations meets the narrative objectives description of appropriate
monitoring programs and sequential series of actions that shall be initiated when sediment quality
objective is not met including stressor identification and evaluation of appropriate targets The State
Water Board is proposing amendments to the Plan to incorporate additional SQOs for the protection of
wildlife and finfish and implementation policy
In establishing water quality objectives the State Water Board considers economic factors among others
Specifically these economic factors include whether the objectives and alternatives under consideration
are currently being attained the methods available to achieve compliance and the costs of those methods
The State Water Board is considering these same factors in developing the SQO5 The available
compliance methods and costs depend on the sources of the pollutants bioaccumulating in sediments in
bays and estuaries which could include municipal and industrial wastewater and storm water agriculture
boats and legacy sources
Baseline conditions include current sediment quality objectives e.g benthic community and human
health SQOs and narrative Basin Plan criteria water quality objectives and policies regulating activities
and pollutant discharges that affect sediment quality e.g CTR Basin Plans waste discharge
requirements and other policies ongoing cleanup and remediation activities and planned or anticipated
cleanup and remediation actions that have not yet been completed total maximum daily load
development TMDL and implementation schedules Currently Regional Water Boards have listed 45
bays and estuaries as impaired for toxic pollutants in sediments or fish tissue and another 124 bays and
estuaries as impaired for toxic pollutants for which the effects from sediment are uncertain There are also
number of impairments of fish and wildlife beneficial uses that Regional Water Boards have not yet
identified the source of the pollutants and which could be attributable at least in part to pollutant
concentrations in sediments
Incremental Impacts of the Proposed Plan Amendments
The incremental economic impacts of the Plan include the costs of activities above and beyond those that
would be necessaryin the absence of the Plan under baseline conditions as well as any cost savings
associated with actions that will no longer need to occur e.g through more accurate assessment
procedures Note that assessments of impairment controls and sediment cleanups to reduce pollution in
waters impaired under baseline conditions would continue in the absence of the Plan amendments Thus
these existing impairments are not incremental impacts associated with the proposed SQO amendments
January 2011 Executive Stimmary ES-I

Under the Plan Regional Water Boards would list sediment as exceeding the narrative SQOs for wildlife
and finfish if an ecological risk assessment indicates impairment An ecological risk assessment may
reflect any applicable and relevant ecological risk information including policies and guidance from the
California Environmental Protection Agencys CalEPA Office of Environmental Health Hazard
Assessment OEHHA Cal/EPAs Department of Toxic Substances Control DTSC the California
Department of Fish and Game the U.S Environmental Protection Agency the U.S Army Corps of
Engineers the National Oceanographic Atmospheric Administration and the U.S Fish and Wildlife
Service The Water Boards will also consult with these agencies when threatened and endangered species
are present to ensure that these species are adequately protected Thus the proposed Plan amendments
could result in greater efforts to assess sediment quality in relation to fish and wildlife beneficial uses
which in turn could result in identification of new impairments or changes to existing impairments
Exhibit ES-i indicates the possible outcomes under the proposed Plan amendments
Exhibit ES-I Potential Incremental Imoacts Associated with the Proposed Plan Amendments
Assessment of Assessment Under Proposed SQO
Attainment of Existing
Beneficial UsesImpairment not attributable to sediments Impairment attributable to sediments
Impairment not No change in sediment qualitySedimntualit improvement
attributable to sediments Potential incremental assessment costsPotential incremental assessment and control
Sediment quality remains the same which Change in sediment quality if better data lead
lm airment attributablemay be lower than under implementation of to change in control strategies
to sedimentsbaseline narrative objective
Potential incremental assessment costs
Potential incremental assessment costs but potential incremental costs or cost-savings
will avoid unnecessary control costs depending on differences in control strategies
Monitoring and Assessment Costs
There are already extensive monitoring and assessment activities supporting the baseline regulatory
framework Absent the proposed Plan amendments these activities will continue and additional efforts
will be undertaken e.g as Regional Boards assess compliance with existing objectives for sediment
toxicity and address sites culTently impaired for sediment toxicity That is data is needed to determine
whether sediments are in compliance with existing narrative objectives for sediment toxicity related to
fish and wildlife Similarly in instances in which sediments exceed baseline objectives for sediment
toxicity assessment of the causes and sources will be needed in order to identify means of compliance
with the objectives These activities which can include developing work plan/project management
collecting additional data conducting ERAs or toxicity identification evaluations TIEs surface water
modeling and other analysis may be conducted as partof developing TMDL SCCWRP 2005
Parsons et al 2002 as cited in WSPA 2007
SWRCB 2008 provided unit costs for monitoring to assess the SQOs to protect the benthic community
direct effects Monitoring efforts for ERAs to assess indirect effects to wildlife and finfish beyond the
monitoring necessary to assess water quality criteria and the SQOs for direct effects could involve
collecting finfish and documenting the presenceof deformities irregularities in size or population effects
and collection and analysis of wildlife tissue or bird eggs Exhibit ES-2 provides unit costs for these
types of analyses Sample collection costs may vary based on factors such as water depth abundance of
fish species sediment characteristics may cause unsuccessful grabs that need to be repeated and
distance between stations Although data for some parameters may not be needed at each sampling site
the total costs per sampling event could be in the range of $7400 to $11700
January 2011 Executive Summary ES-2
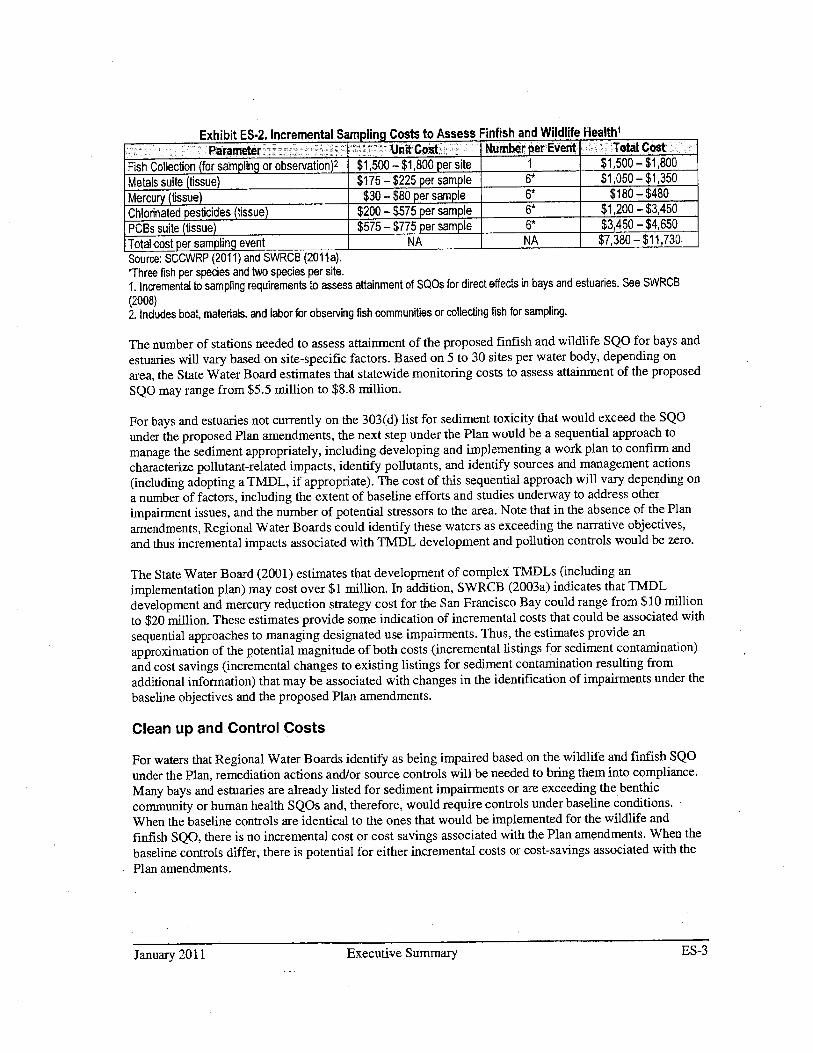
Exhibit ES-2 Incremental Sampling Costs to Assess cinfish and Wildlife Health1
P-arameter Unit Cost Number per Event Total Cost
Fish Collection for sampling or observation2 $1500 $1800 per site $1500 $1800
Metals suite tissue $175 $225 per sample $1050 $1350
Mercury tissue $30 $80 per sample $180 $480
Chlorinated pesticides tissue $200 $575 per sample $1200 $3450
PCBs suite tissue $575 $775 per sample $3450 $4650
Total cost per sampling event NA NA $7380 $11730
Source SCCWRP 2011 and SWRC 2011aThree fish per species and two species per site
Incremental to sampling requirements to assess attainment of SQOs for direct effects in bays and estuaries See SWRCB
2008
Includes boat materials and labor for observing fish communities or collectingfish for sampling
The number of stations needed to assess attainment of the proposed finfish and wildlife SQO for bays and
estuaries willvary
based on site-specific factors Based on to 30 sites per water body depending on
area the State Water Board estimates that statewide monitoring costs to assess attainment of the proposed
SQO may range from $5.5 million to $8.8 million
For bays and estuaries not currently on the 303d list for sediment toxicity that would exceed the SQO
under the proposed Plan amendments the next step under the Plan would be sequential approach to
manage the sediment appropriately including developing and implementing work plan to confirm and
characterize pollutant-related impacts identify pollutants and identify sources and management actions
including adopting TMDL if appropriate The cost of this sequential approach will vary depending on
number of factors including the extent of baseline efforts and studies underway to address other
impairment issues and the number of potential stressors to the area Note that in the absence of the Plan
amendments Regional Water Boards could identify these waters as exceeding the narrative objectives
and thus incremental impacts associated with TMDL development and pollution controls would be zero
The State Water Board 2001 estimates that development of complex TMDLs including an
implementation plan may cost over $1 million In addition SWRCB 2003a indicates that TMDL
development and mercury reduction strategy cost for the San Francisco Bay could range from $10 million
to $20 million These estimates provide some indication of incremental costs that could be associated with
sequential approaches to managing designated use impairments Thus the estimates provide an
approximation of the potential magnitude of both costs incremental listings for sediment contamination
and cost savings incremental changes to existing listings for sediment contamination resulting from
additional information that may be associated with changes in the identification of impairments under the
baseline objectives and the proposed Plan amendments
Clean up and Control Costs
For waters that Regional Water Boards identify as being impaired based on the wildlife and finfish SQO
under the Plan remediation actions and/or source controls will be needed to bring them into compliance
Many bays and estuaries are already listed for sediment impairments or are exceeding the benthic
community or human health SQOs and therefore would require controls under baseline conditions
When the baseline controls are identical to the ones that would be implemented for the wildlife and
finfish SQO there is no incremental cost or cost savings associated with the Plan amendments When the
baseline controls differ there is potential for either incremental costs or cost-savings associated with the
Plan amendments
January 2011 Executive Summary ES-3

Because strategies to meet current objectives at many impaired sites are still in the planning stages and
the overall effects of implementation strategies are unknown estimates of incremental costs would be
highly speculative For incremental sediment remediation and/or cleanup activities to be required under
the Plan monitoring data would have to indicate adverse impacts to finfish and wildlife attributable to
sediments in areas that would not be designated for clean up under existing objectives However it is
likely that most sites with sediment conditions that would require cleanup and remediation under the Plan
amendments would also exceed current objectives To the extent that results differ it is possible that the
additional assessment activities under the Plan amendments could lead to cleanup strategies that are more
cost effective compared to baseline activities In addition based on the implementation plans for existing
TMDLs Regional Water Boards are likely to pursue source controls for ongoing sources and only require
remediation activities for historical pollutants with no known ongoing sources
If incremental remediation activities are necessary costs are likely to be very specific to the particular site
and project Sediment remediation and cleanup costs may range from less than $1/cy to over $1000/cy for
various alternatives with different feasibility and practicality considerations SWRCB 1998 Preliminary
estimates for dredging sediments in San Diego Bay suggest that unit costs may range from $lOO/cy to
$200/cy depending on the volume of sediment removed SDRWQCB 2007b
For an increased source control cost associated with additional pollution controls under the Plan the
concentration of toxic pollutants in discharges would have to meet levels that are more stringent than
what is needed to achieve compliance with existing objectives e.g since they could have to control
based on the benthic community and human health SQOs narrative Basin Plan sediment objectives or
the CTR water quality criteria Incremental costs for controls may also result from the identification of
additional chemical stressors that are not included in the Phase SQOs Basin Plans or Cm Since many
practices that may be employed under existing TMDLs are applicable for controlling the mobilization of
pollutants in general this situation is also difficult to estimate For example the TMDL for pesticides and
PCBs in the Calleguas Creek watershed indicates that the BMPs needed to achieve the nutrient and
toxicity TMDLs for the watershed would likely reduce pesticides and PCBs to necessary levels as well
LARWQCB 2005c Thus without being able to identify the particular pollutants causing toxic effects
to wildlife and fmfish and the development of discharge concentrations needed to achieve the objectives
the needed cleanups and/or controls to achieve those concentrations are site- and pollutant-specific and
therefore difficult to estimate
For any situation in which point sources are specifically required to control toxic pollutants to levels that
are lower than what would be necessary in the absence of the Plan it is likely that these facilities would
implement source control to eliminate the pollutant from entering their treatment plant or industrial
process or pursue regulatory relief e.g variance rather than install costly end-of-pipe treatment
However it is uncertain whether such situation would arise as result of the Plan amendments
For agriculture Regional Water Boards regulate farmers primarily through the conditional WDR waivers
that require compliance with water quality standards Regional Water Boards may also require farmers to
meet more stringent criteria for specific pollutants where necessary e.g to meet TMDL site-specific
objectives All of the affected Regional Water Boards have narrative objectives that specifically prohibit
the discharge of pesticides and/or toxic pollutants that cause detrimental effects in aquatic life or to
animals and humans Thus even in the absence of the Plan amendments fanners would be prohibited
from causing or contributing to toxicity to wildlife and tinfish
Potential means of compliance for storm water sources include increased or additional nonstructural
BMPs e.g institutional education or pollution prevention practices designed to limit generation of
runoff or reduce the pollutants load of runoff and structural controls e.g engineered and constructed
systems designed to provide water quantity or quality control Improving the effectiveness of
January 2011 Executive Summary ES-4

nonstructural BMPs could be on the order of $26 per household CSU Sacramento 2005 Caltrans
2001 reports range of costs for structural controls based construction costs from several transportation
departments and jurisdictionsFor example average detention basin costs are approximately $7000 and
wetlands are $13000 However Delaware sand filter costs are approximately $118000 on average
Caltrans 2001
For marinas and boating activities potential means of compliance may include use of less toxic paint on
boats performingall boat maintenance activities above the waterline or in lined channel to prevent
debris from entering the water removing boats from the water and clean in specified location equipped
to trap debris and collect wastewater prohibiting hull scraping or any process that removes paint from the
boat hull from being conducted in the water and developing collection system for toxic materials at
harbors For example one marina spent $14500 on pollution prevention program in 1999 MBNEP2000 and Carson et aL 2002 estimated the cost of remaining life hull maintenance for 40 foot length
11 foot width boats to rangefrom savings of $1354 new boat with nontoxic coating good
performance and lower prices to cost of $6251 2.5 year old boat requiring stripping fair
performance and higher prices In addition the cost of unit that collects water that may contain toxic
materials from boating maintenance operations so that it may be sent to the sanitary sewer could cost
between $3200 to $4500 Pressure Power Systems 2007
Wetlands controls may include aeration channelization revegetation sediment removal levees or
combination of these practices The extent of controls needed and the types of controls are unknown The
Central Valley Regional Water Board 2005b provides one example of the cost of efforts underway in
Anderson Marsh wetland on Cache Creek Capital costs for controlling methylmercury export from
Anderson March may range from $200000 to $1 million and OM costs from $20000 to $100000 per
year CVRWQCB 2005b
January 2011 Executive Summary ES-5
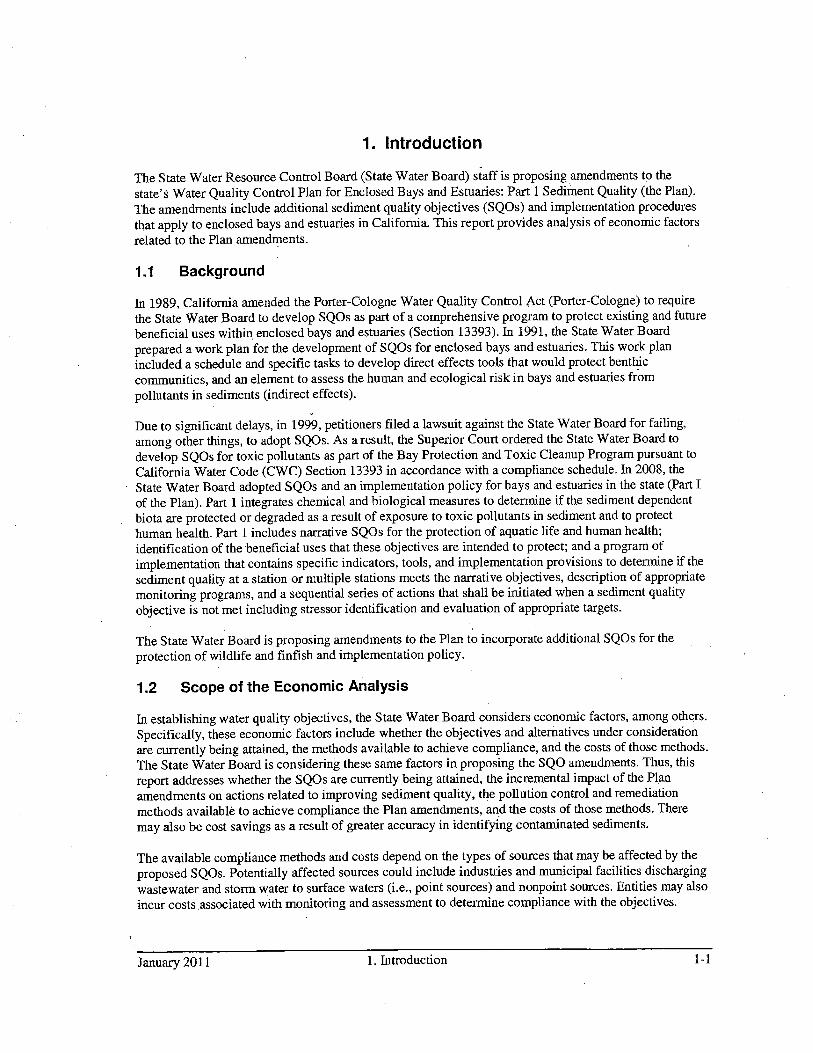
Introduction
The State Water Resource Control Board State Water Board staff is proposing amendments tt the
states Water Quality Control Plan for Enclosed Bays and Estuaries Part Sediment Quality the Plan
The amendments include additional sediment quality objectives SQOs and implementation procedures
that apply to enclosed bays and estuaries in California This report provides analysis of economic factors
related to the Plan amendments
Li Background
In 1989 California amended the Porter-Cologne Water Quality Control Act Porter-Cologne to require
the State Water Board to develop SQOs as part of comprehensive program to protect existing and future
beneficial uses within enclosed bays and estuaries Section 13393 In 1991 the State Water Board
prepared work plan for the development of SQOs for enclosed bays and estuaries This work plan
included schedule and specific tasks to develop direct effects tools that would protect benthic
communities and an element to assess the human and ecological risk in bays and estuaries from
pollutants in sediments indirect effects
Due to significant delays in 1999 petitioners filed lawsuit against the State Water Board for failing
among other things to adopt SQOs As result the Superior Court ordered the State Water Board to
develop SQOs for toxic pollutants as part of the Bay Protection and Toxic Cleanup Program pursuant to
California Water Code CWC Section 13393 in accordance with compliance schedule Tn 2008 the
State Water Board adopted SQOs and an implementation policy for bays and estuaries in the state Part
of the Plan Part integrates chemical and biological measures to determine if the sediment dependent
biota are protected or degraded as result of exposure to toxic pollutants in sediment and to protect
human health Part includes narrative SQOs for the protection of aquatic life and human health
identification of the beneficial uses that these objectives are intended to protect and program of
implementation that contains specific indicators tools and implementation provisions to determine if the
sediment quality at station or multiple stations meets the narrative objectives description of appropriate
monitoring programs and sequential series of actions that shall be initiated when sediment quality
objective is not met including stressor identification and evaluation of appropriate targets
The State Water Board is proposing amendments to the Plan to incorporate additional SQOs for the
protection of wildlife and finfish and implementation policy
1.2 Scope of the Economic Analysis
In establishing water quality objectives the State Water Board considers economic factors among others
Specifically these economic factors include whether the objectives and alternatives under consideration
are currently being attained the methods available to achieve compliance and the costs of those methods
The State Water Board is considering these same factors in proposing the SQO amendments Thus this
report addresses whether the SQOs are currently being attained the incremental impact of the Plan
amendments on actions related to improving sediment quality the pollution control and remediation
methods available to achieve compliance the Plan amendments and the costs of those methods There
may also be cost savings as result of greater accuracy in identifying contaminated sediments
The available compliance methods and costs depend on the types of sources that may be affected by the
proposed SQOs Potentially affected sources could include industries and municipal facilities discharging
wastewater and storm water to surface waters i.e point sources and nonpoint sources Entities may also
incur costs associated with monitoring and assessment to determine compliance with the objectives
January 2011 Introduction 1-1

1.3 Organization of the Report
This report is organized as follows Section describes the economic and regulatory baseline for
estimating the incremental impacts of the SQOs and implementation procedures Section describes the
objectives and implementation procedures and current attainment of the proposed objectives Section
discusses potential means of compliance with the Plan and estimates of the potential costs of those
methods Section provides discussion of potential statewide costs and uncertainties of the analysis
Several appendices provide additional information related to the analysis
January 2011 Introduction 1-2

Baseline for the Analysis
This section describes the baseline for identifying potential economic impacts of the Plan amendments
Baseline conditions include current objectives and policies regulating activities and pollutant discharges
that affect sediment quality in bays and estuaries ongoing sediment cleanup and remediation activities in
bays and estuaries and planned or anticipated actions to address sediment-related and other impairments
in bays and estuaries total maximum daily load development TMDL and implementation
schedules
2.1 Existing Objectives
In 2008 the State Water Board adopted the Water Quality Control Plan for Enclosed Bays and Estuaries
Part Sediment Quality The Plan is applicable to enclosed bays and estuaries and surficial sediments that
have been deposited or emplaced below the intertidal zone The Plan protects estuarine and marine habitat
and rare and endangered species beneficial uses and commercial and sport fishing aquaculture and
shellfish harvesting beneficial uses by protecting benthic aquatic life and human health respectively
Aquatic Life/Benthic Community Protection Pollutants in sediments shall not be present in
quantities that alone or in combination are toxic to benthic communities in bays and estuaries
implemented using the integration of multiple lines of evidence MLOEHuman Health Pollutants shall not be present in sediments at levels that bioaccumulate in aquatic
life to levels that are harmful to human health
The Plan specifies procedures for implementing the narrative SQOs including determining compliance
NPDES permitting procedures and monitoring requirements
In addition to the Plan individual Basin Plans for the nine Regional Water Quality Control Boards
Regional Water Boards contain sediment toxicity and fish and wildlife protection criteria None of the
Regional Water Boards have adopted numeric objectives for sediments Rather the Regional Water
Boards rely on narrative objectives to protect and manage ambient sediment quality The current
objectives in each Basin Plan are described in Appendix The Lahontan Region and Colorado River
Basin Region Regions do not contain any enclosed bays or estuaries and thus are not included in this
analysis
Also the California Toxics Rule CTR contains criteria for toxic pollutants applicable to inland surface
waters enclosed bays and estuaries in the state However Regional Water Boards may adopt more
stringent criteria for specific pollutants where necessary e.g to meet TMDL site-specific objectives
Appendix shows the CTR criteria and indicates where Regional Water Board may have more
stringent criteria in its Basin Plan
2.2 Monitoring
Under existing objectives policies and programs there are wide range of monitoring efforts underway
by Regional Water Boards dischargers and other organizations to characterize effluent ambient water
and sediment quality and fish and wildlife health These efforts include regional and coordinated
programs as well as discharger monitoring requirements Regional programs include
Southern California Bight Regional Monitoring Surveys managed by the Southern
California Coastal Water Research Project to evaluate the physical chemical and biological
impacts to ocean bay and estuarine waters from Ventura to San Diego These surveys are
performed every to years The most recent effort Bight 08 Survey included chemical
analysis of tissue and sediment sediment toxicity analysis of benthic invertebrate and fish
January 2011 Baseline for the Analysis 2-1

cominimity structure and evaluation of gross pathology in trawl caught fish in bays and coastal
waters
San Francisco Regional Monitoring Program for Trace Substances RMP managed by the
San Francisco Estuary Institute SFEI to collect data to evaluate contaminant exposure within the
San Francisco Bay ecosystem Specific studies conducted in 2010 aimed at fish and wildlife
exposure and effects include monitoring contaminant bioaccumulation in small fish and bird
shells and assessing sensitivity of terns to PBDEs SFEI 2009 The RMP is an annual effort
though individual parameters may be monitored more or less frequently
Surface Water Ambient Monitoring Program SWAMP State Water Board program to
provide decision makers and the public with the information necessary to evaluate surface water
quality throughout California SWAMP supportsthe collection of high quality data in all regions
for 303d listing and 305b reporting on impaired waterbodies and waters supporting beneficial
uses
Musse Watch Program National Oceanic and Atmospheric Administration program of
national status and trends Longest running contaminant monitoring program in the United States
Contaminant concentrations in mussel tissue are direct measure of exposure for all similar filter
feeders in those habitats where found as well as an indicator of dietary exposure for biota the
feed on these filter feeders
Regional Harbors Monitoring Program RuMP collaborative program initiated in response
to Regional Water Board request pursuant to CWC 13255 for water quality information for Dana
Point Oceanside Mission Bay and San Diego Bay The objectives of this program include
assessing water and sediment quality to sustain healthy biota and the long-term trends in harbor
conditions Weston 2008Central Coast Long-term Environmental Assessment Network CCLEAN stakeholder
program to maintain restore and enhance nearshore water and sediment quality and associated
beneficial rare including threatened or endangered species water contact recreation and wildlife
habitat uses in the Central Coast Region CCLEAN satisfies the NPDES receiving water
monitoring and reporting requirements of program participants Concerns center around elevated
concentrations of persistent organic pollutants e.g petroleum hydrocarbons chlorinated
pesticides polychiorinated biphenyls in fish from the Monterey Submarine Canyon declines in
sea otter populations diseases in sea otters related to high concentrations of persistent organic
pollutants and bird and mammal deaths due to blooms of toxic phytoplankton
Also the California Water Quality Monitoring Council Monitoring Council has 2010 plan to assemble
the widest collection of water quality data ever available on the states lakes rivers streams wetlands
and ocean waters
Indeed as result of existing monitoring efforts there are over 5000 samples of data related to sediment
quality from 42 different agencies for bays and estuaries in California Weisberg and Bay 2007 For
example under the State Water Boards Bay Protection and Toxic Cleanup Program BPTCP the San
Francisco Bay Regional Water Board conducted pilot RMP with the SFEI and is continuing
participation in the RMP conducted fish tissue study to identify contaminant concentrations that would
trigger fish consumption advisory in the San Francisco Bay and conducted baywide sediment
assessments to identify toxic hot spots
In addition under the BPTCP each Regional Water Board identified toxic hot spots in their area using
two step process designed to consider three measures toxicity testing benthic community analysis and
chemical analysis plus an optional bioaccumulation component SWRCB 2003b The first step was
screening phase that consisted of measurements using toxicity tests benthic community analysis
chemical tests or bioaccumulation data to provide sufficient information to list site as potential toxic
hot spot positive result in any of the tests triggered the second confirmation step depending on
January 2011 Baseline for the Analysis 2-2

available funding which consisted of testing the previously sampled site of concern for all three measures
SWRCB 2003b
Individual dischargers are also required to monitor sediment quality As described in the fact sheet for the
revised tentative order MS4 permit for Orange County SDRWQCB 2007 the copermittees must
conduct monitoring including chemistry toxicity and bioassessment and use the results to determine if
impacts from urban runoff are occurring If toxic pollutants are present in runoff the coperrnittees are
required to conduct Toxicity Identification Evaluation TIE TIE is set of procedures used to
identify the specific chemical or chemicals responsible for toxicity to aquatic organisms When TIE
results in identifying pollutant associated with urban runoff as cause of toxicity follow-up actions
should analyze all potential sources causing toxicity potential BMPs to eliminate or reduce the pollutants
causing toxicity and suggested monitoring to demonstrate that toxicity has been removed
2.3 Municipal and Industrial Dischargers
The State Water Board regulates toxic pollutants in the effluents of municipal and industrial wastewater
treatment facilities through the National Pollutant Discharge and Elimination System NPDES permit
program The Water Boards issue NPDES permits pursuant to section 402 of the Clean Water Act which
requires that all point source discharges of pollutants to waters of the United States be regulated under
permit Under the NPDES permit program permits contain both technology-based and water quality-
based effluent limits WQBELs WQBELs reflect applicable water quality standards including those
contained in basin plans and the California Toxic Rule
NPDES permits also reflect narrative objectives contained in basin plans For example Section of the
San Francisco Bay Regional Final Order 2010 0060 states the discharges shall not cause toxic or other
deleterious substances to be present in concentrations or quantities which will cause deleterious effects on
wildlife waterfowl or other aquatic biota or which render any of these unfit for human consumption
either at levels created in the receiving waters or as result of biological concentration in Central San
Francisco Bay SFRWQCB 2010 These permittees may contribute and support the RMP in which
several special studies focus on exposure and effects to fish and wildlife to assess compliance with the
receiving water limits In addition the City of Los Angeles Terminal Island treatment plants NPDES
permit Order R4-2010-007 contains provisions requiring the discharger to perform number of special
studies related to the protection of fish and wildlife including local demersal fish survey and local
bioaccumulation trends survey and participate in Southern California Bight Regional Demersal Fish and
Invertebrate Survey and Regional Predator Risk Survey
Although the proposed Plan amendments apply to bays and estuaries municipal and industrial facilities
discharging to tributaries upstream of affected waters could also be potential source of pollutant
loadings to downstream sediments Based on the Regulated Facilities Report for California there are 584
individually-permitted NPDES dischargers in the state discharging to inland surface waters enclosed
bays and estuaries Exhibit 2-1
January 2011 Baseline for the Analysis2-3
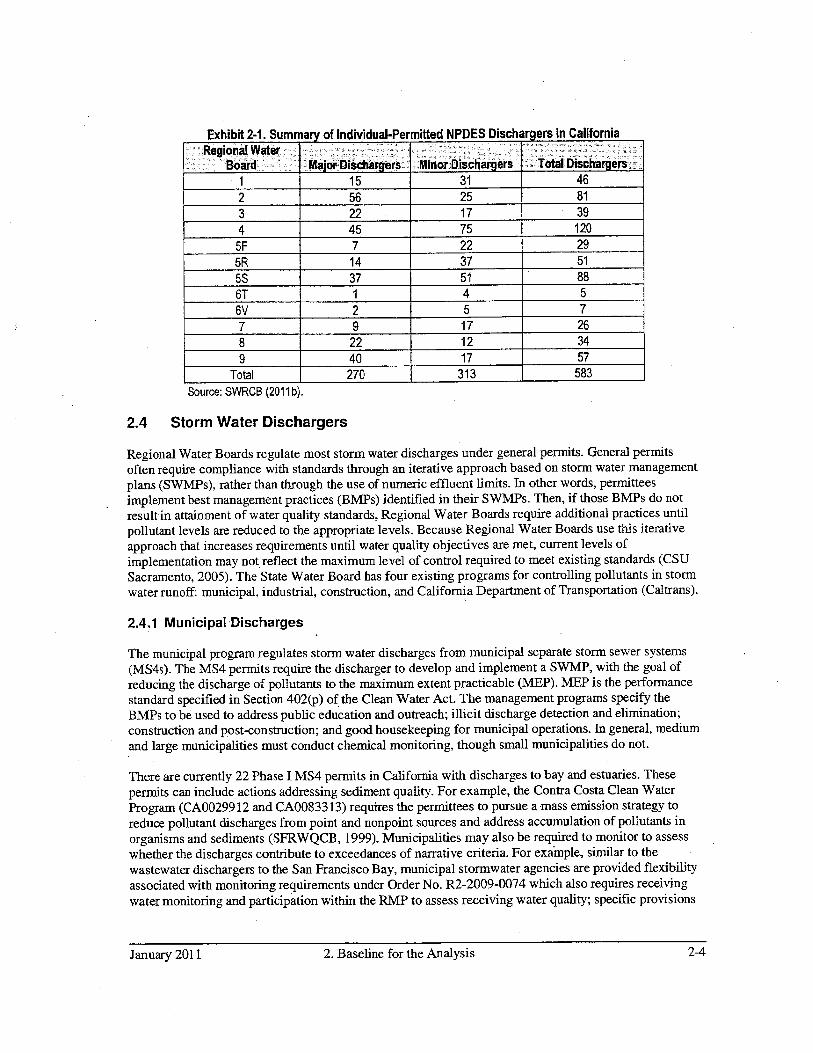
Exhibit 21 Summary of Individual-Permitted NPDES DischarQers in California
RegionaiWater
Boird MajorDiichisers Minor Dischargers Total Dischargers
15 31 46
56 25 81
22 17 39
45 75 120
5F 22 29
5R 14 37 51
5S 37 51 88
6T
6V
17 26
22 12 34
40 17 57
Total 270 313 583
Source SWRCB 2011b
2.4 Storm Water Dischargers
Regional Water Boards regulate most storm water discharges under general permits General permits
often require compliance with standards through an iterative approach based on storm water management
plans SWMPs rather than through the use of numeric effluent limits In other words permittees
implement best management practices BMPs identified in their SWMPs Then if those BMPs do not
result in attainment of water quality standards Regional Water Boards require additional practices until
pollutant levels are reduced to the appropriate levels Because Regional Water Boards use this iterative
approach that increases requirements until water quality objectives are met current levels of
implementation may not reflect the maximum level of control required to meet existing standards CSUSacramento 2005 The State Water Board has four existing programs for controlling pollutants in storm
water runoff municipal industrial construction and California Department of Transportation Caltrans
2.4.1 Municipal Discharges
The municipal program regulates storm water discharges from municipal separate storm sewer systems
M54s The MS4 permits require the discharger to develop and implement SWMP with the goal of
reducing the discharge of pollutants to the maximum extent practicable MTEP MEP is the performance
standard specified in Section 402p of the Clean Water Act The management programs specify the
BMPs to be used to address public education and outreach illicit discharge detection and elimination
construction and post-construction and good housekeeping for municipal operations In general medium
and large municipalities must conduct chemical monitoring though small municipalities do not
There are currently 22 Phase MS4 permits in California with discharges to bay and estuaries These
permits can include actions addressing sediment quality For example the Contra Costa Clean Water
Program CA00299 12 and CA00833 13 requires the permittees to pursue mass emission strategy to
reduce pollutant discharges from point and nonpoint sources and address accumulation of pollutants in
organisms and sediments SFRWQCB 1999 Municipalities may also be required to monitor to assess
whether the discharges contribute to exceedances of narrative criteria For example similar to the
wastewater dischargers to the San Francisco Bay municipal stormwater agencies are provided flexibility
associated with monitoring requirements under Order No R2-2009-0074 which also requires receiving
water monitoring and participation within the RMP to assess receiving water quality specific provisions
January 2011 Baseline for the Analysis 2-4

require monitoring of water column and sediment toxicity benthic invertebrates bioassessment and
sediment bound toxic pollutants DDT PCBs copper mercury selenium to assess effectiveness DDTThe Alameda Countywide Clean Water Program CAS002983 requires tracking of mercury trends in
sediment Alameda 2003
In addition there are 209 small MS4s that have submitted SWMPs to Regional Water Boards or the State
Water Board for approval However it is not clear how many of those MS4s discharge to enclosed bays
and estuaries
2.4.2 Industrial Discharges
Under the industrial program the State Water Board issues general NPDES permit that regulates
discharges associated with ten broad categories of industrial activities This general permit requires the
implementation of management measures that will achieve the performance standard of best available
technology economically achievable BAT and best conventional pollutant control technology CTThe permit also requires that dischargers develop Storm Water Pollution Prevention Plan SWPPP and
monitoring plan Through the SWPPP dischargers are required to identify sources of pollutants and
describe the means to manage the sources to reduce storm water pollution For the monitoring plan
facility operators may participate in group monitoring programs to reduce costs and resources
2.4.3 Construction
The construction program requires dischargers whose projects disturb one or more acres of soil or whose
projects disturb less than one acre but are part of larger common plan of development that in total
disturbs one or more acres to obtain coverage under the general permit for discharges of storm water
associated with construction activity The construction general permit requires the development and
implementation of SWPPP that lists BMPs the discharger will use to protect storm water runoff and the
placement of those BMPs Additionally the SWPPP must contain visual monitoring program
chemical monitoring program for nonvisible pollutants to be implemented if there is failure of BMPsand sediment monitoring plan if the site discharges directly to water body impaired for sediment
2.4.4 Caltrans
In 1996 Caltrans requested that the State Water Board consider adopting single NPDES permit for
stortn water discharges from all Caltrans properties facilities and activities that would cover both the
MS4 requirements and the statewide construction general permit requirements The State Water Board
issued the Caitraris general permit in 1999 requiring Caltrans to control pollutant discharges to the MEPfor the MS4s and to the standard of BAT/B CT for construction activities through BMPs The State Water
Board also requires dischargers to implement more stringent controls if necessary to meet water quality
standards
2.5 Nonpoint Sources
Nonpoint source pollution unlike pollution from industrial and sewage treatment plants comes from
many diffuse sources Some nonpoint source pollution is caused by rainfall or snowmelt moving over and
through the ground As the runoff moves it picks up and carries away natural and human-made
pollutants depositing them into lakes rivers wetlands coastal waters and groundwater Nonpoint source
pollution may originate from several sources including agricultural operations forestry operations urban
areas boating and marinas active and historical mining operations atmospheric deposition and wetlands
Note that in many cases discharges from these sources can be regulated as point sources i.e
discernible confined and discrete conveyances
January 2011 Baseline for the Analysis2-5

In 1999 California implemented its Fifteen-Year Program Strategy for the Nonpoint Source Pollution
Control Program as delineated in the Plan for Californias Nonpoint Source Pollution Control Program
NPS Program Plan The legal foundation for the NPS Program Plan is the Clean Water Act CWA and
the Coastal Zone Act Reauthorization Amendments of 1990 CZARA SWRCB 2000 The agencies
primarily responsible for the development and implementation of the NPS Program Plan are the State
Water Board the nine Regional Water Boards and the California Coastal Commission CCC Various
other federal state and local agencies have significant roles in the implementation of the NPS Program
Plan
Federal approval and funding of the NPS Program Plan required assurance the state had legal authority to
implement and enforce the plan The stales Policy for Implementation and Enforcement of the Nonpoint
Source Pollution Control Program NPS Policy provides guidance regarding the implementation and
enforcement of the NPS Program Plan As stated in the NPS Policy the Porter-Cologne Act provides the
legal authority of the State Water Board and Regional Water Boards to regulate nonpoint sources in
California under waste discharge requirements WDRs conditional waivers of WDRs or basin plan
prohibitions or amendments SWRCB 2004b However all WDRs need not contain numeric effluent
limits The Regional Water Boards do not usually assign nonpoint sources numeric effluent limits- rather
they primarily rely on implementation of BMPs to reduce pollution
The NPS Program Plan specifies management measures MMs and the corresponding management
practices or BMPs for each of six source categories MMs should be implemented where needed by 2013
using combination of nonregulatory activities and enforceable policies and mechanisms SWRCB2003a Appendix describes the MMs for each source category applicable to sediment toxicity
reductions
2.5.1 Agriculture
Impacts from agricultural activities that may affect sediment quality include sedimentation and the runoff
of pesticides These impacts can be caused by
Farming activities that cause excessive erosion resulting in sediment entering receiving waters
Improper use and overapplication of pesticides
Overapplication of irrigation water resulting in runoff of sediments and pesticides SWRCB2006b
Although wastewater discharges from irrigated land including storm water runoff irrigation tailwater and
tile drainage are subject to regulation under WDRs Regional Water Boards have historically regulated
these discharges under waivers These waivers are authorized by CWC Section 13269 which allows
Regional Water Boards to waive WDRs if it is in the public interest
Most historical waivers require that discharges not cause violations of water quality objectives however
do not require water quality monitoring In 1999 Senate Bill 390 amended CWC Section 13269 and
required Regional Water Boards to review and renew their waivers or replace them with WDRs if
Regional Water Boards did not reissue the waivers by January 2003 they expired The Central Coast
Los Angeles Central Valley and San Diego Regional Water Boards have established conditional waivers
for agricultural discharges The Santa Aria Regional Water Board is in the process of developing
conditional waiver for discharges from irrigated agricultural lands While the North Coast and San
Francisco Bay Regional Water Boards have no immediate plans to adopt waivers for agricultural
discharges they may do so in the future in the context of TMDLs
January 2011 Baseline for the Analysis 2-6

In conjunction with conditional waivers Regional Water Boards regulate agricultural discharges from
cropland under nonpoint source programs that rely on BMPs to protect water quality For example the
State Water Board and the CCC oversee agricultural control programs with assistance from the
Department of Pesticide Regulation DPR for pesticide pollution and the Department of Water Resources
for irrigation water management SWRCB 2006b
The pesticide management measure MM 1D is likely to have the greatest impact on sediment toxicity
This MM reduces contamination of surface water and ground water from pesticides through
Development and adoption of reduced risk pest management strategies including reductions in
pesticide useEvaluation of pest crop and field factors
Use of Integrated Pest Management 1PMConsideration of environmental impacts when choosing pesticides for use
Calibration of equipment
Use of antibackflow devices SWRCB 2006b
1PM is key component of pest control 1PM strategies include evaluating pest problems in relation to
cropping history and previous pest control measures and applying pesticides only when an economic
benefit will be achieved Pesticides should be selected based on their effectiveness to control target pests
and their potential environmental impacts such as persistence toxicity and leaching potential SWRCB2006b
There are many planned on-going and completed activities related to management of pesticides
However as reported in the most recent NPS Program Plan progress report SWRCB 2004a efforts to
improve water quality impaired by agriculture activities are highly challenging because of the different
perspectives that exist between the regulatory community and the agricultural community
As of 2003 the SWRCB 2004a reports the following progress
16 watershed working groups are actively developing farm water quality plans with 19 new
groups being formed
Of the over 90 farmers that attended Farm Water Quality Course half have developed
comprehensive water quality plans for more than 10700 acres of irrigated crops
Over 750 farmers have attended 35 workshops designed to train farmers in specific conservation
practices
2.5.2 Forestry
Timber harvesting and associated activities can result in the discharge of chemical pollutants and
petroleum products in addition to other conventional pollutants Chemical pollutants and metals can be
discharged through runoff and drift Potential sources of chemical runoff include roads that have been
treated with oils or other dust suppressing materials and herbicide applications
Forest chemical management focuses on reducing pesticides that are occasionally used for pest
management to reduce mortality of desired tree species and improve forest production Pesticide use on
state or private forestry land is regulated by DPR However large proportion of Californias forested
lands are owned or regulated by the federal government SWQCB 2004a in which pesticide use is
controlled by the USDA Forest Service Region
hi addition to the NPS Program Plan MMs forestry activities are also controlled through WDR and
conditional waivers Recently Regional Water Boards have adopted waivers for timber harvesting
January 2011 Baseline for the Analysis2-7

activities provided that the activities comply with the general conditions listed in each waiver including
compliance with applicable requirements contained in each Regions basin plans
The DPR regulates the sale and use of pesticides and through county agricultural commissioners CACsenforces laws pertaining to pesticide use CACs inspect pesticide applications to forests and ensure that
applications do not violate pesticide laws and regulations Landowners must also submit timber harvest
plans THPs to the California Department of Forestry CDF outlining what timber will be harvested
how it will be harvested and the steps that will be taken to prevent damage to the environment CDF will
only approve those THPs that comply with all applicable federal and state laws
The Forest Practices Act provides conditional exemption from WDRs for timber operations article
section 4514.3 The Forest Practice Rules establish responsible forest resource management practices
which serve the demand for timber and other forest products while giving consideration to the publics
need for watershed protection fisheries and wildlife and recreational opportunities
2.5.3 Urban Runoff
Pollutants found in runoff from urban areas include among others sediments heavy metals petroleum
hydrocarbons and plastics As population densities increase pollutant loadings generated from human
activities also increase Most urban runoff enters surface waters without undergoing treatment
The control of urban nonpoint pollution requires the use of two primary strategies preventing pollutant
loadings from entering waters and reducing the impact of unavoidable loadings The major opportunities
to control nonpoint loadings occur during the following three stages of development the siting and
design phase the construction phase and the post-development phase Before development occurs
land in watershed is available for number of pollution prevention and treatment options such as
setbacks buffers or open space requirements as well as wet ponds or constructed urban runoff wetlands
that can provide treatment of the inevitable runoff and associated pollutants In addition siting
requirements and restrictions and other land use ordinances which can be highly effective are more
easily implemented during this period After development occurs these options may no longer be
practicable or cost-effective
Urban runoff is addressed primarily through the NPDES program although the State Water Board NPS
Program Plan applies where runoff is not regulated as permitted point source The NPDES program
supersedes the State Water Board and Regional Water Board NPS Program in the areas where there is
overlap NPDES permits require implementation of BMPs which may or may not be similar to the MMsin the NPS Program
In 1976 the State Legislature enacted the California Coastal Act CCA to provide for the conservation
and planned development of the States coastline The CCA directs each of the 73 coastal cities and
counties to prepare for review and certification by the CCC local coastal plan LCP consisting of land
use plans zoning ordinances zoning district maps and other implementation actions The CCC also
works with local governments to incorporate urban MMs and MPs into their respective LCPs Certified
LCPs are important tools for implementing urban runoff MMs and MPs that prevent reduce or treat
polluted runoff from proposed developments Storm water programs can become more effective because
of local planning and permitting decisions throughout the State
2.5.4 Marina and Recreational Boating
Poorly planned or managed boating and related activities e.g marinas and boat maintenance areas maythreaten the health of aquatic systems and pose other environmental hazards There are nearly million
January 2011 Baseline for the Analysis 2-8

registered boats and approximately 650 marinas in California SWRCB 2004a Boats repairs fouling
and corrosion control and sanding scraping painting varnishing and fibergiassing boats can result in
pollutants such as metals solvents hydrocarbons and other contaminants entering surface waters Hunt
and Doll 2007 For example copper and zinc are often found in marina sediments due to the leaching of
antifoulant paints
Note that commercial and military ports are subject to storm water NPDES permits regulating industrial
and construction activities Commercial ports are also required to submit port master plan to the CCC
The master plan must include an estimate of the effect of development on habitat areas and the marine
environment review of existing water quality habitat areas and quantitative and qualitative biological
inventories and proposals to minimize and mitigate any substantial adverse impact In addition the state
has the opportunity to ensure that appropriate pollution prevention and control measures are in place at all
military ports
There are many planned on-going and completed activities related to nonpoint source pollution in
marinas The primary focus of these activities is to prevent discharges of waste oil sewage petroleum
solid waste and toxic pollutants from surface runoff improper boat cleaning/maintenance activities lack
of disposal facilities or improper maintenance of facilities at marinas SWRCB 2006b For example the
compliance schedule for the Dissolved Copper in Shelter Island Yacht Basin SIYB San Diego Bay
TMDL consists of 17-year staged schedule period The first stage consists of an initial 2-year
orientation period The subsequent 15-year reduction period will achieve the incremental copper load
reductions by requiring all new boats entering SIYB to have nontoxic or less toxic coatings arid through
replacement of copper coatings on all existing boats with nontoxic or less toxic coating at the next time
routine hull stripping is scheduled SDRWQCB 2005
The state is also relying on education and outreach efforts aimed at marina owners and operators and the
boating public to provide information on pollution problems and management practices that can be
implemented to prevent or control improper disposal of pollutants into surface waters SWRCB 2006b
For example the Boating Clean and Green Campaign provides statewide boater education and technical
assistance program conducted by the CCC in partnership with the California Department of Boating and
Waterways to promote environmentally sound boating practices Issues addressed through the Campaign
include vessel cleaning and maintenance handling and disposal oil and fuel handling and disposal of
hazardous materials and proper disposal of trash and gray water California Clean Marina Toolkit is
available to assist marine operators in identifying clean marina practices and resources that will help to
implement these practices CCC 2004
The Federal Oil Pollution Act OPA is comprehensive prevention response liability and
compensation regime for dealing with vessel- and facility-generated discharges of oil or hazardous
substances Under the OPA any hazardous waste spill from vessel must be reported by the owner of the
vessel and vessel owners are responsible for any costs of resulting environmental cleanup and any
damage claims that might result from the spill Marinas are responsible for any oil contamination
resulting from their facilities including dumping or spilling of oil or oil-based paint and the use of
chemically treated agents The California Department of Fish and Games Office of Spill Prevention and
Response enforces the laws designed to prevent spills dispatches units to respond to spills and
investigates spills
2.5.5 Abandoned and Inactive Mines
The State Water Board and Regional Water Boards have identified approximately 40 mines that cause
serious water quality problems resulting from acid mine drainage and acute mercury loading SWRCB2000 Although all mines may not be significant polluters individually cumulatively mines may
January 2011 Baseline for the Analysis 2-9

contribute to chronic toxicity due to increased metals loadings Additionally drainage structures arid
sluices associated with abandoned hydraulic gold mines are potential source of mercury to surface
waters Mercury from abandoned mines posesserious potential threat to coastal waters because mercury
transported from these sites may bioaccumulate in fish
The NPS Program Plan does not contain management measures for abandoned mines and there is no
specific comprehensive program at either the state or federal level for cleaning up abandoned and
inactive mines other than coal Rather abandoned and inactive mine cleanup is carried out under variety
of state federal and local programs Regional Water Boards may issue WDRs to the most serious sites
The federal Superfund Program addresses only the most extreme pollution sites such as Iron Mountain
Mine Federal land management agencies have specific marginally funded programs for cleaning up
abandoned mines on federal land but most projects address safety hazards rather than water quality
Californias Title 27 Program regulates discharges of wastes to land and can be used to pursue mine
cleanups
Enforcement actions however are costly and have not been effective because responsible parties are
difficult to locate and current property owners either do not have or will not spend money to cleanup
their sites The main barrier to comprehensive program for abandoned mines is liability SWRCB2003a Under the federal CWA third party can sue an agency or private party that performs abatement
actions at an abandoned mine if the discharge from the mine continues to violate the CWA
In June 2000 the California Department of Conservation DOC inventoried the number of abandoned
mine sites and features located in the state DOC estimates that of the 47084 historic and inactive mine
sites iii the state approximately 11% 5200 present an environmental hazard The most common hazards
include heavy metals from acid rock drainage and methylmercury from mercury contaminated sediments
DOC 2000 indicates that some bays have been or could be impacted by acid rock drainage and mercury
from abandoned mines
As land-managing agency the U.S Forest Service USFS also has an abandoned mine reclamation
program The program includes an inventory of abandoned mines and locations environmental and/or
resource problems present rehabilitation measures required and potential sources of funding The USFS
has worked with various Regional Water Boards on numerous occasions in the rehabilitation of mine
sites Restoration funding comes from USFS funds the Comprehensive Environmental Response and
Compensation Liability Act and Resource Conservation and Recovery Act sources All lands disturbed
by mineral activities must be reclaimed to condition consistent with resource management plans
including air and water quality requirements SWRCB 2000 SWRCB 2003a
All active mining projects must comply with the federal Surface Mining and Reclamation Act SMA.RAThe goal of SMARA is to have mined lands reclaimed to beneficial end use Local Enforcement
Agencies LEAs usually counties implement SMARA The DOCs Office of Mine Reclamation
provides technical support to LEAs but has limited enforcement authority
Mining projects that could impair water quality or beneficial uses may also be subject to NPDES permits
or conditions under the CWA section 401 Water Quality Certification Program
2.5.6 Atmospheric Deposition
Atmospheric deposition may be potential nonpoint source to bays through either direct or indirect
deposition Indirect deposition reflects the process by which metals and other pollutants such as PAHs
deposited on the land surface are washed off during storm events and enter surface water through storm
water runoff LARWQCB 2005a For example Sabina et al 2005 concluded that atmospheric
January 2011 Baseline for the Analysis 2-10

deposition potentially accounts for as much as 57100% of the total trace metal loads in storm water
within Los Angeles In LARWQCB 2005a and LARWQCB 2005b loadings associated with indirect
atmospheric deposition are included in the storm water waste load allocations Therefore nonpoint source
pollutionfrom atmospheric deposition is not directly addressed but indirectly addressed through storm
water management Typically direct deposition accounts for verysmall fraction of nonpoint source
pollution for example see LARWQCB 2005a and LARWQCB 2005b
2.5.7 Wetlands
Seasonally and permanently flooded wetlands are sites for methyirnercury production due to the presence
of sulfate-reducing bacteria in wetland environments CVRWQCB 2005a Wetlands can be significant
sources of methylmercury production for example the Central Valley Regional Water Board 2005c
estimated that 21000 acres of wetland in the Sacramento-San Joaquin River Delta produce about 16% of
the annual methylmercury load to the watershed complicating issue is that wetland restoration efforts
are ongoing because wetlands provide important services for ecosystems and human communities
Management practices to reduce methylmercury discharge could include aeration changing the stream
channel revegetation sediment removal and levees Some of these practices may be applied upstream to
reduce inorganic mercury in water flowing into the wetland thus reducing methylmercury formation
Other practices may reduce the downstream transport of methylmercury formed in the wetland
CVRWQCB 2005b
2.6 Current Impaired Waters
Under the CWA Section 303d states are required to develop list of water quality limited segments
establish priority rankings for the segments and develop action plans or TMDLs to improve water
quality The listing policy identifies the factors and information that shall by used by the State and
Regional Boards to list and delist water body Factors applicable to pollutants that bioaccumulate from
sediment into fish at concentrations that could be toxic to fish and wildlife include
Bioaccumulation of pollutants in muscle or whole body exceeds pollutant specific guideline using
the binomial distribution
Other evaluation guidelines that are
Applicable to the beneficial use
Protective of the beneficial use
Linked to the pollutant under consideration
Scientifically-based and peer reviewed
Well described
Identifies rangeabove which impacts occur and below which no or few impacts are
predicted For non-threshold chemicals risk levels shall be consistent with comparable
water quality objectives or water quality criteria
Adverse Biological Response in resident organisms compared to reference conditions and
associated elevated sediment chemistry Adverse biological response may include
Reduction in growth
Reduction in reproductive capacity
Abnormal development
Histopathological abnormalities
Other adverse conditions including fish or bird kills
Degradation of biological populationsand communities compared to reference conditions and
associated elevated sediment chemistry
Situation-specific weight of evidence listing factor
January 2011 Baseline for the Analysis 2-11

For each listing the Listing Policy directs the Water Boards to identify the pollutant causing degradation
of the beneficial uses total maximum daily load TML completion date and whether total
maximum daily load is required or whether existing programs can be applied to restore the beneficial use
Exhibit 2-2 summarizes the current impairments for bays and estuaries in California Appendix shows
the complete list of impairments by water body
Exhibit 2-2 Summary of Current 303d List for Toxics for Bays and Estuaries in California
RegionalNumber of Water Acres1 NümbØr of Water Miles1
Board Sediment Tissue Water2 Total Sediment Water2 Total
16075 16075
757 392710 393467 0.6 0.6
155 29681 29836 0.03 0.03
163115 155807 16486 335408 34
43629 43629 21 21
2063 623 2063 4749 11 11
207 13240 13447 0.8 0.8
Total 166297 156430 513884 836611 67 68
Source SWRCB 2010Acres and miles are not unique to medium i.e water bodies may be impaired for sediment tissue and water
Assumed impairment is for water where sediment or tissue is not specified explicitly
There are also number of toxics 303d listings for waters upstream of affected bays and estuaries see
SWRCB 2010 Impaired sediments can be carried downstream and settle into bays and estuaries
contributing to existing impairments or causing new impairments
Under the existing listing policy Regional Water Boards may remove waters from the 303d list or
delist if sediment toxicity or associated sediment quality guidelines are no longer exceeded Regional
Water Boards can delist waters if using the binomial distribution the number of measured exceedances
supports rejection of the null hypothesis Regional Water Boards may also remove waters from the list if
objectives or standards are revised and the site or water meets the revised standards
2.7 Sediment Cleanup and Remediation Activities
There are number of sediment cleanup and remediation programs and activities planned or currently
underway in California
2.7.1 Bay Protection and Toxic Cleanup Program
The State Water Board established the Bay Protection and Toxic Cleanup Program BPTCP to
implement the requirements of Chapter 5.6 of the CWC Section 13394 of Chapter 5.6 requires the State
Water Board and the Regional Water Boards to develop Consolidated Toxic Hot Spots Cleanup Plan
Consolidated Plan The Consolidated Plan identifies and ranks known toxic hot spots based on two-
step process using three lines of evidence and presents descriptions of toxic hot spots actions necessary
to remediate sites the benefits of remediation and range of remediation costs The plan is applicable to
point and nonpoint source discharges that Regional Water Boards reasonably determine to contribute to or
cause the pollution at toxic hot spots
The Consolidation Plan requires Regional Water Boards to implement the remediation action to the extent
that responsible parties can be identified and funds are available and allocated for this purpose When the
January 2011 Baseline for the Analysis 2-12

RegionalWater Boards cannot identify responsible party the Consolidation Plan indicates that they are
to seek funding from available sources to remediate the site The Regional Water Boards determine the
ranking of each known toxic hot spot based on the five general criteria specified in the Consolidation Plan
as shown in Exhibit 2-3
Exhibit 2-3 Toxic Hot Spot Rankinci Criteria
CriteriaCategory High .MQdØfate Low-
Human Health Impacts Human health advisory for Tissue residues in aquatic None
consumption of nonmigratory organisms exceed FDA/DHS action
aquatic life from the site level or U.S EPA screening levels
Aquatic Life Impacts1 Hits in any two biological Hit in one of the measures High sediment or water
measures if associated with associated with high chemistry chemistry
high chemistry
Water Quality Objectives Objectives exceeded Objectives occasionally exceeded Objectives infrequently
regularlyexceeded
Areal Extent of Hot Spot More than 10 acres to 10 acres Less than acre
Natural Remediation Unlikely to improve without May or may not improve without Likely to improve without
Potential intervention intervention intervention
Source SWRCB 2003bRank based on analysis of sediment chemistry sediment toxicity biological field water toxicity TIEs and bioaccumulation
Appendix provides additional information on the enclosed bays listed as known toxic hot spots in the
Consolidated Plan including ranking and reason for listing Exhibit 2-4 provides summary of the
remedial actions and estimated costs for the high priority toxic hot spots Note that several of the remedial
actions identified by the State and Regional Water Boards only characterize the problem at hot spot
Thus the costs identified for those actions do not include all actions necessary to fully remediate the toxic
hot spot Additional funds would be required for remediation after characterization studies are complete
Exhibit 2-4 Summary of Actions and Costs to Address High Priority Known Toxic Hot Spots
Site Source Remedial Actions and Estimated Costs to
-- Remediate Site
Delta Estuary Exports from Placer gold mines Studies to develop mercury control strategy
Cache Creek Mercury mining in the Coast Range Fish eating bird egg studies plus OEHHA
Resuspension of estuarine sediment coordination $335000
Effluent from municipal and industrial Mercury monitoring $1120000
discharges to surface waters Mine remediation feasibility studies $150000
Estuarine mercury studies $1500000
Delta Estuary Application of diazinon as dormant RWB oversight $400000 FY 2002-2003
Entire Delta orchard spray in the agricultural areas of Other oversight $200000 FY 2003-2004
the Central Valley Costs to growers $1 80000-$600000/yr
Implementation of practices $0-$300000/yr
Regulatory compliance $3-$l64Iacre
Continued practices development $1000-
$4060/grower/yr
Monitoring $100000 to $1 million/yr
January 2011 Baseline for the Analysis 2-13
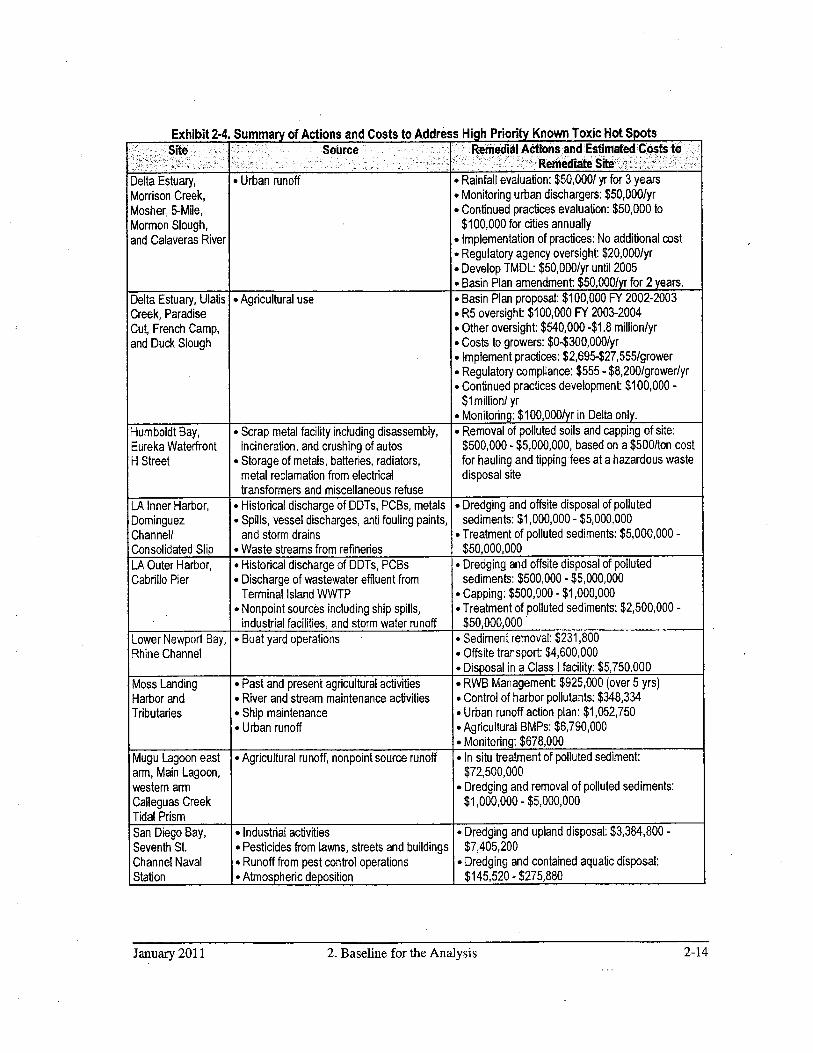
Exhibit 2-4 Summary of Actions and Costs to Address Hiah Priority Known Toxic Hot Spots
Site Source Remedial Actions and Estimated Costs to
Remediate Site
Delta Estuary Urban runoff Rainfall evaluation $50000 yrfor years
Morrison Creek Monitoring urban dischargers $50000/yr
Mosher 5-Mile Continued practices evaluation $50000 to
Mormon Slough $100000 for cities annually
and Calaveras River Implementation of practices No additional cost
Regulatory agency oversight $20000Iyr
Develop TMDL $50000/yr until 2005
Basin Plan amendment $50000/yr for years
Delta Estuary Ulatis Agricultural use Basin Plan proposal $100000 FY 2002-2003
Creek Paradise R5 oversight $100000 FY 2003-2004
Cut French Camp Other oversight $540000 -$1.8 million/yr
and Duck Slough Costs to growers $0-$300000/yr
Implement practices $2695-$27555/grower
Regulatory compliance $555 $8200/grower/yr
Continued practices development $100000
$1 million yr
Monitoring $100000/yr in Delta only
Humboldt Bay Scrap metal facility including disassembly Removal of polluted soils and capping of site
Eureka Waterfront incineration and crushing of autos $500000 $5000000 based on $500/ton cost
Street Storage of metals batteries radiators for hauling and tipping fees at hazardous waste
metal reclamation from electrical disposal site
transformers_and_miscellaneous_refuse
LA Inner Harbor Historical discharge of DDTs PCBs metals Dredging and offsite disposal of polluted
Dominguez Spills vessel discharges anti fouling paints sediments $1000000 $5000000
Channel and storm drains Treatment cf polluted sediments $5000000
Consolidated Slip Waste streams from refineries $50000000
LA Outer Harbor Historical discharge of DDTs PCBs Dredging and offsite disposal of polluted
Cabrillo Pier Discharge of wastewater effluent from sediments $500000 $5000000
Terminal Island WWTP Capping $500000 $1000000
Nonpoint sources including ship spills Treatment of polluted sediments $2500000
industrial facilities and storm water runoff $50000000
Lower Newport Bay Boat yard operations Sediment removal $231800
Rhine Channel Offsite transport $4600000
Disposal in Classfacility $5750000
Moss Landing Past and present agricultural activities RWB Management $925000 over yrs
Harbor and River and stream maintenance activities Control of harbor pollutants $348334
Tributaries Ship maintenance Urban runoff action plan $1052750
Urban runoff Agricultural BMPs $6790000
Monitoring $678000
Mugu Lagoon east Agricultural runoff nonpoint source runoff In situ treatment of polluted sediment
arm Main Lagoon $72500000
western arm Dredging and removal of polluted sediments
Calleguas Creek $1000000 $5000000
Tidal Prism
San Diego Bay Industrial activities Dredging and upland disposal $3384800
Seventh St Pesticides from lawns streets and buildings $7405200
Channel Naval Runoff from pest control operations Dredging and contained aquatic disposal
Station Atmospheric deposition $145520 $275880
January2011 Baseline for the Analysis 2-14
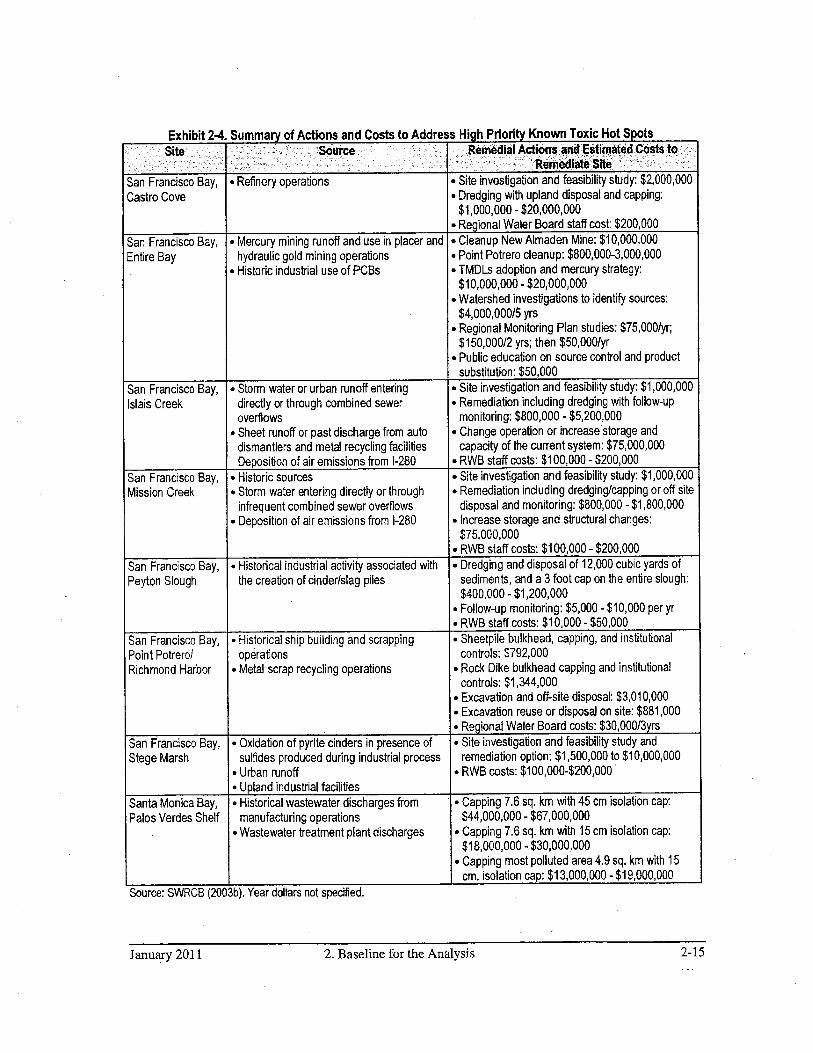
Exhibit 2-4 Summary of Actions and Costs to Address High Priority Known Toxic Hot Spots
Site Source Remedial Actions and EStimated Costs to
Rernediate Site
San Francisco Bay Refinery operaons Site investigaon andfeasibility study $2000000
Castro Cove Dredging with upland disposal and capping
$1000000- $20000000
Regional Water Board staff cost $200000
San Francisco Bay Mercury mining runoff and use in placer and Cleanup New Almaden Mine $10000000
Entire Bay hydraulic gold mining operafions Point Potrero cleanup $800000-3000000
Historic industrial use of PCBs TMDLs adoption and mercury strategy
$10000000- $20000000
Watershed investigations to identify sources
$4000000/S yrs
Regional Monitoring Plan studies $75000/yr
$150000/2 yrs then $50000/yr
Public education on source control and product
substitution_$50000
San Francisco Bay Storm water or urban runoff entering Site investigation andfeasibility study $1000000
Islais Creek direcfly or through combined sewer Remediatiori including dredging with follow-up
overflows monitoring $800000 $5200000
Sheet runoff or past discharge from auto Change operaon or increase storage and
dismantlers and metal recycling facilities capacity of the current system $75000000
Deposition of air emissions from 1-280 RWB staff costs $100000- $200000
San Francisco Bay Historic sources Site investigation and feasibility study $1000000
Mission Creek Storm water entering directly or through Remediation induding dredging/capping or off site
infrequent combined sewer overflows disposal and monitoring $800000 $1800000
Deposition of air emissions from 1-280 Increase storage and structural changes
$75000000
RWB staff costs $100000 $200000
San Francisco Bay Historical industrial activity associated with Dredging and disposal of 12000 cubic yards of
Peyton Slough the creation of cinder/slag piles sediments and foot cap on the entire slough
$400000- $1200000
Follow-up monitoring $5000- $10000 per yr
RWB staff costs $10000- $50000
San Francisco Bay Historical ship building and scrapping Sheetpile bulkhead capping and institutional
Point Potrero/ operations controls $792000
Richmond Harbor Metal scrap recycling operations Rock Dike bulkhead capping and institutional
controls $1344000
Excavation and off-site disposal $3010000
Excavation reuse or disposal on site $881000
Regional Water Board costs $30000/3yrs
San Francisco Bay Oxidation of pyrite cinders in presence of Site investigation andfeasibility study and
Stege Marsh sulfides produced during industrial process remediation option $1500000 to $10000000
Urban runoff RWB costs $100000-$200000
Upland industrial facilities
Santa Monica Bay Historical wastewater discharges from Capping 7.6 sq km with 45 cm isolation cap
Palos Verdes Shelf manufacturing operations $44000000 $67000000
Wastewater treatment plant discharges Capping 7.6 sq km with 15 cm isolation cap
$18000000 $30000000
Capping most polluted area 4.9 sq km with 15
cm isolation_cap_$13000000- $19000000
Source SWRCB 2003b Year dollars not specified
January 2011 Baseline for the Analysis 2-15

2.7.2 TMDLs
There are number of TMDLs in the state that set load limits for pollutant in sediments or target
protection on fish and wildlife For example the San Francisco Bay Regional Water Board recently
adopted two TMDLs to address bay-wide exceedances of the narrative bioaccumulation objective caused
by excessive levels of methylmercury and PCBs in fish tissue SFRWQCB 2006 2008 The Regional
Water Board detennined that high mercury levels in sediments are due in large part to legacy gold
mining operations which have resulted in bay-wide fish consumption advisories The Regional Water
Board derived the mercury targets from the estimated reduction in mercury mass in tissue that would be
needed to be protective of human health and wildlife SFRWQCB 2006 The U.S Fish and Wildlife
Service performed an ecological risk assessment on the methylmercury tissue criteria to confirm that the
TMDL targetconcentration was protective of rare and endangered species in California Unlike mercury
the movement of PCBs and other hydrophobic organochiorine compounds up through the food web can
be predicted with food web models The Regional Water Board developed targets for PCBs based on
human health risk however they also determined that harbor seals and birds such as corniorants and tems
would also be protected SFRWQCB 2007
Other examples include the Santa Ana River Regions effort underway to develop TMDL and site
specific objective SSO to protect wildlife from exposure to selenium that has accumulated in fish tissue
and egg shells The technical workgroup has begun to identify relevant and appropriate endpoints and
targets that protect wildlife in the waterbody
As part of TMDL Regional Water Boards identify potential implementation strategies and estimate the
cost of implementation However Porter-Cologne prohibits Regional Water Boards from prescribing the
exact method of achieving compliance with the targets Thus there is no requirement to follow the
proposed strategies as long as the allowable loadings are not exceeded
Although sources are not required to follow the proposed strategies the recommendations provide an idea
of the typesof activities that could be necessary for compliance with baseline standards
In certain cases implementation activities may not vary based on the pollutant For example storm water
BMPs designed to remove specific metal could be used to remove all metals Implementation activities
for the Calleguas Creek metals and organochiorine pesticides and PCBs TMDLs include
Establish group concentration-based effluent limits for NPDES dischargers
Implement BMPs for nonpoint sources consistent with the Nonpoint Source Plan and Conditional
Waiver Program
Develop Agricultural Water Quality Management Plans and implement agricultural BMPs based
on results of BMP effectiveness studies
Develop agricultural education program to inform growers of the recommended BMPs and the
Management Plan
Implementation plans may also include additional studies to better determine pollutant sources causes of
toxicity or most cost-effective controls For example in implementing the Ballona Creek TMDL the
Regional Water Board conducted field and laboratory studies with enhanced chemistry analyses and
sediment toxicity identification studies for multiple sites The Regional Water Board found that while
chemical contamination and sediment toxicity is present throughout the estuary TMDL target
exceedances showed little relationship to toxicity Rather tests showed that pyrethroid pesticides which
were not included as pollutant of concern in developing the ThIDL targets are the principal cause of the
observed sediment toxicity
Appendix summarizes the targets load allocations and implementation plans for sediment-related
TMDLs completed for enclosed bays and estuaries in the state
January 2011 Baseline for the Analysis2-16

2.7.3 Cleanup and Abatement Orders
Regional Water Boards have issued number of existing cleanup and abatement orders for bays and
estuaries to improve sediment quality and reduce toxicity Under these orders dischargers or companies
are required to cleanup contaminated sediments soils or groundwater to background levels or if
background levels are not technologically or economically feasible to level determined by the Regional
Water Board For example the San Diego Regional Water Board is proposing tentative cleanup order
for the contaminated sediments in the San Diego Bay between Sampson Street extension and the mouth
of Chollas Creek The Regional Water Board has proposed cleanup level that the responsible parties
will be required to achieve
2.7.4 Contaminated Sediment Task Force
In 1997 the governor signed Senate Bill 673 into law requiring the California Coastal Commission and
the Los Angeles Regional Water Board to establish multi-agency Contaminated Sediments Task Force
CSTF to assist in the preparation of long-term management strategy for dredging and disposal of
contaminated sediments in the Los Angeles area The resulting long-term management strategy includes
among other recommendations component focused on the reduction of contaminants at their source
CSTF 2005 The next steps involve implementing the plan The CSTF Management Committee meets
on quarterlybasis to address number of issues including continuing refinement of management tools
e.g BMP toolbox water quality monitoring and sediment quality guidelines CSTF 2005
January 2011 Baseline for the Analysis 2-17

Description of the Amendments
This section describes the applicability of the amendments and the SQOs implementation procedures
and monitoring requirements Also described is the extent of current attainment of the proposed SQOs
3.1 Applicability
The amendments to the Sediment Quality Plan for Enclosed Bays and Estuaries applies to
Enclosed bays1 and estuaries2
Surficial sediments that have been deposited or emplaced below the intertidal zone not to
sediments characterized by less than 5% fines or substrates composed of gravels cobbles or
consolidated rock
The Plan is not applicable to ocean waters including Monterey Bay Santa Monica Bay or inland surface
waters and does not govern dredge material suitability determinations or the management of active
designated or permitted aquatic dredged material disposal or placement sites
3.2 Sediment Quality Objectives
The SQO to protect wildlife and resident finfish prohibits pollutants in sediment at levels that alone or in
combination are toxic to wildlife and resident finfishby direct exposure or bioaccumulate in aquatic life
at levels that are harmful to wildlife or resident finfish by indirect exposure The policy defines wildlife as
tetrapod vertebrates including amphibians reptiles birds and mammals inclusive of marine mammals
and defines resident finfish as any species of bony fish or cartilaginous fish sharks skates and rays
whose adult home range occupies all or part of the water body but does not extend into other water
bodies
3.3 Implementation Procedures
The proposed amendments specify that the Water Boards implement the narrative wildlife and resident
finfish SQOs on case-by-case basis based on an ecological risk assessment In conducting an ecological
risk assessment the Water Boards shall consider any applicable and relevant ecological risk information
including policies and guidance from the following sources
California Environmental Protection Agencys Cal/EPA Office of Environmental Health
Hazard Assessment OEHHACal/EPAs Department of Toxic Substances Control DTSCCalifornia Department of Fish and Game
U.S Environmental Protection Agency
U.S Army Corps of Engineers
National Oceanographic Atmospheric Administration
U.S Fish and Wildlife Service
Enclosed Bays are indentations along the coast which enclose an area of oceanic water within distinct headlands or
harbor works Enclosed bays include all bays where the narrowest distance between headlands or outermost harbor
works is less than 75% of the greatest dimension of the enclosed portion of the bay SWRCB 2006a
2Estuaries and coastal lagoons are waters at the mouths of streams that serve as mixing zones for fresh and ocean
waters during major portion of the year Mouths of streams that are temporarily separated from the ocean by
sandbars are considered estuaries Estuarine waters generally extend from bay or the open ocean to the upstream
limit of tidal action but may extend seaward if significant mixing of fresh and salt water occurs in open coastal
waters SWRCB 2006a
January 2011 Description of Amendments 3-1

When threatened or endangered species are present the Water Boards shall consult with these agencies to
ensure that these species are adequately protected
3.4 Monitoring and Assessment
The proposed amendments do not include monitoring requirements although the ecological risk
assessment specified in the implementation procedures involves monitoring For example DTSCs ERA
guidance CA EPA 1996 indicates that an ERA should include the following steps
Scoping assessment includes site characterization e.g trophic level structure food web
transfer of contaminants biological characterization e.g identification of distinct habitats
identification of species and communities present identification of species indicative of normal
functioning ecosystem identification of common site receptors and pathway assessment e.g
identify potential for contact between receptors and chemicals of concern
Predictive assessment involves selection of representative species and toxicity data
identification of measurement endpoints evaluation of potential exposure pathways and contact
rates and calculation of hazard quotients and hazard index
Validation study refine and validate parameters used to estimate the risk to exposed biota
through sampling and analysis or validate conclusions of predictive assessment through site-
specific laboratory and/or field testing
Impact assessment conduct field testing and/or more extensive laboratory testing to assess the
severity and extent of population and community effects as input to the evaluation of remedial
altematives and refinement of remediation goals
The goal of the ecological risk assessment is to predict potential adverse effects and when appropriate to
measure existing adverse effects of chemical contaminants on the biota on or near site or facility and to
determine levels of those chemicals in the environment that would not be expected to adversely affect the
biota
3.5 Attainment
As discussed in Section there are currently 127 segments of bays and estuaries on the States 2010
303d list for toxic pollutants including 88 listings for sediment quality and 48 sites identified as known
toxic hot spotsunder the State Water Boards BPTCP In addition the State Water Board 2008
identified an additional bays that may be impaired based on the direct effects benthic community SQO
The extent to which those impairments result in direct or indirect toxicity to wildlife and finfish represents
the level of existing nonattainment of the proposed wildlife and finfish SQO
The proposed Plan amendments could also result in additional efforts to assess attainment of fish and
wildlife beneficial uses in bays and estuaries which in turn could result in identification of new
impairments or changes to existing impairments Exhibit 3-1 indicates the possible outcomes under the
proposed Plan amendments
January 2011 Description of Amendments 3-2

Exhibit 3-1 Potential Incremental Impacts Associated with the Proposed Plan Amendments
Assessment of .Asses5thent Under Proposed SQO
Attainment of Existing
Beneficial UsesImpairment not attributable to sediments Impairment attnbutable to sediments
Sediment quafity improvementImpairment not No change in sediment quality
Potential incremental assessment and control
attributable to sediments Potential incremental assessment costscosts
Sediment quality remains the same which Change in sediment quality if better data lead
lm airment attributablemay be lower than under implementation of to change in control strategies
to sedimentsbaseline narrative objective Potential incremental assessment costs
Potential incremental assessment costs but potential incremental costs or cost-savings
will avoid unnecessary control costs depending on differences in control strategies
January 2011 Description of AmendmenEs 3-3

Methods of Compliance and Potential Costs
This section identifies potential means of compliance with the Plan and the potential costs of those
measures
4.1 Monitoring and Assessment
As discussed in Section there are extensive monitoring and assessment activities supporting the
baseline regulatory framework Absent the proposed Plan amendments these activities will continue and
additional efforts will be undertaken e.g as Regional Boards assess compliance with existing objectives
for sediment toxicity and address sites currently impaired for sediment toxicity That is data is needed
to determine whether sediments are in compliance with existing narrative objectives for sediment toxicity
related to fish and wildlife Similarly in instances in which sediments exceed baseline objectives for
sediment toxicity assessment of the causes and sources will be needed in order to identify means of
compliance with the objectives These activities which can include developing work plan/project
management collecting additional data conducting ERAs or toxicity identification evaluations TIEssurface water modeling and other analysis may be conducted as part
of developing TMDL SCCWRP2005 Parsons et al 2002 as cited in WSPA 2007
The objective of ERA is to evaluate the potential for biological effects to occur as result of exposure to
one or more stressors in the environment ERA is flexible iterative process that can be used for any site
segment or waterbody either prospectively to assess future conditions or retrospectively to assess risk
associated with spills or releases or existing degradation U.S EPA 1998 ERAs may be relatively
simple or extremely complex depending upon the site conditions number of pollutants exposure
pathways and receptors In all cases variety of expertise is needed to ensure that the results of the ERA
are relevant for the species exposure pathways and pollutants associated with the site segment or
waterbody
SWRCB 2008 provided unit costs for monitoring to assess the SQOs to protect the benthic community
direct effects Monitoring efforts for ERAs to assess indirect effects to wildlife and finfish beyond the
monitoring necessary to assess water quality criteria and the SQOs for direct effects could involve
collecting finfish and documenting the presence of deformities irregularities in size or population effects
and collection and analysis of wildlife tissue or bird eggs Exhibit 4-1 provides unit costs for these types
of analyses Sample collection costs may vary based on factors such as water depth abundance of fish
species sediment characteristics may cause unsuccessful grabs that need to be repeated and distance
between stations Although data for some parameters may not be needed at each sampling site the total
costs per sampling event could be in the rangeof $7400 to $11700
Exhibit 4.1 Incremental Sampling Costs to Assess Finfish and Wildlife Health1
PªajtØ ETQtai
Fish Collection for sampling or observation2 $1500 $1800 per site $1500 $1800
Metals suite tissue $175 $225 per sample $1050 $1350
Mercury tissue $30 $80 per sample $180 $480
Chlorinated pesticides tissue $200 $575 per sample $1200 $3450
PCBs suite tissue $575 $775 per sample $3450 $4650
Total cost per sampling event NA NA $7380 $11730
Source SCCWRP 2011 and SWRCB 2011aThree fish per species and two species per site
Incremental to sampling requirements to assess attainment of SQOs for direct effects in bays and estuaries See SWRCB
2008
Includes boat materials and labor for observing fish communities or collecting fish for sampling
January2011 Methods of Compliance and Potential Costs 4-1

To assess attainment of the proposed SQO the number of stations from which data should be collected
will vary based on water body-specific factors including
area
tidal flow and/or direction of predominant currents
historic and or legacy conditions in the vicinity of the water body
nearby land and marine uses or actions
beneficial uses
potential receptors of concern
changes in grain size salinity water depth and organic matter
other sources or discharges in the immediate vicinity of the water body
Exhibit 4-2 shows the minimum number of samples for different size bays assuming that sediment
conditions are relatively homogeneous These estimates reflect goal of providing spatially-based
measure of fish and wildlife health with level of precision similar to that used in regional monitoring
programs throughout California Different numbers of stations may be required for targeted or focused
studies
Exhibit 4-2 Potential Number of Samples to Assess Compliance
Bay Size acres Number of Sites
500
500-5000 12
5000 30
Source SCCWRP 2007
The State Water Board estimates that there are approximately bays and estuaries with areas greater than
5000 acres 10 with areas between 500 and 5000 acres and 84 with areas less than 500 acres for which
monitoring to assess compliance with the proposed SQO could be necessary Assuming that assessments
of fish and wildlife health would be based on the number of sites per water body in Exhibit 4-2
incremental monitoring costs could range from approximately $5.5 million to $8.8 million
For bays and estuaries not currently on the 303d list for sediment toxicity that would exceed the SQO
under the proposed Plan amendments the next stepunder the Plan would be sequential approach to
manage the sediment appropriately including developing and implementing work plan to confirm and
characterize pollutant-related impacts identify pollutants and identify sources and management actions
including adopting TMDL if appropriate The cost of this sequential approach will vary depending on
number of factors including the extent of baseline efforts and studies underway to address other
impairment issues and the number of potential stressors to the area Note that in the absence of the Plan
amendments Regional Water Boards could identify these waters as exceeding the narrative objectives
and thus incremental impacts associated with TMDL development and pollution controls would be zero
The State Water Board 2001 estimates that development of complex TMDLs including an
implementation plan may cost over $1 million In addition SWRCB 2003a indicates that LMDL
development and mercury reduction strategy cost for the San Francisco Bay could range from $10 miUion
to $20 million These estimates provide some indication of costs that can be associated with sequential
approaches to managing designated use impairments Thus the estimates provides an approximation of
the potential magnitude of both costs incremental listings and cost savings changes in listings due to
additional information to accurately identify the cause of the impairment that may be associated with
changes in the identification of impairments under the baseline objectives and the proposed Plan
amendments
January 2011 Methods of Compliance and Potential Costs 4-2

4.2 Potential Controls
For waters that Regional Water Boards identify as being impaired based on the wildlife and finfish SQO
under the Plan remediation actions and/or source controls will be needed to bring them into compliance
Many bays and estuaries are already listed for sediment impairments or are exceeding the benthic
community or human health SQOs and therefore would require controls under baseline conditions
When the baseline controls are identical to the ones that would be implemented for the wildlife and
finfish SQO there is no incremental cost or cost savings associated with the Plan amendments When the
baseline controls differ there is potential for either incremental costs or cost-savings associated with the
Plan amendments
For an increased in pollution controls cost associated with nonattainment of the wildlife and finfish SQOthe concentration of toxic pollutants in discharges would have to meet levels that are more stringent than
what is needed to achieve compliance with existing objectives e.g since they could have to control
based on the benthic community and human health SQOs narrative sediment objectives or the CTRIncremental costs for controls may also result from the identification of additional chemical stressors that
are not included in the CTh or Basin Plans For example in Ballona Creek the Regional Water Board
identified pyrethoid pesticides as the cause of sediment toxicity and notmetals and other toxic pollutants
for which CTR criteria and sediment TMDL targets that already existed City of Los Angeles WPD2010 Since many practices that may be employed under existing TMDLs are applicable for controlling
the mobilization of pollutants in general this situation is also difficult to estimate For example the
TMDL for pesticides and PCBs in the Calleguas Creek watershed indicates that the BMPs needed to
achieve the nutrient and toxicity TMDLs for the watershed would likely reduce pesticides and PCBs to
necessary levels as well LARWQCB 2005c
Thus without being able to identify the particular pollutants causing toxicity to wildlife and finfish and
the development of discharge concentrations needed to achieve the objectives the needed controls to
achieve those concentrations are difficult to estimate The following sections discuss these issues
Appendix provides additional information on unit costs
4.2.1 Municipal and Industrial Facilities
Regional Water Boards regulate municipal and industrial wastewater treatment facilities through the
NPDES permit program If these dischargers have potential to cause or contribute to an exceedance of
water quality standards contained in Phase of the Plan Basin Plans narrative and numeric the CTR or
any other applicable policy permit writers assign effluent limits Regional Water Boards may also adopt
more stringent criteria for specific pollutants where necessary e.g to meet TMDL site-specific
objectives If the Plan requires municipal and industrial dischargers to reduce pollutant concentrations to
levels below those required by existing standards it is likely that these facilities would implement source
control to eliminate the pollutant from entering their treatment plant or industrial process or pursue
regulatory relief e.g variance rather than install costly end-of-pipe treatment However it is
uncertain whether such situation would arise as result of the Plan amendments
4.2.2 Agriculture
Regional Water Boards regulate farmers primarily through the conditional WDR waivers that require
compliance with water quality standards Regional Water Boards may also require farmers to meet more
stringent criteria for specific pollutants where necessary e.g to meet TMDL site-specific objectives
AJ1 of the affected Regional Water Boards have narrative objectives that specifically prohibit the
discharge of pesticides and/or toxic pollutants that cause detrimental effects in aquatic life or to animals
January 2011 Methods of Compliance and Potential Costs 4-3

and humans Thus even in the absence of the Plan amendments farmers would be prohibited from
causing or contributing to toxicity to wildlife and finfish
4.2.3 Storm Water
An incremental level of control for storm water sources e.g need to implement new practices increase
the frequency of existing practices or install structural controls that might not be required under existing
objectives may or may not be necessary for compliance with the Plan amendments For any situation in
which storm water sources are specifically required to control toxic pollutants to levels that are lower than
what would be necessaryin the absence of the Plan amendments potential means of compliance include
Increased or additional nonstructural BMPs institutional education or pollution prevention
practices designed to limit generation of runoff or reduce the pollutants load of runoff
Structural controls engineered and constructed systems designed to provide water quantity or
quality control
The following sections provide general discussion of the types of activities and associated costs that may
be affected by changes in control strategies attributable to the Plan
Nonstructural BMPs
Nonstructural BMPs can bevery
effective in controlling pollution generation at the source which in turn
can reduce or eliminate the need for costly end-of-pipe treatment or structural controls Most municipal
SWMPs primarily implement nonstructural BMPs to meet existing permit requirements It is possible that
additional or increased efforts for certain nonstructural BMPs could be used for compliance with the Plan
Examples include expanding an existing outreach and education program to larger or new target
audience refocusing source control efforts on pollutants and sources of concern e.g pesticide/herbicide
use or integrated pest management program increasing program compliance efforts and increasing
frequency duration or efficiency of maintenance practices such as street sweeping
Although nonstructural practices play an invaluable role in protecting surface water costs and
effectiveness are not easily quantified primarily because there are no design standards for these practices
SWRCB 2006c and because many have been education-oriented with high up-front costs to develop
outreach materials For example the State Water Boards Erase the Waste campaign is public education
program that works to reduce storm water pollutibn and improve the environment of coastal and inland
communities The State Water Board launched the campaign in Los Angeles County in August 2003 as
2-year $5 million outreach campaign SWRCB 2004c However the materials produced are now
available statewide SWRCB 2006c Thus expanding the program to other regions would not be as
costly as starting similar program from scratch
recent survey of California municipalities reports mean annual cost of $26 per household for
nonstructural SWMP measures including public education and outreach illicit discharge detection and
elimination construction site storm water runoff control post construction storm water management in
new development and redevelopment and pollution prevention and good housekeeping for municipal
operations such as street sweeping CSU Sacramento 2005 Incremental costs to improve the
effectiveness of these measures may have similar order of magnitude although actual costs will vary
depending on the baseline program the incremental activities municipality size and degree of
coordination with other municipalities Appendix providesadditional examples of nonstructural BMP
cost estimates
Structural Controls
January 2011 Methods of Compliance and Potential Costs 4-4

There are variety of structural means to control the quantityand quality of storm water runoff including
infiltration systems detention systems retention systems constructed wetlands filtration systems and
vegetated systems The cost for any particular structure depends on the type of control the quantity of
water treated and site-specific factors such as land cost Incremental costs or cost-savings associated with
the Plan amendments cannot be estimated without information on differences if any in structural control
strategies between baseline and Plan conditions Appendix provides examples of cost estimates for
individual structures
4.2.4 Marinas and Boating Activities
Control measures that address toxic pollutants from marinas and boating activities include
Use of biocide-free paint on boats or more frequent boat hull cleaning to prevent leaching of toxic
paints
Performing above waterline boat maintenance activities in lined channel to preventdebris from
entering the water
Performing below waterline boat maintenance on land in area with runoff and dust controls
Developing collection system for toxic materials at harbors
Although water quality controls for marinas are less common than controls for urban storm water
information on TMDL and toxic hotspot cleanups indicates that they may be included in baseline
strategies for impaired sites However there may also be incremental costs or cost savings at these sites as
result of the Plan amendments Sites that are not exceeding current objectives but would be exceeding
the wildlife and finfish SQO could incur incremental control costs if boating activities contribute to
sediment toxicity that harms fish and wildlife Conversely there may be cost savings for sites exceeding
current standards that are not exceeding the proposed SQO
Incremental costs or cost savings will depend on the pollutants of concern the types of activities
undertaken and in some cases the number of boats affectecL Appendix provides examples of the types
of activities that may be included in incremental costs or cost savings if baseline activities are not
necessary
4.2.5 Wetlands
Incremental wetland controls may or may not be necessary to achieve compliance with the proposed
SQO Potential means of compliance include aeration channelization revegetation sediment removal
levees or combination of these practices
For methyhnercury and selenium in particular protection of wildlife may result in the need for
incremental controls in certain water bodies to reduce pollutants to levels that would be necessary in the
absence of the Plan amendments e.g protection of human health only However the location and extent
of controls needed and the types of controls are unknown One example of efforts underway elsewhere is
the Anderson Marsh wetland on Cache Creek This wetland Is located within 1000-acre park that also
includes oak woodlands and riparian areas Various management practices mentioned above may be
applied upstream to reduce inorganic mercury in water flowing into the wetland thus reducing
methylmercury formation and other practices may reduce the downstream transport of methylmercury
formed in the wetland The Central Valley Regional Water Board 2005b provides capital cost estimates
for controlling methylmercury export from Anderson March ranging from $200000 to $1 million and
OM costs ranging from $20000 to $100000 per year
January 2011 Methods of Compliance and Potential Costs 4-5

4.2.6 Cleanup and Remediation Activities
There is uncertainty as to whether incremental cleanup and remediation activities will be required as
result of the Plan amendments In addition based on the implementation plans for existing TMDLs
Regional Water Boards are likely to pursue source controls for ongoing sources and only require
remediation activities for historical pollutants with no known ongoing sources However for any
situation in which cleanup or remediation would be required that would not be conducted in the absence
of the Plan amendments costs will depend on the technical feasibility of different strategies e.g
capping removal and disposal removal and treatment and disposal the proximity of source material for
capping or to appropriate treatment and disposal facilities whether disposal facilities exist or whether
new facilities must be built as well as other factors Costs for any sediment remediation actions necessary
as result of the Plan could be similar to those estimated by the Regional Water Board for hot spot
cleanup shown in Exhibit 2-5 Appendix provides additional discussion regarding potential costs
January 2011 Methods of Compliance and Potential Costs 4-6

Analysis of Statewide Costs
This section provides summary of the economic considerations of the Plan amendments and discusses
the key sources of uncertainty in the analysis
5.1 Sediment Quality and Costs in the Absence of the Plan
There are currently 127 segments of bays and estuaries on the States 2010 303d list for toxic pollutants
including 88 listings for sediment quality and 48 sites identified as known toxic hot spots under the State
Water Boards BPTCP In addition the State Water Board 2008 identified an additional bays that may
be impaired based on the direct effects benthic community SQO These conditions require substantial
resources to be spent over the next decades for monitoring assessment TMDL development pollution
controls and sediment cleanup and remediation These resources include an estimated $87.6 million to
$1.03 billion for cleanup and remediation of toxic hot spotsthat are of high priority SWRCB 2003b
All Regional Water Boards currently have narrative objectives for toxic substances toxicity pesticides
bioaccumulation or combination of these categories Although these narrative objectives are subject to
interpretation and are implemented according to each Regional Water Boards policy any water body
could potentially be listed because of detrimental physiological responsesin animals or aquatic life
bioaccumulation in biota or fish resulting in adverse effects to aquatic life and wildlife sediment toxicity
or high concentrations of toxic substances especially pesticides in sediments There is uncertainty
regarding whether the TMDLs developed or under development for listed waters would result in restoring
beneficial uses Jndeed TMDLs are often phased such that evaluation of early actions can result in
changes or redirection of future actions Thus additional costs could be incurred in the future in order to
eliminate sediment toxicity to wildlife and finfish in bays and estuaries
5.2 Sediment Quality and Costs under the Plan
As shown in Section 4.1 incremental costs associated with monitoring and assessment of the wildlife and
finfish SQO could be as much as $5.5 million to $8.8 million Where assessment indicates that the
proposed SQO is not being attained there could be additional costs associated with more comprehensive
ERAs and TMDL development and implementation and remedial actions
Note however that these actions could also occur in the absence of the Plan based on existing monitoring
and assessment practices For example Anchor Environmental 2006 performed an ERA for the Rhine
Channel sediment remediation feasibility study The Rhine Channel is toxic hotspot under the Water
Boards Bay Protection Program and on the 303d list for copper pesticides chiordane DDT PCBs and
sediment toxicity in lower Newport Bay The ERA focused on risks associated with bioaccumulation and
trophic transfer from sediment into fish and wildlife including benthic and pelagic forage fish and higher
trophic level species including California halibut harbor seal and brown pelican for copper mercury
selenium DDE arid PCBs The purpose of the ERA was to assess and characterize existing risks to
aquatic life and biota associated with contaminants in sediment Anchor Environmental 2006 used the
results to evaluate potential management actions Thus incremental costs associated with the proposed
Plan amendments are highly uncertain
5.3 Uncertainties
Data limitations prevent estimating incremental control costs or cost savings associated with the proposed
Plan amendments In addition there is also uncertainty regarding baseline conditions that may affect the
evaluation of the incremental economic impacts of the narrative SQOs For example existing TMDLs and
January 2011 Analysis of Statewide Costs 5-1
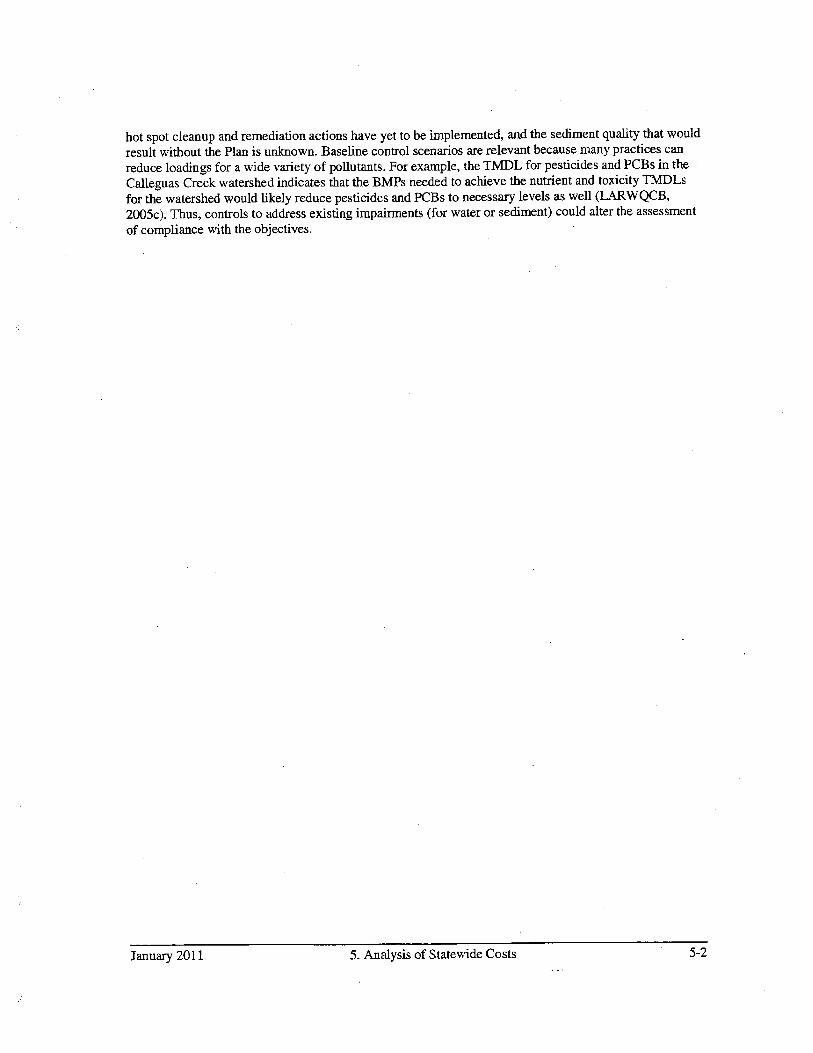
hot spot cleanup and remediation actions have yet to be implemented and the sediment quality that would
result without the Plan is unknown Baseline control scenarios are relevant because many practices can
reduce loadings for wide variety of pollutants For example the TMDL for pesticides and PCBs in the
Calleguas Creek watershed indicates that the BMPs needed to achieve the nutrient and toxicity TMDLs
for the watershed would likely reduce pesticides and PCBs to necessary levels as well LARWQCB2005c Thus controls to address existing impairments for water or sediment could alter the assessment
of compliance with the objectives
January 2011 Analysis of Statewide Costs 5-2

References
Alameda 2003 Alameda Countywide Clean Water Program Stormwater Quality
Management Plan July 2001 June 2008
Anchor Environmental 2006 Feasibility Study and Alternatives Evaluation Rhine Channel Sediment
Remediation Newport Bay California January
California Coastal Commission CCC 2004 California Clean Marina Toolkit May
California Environmental Protection Agency CA EPA 1996 Guidance for Ecological Risk Assessment
at Hazardous Waste Sites and Permitted Facilities Part Overview Department of Toxic Substances
Control Human Ecological Risk Division
California State University CSU Sacramento 2005 NPDES Stormwater Cost Survey Prepared for
State Water Resources Control Board
Central Valley Regional Water Quality Control Board CVRWQCB 2007 Basin Plan Amendments to
the Water Quality Control Plan for the Sacramento River and San Joaquin River Basins for the Control of
Diazinon and Chlorpyrifos Runoff into the Sacramento and Feather Rivers Final Staff Report May
Central Valley Regional Water Quality Control Board CVRWQCB 2006 Amendments to the Water
Quality Control Plan for the Sacramento River and San Joaquin River Basins for the Control of Diazinon
and Chlorpyrifos Runoff into the Sacramento-San Joaquin Delta Final Staff Report June
Central Valley Regional Water Quality Control Board CVRWQCB 2005a Sacramento-San Joaquin
Delta Estuary TMDL for Methyl and Total Mercury Draft Staff Report August Sacramento CA
Central Valley Regional Water Quality Control Board CVRWQCB 2005b Amendments to the Water
Quality Control Plan for the Sacramento River and San Joaquin River Basins for the Control of Mercury
in Cache Creek Bear Creek Sulphur Creek and Harley Gulch Staff Report October Rancho Cordova
CA
Central Valley Regional Water Quality Control Board CVRWQCB 2005c Amendments to
the Water Quality Control Plan for the Sacramento River and San Joaquin River Basins for the Control of
Diazinon and Chiorpyrifos Runoff into the Lower San Joaquin River Final Staff Report October
City of Los Angeles Watershed Protection Division WPD 2010 Ballona Creek Estuary Toxics Total
MaximumDaily Load TMDL Implementation Plan IF Ballona Creek TMDL IF Stakeholder
Workshop September 21 2010
Contaminated Sediment Task Force CSTF 2005 Long Term Management Study
Dana Point 2003 City of Dana Point Standard Urban Stormwater Mitigation Plan SUSMP Also
Known as The Citys Water Quality Management Plan WQMP
Department of Conservation DOC 2000 Californias Abandoned Mines Report on the Magnitude
and Scope of the Issue in the State June
Hunt and Doll 2007 Management Practices for Marina Guide for Operators February
January 2011 References 6-1

Los Angeles Regional Water Quality Control Board LARWQCB 2005a Total Maximum Daily Loads
for Toxic Pollutants in Ballona Creek Estuary July 2005
Los Angeles Regional Water Quality Control Board LARWQCB 2005b Total Maximum Daily Load
for Toxic Pollutants in Marina del Rey Harbor Draft August 2005
Los Angeles Regional Water Quality Control Board LARWQCB 2005c Calleguas Creek Watershed
OC Pesticides and PCBs TMDL Technical Report April
Orange County 2003 Orange County Stormwater Program 2003 Drainage Area Management Plan
DAMP
Parsons et al 2002 Assessment of sediment toxicity and quality in Patrick Bayou Segment 1006 Harris
County Texas Prepared for Patrick Bayou TMDL Lead Organization For Submission to Texas Natural
Resource Conservation Commission
Sabina L.D JR Limb K.D Stolzenbachb K.C Schiffa 2005.Contribution of Trace Metals from
Atmospheric Deposition to Stormwater Runoff in Small Impervious Urban Catchment Water Research
July
San Diego Regional Water Quality Control Board SDRWQCB 2007 Fact SheetiTechnical Report for
Tentative Order No R9-2007-0002 NPDES No CAS0108740 Waste Discharge Requirements for
Discharges of Urban Runoff from the Municipal Separate Storm Sewer Systems MS4s Draining the
Watersheds of the County of Orange the Incorporated Cities of Orange County and the Orange County
Flood Control District within the San Diego Region July 2007
San Diego Regional Water Quality Control Board SDRWQCB 2005 Total MaximumDaily Load for
Dissolved Copper in Shelter Island Yacht Basin San Diego Bay February
San Francisco Bay Regional Water Quality Control Board SFRWQCB 2010 Order No R2-2010-0060
NPDES No CA0037702 Water Quality Control Plan San Francisco Bay Region
San Francisco Bay Regional Water Quality Control Board SFRWQCB 2008 Total Maximum Daily
Load for PCBs in San Francisco Bay Final Staff Report for Proposed Basin Plan Amendment February
13
San Francisco Bay Regional Water Quality Control Board SFRWQCB 2007 Waste Discharge
Requirements for Municipal and Industrial Wastewater Discharges of Mercury to San Francisco Bay
San Francisco Bay Regional Water Quality Control Board SFRWQCB 2006 Mercury in San Francisco
Bay Proposed Basin Plan Amendment and Staff Report for Revised Total MaximumDaily Load TMDLand Proposed Mercury Water Quality Objectives August
San Francisco Bay Regional Water Quality Control Board SFBRWQCB 1999 Reissuing Waste
Discharge Requirements for Order No 99-058 NPDES Permit No CA0029912
San Francisco Estuary Institute 2009 Regional Monitoring Program 2010 Detailed Workplan FINAL
December 22
Southern California Coastal Water Research Project SCCWRP 2011 Personal communication with
Steve Bay Principal Scientist January
January 2011 References 6-2

Southern California Coastal Water Research Project SCCWRP 2007 Personal communication with
Steve Bay Principal Scientist June
Southern California Coastal Water Research Project SCCWRP 2005 Southern California Bight 2003
Regional Monitoring Program Sediment Toxicity May
State Water Resources Control Board SWRCB 201 la Personal communication with Chris Beegan
Engineering Geologist January
State Water Resources Control Board SWRCB 2011b California Integrated Water Quality System
Project CIWQS Regulated Facilities Report Generated January 17 2011
State Water Resources Control Board SWRCB 2010 2010 Clean Water Act Section 303d List of
Water Quality Limited Segments
State Water Resources Control Board 2008 Final Staff Report Water Quality Control Plan for
Enclosed Bays and Estuaries Part Sediment Quality September 2008
State Water Resources Control Board SWRCB 2006a CEQA Scoping Meeting Informational
Document Development of Sediment Quality Objectives for Enclosed Bays and Estuaries August
State Water Resources Control Board SWRCB 2006b California Nonpoint Source Encyclopedia May
State Water Resources Control Board SWRCB 2006c Staff Report Revision of the Clean
Water Act Section 303d List of Water Quality Limited Segments Volumes II and ifi
State Water Resources Control Board SWRCB 2006d Informational Document Public Scoping
Meeting for Proposed Methylmercury Objectives for Inland Surface Waters Enclosed Bays and
Estuaries in California December
State Water Resources Control Board SWRCB 2004a Nonpoint Source Biennial Progress Report June
2001 through June 2003 May
State Water Resources Control Board SWRCB 2004b Policy for Implementation and Enforcement of
the Nonpoint Source Pollution Control Program May 20
State Water Resources Control Board SWRCB 2004c Storm Water Public Education Program
Resident Population Telephone Survey 2004 Evaluation and Next Steps
State Water Resources Control Board SWRCB 2003a Nonpoint Source Program Five-Year
Implementation Plan July 2003 through June 2008 December
State Water Resources Control Board SWRCB 2003b Consolidated Toxic Hot Spots Cleanup Plan
Volumes and II August
State Water Resources Control Board SWRCB 2001 Total Maximum Daily Loads TMDL Questions
Answers Online at http//www.waterboards.ca.gov/tmdlldocs/tmdl_factsbeet.pdf
State Water Resources Control Board SWRCB 2000 Nonpoint Source Program Strategy and
Implementation Plan 1998-20 13 January
January 2011 References 6-3
United States Environmental Protection Agency U.S EPA 2001 Water Quality Criterion for the
Protection of Human Health Methylmercury Office of Science and Technology Office of Water EPA
823-R-01-001
United States Environmental Protection Agency U.S EPA 1998 Guidelines for Ecological Risk
Assessment U.S Environmental Protection Agency Risk Assessment Forum Washington DCEPA16301R095/002F
Ventura County 2001 Ventura Countywide Stormwater Quality Management Program
Stormwater Quality Management Plan
Weisberg and Bay 2007 The Development of Multiple Line of Evidence Framework for the
Integration of Sediment Quality Data
January 2011 References 6-4
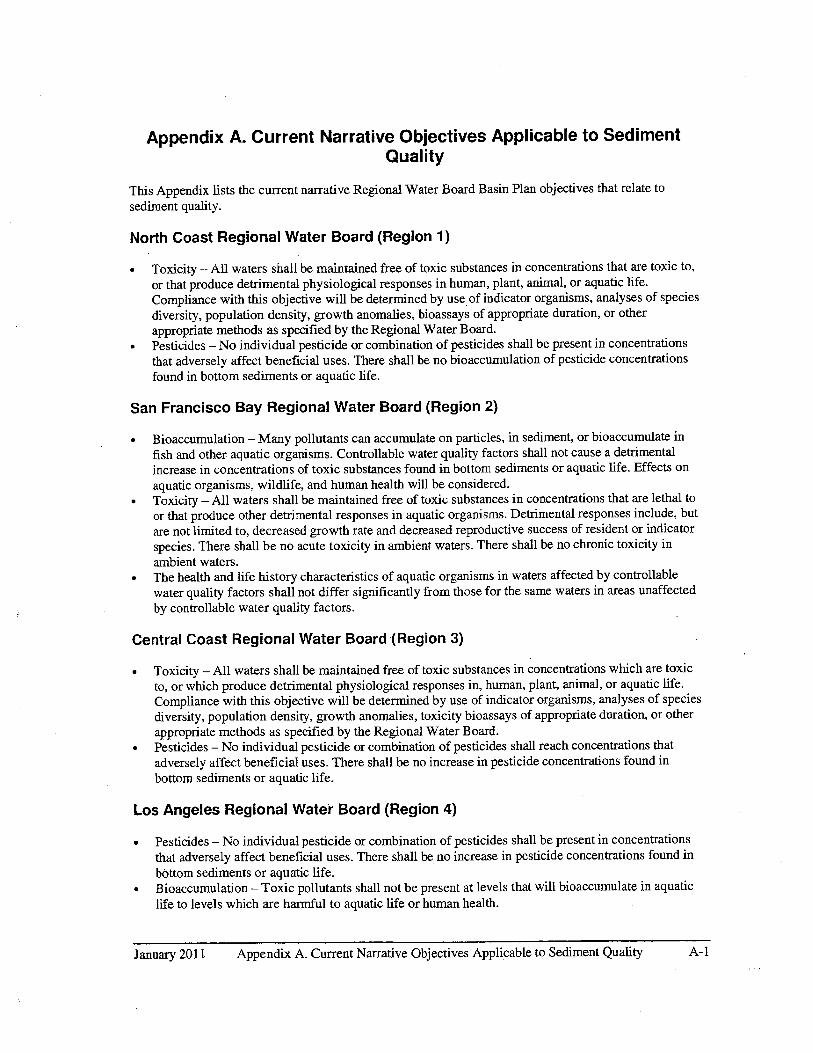
Appendix A. Current Narrative Objectives Applicable to Sediment
Quality
This Appendix lists the current narrative Regional Water Board Basin Plan objectives that relate to
sediment quality
North Coast Regional Water Board Region
Toxicity All waters shall be maintained free of toxic substances in concentrations that are toxic to
or that produce detrimental physiological responsesin human plant animal or aquatic life
Compliance with this objective will be determined by use of indicator organisms analyses of species
diversity population density growth anomalies bioassays of appropriate duration or other
appropriatemethods as specified by the Regional Water Board
Pesticides No individual pesticide or combination of pesticides shall be present in concentrations
that adversely affect beneficial uses There shall be no bioaccumulation of pesticide concentrations
found in bottom sediments or aquatic life
San Francisco Bay Regional Water Board Region
Bioaccumulation Many pollutants can accumulate on particles in sediment or bioaccumulate in
fish and other aquatic organisms Controllable water quality factors shall not cause detrimental
increase in concentrations of toxic substances found in bottom sediments or aquatic life Effects on
aquatic organisms wildlife and human health will be considered
Toxicity All waters shall be maintained free of toxic substances in concentrations that are lethal to
or that produce other detrimental responses in aquatic organisms Detrimental responses include but
are not limited to decreased growth rate and decreased reproductive success of resident or indicator
species There shall be no acute toxicity in ambient waters There shall be no chronic toxicity in
ambient waters
The health and life history characteristics of aquatic organisms in waters affected by controllable
water quality factors shall not differ significantly from those for the same waters in areas unaffected
by controllable water quality factors
Central Coast Regional Water Board Region
Toxicity All waters shall be maintained free of toxic substances in concentrations which are toxic
to or which produce detrimental physiological responses in human plant animal or aquatic life
Compliance with this objective will be determined by use of indicator organisms analyses of species
diversity population density growth anomalies toxicity bioassays of appropriate duration or other
appropriate methods as specified by the Regional Water Board
Pesticides No individual pesticide or combination of pesticidesshall reach concentrations that
adversely affect beneficial uses There shall be no increase in pesticide concentrations found in
bottom sediments or aquatic life
Los Angeles Regional Water Board Region
Pesticides No individual pesticide or combination of pesticidesshall be present in concentrations
that adversely affect beneficial uses There shall be no increase in pesticide concentrations found in
bottom sediments or aquatic life
Bioaccumulation Toxic pollutants shall not be present at levels that will bioaccumulate in aquatic
life to levels which are harmful to aquatic life or human health
January 2011 Appendix Current Narrative Objectives Applicable to Sediment Quality A-l

Toxicity All waters shall be maintained free of toxic substances in concentrations that are toxic to
or that produce detrimental physiological responsesin human plant animal or aquatic life
Compliance with this objective will be determined by use of indicator organisms analyses of species
diversity population density growth anomalies bioassays of appropriate duration or other
appropriate methods as specified by the Regional Water Board
Central Valley Regional Water Board Region
No individual pesticide or combination of pesticides shall be present in concentrations that adversely
affect beneficial uses discharges shall not result in pesticide concentrations in bottom sediments or
aquatic life that adversely affect beneficial uses total identifiable persistent chlorinated hydrocarbon
pesticides shall not be present in the water column at concentrations detectable within the accuracy of
analytical methods approved by EPA or the Executive Officer and pesticide concentrations shall not
exceed the lowest levels technically and economically achievable
All waters shall be maintained free of toxic substances in concentrations that produce detrimental
physiological responses in human plant animal or aquatic life This objective applies regardless of
whether the toxicity is caused by single substance or the interactive effect of multiple substances
Compliance with this objective will be determined by analyses of indicator organisms species
diversity population density growth anomalies and biotoxicity tests of appropriate duration or other
methods as specified by the Regional Water Board
Santa Ana Regional Water Board Region
Toxic Substances Toxic substances shall not be discharged at levels that will bioaccumulate in
aquatic resources to levels which are hannful to human health The concentrations of toxic substances
in the water column sediments or biota shall not adversely affect beneficial uses
San Diego Regional Water Board Region
Pesticides No individual pesticide or combination of pesticides shall be present in the water column
sediments or biota at concentrations that adversely affect beneficial uses Pesticides shall not be
present at levels which will bioaccumulate in aquatic organisms to levels which are harmful to human
health wildlife or aquatic organisms
Toxicity All waters shall be maintained free of toxic substances in concentrations that are toxic to
or that produce detrimental physiological responses in human plant animal or aquatic life
Compliance with this objective will be determined by use of indicator organisms analyses of species
diversity population density growth anomalies bioassays of appropriate duration or other
appropriate methods as specified by the Regional Water Board
January 2011 Appendix Current Narrative Objectives Applicable to Sediment Quality A-2

Appendix Current Water Quality Objectives
This Appendix lists the current water quality objectives for toxic pollutants under the California Toxics
Rule CTR
Exhibit B-I CTR Priority Toxic Pollutant Criteria concentrations in pgIL
JiunianHealthFreshwater Saltwater
For côæsurnption ofPollutant
Water OrganismsAcute Chronic Acute Chronic
Organisms Only
Anmony 14 4300
Arsenic 340 150 69 36
Beryllium
Cadmium 4.3 2.2 42 9.3
Chromium III 550 180
Chromium VI 16 11 1100 50
Copper 13 139.0 4.8 3.1 1300
Lead 65 652.5 210 8.1
Mercury0.05 0.051
Nickel 470 47052 74 8.2 610 4600
Selenium 5.0 290 71
Silver 3.4 3.4 1.9
Thallium 1.7 6.3
Zinc2 120 120 90 81
Cyanide 22 5.2 700 220000
Asbestos 7000000
fibers/L
2378-TCDD dioxin 0.000000013 0.000000014
Acrolein 320 780
Acrylonitrile0.059 0.66
Benzene 1.2 71
Bromoform4.3 360
Carbon Tetrachloride 0.25 4.4
Chlorobenzene 680 21000
Chtorodibromomethane 0.401 34
Chioroethane
2-Chloroethylvinyl Ether
Chloroform
Dichlorobromomethane 0.56 46
11 -Dichloroethane
2-Dichloroethane0.38 99
11-Dichloroethylene0.057 3.2
2.Dichloropropane0.52 39
3-Dichloropropylene10 1700
Ethylbenzene 3100 29000
Methyl Bromide 48 4000
Methyl Chloride
Methylene Chloride 4.7 1600
1122-Tetrachlorethane0.17 11
Tetrachloroethylene0.8 8.85
Toluene 6800 200000
January 2011 Appendix Current Water Quality ObjectivesB-i

Exhibit B-I CTR Priority Toxic Pollutant Criteria concentrations in pgIL
Human HealthFreshwater Saltwater
Pollutant
For consumption of
.- Water OrganismsAcute Chronic Acute Chronic
Organisms Only
2-Trans-Dichloroethylene700 140000
-Trichloroethane
112-Trichioroethane0.60 42
Trichloroethylene2.7 81
Vinyl Chloride 525
2-Chlorophenol120 400
24-Dichlorophenol93 790
24-Dimehtylphenol540 2300
2-Methyl-46-Dinitrophenol13.4 765
24-Dinitrophenol 70 14000
2-Nitrophenol
4-N irtophen ci
3-Methy-4-Chlorophenol
Pentachlorophenol 0.28 8.2
Phenol 21000 4600000
246-Trichlorophenol2.1 6.5
Acenaphthene 1200 2700
Acenaphthylene
Anthracene 9600 110000
Benzidine 0.00012 0.00054
BenzoaAnthracene0.0044 0.049
BenzoaPyrene 0.0044 0.049
BenzobFluoranthene0.0044 0.049
BenzoghiPerylene
Ben zokFluoranthene0.0044 0.049
Bis2-ChloroethoxyMethane
Bis2-ChIoroethylEther0.031 1.4
Bis2-ChloroisopropylEther 1400 170000
Bis2-EthylhexyiPhthalate1.8 5.9
4-Bromophenyl Phenyl Ether
Butylbenzyl Phthaate 3000 5200
2-Chloronaphthalene 1700 4300
4-Chiorophenyl Phenyl Ether
Chrysene0.0044 0.049
DibenzoahAnthracene0.0044 0.049
12 Dichlorobenzene 2700 17000
13 Dichlorobenzene 400 2600
14 Dichlorobenzene 400 2600
33-Dichlorobenzidine0.04 0.077
Diethyl Phthalate 23000 120000
Dimethyl Phthalate 313000 2900000
Di-n-Butyl Phthaiate 2700 12000
24-Dinitrotoluene 0.1 9.1
26- Dinitrotoluene
Di-n-Octyl Phthaiate
2-Diphenylhydrazine0.040 0.54
January 2011 Appendix Current Water Quality ObjectivesB-2
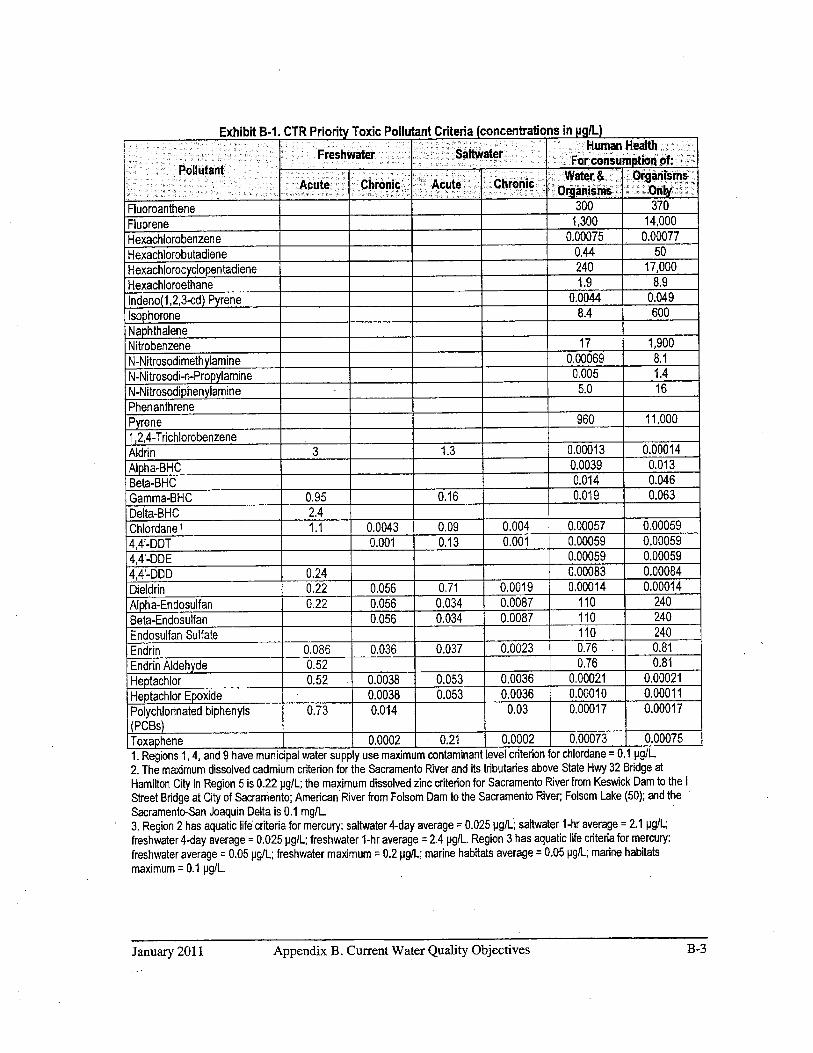
Exhibit B-I CTR Priority Toxic Pollutant Criteria concentrations in igIL
Human HealthFreshwater Saltwater
Pollutant
-Forconsumptuon of
Acute Chronic Acute ChronicOrgarnsms
Fluoroanthene 300 370
Fluorene 1300 14000
Hexachlorobenzene 0.00075 0.00077
Hexachlorobutadiene 0.44 50
Hexachlorocyclopentadiene240 17000
Hexachloroethane 1.9 8.9
lndeno123-cd Pyrene0.0044 0.049
Isophorone8.4 600
Naphthalene
Nitrobenzene 17 1900
N-Nitrosodimethylamine0.00069 8.1
N-Nitrosodi-n-Propylamine0.005 1.4
N-Nitrosodiphenylamine5.0 16
Phenanthrerie
Pyrene960 11000
24-Trichlorobenzene
Aldrin 1.3 0.00013 0.00014
Alpha-BHC0.0039 0.013
Beta-BHC 0.014 0.046
Gamma-BHC 0.95 016 0.019 0.063
Delta-BHC 2.4
Chlordane1 1.1 0.0043 0.09 0.004 0.00057 0.00059
44-DDT 0.001 0.13 0.001 000059 0.00059
44-DDE 0.00059 0.00059
44-DOD 0.24 0.00083 0.00084
Dieldrin 0.22 0.056 0.71 0.0019 0.00014 0.00014
Alpha-Endosulfan 0.22 0.056 0.034 0.0087 10 240
Beta-Endosulfan 0.056 0.034 0.0087 110 240
Enclosulfan Sulfate 110 240
Endrin 0.086 0.036 0.037 0.0023 0.76 0.81
Endrin Aldehyde0.52 0.76 0.81
Heptachlor 0.52 0.0038 0.053 0.0036 000021 0.0002
Heptachior Epoxide 0.0038 0.053 0.0036 0.00010 0.0001
Polychiorinated biphenyls 0.73 0.014 0.03 0.00017 0.00017
PCBsToxaphene 0.0002 0.21 0.0002 0.00073 0.00075
Regions 14 and have municipal water suppy use maximum contaminant level criterion for chiordane 0.1 igIL
The maximum dissolved cadmium criterion for the Sacramento River and its tributaries above State Hwy 32 Bridge at
Hamilton City in Region is 0.22 pgIL the maximum dissolved zinc criterion for Sacramento River from Keswick Dam to the
Street Bridge atCity
of Sacramento American River from Folsom Dam to the Sacramento River Folsom Lake 50 and the
Sacramento-San Joaquin Delta is 0.1 mg/L
Region has aquatic life criteria for mercury saltwater 4-day average 0.025 JgIL saltwater 1-hr average 2.1 pg/L
freshwater 4-day average 0.025 pg/L freshwater 1-hr average 2.4 pg/L Region has aquatic life criteria for mercury
freshwater average 0.05 pg/L freshwater maximum 0.2 JgIL marine habitats average 0.05 pg/L marine habitats
maximum 0.1 pglL
Januaxy 2011 Appendix Current Water Quality ObjectivesB-3

Appendix Nonpoint Source Plan Management Measures
This appendix provides description of the management measures MMs applicable to sediment toxicity
control from Californias Nonpoint Source Management Program Plan
There are five MMs in the NPS Program Plan relevant to sediment toxicity control for agriculture
Exhibit C-i
Exhibit C-I Agricultural Management Measures
MM Code Agriculture MM Title Description
Where erosion and sedimentation from agricultural lands affects coastal
waters and/or water bodies listed as impaired by sediment landowners must
Erosion and Sedimentdesign and install or apply combination of practices to reduce solids and
IAControl
associated pollutants in runoff during all but the larger storms Alternatively
landowners may apply the erosion component of Resource Management
System as defined in the U.S Department of Agriculture Natural Resources
Conservation Service Field Office Technical Guide
Implementation will occur through cooperation with the Department of
Pesticide Regulation by development and adoption of reduced risk
management strategies including reductions in pesticide use evaluation of
pest crop and field factors use of Integrated Pest Management 1PMconsideration of environmental impacts in choice of pesticides calibration of
Pesticide Management equipment and use of anti-backflow devices 1PM strategies are key and
include evaluating pest problems in relation to cropping history and previous
pest control measures and applying pesticides only when an economic benefit
will be achieved Pesticides should be selected based on their effectiveness to
control target pests and environmentat impacts such as their persistence
toxicity and leaching potential
Irrigationwater would be applied uniformly based on an accurate
measurement of crop water needs and the volume ofirrigation water applied
IrrigationWater considering limitations raised by such issues as water rights pollutant
Management concentrations water delivery restrictions salt control wefland water supply
and frost/freeze temperature management Additional precautions would apply
when chemicals are applied through irrigation
Implement pollution prevention and education programs such as activities that
cause erosion and loss of sediment on agricultural land activities that cause
discharge from confined animal facilities excluding Concentrated Animal
Feeding Operations to surface water activities that cause excess delivery of
Education/Outreach nutrients and/or leaching of nutrients activities that cause contamination of
surface water and ground water from pesticides grazing activities that cause
physical disturbance to sensitive areas and the discharge of sediment animal
waste nutrients and chemicals to surface and ground waters irrigation
activities that cause nonpoint source pollution of surface waters
Source SWRCB 2000
There are 11 MMs that address the various forestry operations and practices Exhibit C.2 The Forest
Practice Rules FPRs also closely reflect these silvicultural MMs
January 2011 Appendix Nonpôint Source Plan Management Measures C-i

Exhibit C-2 Forestry Management Measures
MM Code Code Forestry MM Title Description
Silvicultural activities should be planned to reduce potential delivery of
pollutants to surface waters by addressing the timing location and design
2A Pre-Harvest Planning of harvesting and road construction site preparation identification of
sensitive or high-erosion risk areas and the potenal for cumulative water
quality impacts
Streamside ManariementProtect against soil disturbance and reduce sediment and nutrient delivery
2BAreas SMAs
to waters from upland activities Intended to safeguard vegetated buffer
areas along surface waters to protect the water quality of adjacent streams
Road construction/reconstruction should be conducted so as to reduce
sediment generation and delivery by following preharvest plan layouts and
2CRoad designs for road systems incorporating adequate drainage structures
construction/Reconstruction properly installing stream crossings avoiding road construction in SMAs
removing debris from streams andstabilizing areas of disturbed soil such
as road fills
Management of roads to prevent sedimentation minimize erosion maintain
stability and reduce the risk that drainage structures and stream crossings
2D Road Mana ementwill fail or become less effective Implementation includes inspections and
maintenance actions to prevent erosion of road surfaces and to ensure the
effectiveness of stream-crossing structures Also address appropriate
methods for closing roads that are no longer in use
Addresses skid trail location and drainage management of debris and
petroleum and proper harvesting in SMAs Timber harvesting practices that
2E Timber Harvesting protect water quality and soil productivity also have economic benefits by
reducing the length of roads and skid trails reducing equipment and road
maintenance costs and providing better road protection
Impacts of mechanical site preparation and regeneration operations
particularly in areas that have steep slopes or highly erodible soils or where
the site is located in close proximity to water bodycan be reduced by
2FSite Preparation and Forest confining runoff onsite This measure addresses keeping slash material out
Regeneration of drainage ways operating machinery on contours timing of activities and
protecting ground cover in ephemeral drainage areas and SMAs Careful
regeneration of harvested forestlands is important in protecting water quality
from disturbed soils
Addresses the rapid revegetation of areas disturbed during timber
Reveretation of Disturbedharvesting and road constructionparticularly areas within harvest units or
2HAreas
road systems where mineral soil is exposed or agitated e.g road cuts fill
slopes landing surfaces cable corridors or skid trails with special priority
for SMAs and steep slopes near drainage ways
Application of pesticides fertilizers and other chemicals used in forest
management should not lead to surface water contamination Pesticides
must be properly mixed transported loaded and applied and their
Forest Chemicalcontainers disposed of properly Fertilizers must also be properly handled
21
Mana ementand applied since they also may be toxic depending on concentration and
exposure Includes applications by skilled workers according to label
instructions careful prescription of the type and amount of chemical to be
applied use of buffer areas for surface waters to prevent direct application
or deposition and spill contingency planning
WeUands ForestForested wetlands provide many beneficial water quality functions and
2JMana ement
provide habitat for aquatic life Activities in wetiand forests should be
conducted to protect the aquatic functions of forested wetiands
January2011 Appendix Noripoint Source Plan Management Measures C-2

Exhibit C-2 Forestry Management Measures
MM Code Code Forestry MM Title DesÆiption
Incorporate postharvest monitoring including implementation monitonng
to determine whether the operation was conducted according to
2K Postharvest Evaluation specifications and effectiveness monitoring after at least one winter
period to determine whether the specified operation prevented or minimized
discharges
2L Education/OutreachImplement pollution prevention and education programs to reduce NPS
pollutants generated by applicable silvicultural activities
Source SWRCB 2000
Californias 15 urban MMs Exhibit C-3 are organized to parallel the land use development process to
address the prevention and treatment of pollution during all phases of urbanization this strategy relies
primarily on pollution prevention or source reduction practices
Exhibit C-3 Urban Management Measures
MMCÔdØ Urban MMTitte .- Description
1ADeveloping Areas
Encourage land use and development planning on watershed scale that
takes into consideration sensitive areas that by being protected will
Watershed Protection
maintain or improve water quality
Developing Areas Aims to protect areas that provide important water quality benefits and limit
Site Development land disturbance
Addresses increased pollutant loads associated with developed lands and
Developing Areasthe hydrologic alterations resulting from development that affects runoff
volume and timing Developers can use innovative site planning techniques31CNew Development
or incorporate runoff management practices to reduce the hydrologic impact
of development on receiving waters
Construction SitesAims to reduce erosion through implementation of erosion and sediment
3.2A Construction Site Erosion
and Sediment Control
control practices
2BConstruction Sites
Implement chemical control plan to limit application generation and
Chemical Controlmigration of toxic substances ensure proper storage and disposal of toxic
materials and apply nutrients to establish and maintain vegetation
Includes the implementation of noristructural controls to reduce pollutant
33A Existing Developmentloads and volume of storm water runoff
Includes comprehensive planning by the regulatory authority including
measures to protect sensitive areas such as nutrient-limited waters and
shellfish harvest areas Measures might include prohibitions setbacks or
4AOn-site Disposal Systems
OSDS New OSDSsrequirements for the use of innovative treatment systems to effect greater
treatment of sewage Also includes performance-based requirements for the
siting design and installation of systems and inspection of newly installed
systems
Addresses the programmatic aspects of OWTS management to ensure that
systems that are installed as designed are inspected and maintained
On-site Disposal Systems regularly to prevent failures Public education about proper sewage3.4B
OSDS Operating OSDSs treatment system use and maintenance is an important part of this measure
as is development and enforcement of policies to prevent or minimize the
impacts of OWTS failures
Transportation Development
3.5AAims to protect areas that provide important water quality benefits and limit
land disturbance
Planning_Siting_and
January 2011 Appendix Nonpoint Source Plan Management Measures C-3

Exhibit C-3 Urban Management Measures
MM Code Urban MM Title Description
Developing Roads and
Highways
Aims to design bridges to minimize damage to riparian or wetland habitats
Trans ortation Develo mentand treating runoff from bridge decks before it is allowed to enter
5Bwatercourses Bridge maintenance activities should be conducted using
Brid es
containment practices to prevent pollutants from entering the water or
riparian habitat below Restoration of damaged riparian or instream habitats
should be done after bridge construction maintenance and demolition
Transportation Development Implement chemical control plan to limit application generation and
3.5C migration of toxic substances ensure proper storage and disposal of toxic
Construction Projects materials and apply nutrients to establish and maintain vegetation
Transportation Development Implement chemical control plan to limit application generation and
3.5D migration of toxic substances ensure proper storage and disposal of toxic
Chemical Control materials and apply nutrients to establish and maintain vegetation
Transportation Development Incorporate pollution prevention procedures into the operation and
35E maintenance of roads highways and bridges to reduce pollutant loadings to
Operation and Maintenance surface waters
Acknowledges the fact that roads built in the past may not have the same
level of runoff control and treatment that is expected today and these older
Transportation Development roads may be contributing to pollution problems in receiving waters
5FMunicipalities responsible for road and bridge rights-of-way should
Road Highway and Bridge undertake an assessment of the roads and bridges contribution to surface
Runoff Systems waters and identify opportunities for installing new treatment practices
Based on water quality prioritiesand the availability of staff and funding
resources schedule should be devised to implement these practices
Education/Outreach
3.6A Pollution PreventionUsed to reduce the amount of pollutants generated or allowed to be
General Sourcesexposed to runoff
Source SWRCB 2000
There are 16 MMs to address marina and boating sources of nonpoint pollution Exhibit C-4 Effective
implementation of these MMs can ensure appropriate operation and maintenance practices and encourage
the development and use of effective pollution control and education efforts The MMs cover the
following operations and facilities
Any facility that contains 10 or more slips piers where 10 or more boats may tie up or any facility
where boat for hire is docked
Any residential or planned community marina with 10 or more slips
Any mooring field where 10 or more boats are moored
Public or commercial boat ramps
Boat maintenance or repair yards on or adjacent to the water typically boat yards are separate
entities from marinas and are regulated under NPDES storm water permits
January2011 Appendix Nonpoint Source Plan Management Measures C-4

Exhibit C-4 Marinas and Boating Management Measures
MM Code MarinasMM Title Description
Provides for maximum flushing and circulation of surface waters
Assessment Siting and Design Marinathrough marina
sitingand designs These practices can reduce
4.1AFlushing
the potential for water stagnation maintain biological
productivity and reduce the potential for toxic accumulation in
bottom sediment
Use of vegetative stabilization methods is preferred over the useAssessment Siting and Design
of structural stabilization methods where shoreline erosion is
Shoreline Stabilization
pollution problem
Involves implementing runoff control strategies to remove at
Assessment Siting and Design least 80 percent of suspended solids from storm water runoff
4.1
Storm Water runoff coming from boat maintenance areas some boat yards may
conform to this provision through NPDES permits
Requires that fueling stations be located and designed to contain
Assessment Siting and Design accidental fuel spills in limited area and that fuel containment
4.1
Fueling Station Design equipment andspill contingency plans be provided to ensure
quick spill response
Requires that facilities be installed at new and expanding
marinas where needed for the proper recycling or disposal of
Assessment Sitingand Design
solid wastes e.g oil filters lead acid batteries used absorbent4.1
Waste Management Facilities
pads spent zinc anodes and fish waste as applicable and
liquid materials e.g fuel oil solvents antifreeze and paints
Involves properly disposing of solid wastes produced by the
4.2AOperation and Maintenance
operation cleaning maintenance and repair of boats to limit
Solid Waste Control
entry of these wastes to surface waters
4.2COperation and Maintenance Promotes sound fish waste management through combination
Liquid Material Control of fish cleaning restrictions education and proper disposal
Requires provision and maintenance of the appropriate storage
4.2DOperation and Maintenance transfer containment and disposal facilities for
liquidmaterials
Petroleum Control commonly used in boat maintenance as well as encouraging the
recycling of these materials
Aimed at reducing the amount of fuel and oil that leaks from fuel
4.2EOperation and Maintenance
tanks and tank air vents during the refueling and operation of
Boat Cleaning and Maintenanceboats
4.2GOperation and Maintenance Involves prevention of turbidity and physical destruction of
Boat Operation shallow-water habitat resulting from boat wakes and prop wash
Education and OutreachRequires that public education outreach and training programs
4.3A be instituted to prevent and control improper disposal of
Public Education
pollutants into State waters
Source SWRCB 2000
State Water Resources Control Board SWRCB 2000 Noripoint Source Program Strategy arid
Implementation Plan 1998-2013 January
January 2011 Appendix Nonpoint Source Plan Management Measures C-5

Appendix Current Toxics 303d Listings and TMDLs
This appendix shows the 303d list impairments for toxic pollutants in bays and estuaries in California
and provides summary of the targets sources and potential implementation activities for TMDLs
addressing toxic pollutants
Exhibit 0-1 Toxic Pollutant 303d List Impairments for Bays and Estuaries in California
Water Body Name Sediment Tissue Water
Region
Eureka Plain HU Humboldt Bay
Dioxin Toxic Equivalents
PCBs
Rei ion
Chiordane DDT Dieldrin
Carquinez Strait
Dioxin compounds Furan
Compounds Mercury PCBs
PCBs dioxin-like Selenium
Castro Cove Richmond San Pablo Dieldrin Mercury
Basin PAHs Selenium
Chlordane DOT Dieldrin
Central Basin San Francisco part of Dioxin compounds Furan
Mercury PAHsSF Bay Lower Compounds Mercury PCBs
PCBs dioxin-like Selenium
Chiordane
Islais Creek Dieldrin PAHs Hydrogen Sulfide
Sediment Toxicity
Chlordane
Dieldrin LeadMission Creek Hydrogen Sulfide PAHs
Mercury PCBs
Silver Zinc
Chlordane DOT Dieldrin
Oakland Inner Harbor Fruitvale Site Chlordane PCBs Dioxin compounds Furan
part of SF Bay Lower Sediment Toxicity Compounds Mercury PCBsPCBs dioxin-like Selenium
Chlordane Chiordane DOT Dieldrin
Oakland Inner Harbor Pacific Dry-
dock Yard Site part of SF BayCopper Dieldrin Dioxin compounds Furan
LowerLead Mercury Compounds Mercury PCBs
PAHs PCBs Zinc PCBs dioxin-like Selenium
Pacific Ocean at Pillar Point Mercury
Chlordane DOT Dieldrin
Richardson Bay
Dioxin compounds Furan
Compounds Mercury PCBs
PCBs dioxin-like
Chiordane ODT Dieldrin
Sacramento San Joaquin Delta
Dioxin compounds Furan
Compounds Mercury PCBs
PCBs dioxin-like Selenium
Chiordane DDT Dieldrin
San Francisco Bay Central
Dioxin compounds Furan
Compounds Mercury PCBs
PCBs dioxin-like Selenium
January 2011 Appendix Sediment-Related 303d Listings and TMDLs D-1

Exhibit D-1 Toxic Pollutant 303d List ImDairments for Bays and Estuaries in California
Water Body Name Sediment Tissue Water
Chlordane DDT Dieldrin
Dioxin compounds FuranSan Francisco Bay Lower
Compounds Mercury PCBsPCBs dioxin-like
Chiordane DDT Dieldrin
Dioxin compounds FuranSan Francisco Bay South
Compounds Mercury PCBs
PCBs dioxin-like Selenium
Lead Mercury Chlordane Dieldrin Dioxin
San Leandro Bay part of SF BayPAH5 Pesticides compounds Furan
LowerZinc Compounds Mercury
Chlordane DDT Dieldrin
Dioxin compounds FuranSan Pablo Bay
Compounds Mercury PCBsPCBs dioxin-like Selenium
Chiordane Copper DacthalStege Marsh
Dieldrin Mercury PCBs Zinc
Chiordane DDT Dieldrin
Dioxin compounds FuranSuisun Bay
Compounds Mercury PCBs
PCBs dioxin-like Selenium
Suisun Marsh Wetlands Mercury
Suisun Slough Diazinon
Tomales Bay Mercury
Re ion
Carpinteria Marsh El Estero Marsh Priority Organics
Elkhorn Slough Pesticides
Goleta SloughlEstuary Priority Organics
Monterey Harbor Sediment Toxicity Metals
Moro Cojo Slough Pesticides
Chlorpyrifos Diazinon NickelMoss Landing Harbor Sediment Toxicity
Pesticides
Old Salinas River Estuary Pesticides
Pacific Ocean Point Ano Nuevo to
Dieldrin
Soguel Point
Pacific Ocean at Avila Beach AvilaPCBs
Pier
Salinas River Lagoon North Pesticides
Region
Abalone Cove Beach DDT PCBs
Amarillo Beach DOT PCBs
Big Rock Beach DOT PCBs
Bluff Cove Beach DOT PCBs
Cabrillo Beach Outer DDT PCBs
Calleguas Creek Reach was Mugu DDT Sediment Chiordane DDT Copper Dieldrin Mercury
Lagoon on 1998 303d list Toxicity Endosulfan PCBs Nickel Toxaphene Zinc
Carbon Beach DOT PCBs
Caserock Beach DOT PCBs
January 2011 Appendix Sediment-Related 303d Listings and TMDLs D-2

Exhibit D-1 Toxic Pollutant 303d List Impairments for Bays and Estuaries in California
Water Body Name Sediment Tissue Water
Chiordane LeadChlordane DDT Dieldrin
Colorado Lagoon PAHs SedimentPCBs
Toxicity Zinc
Benthic Community Effects
BenzoapyreneDominguez Channel Estuary unlined DDT Sediment Chlordane DDT Dieldrin Benzoportion below Vermont Aye Toxicity Zinc Lead
Chrysene C1-C4 PCBs
Phenanthrene Pyrene
Escondido Beach DDT PCBs
Flat Rock Point Beach Area DDT PCBs
nspiration Point Beach DDT PCBs
La Costa Beach DOT PCBs
Las Flores Beach DOT PCBs
Las Tunas Beach DOT PCBs
Long Point Beach DOT PCBs
Los Angeles Harbor Cabrillo Marina Benzoapyrene DDT PCBs
Cadmium
Chlordane2-Methylnaphthalene Benthic
Community Effects
ChromiumLos Angeles Harbor Consolidated Chlordane DDT PCBs Benzoapyrene
Slip
Copper DDTToxapherie Benzo
Lead Mercury
PCBs SedimentChrysene C1-C4 Dieldrin
Phenanthrene PyreneToxicity Zinc
Benzoapyrene
BenzoChlordane Chrysene C1-C4
Los Angeles Harbor Fish Harbor Sediment Toxicity Copper DDT
Dibenz Lead
Mercury PAHs PCBs
Phenanthrene Pyrene Zinc
Los Angeles Harbor Inner CabritloDDT PCBs
Beach Area
Chiordane DDTLos Angeles River Estuary
PCBs Sediment
Queensway BayToxicity
Benthic Community Effects
Benzoapyrene ChryseneLos Angeles/Long Beach Inner Harbor Sediment Toxicity
C1-C4 Copper DDT PCBs
Zinc
Los Angeles/Long Beach Outer HarborSediment Toxicity DDT PCBs
inside breakwater
Los Cemtos Channel ChlordaneBis2ethylhexylphthalate
Copper Lead Zinc
Malaga Cove Beach DDT PCBs
Malibu Beach DOT
Malibu Lagoon Benthic Community Effects
Malibu Lagoon Beach Surfrider DOT PCBs
January 2011 Appendix Sediment-Related 303d Listings and TMDLs D-3

Exhibit D-1 Toxic Pollutant 303d List Impairments for Bays and Estuaries in California
Water Body Name Sediment Tissu.e -- Water
ChlordaneChlordane DDT Dieldrin
Marina del Rey Harbor Back BasinsCopper Lead
Fish Consumption AdvisoryPCBs Sediment
PCBsToxicity Zinc
Nicholas Canyon Beach DDT PCBs
Palo Verde Shoreline Park Beach Pesticides
Paradise Cove Beach DDT PCBs
Point Dume Beach DDT PCBs
Point fermin Park Beach DDT PCBs
Port Hueneme Harbor Back Basins DDT PCBs
Port Hueneme Pier PCBs
Portuguese Bend Beach DDT PCBs
Puerco Beach DDT PCBs
Redondo Beach DDT PCBs
Robert Meyer Memorial Beach DDT PCBs
Royal Palms Beach DDT PCBs
DDT SedimentDDT Chiordane PCBsSan Pedro Bay Near/Off Shore Zones
Toxicity
Santa Clara River Estuary ChemA Toxaphene Toxicity
DDT PCBs DOT Fish ConsumptionSanta Monica Bay Offshore/Nearshore
Sediment Toxicity Advisory PCBs
Sea Level Beach DOT PCBs
Topanga Beach DOT PCBs
Trancas Beach Broad Beach DDT PCBs
Ventura Marina Jetties DOT PCBs
Whites Point Beach ODT PCBs
Zuma Beach Westward Beach ODT PCBs
Region
Calaveras River Lower from BellotaUnknown Toxicity
Weir to Stockton Diverting Canal
Chiorpyrilos DDT Diazinon
Delta Waterways Stockton Ship Dioxin Furan Compounds
Channel Group Pesticides Mercury
PCBs Unknown Toxicity
-Chiorpyrifos DOT Oiazinon
Delta Waterways central portion Group Pesticides Mercury
Unknown Toxicity
Chiorpyrifos DDT Oiazinon
Delta Waterways eastern portion Group Pesticides Mercury
Unknown Toxicity
Chlorpyrifos DOT Diazinon
Delta Waterways export area Group Pesticides Mercury
Unknown Toxicity
Chlordane Chiorpyrifos DOT
Olazinon Group PesticidesDelta Waterways northern portion
Mercury PCBs Unknown
Toxicity
Delta Waterways northwesternChlorpyrifos DOT Olazinon
Group Pesticides Mercuryportion
Unknown Toxicity
January 2011 Appendix Sediment-Related 303d Listings and TMDLs D-4

Exhibit D-1 Toxic Pollutant 303d List lmDairments for Bays and Estuaries in California
Water Body Name Sediment -- Tissue Water
Chlorpyrifos DDT Diazinon
Delta Waterways southern portion Group Pesticides Mercury
Unknown Toxicity
Chiorpyrifos DDT Diazinon
Delta Waterways western portion Group Pesticides Mercury
Unknown Toxicity
Fresno Slough from Graham Road to Chiorpyrifos Unknown
James Bypass Fresno County Toxicity
Re ion
Anaheim Bay Sediment Toxicity Dielcirin PCBs Nickel
Balboa Beach DDT Dieldrin PCBs
Bolsa Chica State Beach Copper Nickel
Huntington Beach State Park PCBs
Chiordane Copper LeadHuntington Harbour Sediment Toxicity PCBs
Nickel
Newport Bay Lower entire lower bay
including Rhine Channel Turning Chlordane Copper DDT
Basin and South Lido Channel to east
Sediment Toxicity PCBs Pesticides
end of H-J Moorings
Newport Bay Upper Ecological Chiordane Copper DDTSediment Toxicity
Metals PCBs PesticidesReserve
Copper Lead Mercury PCBsRhine Channel Sediment Toxicity
Seal Beach PCBs
Re ion
Dana Point Harbor Copper Toxicity Zinc
Mission Bay area at mouth of RoseLead
Creek only
Mission Bay area at mouth ofLead
Tecolote Creek only
Mission Bay at Quivira Basin Copper
Oceanside Harbor Copper
Pacific Ocean Shoreline Imperial PCBsBeach Pier
San Diego BayPCBs
San Diego Bay Shoreline 32nd St SanSediment Toxicity Benthic Community Effects
Diego Naval Station
San Diego Bay Shoreline Chula Vista
MarinaCopper
San Diego Bay Shoreline DowntownSediment Toxicity Benthic Community Effects
Anchorage
San Diego Bay Shoreline North of
24th Street Marine Terminal
Sediment ToxicityBenthic Community Effects
San Diego Bay Shoreline Seventh
Street ChannelSediment Toxicity Benthic Community Effects
San Diego Bay Shoreline Vicinity of
St and Broadway PiersSediment Toxicity Benthic Community Effects
San Diego Bay Shoreline at AmericasCopper
Cup Harbor
January 2011 Appendix Sediment-Related 303d Listings and TMDLs D-5

Exhibit D-1 Toxic Pollutant 303d List ImDairments for Bays and Estuaries in California
Water Body Name Sediment Tissue Water
San Diego Bay Shoreline at CoronadoCopper
Cays
San Diego Bay Shoreline at Glorietta
CopperBay
San Diego Bay Shoreline at HarborCopper
Island East Basin
San Diego Bay Shoreline at HarborCopper
Island West Basin
San Diego Bay Shoreline at Marriott
CopperMarina
San Diego Bay Shoreline betweenCopper
Sampson and 28th Streets
San Diego Bay Shoreline betweenMercury PAHs PCBs Zinc
Sampson and 28th Streets
San Diego Bay Shoreline near ChollasSediment Toxicity Benthic Community Effects
Creek
San Diego Bay Shoreline nearSediment Toxicity Ben thic Community Effects
Coronado Bridge
San Diego Bay Shoreline near Switzer Chlordane
Creek PAHs
Benthic Community EffectsSan Diego Bay Shoreline near subSediment Toxicity
Toxicitybase
San Diego Bay Shelter Island YachtCopper Dissolved
Basin
Lead Nickel Pesticides
Tijuana River EstuaryThallium
Source SWRCB 2010
Exhibit D-2 Summary of Toxic Pollutant TMDLs for Bays and Estuaries
Numeric Targets Load Allocations Implementation
Ballona Creek Estuary Toxics TMDL LARWQCB 2005a
Sediment Chiordane 0.5
1.tg/kgDDT 1.58.tgIkg
PCBs 22.7 pg/kg PAHs
4022 pg/kg Cadmium 1.2
mg/kg Copper 34 mg/kg
Lead 48.7 mg/kg Silver
1.0 mg/kg Zinc 15mg/kg
Direct Air Chlordane 0.02 g/yr
DDT 0.1 g/yr PCBs 1.0 g/yr
PAHs 170 g/yr Cadmium 0.05
kg/yr Copper 1.4 kg/yr Lead
kg/yr Silver 0.04 kg/yr Zinc
kg/yr
Open Space Chiordane 0.02
g/yr DOT 0.1 g/yr PCBs 1.0
g/yr PAHs 160 g/yr Cadmium
0.05 kg/yr Copper 1.4 kg/yr
LeadIcg/yr
Silver 0.04 kg/yr
Zinc kg/yr
General Construcon SW
Potential implementation strategies
Implement nonstructural BMPs such as better
sediment control at construction sites and improved
street cleaning by upgrading to vacuum type
sweepers for 30% of urbanized watershed
Install structural BMPs at critical points in the storm
water conveyance system for 40% of urbanized
watershed 50% infiltration trenches and 50% sand
filters
The Regional Water Board assumed that the
remaining 30% of urbanized land will be controlled
through Los Angeles Countys Integrated Resources
Plan that aims to increase the amount of wet-weather
urban runoff that can be captured and beneficiallyChiordane 0.1 g/yr DOT 0.31
gIyr PCBs 4g/yn PAHs 800
g/yr Cadmium 0.23 kg/yr
Copper 66 kg/yr Lead 9.1
kg/yr Silver 0.2 kg/yr Zinc 29
kg/yr
used
The Regional Water Board estimated that
implementation of an adaptive management approach
could costs from about $245 million to $335 million
January 2011 Appendix Sediment-Related 303d Listings and TMDLs D-6

Exhibit D-2 Summary of Toxic Pollutant TMDLs for Bays and Estuaries
Numericiargets Load Allocations Implementation
General Industrial SW Chlordane
0.02 glyr DDT 0.08 glyr
PCBs 1.0 glyr PAHs 200 g/yr
Cadmium 0.06 kg/yr Copper
1.7 kg/yr Lead 2.3 kglyr Silver
0.05 kglyr Zinc kg/yr
Caltrans Chlordane 0.05 g/yr
DDT 0.15 g/yr PCBs g/yr
PAHs 400 g/yr Cadmium 0.11
kg/yr Copper 3.2 kg/yr Lead
4.4 kg/yr Silver 0.09 kg/yr Zinc
14kg/yr
MS4s Chlordane 3.34 g/yr DDT
10.56 g/yr PCBs 152 glyr
PAHs 26900 g/yr Cadmium
8.0 kg/yr Copper 227.3 kgyr
Lead 312.3 kg/yr Silver 6.69
kqlyr Zinc 1003 kq/yr
Cache Creek Mercury TMDL part of Delta watershed CVRWQCB 2004a 2004b 2005b
Fish Tissue Methylmercury Mercury Allocations Bear Creek Implementation options include
trophic level fish 0.12 mines 5% of existing Hg loads Public outreach regarding the levels of safe fish
mg/kg Rathburn Petray North and consumption and monitoring
Methylmercury trophic level South and Rathburn-Petray Remediation of inacve mines
fish 0.23 mg/kg Harley Gulch mines 5% of Control of erosion in mercury-enriched upland areas
existing Hg loads Abbott and and in floodplains downstream of the mines and in
Turkey Run Sulphur Creek the lower watershed
30% of existing Hg loads Conducting feasibility studies and evaluating possible
geothermal springs erosion of remediation at the Harley Gulch delta
undisturbed soil mines Identifying sites and projects to remediate or remove
contaminated streambeds and floodplain sediments containing mercury and
atmospheric deposition implement feasible projects
Methylmercury Allocations Cache Addressing methylmercury reductions through
Creek at Yolo 66 MeHg/yr studies of sources and possible controls in Bear
Settling Basin 34.7 MeHg/yr Creek and Anderson Marsh controlling inputs from
Bear Creek at gauge 3.2 new impoundments weflands restoration projects or
Me Hg/yr geothermal spring development
The Regional Water Board estimated capital costs of
$14 million and OM of $700000 per year
Calleguas Creek Watershed Metals and Selenium TMDLa LARWQCB 2006
Dry Weather Water Suspended Sediments Mercury Implementation options include
Dissolved Copper 3.1 80% reduction below background Establish group concentration-based effluent limits
WER Dissolved Nickel concentrations for NPDES dischargers
8.2 ig/L Total Mercury Implement BMPs for nonpoint sources consistent
0.051 tgfL Average Dry Weather 86th with the Nonpoint Source Plan and Conditional
Wet Weather Water Percentile Flow Waiver Program
Dissolved Copper 4.8 Agriculture Copper 0.12
WER Dissolved Nickel WER 0.02 lbs/day Nickel
74 .igIL Total Mercury 0.26 lbs/day
0.0511.ig/L
Open Space Copper 0.08
Sediment Copper 34000 lbs/day Nickel 0.42 lbs/day
pg/kg Nickel 20900 pg/kg NPDES Dischargers Copper
January2011 Appendix Sediment-Related 303d Listings and TMDLs D-7

Exhibit D-2 Summary of Toxic Pollutant TMDLs for Bays and Estuaries
Numeric Targets Load Allocations Implementation
Fish Tissue Methylmercury Monthly Average 3.7 WER0.3 mg/kg human health tgIL Nickel Monthly Average
Methylmercury Trophic Level 8.2 1ig/L Mercury 0.051 g/L
50 mm 0.03 mg/kg Wet Weather
Methylmercury Trophic Level Agriculture Copper 0.00017
350-150mm 0.05 mglkg flow2 0.01 flow0.05
Methylmercury Trophic Level WER 0.02 lbs/day Nickel
150-350mm 0.1 mg/kg 0.014 flow 0.42 flow lbs/day
Bird Egg Mercury 0.5 Open Space Copper 0.0000537
mg/kg flow2 0.00321 flow Ibslday
Nickel 0.014 flow 0.42 flow
Ibslday
NPDES Dischargers Copper Daily
Maximum 5.8 WER .Lg/L
Nickel Daily Maximum 74 ig/L
Mercury 0.051 .ig/L
Calleguas Creek Watershed OC Pesticides and PCBs TMDLa LARWQCB 2005e
Sediment Chlordane 0.5 Storm Water Permits Chlordane Implementation options include
pg/kg DDT pg/kg 3.3 ng/g DDT 0.3 ng/g Dieldrin Establish group concentration-based effluent limits
Dieldrin 20 ng/kg PCBs 4.3 ng/g PCBs 180 nglg for NPDES dischargers
23 pg/kg Toxaphene 360 ng/g Implement BMPs for non point sources consistent
Water Chlordane ng/L Minor Point Sources Daily with the Nonpoint Source Plan and Conditional
DDT ngfL Dieldrin 1.9 Maximum Chlordane 1.2 ngIL Waiver Program
ng/L PCBs 30 ng/L DDT 1.2 ng/L Dieldrin 0.28 Develop Agricultural Water Quality Management
Toxaphene 0.2 ng/L ng/L PCBs 0.33 ngL Plans and implement agricultural BMPs based on
Fish Tissue Chiordane Toxaphene 0.34 ng/L results of BMP effectiveness studies
0.83 pg/kg DDT 32 pg/kg Minor Point Sources Average Develop agricultural education program to inform
Dieldrin 0.65 pg/kg PCBs Monthly Chiordane 0.59 ng/L growers of the recommended BMPs and the
5.3 pg/kg Toxaphene DDT 0.59 ng/L Dieldrin 0.14 Management Plan
9.8 pg/kg ng/L PCBs 0.17 ng/L
Toxaphene 0.16 ngL
Delta Waterways Methylmercury TMDL CVRWQCB 2005a
Fish Tissue Methylmercury Methylmercury Allocations Central Draft implementation options include
for largemouth bass 0.28 Delta current load Marsh Creek Improve trapping efficiency in Cache Creek Settling
mgfkg1.8 MeHg/yr Mokelumne- Basin
Cosumnes Rivers 44 MeHg/yr Require that dredged spoil with average
Sacramento River 1.341 concentrations greater than 0.2 mg/kg be placed on
MeHg/yr San Joaquin 178 or above the 100-year flood plain
MeHg/yr West Delta current Require mercury concentration of fine grain material
load Yolo Bypass 234 in top 6-cm of newly exposed sediment to have an
MeHg/yr average concentration less than the surface material
Total Mercury Allocations All before dredging or be less than 0.2 mg/kg dry weight
mercury sources to delta Cap NPDES discharger loads at 2005 levels
174000 Hg/yr Implement P2 at facilities with increasing loads
Allow facilities that show maintaining cap is
technically impractical or excessively expensive to
participate in offsets program
Implement studies to enable reduction of
methylmercury_in_Delta_waters
Marina del Rey Toxics TMDL LARWQCB 2005b
Sediment Chiordane 05 Atmospheric Deposition IPotential implementation strategies
January 2011 Appendix Sediment-Related 303d Listings and TMDLs D-8

Exhibit 0-2 Summary of Toxic Pollutant TMDLs for Bays and Estuaries
Numeric Targets Load Allocations Implementation
pg/kg PCBs 22.7 pg/kg Chiordane 0.002 g/yr PCBs Implement nonstructural BMPs such as better
Copper 34 mg/kg Lead 0.079 glyr Copper 0.12 kg/yr sediment control at construction sites and improved
46.7 mg/kg Zinc 150 Lead 0.16 kg/yr street cleaning by upgrading to vacuum type
mg/kg Zinc 0.52 kg/yr sweepers for 30% of urbanized watershed
Water Quality PCBs 017 General Construction SW Install structural BMPs at critical points in the storm
ng/L intem PCBs 30 Chlordane 0.0005 g/yr PCBs water conveyance system for 70% of urbanized
ng/L final 0.0219 g/yr Copper 0.033 kg/yr watershed 50% infiltration trenches and 50% sand
Fish Tissue PCBs 5.3 Lead 0.045 kg/yr Zinc 0.144 filters
pg/kg kg/yrThe Regional Water Board estimated structural storm
General lndustiial SW Chlordane water BMP implementation costs to range from about
0.0001 glyr PCBs 0.029 g/yr $5.5 million to $7.6 million
Copper 0.004 kg/yr Lead
0.006 kg/yr Zinc 0.018 kg/yr
Caltrans Chlordane 0.0003 g/yr
PCBs 0.015 g/yr Copper
0.022 kg/yr Lead 0.030 kg/yr
Zinc 0.096 kg/yr
yj4 Chlordane 0.03 g/yr
PCBs 1.34 g/yr Copper 2.01
kg/yr Lead 2.75 kg/yr Zinc
8.85 kg/yr
Upper and Lower Newport Bay including Rhine Channel Metals TMDL U.S EPA Region 2002 Anchor
Environmental 2006
Sediment Quality Cadmium Urban runoff Cadmium 9589 RWQCB is considering the following options for the
0.67 mg/kg Copper 18.7 Ib/yr Copper 3043 lb/yr Lead Rhine Channel in Lower Newport Bay
mg/kg Lead 30.2 mg/kg 17638 Ib/yr Zinc 174057 lb/yr Dredge sediment and dewater prior to transporting to
Zinc 124 mg/kg Mercury Mercury 17.1 g/yr Chromium an approved off-site upland disposal facility $11
0.13 mg/kg Chromium 52 5.66 kg/yr million to $17 million
mg/kg Caltrans Cadmium 1185 Iblyr Dredge sediment and place within an off-site
Acute Water Quality Copper 423 lbfyr Lead 2171 nearshore confined disposal facility $7.5 million
Cadmium 42 jigfL Copper Ib/yr Zinc 22866 Ib/yr Mercury Dredge sediment and dispose of within confined
48 pg/L Lead 210 pg/L 2.7 g/yr Chromium 0.89 kg/yr aquatic disposal area excavated near channel mouth
Zinc 90 pg/L Other NPDES Permittees $12.6 million
Chronic Water Quality Cadmium 595 lb/yr Copper First option shown is preferred option
Cadmium 9.3 pg/L Copper 190 lb/yr Lead 1154 Ib/yr Zinc
3.1 pgIL Lead 8.1 pg/L 17160 lb/yr Mercury 2.7 g/yr
Zinc 81 pg/L Chromium 0.89 kg/yr
Fish Tissue Mercury 0.3 Agriculture Copper 215 lb/yr
mg/kg Chromium 0.2 Zinc 114 lb/yrMercury g/yr
mg/kg Chromium 0.89 kg/yr
Copper 4542 Ib/yr Zinc
1056 lb/yr
Air Deposition Cadmium Ib/yr
Copper 101 Ib/yr Lead 68
Ib/yr Zinc 606lb/yr
Open Space and Existing
Sediments Cadmium 428 Ib/yr
Copper 803 Ib/yr Lead 678
Ib/yr Zinc 11414 Ib/yr Mercury
67.5 g/yr Chromium 22.3 kg/yr
Upper and Lower Newport Bay Organochlorine Compounds TMDL SARWQCB 2006
January 2011 Appendix Sediment-Related 303d Listings and TMDLs D-9

Exhibit D.2 Summary of Toxic Pollutant TMDLs for Bays and Estuaries
Numeric Targets Load Allocations Implementation
Sediment Quality Chiordane Urban runoff Chlordane 41.1 The Regional Water Board recommends the following
2.26 pg/kg DOT 3.89 gfyr DDT 70.9 g/yr PCBs implementation actions
pg/kg PCBs 21.5 pg/kg 107.9 g/yr Review and revise existing NPDES permits to
Fish Tissue Chiordane 30 Caltrans Chlordane 12.6 g/yr incorporate wasteload allocaons WLAspg/kg DOT 50 pg/kg DOT 21.6 glyr PCBs 33 g/yr compliance schedules and monitoring program
PCBs 20 pg/kg Construction Chlordane 32 requirements
Water Quality Chlordane g/yr DOT 55.2 g/yr PCBs Require agricultural operators toidentify
and
0.59 ng/L DDT 0.59 ng/L 83.9 9/yr implement monitoring program to assess pollutant
PCBs 0.17 ng/L Commercial Nurseries Chlordane discharges from their facilities and to identifyand
4.5 glyr DDT 7.9 glyr PCBs implement BMP program
12 g/yr Identify parties responsible for open space areas
Agriculturet Chlordane 9.5 g/yr and implement monitoring program to assess the
DDT 9.9 g/yr PCBs 17.8 g/yr discharges
Open Space Chlordane 0.4 Implement appropriate BMPs and sampling plans for
g/yr ODI 17.8 g/yr PCBs 27 construction activities
glyr MS4s shall implement additional/enhanced BMPs to
Channels and Streams Chlordane ensure pollutant reducons
2.3 g/yr DDT 4.0 g/yr PCBs Evaluate feasibility and mechanisms to fund future
6.0 g/yr dredging operations
Existing Sediments and Air Develop work plan to meet TMDL implementation
Depositiont Chlordane 5.7 g/yr requirements
DDT 9.9 g/yr PCBs 15 g/yr Revise regional monitoring program to evaluate
effectiveness of actions and programs
Conduct special studies to review and revise TMDLs
San Diego Bay Shelter Island Yacht Club Dissolved Copper TMDL SDRWQCB 2005
Acute Water Quality 4.8 Passive Leaching 375 kg Cu/yr The Regional Water Board recommends the following
pg/LHull Cleaning 72 kg Cu/yr implementation actions
Chronic Water Quality 3.1 Urban Runoff 30 kg Cu/yr Coordinate with governmental agencies over the use
pg/L Background 30 kg Cu/yr of copper-based antifouling paints to protect water
Direct Atmospheric Deposition quaty from the adverse effects of copper-based
kg Cu/yr antifouling paints
Existing Sediment kg Cu/yr Regulate discharges of copper through WDRswaivers of WDRs or adoption of waste discharge
prohibitions
Amend MS4 permit to include 30 mg/kg copper limit
San Francisco Bay Mercury TMDL SFBRWQCB 2004a
Sediment Quality 0.2 mg Bed erosion 220 kg Hg/yr 53% The proposed implementation plan identified actions
Hg/kg reduction for each source except bed erosion and nonurban
Fish Tissue 0.2 mg Hg/kg Central Valley watershed 330 kg storm water runoff because more information is
Wildlife Birds Egg 0.5 mg Hg/yr 24% reduction needed
Hg/kg Urban storm water runoff 82 kg Central Valley watershed developing TMDL to meet
Hg/yr 48% reduction allocation actions likely to include mine remediation
Guadalupe River watershed kg and sediment capture
Hg/yr 98% reduction Urban storm water runoff comply with NPDES
Atmospheric deposition 27 kg permits and implement pollution prevention P2Hg/yr current load Guadalupe watershed developing TMDL to meet
Nonurban storm water runoff 25 allocation actionslikely
to include mining waste
kg Hg/yr current load removal and slope stabilization
Wastewater 20 kg Hg/yr current Atmospheric deposition no mandated action
load 17 kg Hg/yr municipal kg Wastewater capped at current loads
Hg/yr industrial
January 2011 Appendix Sediment-Related 303d Listings and TMDLs D-10

Exhibit D-2 Summary of Toxic Pollutant TMDLs for Bays and Estuaries
NumericTargets Load Allocations Implementation
San Francisco Bay PCBs TMDL SFBRWQCB 2004b
Sediment Quality 2.5 pg Atmospheric Deposition -7 kg The Regional Water Board recommends the following
PCBsIkg PCBsIyr implementation actions
Fish Tissue 22ng PCBs/g Central Valley Delta 32 kg/yr Develop watershed-wide NPDES permit for all
Wastewater Discharges 2.3 kg/yr point source dischargers that caps current loads
Urban Runoff kg/yr Implement source control programs for point source
Dredged Material 1.4 kg/yr dischargers
in-Bay PCBs Hot Spots Not Require petroleum refineries to evaluate the
quantified significance of PCB air emissions to load to bay
Cleanup of hotspots on land storm drains and
vicinity of storm drain outfalls
Capture detention and treatment of highly
contaminated runoff where cleanup is not effective
Implementation of urban runoff management
practices and controls that remove PCBs
Implementation and attainment of the Long Term
Management Strategy in-Bay disposal goals
Remediate PCBs contaminated sediments according
to_site-specific_clean-up_plans
lncludes Upper and Lower Newport Bay allocations
The WER has default value of 1.0 unless the Regional Water Board approves site-specific WER The Regional Water
Board is reviewing WER study for Mugu Lagoon Reach and if approved the Regional Water Board will modify the TMDL
targets in accordance with all legal and regulatory requirements
Only includes pollutants from Exhibit 2-1 and allocations for Mugu Lagoon/Calleguas Creek Reach
References
Anchor Environmental 2006 Feasibility Study and Alternatives Evaluation Rhine Channel Sediment
Remediation Newport Bay California January
Central Valley Regional Water Quality Control Board CVRWQCB 2005b Amendments to the Water
Quality Control Plan for the Sacramento River and San Joaquin River Basins for the Control of Mercury
in Cache Creek Bear Creek Sulphur Creek and Harley Gulch Staff Report October Rancho Cordova
CA
Central Valley Regional Water Quality Control Board CVRWQCB 2004a Cache Creek Bear Creek
and Harley Gulch TMDL for Mercury Staff Report
Central Valley Regional Water Quality Control Board CVRWQCB 2004b Draft Sulphur Creek
TMDL for Mercury Staff Report
Los Angeles Regional Water Quality Control Board LARQWCB 2006 Proposed Amendment to the
Water Quality Control Plan Los Angeles Region to Incorporate the
Total MaximumDaily Load for Metals and Selenium in the Calleguas Creek its Tributaries and Mugu
Lagoon
Los Angeles Regional Water Quality Control Board LARWQCB 2005a Total Maximum Daily Loads
for Toxic Pollutants in Ballona Creek Estuary July 2005
January 2011 Appendix Sediment-Related 303d Listings and TMDLs D-11

Los Angeles Regional Water Quality Control Board LARWQCB 2005b Total MaximumDaily Load
for Toxic Pollutants in Marina del Rey Harbor Draft August 2005
Los Angeles Regional Water Quality Control Board LARWQCB 2005e Proposed Amendment to the
Water Quality Control Plan Los Angeles Region to Incorporate
Total Maximum Daily Loads TMDLs for Organochiorine OC Pesticides Polychiorinated Biphenyls
PCBs and Siltation in Calleguas Creek Its Tributaries and Mugu Lagoon
San Diego Regional Water Quality Control Board SDRWQCB 2005 Total Maximum Daily Load for
Dissolved Copper in Shelter Island Yacht Basin San Diego Bay February
San Francisco Bay Regional Water Quality Control Board SFBRWQCB 2004a Mercury in San
Francisco Bay Total Maximum Daily Load Proposed Basin Plan Amendment and Staff Report
September
San Francisco Bay Regional Water Quality Control Board SFBRWQCB 2004b PCBs in San Francisco
Bay Total MaximumDaily Load Project Report January
Santa Ana Regional Water Quality Control Board SARWQCB 2006 Total Maximum Daily Loads for
Organochiorine Compounds San Diego Creek Total DDT and Toxaphene Upper and Lower Newport
Bay Total DDT Chiordane Total PCBs November
State Water Resources Control Board SWRCB 2010 2010 Clean Water Act Section 303d List of
Water Quality Limited Segments
United States Environmental Protection Agency U.S EPA Region 2002 Total Maximum Daily
Loads for Toxic Pollutants San Diego Creek and Newport Bay California
January 2011 Appendix Sediment-Related 303d Listings and TMDLs D-12
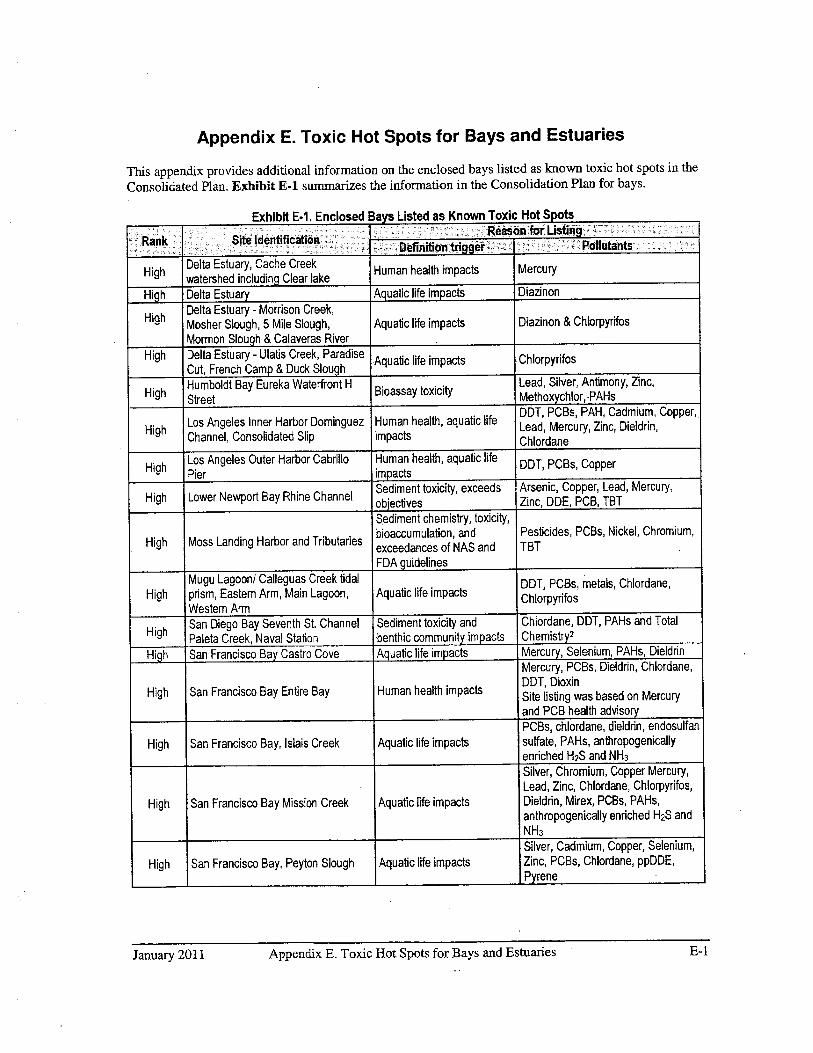
Appendix Toxic Hot Spots for Bays and Estuaries
This appendix provides additional information on the enclosed bays listed as known toxic hot spots in the
Consolidated Plan Exhibit E-1 summarizes the information in the Consolidation Plan for bays
Exhibit El Enclosed Bays Listed as Known Toxic Hot Spots
Reason for Listing
Rank Site IdentificationDefinition trigger Pollutants
Delia Estuary Cache CreekHuman health impacts MercuryHigh
watershed including Clear take
High Delta Estuary Aquatic life impacts Diazinon
Delta Estuary Morrison CreekHigh
Mosher Slough Mite Slough Aquatic life impactsDiazinon Chlorpyrifos
Mormon Slough Calaveras River
High Delta Estuary Ulatis Creek ParadiseAquatic life impacts Chiorpyrifos
Cut French Camp Duck Slough
Humboldt Bay Eureka Waterfront Lead Silver Antimony Zinc
HighStreet
Bioassay toxicityMethoxychior PAHs
DDT PCBs PAH Cadmium CopperLos Angeles Inner Harbor Dominguez Human health aquatic life
Lead Mercury Zinc DieldrinHigh
Channel Consolidated Slip impacts Chlordane
Los Angeles Outer Harbor Cabrillo Human health aquatic life
DDT PCBs CopperHigh
Pier impacts
High Lower Newport Bay Rhine ChannelSediment toxicity exceeds Arsenic Copper Lead Mercury
objectives Zinc DDE PCB TBT
Sediment chemistry toxicity
bioaccumulation and Pesticides PCBs Nickel Chromium
High Moss Landing Harbor and Tributaries
exceedances of NAS and TBT
FDA guidelines
Mugu Lagoon Calleguas Creek tidal DDT PCBs metals Chlordane
High prism Eastern Arm Main Lagoon Aquatic life impactsChlorpyrifos
Western Arm
High
San Diego Bay Seventh St Channel Sediment toxicityand Chiordane DDT PAHs and Total
Paleta Creek Naval Station benthic community impacts Chemistry2
High San Francisco Bay Castro Cove Aquatic life impacts Mercury Selenium PAHs Dieldrin
Mercury PCBs Dieldrin Chiordane
DDT Dioxin
High San Francisco Bay Entire Bay Human health impactsSite listing was based on Mercury
and PCB health advisory
PCBs chlordane dieldrin endosulfan
High San Francisco Bay Islais Creek Aquatic life impacts sulfate PAHs anthropogenically
enriched H2S and NH3
Silver Chromium Copper Mercury
Lead Zinc Chiordane Chtorpyrifos
High San Francisco Bay Mission Creek Aquatic life impacts Dieldrin Mirex PCBs PAHs
anthropogenically enriched H2S and
NH3
Silver Cadmium Copper Selenium
High San Francisco Bay Peyton Slough Aquatic life impacts Zinc PCBs Chlordane ppDDE
Pyrene
January 2011 Appendix Toxic Hot Spots for Bays and Estuaries E-

Exhibit El Enclosed Bays Listed as Known Toxic Hot Spots
Reason forListingRank Site Identification
Definition trigger Pollutants
San Francisco Bay Point Potrero/Human health Mercury PCBs Copper Lead Zinc
HighRichmond Harbor
Arsenic Copper Mercury Selenium
Zinc chiordane dieldrin ppDDE
dacthal endosulfan endosulfan
High San Francisco Bay Stege Marsh Aquatic life impacts sulfate dichlorobenzophenone
heptachior epoxide
hexachlorobenzene mirex
oxidiazon toxaphene and PCBs
Moderate Anaheim Bay Naval Reserve Sediment toxicity Chlordane DDE
DDT zinc lead Chlordane dieldrin
Moderate Ballona Creek Entrance Channel Sediment toxicity
chiorpyrifos
Moderate Bodega Bay-10006 Masons Marina Bioassay toxicity Cadmium Copper TT PAH
Copper lead Mercury Zinc TBTModerate
Bodega Bay-I 0028 Porto Bodega
MarinaBioassay toxicity DDT PCB PAH
Chlordane Dieldrin LindaneModerate Delta Estuary Aquatic life impacts
Heptachior Total PCBs PAH DDT
Chlordane Dieldrin Total DDTModerate Delta Estuary Human health impacts PCBs Endosulfan Toxaphene
Moderate Los Angeles River Estuary Sediment toxicity DDT PAH Chiordane
Sediment toxicity exceedsChiordane Zinc DDEModerate Upper Newport Bay Narrows
water quality objectives
Lower Newport Bay Exceeds water quality Copper Lead Mercury ZincModerate
Newport Island objectives Chlordane DDE PCB TBT
DDT PCB Copper Mercury Nickel
Moderate Marina del Rey Sedimenttoxicity
Lead Zinc Chlordane
Moderate Monterey HarborAquatic life impacts PAHs Cu Zn Toxaphene PCBs
sediment toxicity Tributyltin
San Diego Bay Between StreetBenthic community impacts PAHs Total ChemistryModerate
Broadway Piers
San Diego Bay Central Bay Switzer Chlordane Lindane DDT Total
ModerateCreek
Sediment toxicity
Chemistry
Moderate San Diego Bay Chollas Creek Benthic community impacts Chiordane Total Chemistry
ModerateSan Diego Bay Foot of Evans
Benthic Community Impacts
PCBs Antimony Copper Total
Sampson Streets Chemistry
Moderate San Francisco Bay Central Basin Aquatic life impacts Mercury PAHs
San Francisco Bay Fruitvale in front
Aquatic life impacts Chiordane PCBsModerateof storm drain
San Francisco Bay Copper Lead Mercury Zinc TBT
Moderate Oakland Estuary Pacific Drydock Aquatic life impacts ppDDE PCBs PAHs Chlorpyrifos
in front of storm drain Chlordane Dieldrin Mirex
Moderate San Francisco Bay San Leandro Bay Aquatic life impactsMercury Lead Selenium Zinc
PCBs PAHs DDT pesticides
Low Huntington Harbor Upper Reach Sediment toxicityChlordane DDE Chlorpyrifos
Source SWRCB 2003
State Water Resources Control Board SWRCB 2003 Consolidated Toxic Hot Spots Cleanup Plan
Volumes and II August
January 2011 Appendix Toxic Hot Spots for Bays and Estuaries E-2

Appendix Control Costs
This appendix provides description of the types of the control costs that might be incurred as
incremental costs of the Plan amendments should entities need to implement controls that would not be
necessary in the absence of the Plan
El Storm Water Nonstructural BMPs
Street sweeping programs are often among the more costly nonstructural BMPs accounting for
approximately 11% to 64% of SWMP costs incurred by municipalities responding to recent survey
CSU Sacramento 2005 More intensive sweeping could include incremental costs for equipment
purchase and operation The effectiveness of street sweeping depends on the type and operation of the
equipment sweeping frequency and number of passes and climate FHWA 2002 Thus increasing the
frequency of sweeping or changing the type of sweeper used may result in decreases in pollutant loads
California State University CSU Sacramento conducted storm water cost survey for the State Water
Board to document costs incurred by select municipalities in implementing SWMPs as part of their MS4
NPDES permits Exhibit F-i shows street sweeping costs for several California municipalities with costs
ranging from $12 to $61 per curb mile Incremental costs for more extensive sweeping would depend on
municipality current sweeping practices and the extent of the increase needed to reduce toxic loadings
e.g the incremental curb miles and whether new sweepers need to be purchased
Exhibit F-I Examples of Street Sweepinu Costs________________
Street Sweeping Annual Curb Miles Cost Per Curb Mile Estimated Annual
Municipality Costs Swept Swept $Icurb mile Frequency
Fremont $1915000 31405 $61 12
Sacramento $1322748 26450 $50 12
Encinitas $117962 5832 $20 12
Corona $414215 20877 $20 26
Fresno-Clovis $2193296 142411 $15 12
Santa Clarita $557443 46800 $12 50
Source CSU Sacramento 2005Costs are in 2002/2003 fiscal year dollars
Most municipalities use mechanical/brush model sweepers Minton 2007 These models are generally
oniy half as effective as vacuum sweepers with respect to pollutant loading reduction Vacuum sweepers
are much more effective at removing fine sediments silts and clays where much of the pollution resides
There are two types of vacuum sweepers wet and dry The dry vacuum sweepers remove greater
percentage of small particulates and sediments than the wet vacuum sweepers Thus depending on the
load reductions needed switching to either wet or dry vacuum sweeper could increase pollutant load
reductions to surface waters
Conventional mechanical sweepers cost approximately $69000 1995 dollars whereas wet vacuum
sweepers cost around $127000 1995 dollars FHWA 2002 The useful life span of these sweepers is
between and years and the operating cost associated with these sweepers is about $70 perhour 1996
dollars FHWA 2002 The capital cost of vacuum-assisted dry sweepers is on the order of $170000
1996 dollars with projected useful life span of about years and operating costs of approximately $35
perhour 1996 dollars FHWA 2002
January2011 Appendix Control Costs F-i

F.2 Storm Water Structural Controls
There are variety of structural means to control the quantity and quality of storm water runoff including
infiltration systems detention systems retention systems constructed wetlands filtration systems and
vegetated systems The cost of constructing storm water controls depends on site conditions and drainage
area Furthermore there are often economics of scale making it difficult to develop unit construction
cost
Caltrans conducted storm water control retrofit pilot program to acquire experience in the installation
and operation of wide range of structural controls and to evaluate the performance and costs of these
devices Caltrans 2004 As partof this program Caltrans compared the construction costs incurred
during the program to costs collected from several other transportation departments and jurisdictions
Caltrans 2001 Caltrans obtained cost data from the following entities Maryland State Highway
Administration Texas Department of Transportation City of Austin Texas King County Washington
Florida Department of Environmental Quality Maryland and Virginia BMP data collected by the Center
for Watershed Protection and City of Santa Monica California Exhibit F-2 presents Caltrans unit cost
estimates for these municipalities
Exhibit F-2 Storm Water Control Cost Summary 2007$1
Number of Approximate Unit Cost $Iacre
Control Type Projects Median Average Max Mm
Detention Basin 23 $4901 $6983 $32336 $470
Retention Basin Wet Pond 23 $8287 $13122 $55883 $1625
WeUand 25 $4807 $7859 $37641 $271
Infiltration Trench $15395 $24626 $65737 $7127
Austin Sand Filter 15 $24307 $40737 $171438 $1828
Delaware Sand Filter $118933 $117938 $193484 $40404
Bioretention $60498 $60498 $95582 $25414
Source Caltrans 2001 escalated to 2007 dollars from 1999 dollars using the CCI
Does not include Caltrans pilot program costs Caltrans adjusted all costs for difference in regional economics and date of
construction using RS Means Heavy Construction Cost Data and the CC respectively
However the costs incurred by Caltrans for BMPs constructed during their retrofit program are in
general substantially higher than costs reported by the other entities Caltrans used for comparison
Caltrans 2001 indicated several reasons for these higher costs
Experience and efficiency in planning and design can contribute significantly to savings Caltrans
had relatively little experience and relatively short planning horizon
BMP retrofit work was not combined with any ongoing construction projects
Pilot program did not reflect lowest cost technology for given site
Caltrans estimated that the retrofit program costs could be lowered by between 41% and 76% Therefore
although the retrofit program provides valuable information related to storm water controls the costs are
likely to overstate those that would be incurred by other entities for the same practices
The Westside Water Quality Improvement WWQ1 Project is an example of structural storm water
control project designed and constructed in California The WWQI Project is system designed to treat
to the maximum extent possible dry weather and storm water runoff from eastern parts of Santa Monica
and partsof west Los Angeles The system is capable of treating dry weather runoff up to cubic feet per
second cfs and storm water runoff up to 33 cfs in 24-hour period The runoff comes from
January 2011 Appendix Control Costs F-2

approximately 220 acres within Santa Monicas Centinela Sub-Watershed area and 2280 acres from parts
of west Los Angeles CSM No Date
The facility utilizes three separate processes to treat and improve the quality of runoff screening
sedimentation and direct filtration Direct filtration takes place in the Contech Stormwater Management
StormFilter unit which removes oil and grease dissolved heavy metals herbicides and pesticides
Removal of trash and other floatables and suspended particulates by sedimentation occurs in the
StormFilter Bio Clean Nutrient Separating Baffle B0xTM and at the transverse diversion weir CSM No
Date The facility operates totally on gravity follow basis Isolation gate valves may be closed for
maintenance or to protect the system from being overloaded during heavy storm events typically once or
twice in season CSM No Date The estimated cost of this project was approximately $2 million
ACC 2007
F.3 Controls for Marinas
Coastal Boatworks in Mono Bay California completed pollution prevention project in 1999 to reduce
the amount of heavy metals and toxic pollutants that reached the bay from the marina In addition to
distributing 500 pamphlets to various agencies and organizations promoting pollution prevention along
the waterfront the facility also purchased new cleaning equipment including dustless sanders and Vacu
boom system used to prevent runoff from washing operations for boaters to use during maintenance
operations MBNEP 2000 The marina spent approximately $14500 on the program includes $5400 in
funding from the MBNEP MBNIEP 2000
The Vacu-boom system is hollow flexible tube placed directly on hard surface to fonn downslope
side dam or to completely encircle the wash or containment area During use the boom is connected by
portable wet vacuum recovery unit Pressure Power Systems 2007 When the wet vacuum system is
turned on the Vacu-Boom tightly seals itself to the surface to form an impervious liquid barrier and water
is extracted into the boom into the vacuum unit Pressure Power Systems 2007 The water is discharged
from the vacuum unit through discharge hose into holding tank filter unit or sanitary sewer Pressure
Power Systems 2007 Exhibit F-3 shows costs for various size units
Exhibit F-S Capital Costs for Vacu-Boom System 2007 dollars
TubeSizet Capitalcqst1
20 feet $3200
25 feet $3350
30 feet $3600
40 feet $4100
50 feet $4500
Source Pressure Power Systems 2007Includes cost of shipping
The Los Angeles Regional Water Board among others has identified copper-based antifouling paints as
source of copper pollution in marinas and bays LARWQCB 2005a 2005b Reduction or elimination of
this pollution may require the transition to alternatives Few if any areas in california have begun the
transition to less toxic altematives The San Diego Regional Water Board 2005 provides information on
the potential costs associated with the use of nontoxic paints on boats based on findings in Carson et al
2002 Exhibit F-4 provides comparison between copper-based antifouling paints and nontoxic epoxy
coatings Boat owners may save small amounts of money on nontoxic hull coatings and maintenance over
the life of the boat hi some situations individual boat owners could spend slightly more money on
nontoxic coating maintenance but the amount will be small compared to hull maintenance cost over the
life of the boat SDRWQCB 2005
January2011 Appendix Control Costs F-3

Exhibit F-4 Comparison of Copper-Based Antifouling Paints to Nontoxic Epoxy Coatings1
CopperBased Antifouling Paints Nontoxic Epoxy Coatings
Initiallyless expensive to apply Initially more expensive to apply
$30 per foot $30 $50 per foot
Do not need to be cleaned as often Need to be cleaned more often
14 times per year 22 Umes per year
Need to be reapplied more often Do not need to be re-applied very often
every 2.5 years every years to 10 years
Need to be stripped about every 6th application every 15 Do not need to be stripped
years if paint reapplied every 2.5 years in first 30 60 years
Source SDRWQCB 2005Based on typical stylized
40-foot long boat with 11-foot beam width and 375 square feet of wetted hull surface
Variability in costs from this transition depends primarily on whether stripping for boat is required prior
to application of the nontoxic alternative Stripping is not needed for new unpainted boats For older
boats approximately 15years old stripping is required
for both application of nontoxic epoxy coatings
and continued application of copper-based paints Thus only boats less than 15 years old would have the
option of stripping prior to applying the new paint Stripping costs are approximated at $120/foot Carson
et al 2002 Long term cost estimates for transitioning from copper-based antifouling paints to nontoxic
coatings also vary depending on assumptions regarding the performance of the nontoxic coatings and
their price SDRWQCB2005
For example Carson et al 2002 estimated the cost of remaining life hull maintenance for 40 foot
length 11 foot width boats to rangefrom savings of $1354 new boat with nontoxic coating good
performance and lower prices to cost of $6251 2.5 yearold boat requiring stripping fair
performance and higher prices Carson et al 2002 estimated that the least costly alternative for the
transition to nontoxic paint i.e allowing boat owners to convert when the epoxy-copper cost differential
is most favorable would cost the boating community about 7000 boats in San Diego Bay
approximately $1.5 million over 15 years 2002 year dollars If all boat owners were required to convert
to nontoxic paints immediately costs to boaters would be approximately $33.8 million Carson et
2002
F.4 Sediment Remediation and Cleanup
There are number of limitations associated with estimates of unit costs for sediment remediation and
cleanup Unit costs are generally only applicable to the conditions and constraints of the site remediated
Myers 2005 Factors such as project scale beneficial use opportunities and the need for land are highly
site-specific and greatly influence project costs Myers 2005 Myers 2005 also points out that unit
costs for one time remediation job will generally be greater than unit costs of long term project in
which specific amount of sediment is treated each year over many years due to economies of scale
The types of remedial or cleanup activities implemented and their effectiveness are also highly site-
specific For example sediment capping may be feasible in deep water area but not feasible in
shallower area through which large ships have to pass Also dredging may be cost-effective where only
the top layer of sediment is contaminated However where contamination exists beneath the top layer of
sediment dredging may not be feasible or cost-effective Thus information on the extent of
contamination and water body uses is important in determining feasible cleanup options
Another limitation to most unit cost estimates is lack of detail on how the costs were derived Tetra
Tech and Averett 1994 as cited in Myers 2005 estimate that unit costs for thermal gas phase
January 2011 Appendix Control Costs F-4

reduction process rangefrom $426/cy to $506/cy This estimate reflects the build up of costs in number
of categories including site preparation permitting capital equipment pretreatment labor consumables
supplies and utilities effluent treatment and disposal monitoring maintenance site demobilization and
cleanup dredging construction of and transportation to temporary storage facility land leases and
disposal of residual material However due to site-specific conditions in another area e.g lack of
available space to construct temporary storage facility these particular estimates may not be applicable
If documentation regarding the buildup of costs for each category is available the estimates could
potentially be modified to take site-specific conditions into account
In 1997 the National Academy of Sciences NAS published comparison unit cost and cost-effectiveness
information for number of remediation strategies Exbibit F-S NAS 1997 ranked the alternatives
based on feasibility effectiveness practicality and cost lfcy to $1 000/cy The lowest cost option
natural recovery does not rank high in feasibility or practicalityIn comparison the highest cost option
thermal ex situ treatment ranks high in feasibility effectiveness and practicality
Exhibit F-5 Cost-Effectiveness of Sediment Remediation Approaches____________
Approach FeasibilityH Effective Practicalliy Cost
Interim Control
Administrative
Technological
In Situ Treatment
Natural Recovery
Capping
Treatment
Sediment Removal and Transport
Ex Situ Treatment
Physical
Chemical
Thermal
Biological
Ex Situ Containment
Scoring Feasibility Effective PracticalityCost
90% Concept Not acceptable very uncertain $1000fcy
90% Bench $100/cy
99% Pilot $10/cy
99.9% Field $lfcy
99.99% Commercial Acceptable certain $1/cy
Source SWRCB 1998 as adapted from and reprinted with permission from Contaminated Sediments in Ports and Waterways
Cleanup Strategies and Technologies Copyright 1997 by the National Academy of Sciences Courtesy of the National Academy
Press Washington D.C
Comparable to the NAS estimates from 1997 USACE 2001 indicates that sediment treatment costs can
range from around $50/cubic meter $65/cy for process such as stabilization to over $1000/cubic meter
$1 300/cy for high temperature thermal processes These estimates are based on project costs throughout
the United States However preliminary estimates from USACE 1999 for capping sediments in the
Palos Verdes Shelf in California rangefrom $1 .791cy to $5.06/cy which is greater than the $1/cy estimate
in the exhibit
January 2011 Appendix Control Costs F-S

As part of cleanup and abatement order the San Diego Regional Water Board developed unit cost
estimates for dredging contaminated sediments in the San Diego Bay based on preliminary cost estimates
from Exponent 2003 Exhibit F-6 shows these unit costs All of the estimates are for dredging with
mechanical dredge and do not include the sediment volume from areas beneath piers or within 10 feet of
structures beeause of stability concerns
Exhibit F-6 Dredging Unit Cost Estimates
Cleanup Alternative APProxiraDrdg Volume
Approximate Total Cost AroximateCostj
LAET 75000 $15000000 $200
5x Background 754000 $88000000 $117
Background 1200000 $120000000 $102
Sources SDRQWCB 2007
LAET lowest apparent effects threshold
F.5 References
American City and County ACC 2007 Taking Trash Out of Runoff February
California Department of Transportation Caltrans 2004 BMP Retrofit Pilot Program Final Report
January
California Department of Transportation Caltrans 2004 BMP Retrofit Pilot ProgramFinal Report
January
California Department of Transportation Caltrans 2001 Third Party Best Management Practice Retrofit
Pilot Study Cost Review May
California State University CSU Sacramento 2005 NPDES Stormwater Cost Survey Prepared for
State Water Resources Control Board
Carson Damon Johnson and Miller 2002 Transitioning to Non-Metal Antifouling Paints on
Marine Recreational Boats in San Diego Bay
City of Santa Monica CSM No Date Westside Water Quality Improvement Project SAC
Exponent 2003 NASSCO and Southwest Maxine Detailed Sediment Investigation Volume
Federal Highway Administration FHWA 2002 Stormwater Best Management Practices in an Ultra-
Urban Setting Selection and Monitoring May
Los Angeles Regional Water Quality Control Board LARWQCB 2005a Total Maximum Daily Loads
for Toxic Pollutants in Ballona Creek Estuary July 2005
Los Angeles Regional Water Quality Control Board LARWQCB 2005b Total MaximumDaily Load
for Toxic Pollutants in Marina del Rey Harbor Draft August 2005
Minton Gary 2007 The Street Sweep Online at
http//www.stormwaterauthority.orgflibrary/VieW_artiCle.aSPXid872
Mono Bay National Estuary Program MBNEP 2000 Turning the Tide Comprehensive
Conservation and Management Plan
January 2011 Appendix Control Costs F-6

Myers 2005 Cost estimating for contaminated sediment treatment summary of the state of the
practice DOER Technical Notes Collection ERDC TN-DOER-R8 U.S ArmyEngineer Research and
Development Center Vicksburg MS
National Academy of Sciences NAS 1997 Contaminated Sediments in Ports and Waterways Cleanup
Strategies and Technologies
Pressure Power Systems Inc 2007 Vacu-Boom System Online at http//www.vacuboom.COmI
San Diego Regional Water Quality Control Board SDRWQCB 2007 California Regional Water
Quality Control Board San Diego Region Resolution No R9-2007-0104 Amendment to the Water
Quality Control Plan for the San Diego Basin to Incorporatethe Revised Conditional Waivers of
Waste Discharge Requirements for Specific Types of Discharge within the San Diego Region Online at
http//www.waterbOardS.ca.gOV/safldiego/mlSc/WalverslUPthteb02010-l0-O7fResolution%2ONo.%20R9-
2007-0 I04.pdf
San Diego Regional Water Quality Control Board SDRWQCB 2005 Total MaximumDaily Load for
Dissolved Copper in Shelter Island Yacht Basin San Diego Bay February
State Water Resources Control Board 1998 Water Quality Control Policy for Guidance on Development
of Regional Toxic Hot Spot Cleanup Plans State Water Resources Control Board
Resolution No 98 090
United States Anni Corps of Engineers USACE 2001 State of the Art Overview of Contaminated
Sediment Remediation in the United States International Conference on Remediation of Contaminated
Sediments 10-12 October 2001 Venice Italy
United States Army Corps of Engineers USACE 1999 Options for In Situ Capping of Palos Verdes
Shelf Contaminated Sediments By Michael Palermo Paul Schroeder Yilda Rivera Cabs Ruiz Doug
Clarke Joe Gailani James Clausner Mary Hynes Thomas Fredette Barbara Tardy Linda Peyman-Dove
and Anthony Risko
United States Environmental Protection Agency U.S EPA 1999 Preliminary Data Summary of Urban
Storm Water Best Management Practices August
January 2011 Appendix Control Costs F-7
1239

California Regional Water Quality Control Board
San Diego Region
Staff Report on the
Establishment of Shipyard Sediment Cleanup Levels
for
National Steel and Shipbuilding Companyand Southwest Marine Inc
February 171999
Issue
There are elevated levels of pollutants in the bay bottom sediment adjacent to several
shipyards in San Diego Bay The concentration of these pollutants causes or threatens to
cause condition of pollution in San Diego Bay by impairing the benthic organismswhich are protected by the Marine Habitat Beneficial Use National Steel and
Shipbuilding Company NASSCO and Southwest Marine Inc Southwest Marine are
engaged hi process of assessment and removal of sediments which have high
concentrations of pollutants adjacent to their facilities The Regional Board must
establish cleanup levels for NASSCO and Southwest Marine which protect thebeneficial
uses and abate the threat of pollution in San Diego Bay
Conclusion
The Regional Board should adopt tentative Resolution No 99-12 Resolution
Establishing Shipyard Sediment Cleanup Levels for Southwest Marine Inc San Diego
County and tentative Resolution No 99-20 Resolution Establishing ShipyardSediment Cleanup Levels for National Steel andShip building Company San Diego
County These resolutions designate the following cleanup levels and indicator chemicals
for cleanup of bay bottom sediments at NASSCO and Southwest Marine as indicated
below
CONSTITUENT CLEANUP LEVEL FOR NASSCO SOUTHWESTBAY SEDIMENT mg/kg CLEANUP MARINE
Dry Weight INDICATOR CLEANUPCHEMICALS INDICATOR
CHEMICALS
Copper 810
Zinc 820
EXHIBIT NO
zyØey
SARO6I 457

Shipyard Sediment C1up Levels Page
Staff Report February 24 1999
CONSTITUENT CLEANUP LEVEL FOR NASSCO SOUTHWESTBAY SEDIMENT mgcg CLEANTJP MARINE
Dry Weight INDICATOR CLEANUP
CHEMICALS INDICATOR
CHEIvIICALS
Lead 231
Mercury 4.2
PCBs 0.95
These cleanup levels for NASSCO and Southwest Marine are based on cleanup levels for
Campbell Industries Marine Construction and Design Company Campbell Industries
and the mercury cleanup level for Shelter Island Boatyard These cleanup levels are
appropriate for NASSCO and Southwest Marine because the wastes at NASSCO and
Southwest Marine are similar to the wastes at Campbell Industries and Shelter Island
Boatyard and the cleanup levels will protect the beneficial uses and abate the threat of
pollution in San Diego Bay
Background
The Regional Board has been working since October 1994 on project for assessing the
chemical quality of sediments in San Diego Bay immediately off-shore of two shipyards
Southwet Marine and National Steel and Shipbuilding Company NASSCO This
project was initiated because of data dating to the late 1980s indicating elevated levels of
contaminants in sediments immediately offshore of the shipyards These contaminants
are cOnistent with those produced as result of shipyard operations Since 1994
NASSCO and Southwest Marine began actively working on voluntary cooperative
basis with the Regional Board to expedite the assessment and cleanup of the polluted
sediments The shipyards have worked cooperatively to perform sediment study and
remedial action alternatives analysis report in accordance with Regional Board
guidelines It has not been necessary to issue cleanup and abatement orders to the
shipyards because of the good fhith shown by the shipyards and the excellent progress
that has been made to date
By letter dated February 14 1997 the Regional Board issued sediment investigation
requirements to NASSCO for elevated concentrations of copper and zinc in the San
Diego Bay sediment At meeting on Maicli 11 1998 the Regional Board directed
NASSCO to also investigate mercury at small area ofNASSCOs leasehold just east of
the floating drydock near shore similar sediment investigation letter was issued to
Southwest Marine on October 22 1997 for elevated concentrations of copper zinc lead
and mercury By letter dated April 27 1998 the Regional Board directed Southwest
Marine to also investigate PCBs in the sediment For both shipyards sediment
investigations were required to determine the areal extent and location of sediments
SARO6I 458

Shipyard Sediment CI up Levels Page
Staff Report February 24 1999
containing chemical concentrations in excess of the Campbell Industries shipyard cleanup
levels or the Shelter Island Boatyard mercury apparent effects threshold level
NASSCO submitted Site Characterization and Remedial Action Plan in November
1997 as required This report contains the results ofNASSCOs site characterization
sampling Four remediation areas are identified which contain elevated sediment metal
concentrations Based on Regional Board comments additional sampling for copper and
zinc was conducted in one area outside NASSCOs leasehold which could be influenced
by NASSCOs work Mercury samples were also be collected from an area identified
from recent NPDES sediment sampling results The results of the supplemental
sampling dated September 14 1998 confinned that the original four remediation areas
are satisfactory
Southwest Marine submitted Preliminary Report Sediment Characterization Study and
Remediation Plan on July 30 1997 as required This report contains the results of
Southwest Marines site characterization sampling and also recommends some additional
characterization work Additional samples were collected and analyzed as necessary to
fully delineate the pollution Some archived samples were also reanalyzed Southwest
Marine submitted Report of Waste Discharge for dredging dated November 19 1998
and the Final Report Sediment Characterization Study and Remediation Plan dated
December 1998 Five remediation areas are identified in the reports for Southwest
Marine
NASSCO and Southwest Marine have concluded their sediment characterization studies
and are now proposing removal of polluted sediment
Basis for NASSCO and Southwest Marine Shipyard
Cleanup Levels
The proposed cleanup levels for NASSCO and Southwest Marine are based on the
previously established cleanup levels for Campbell Industries and the mercury cleanup
level for Shelter Island Boatyard
Campbell Cleanup Levels
On June 1995 the Regional Board issued Cleanup and Abatement Order No 95-21 to
Campbell Industries Marine Construction and Design Company Campbell Order No95-21 established sediment cleanup levels for Campbell Industries as specified below
SARO6I 459

Shipyard Sediment Clup LevelsPage
Staff Report February 24 1999
CONSTITUENT BAY SEDIMENT mg/kg
Dry Weight
Copper 810
Zinc 820
Lead 231
PCBs 0.95
These cleanup levels were developed inreport by PTI Environmental Services titled
Campbell Shipyards Remedial Action Alternatives Analysis Report Campbell
RAAAR dated October 1993 These Campbell cleanup levels were derived as site-
specific sediment quality objectives using the Apparent Effects Threshold AETapproach An AET is defined as the sediment concentration of given chemical above
which statistically significant biological effects e.g depressions in the abundance of
local benthic infuana are always observed in the data used to generate AET values If
any chemical exceeds 1tsAET for particular biological indicator measurable
although potentially minor adverse bioLogical effect is predicted for that indicator The
AET approach uses observed relationships between biological data and chemical data
Biological data for 15 statioiis were evaluated using the following tests amphipod
mortality polychacte growth total benthic infauna abundance in situ and amphipod
abundance in situ The 10-day amphipod survival avoidance and reburial test used the
species Rhepoxynius abronius following the test procedures described in Swartz et al
1985 ASTM 1990 and PSEP 1991 The 20-day juvenile polychaete test use the
species Neanthes arenaceodentata following the test procedures described in PSEP
1991
It is appropriate to apply cleanup levels developed for the Campbell site to the NASSCOand Southwest Marine sites This is based on similarities between physical biological
and chemical conditions at the Campbell NASSCO and Southwest Marine shipyards and
the fact that Campbell shipyard is physically located in San Diego Bay just north of the
NASSCO and Southwest Marine facilities Particularly important similarities include the
following
Campbell NASSCO and Southwest Marine are comparable in terms of site
activities waste materials and matrices i.e paint
Campbell NASSCO and Southwest Marine are in the same hydrodynamic and
biogeographic zones
Campbell NASSCO and Southwest Marine are influenced by similar suite of
pollutants from off-site
SARO6I 460

Shipyard Sediment Cl up LevelsPage
Staff ReportFebruary 24 1999
Shelter Island Boatyard Mercury Cleanup Level
Because there is no cleanup level for mercury at Campbell the mercury level fromShelter Island Boatyard is proposed for NASSCO and Southwest Marine Shelter Island
Boatyard is located in Americas Cup Harbor in San Diego Bay Shelter Island Boatyardsubmitted Remedial Action Alternatives Analysis Report RAAAR by PTI
Environmental Services dated June 30 1989 anda supplement datedJanuary 1990 Ff1
performed sediment biological effects study similar to the biological effects studyperformed for Campbell Industries PTIs study included eleven sample stationsbenthic infhunal count and an ainphipod sediment toxicity test were performed for eachstation The 10-day survival avoidance and reburial test used the species Rhepoxynjugabronius following the test procedures described in Swartz et al 1985 as amended byChapman and Becker 1986 PT reported that high aniphipod survival and no
depression in infaunal assemblage were found in the sediment from the area adjacent to
Shelter Island Boatyard with the sediment mercury concentration of 4.2 mg/kg dryweight This established 4.2 mg/kg dry weight AET mercury level for Shelter Island
Boatyard This Shelter Island Boatyard mercury level was not adopted as cleanup levelin the Shelter Island Boatyard cleanup and abatement order However the RegionalBoard decided that no cleanup was necessary for Shelter Island Boatyards sedimentwhich contained mercury at this 4.2 mg/kg level in Order No 91-91 Rescinding
Cleanup and Abatement Order No 8-70 for Shelter Island Boatyard San DiegoCounty which was adopted on October 28 1991 it is appropriate to apply the Shelter
Island Boatyard mercury cleanup level of 4.2 mg/kg to the NASSCO and SouthwestMarine shipyards because
The boatyards are similar to the shipyards in terms of site activities waste materialsand matrices i.e paint
The boatyards and shipyards are both in San Diego Bay
Data from eleven stations was used to derive the Shelter Island Boatyard mercurylevel which is comparable to the fifteen stations used to derive the Campbell cleanuplevels
Background Secllnient Levels in San Diego Bay
The NPDES permits for the shipyards in San Diego Bay require semiannual sediment
monitoring As part of this NPDES sediment monitoringprogram three referencestations in San Diego Bay are monitored. Reference Station REF-Ol is located at the
west side of San Diego Bay off the Naval Ocean Systems Center pier Reference StationREF-02 is located at the north side of San Diego Bay at the Marina Cortez Marina inHarbor Islands west basin Reference Station REF-03 is located at the north east side ofSan Diego Bay at the end of the Broadway Pier The results of eleven rounds of sediment
SARO6I 461

Shipyard Sediment C1u LevelsPage
Staff Report February 24 1999
sampling at these reference stations were used to calculate the average backgroundsediment levels shown in the table below The proposed cleanup levels for NASSCO and
Southwest Marine allow residual concentrations of pollutants to remain in the sediment
which are above the background levels shown in the table below Requiring cleanup to
background levels would be overly protective of bay beneficial uses The proposedcleanup levels while allowing pollutants to remain in bay sediments above backgroundlevels are sufficient to protect beneficial uses in San Diego Bay
Other Cleanup Levels Considered
Cleanup levels from several other sources were considered before selecting the proposed
cleanup levels
Boatyard Cleanup Levels
Bay City Marine Eichenlaub Marine Kettenburg Marine and Mauricio Sons are
boatyards in the Americas Cup Harbor in San Diego Bay The sediment in San Diego
Bay adjacent to these boatyards contained elevated levels of copper mercury and iiibutyl
tin Woodward-Clyde Consultants submitted RAAAR dated October 12 1990 for these
four boatyards The Woodward-Clyde RAAAR contained sediment biological effects
study prepared by Kinnetic Laboratories Inc One sediment station at each client
boatyard Bay City Marine Kettenburg Marine Eichenlaub Marine and Mauricio and
Sons Marine and one reference station in the center of the basin for total of five
sampling stations were used in this study Benthic infaunal counts an amphipodsediment toxicity test and bivalve larvae sediment elutriate test were performed for
each station The aniphipod 10-day survival and reburial test used the speciesGrandidierella
laponica following the test procedures described in Swartz et al 198$The 48-hour bivalve larvae survival and shell abnormality test used 14 sediment to
water elutriate mixture as described in ASTM Test Method.E-724-80 Woodwai-d-Clydeconcluded that there were no significant adverse biological effects associated with
sediment containing 530mg/kg dry weight of copper and 4.8 mg/kg dry weight of
mercury This established 530 mg/kg dry weight copper AET and 4.8 mg/kg dryweight mercury AET
Average Background Sediment Levels mg/kg Dry WeightREF-Ol REF-02 REF-03
Copper 36 196 91
Zinc 78 225 148
Lead 15 46 42
PCBs 0.041 0.049 0.041
Mercury 0.18 0.53 0.61
SARO6I 462

Shipyard Sediment CI up Levels Page
Staff Report February 24 1999
These boatyard cleanup levels were not used for the shipyards mainly because data from
only five stations were used to derive the boatyard cleanup levels instead of the fifteen
stations used to derive the Campbell cleanup levels and the eleven stations used to derive
the Shelter Island Boatyard mercury cleanup level The greater number of sample
stations used at the Shelter Island Boatyard and Campbell Industries sites provide more
sound technical basis for more precisely defining the cleanup sediment concentrations
needed to protect San Diego Bay beneficial uses i.e the no effects sediment
concentration level above which statistibally significant biological effects could be
expected to occur
Paco Terminals Copper Cleanup Level
Cleanup and Abatement Order No 85-9 was issued to Paco Temiinals for elevated
copper levels in the sediment in San Diego Bay adjacent to the facility Paco Terminals
was found to have discharged copper ore from their facility to San Diego Bay Paco
Terminals submitted report prepared by Westec Services Inc entitled Evaluation of
Copper in Interstitial Water from Sediments at Paco Terminals San Diego Bay Phase II
on March 24 1987 Interstitial water samples were collected and analyzed for copper
from 36 sediment core samples Linear regression was performed on the results to
determine if there was statistically significant relationship between copper
concentrations in the interstitial water and sediment Based on this linear regression
Westec Services Inc concluded that sediment concentration of 7050 mg/kg would
result in an interstitial water concentration of 50 ugh The Water Quality Control Plan
Ocean Waters of California 1983 1983 Ocean Plan contains ugh six-month median
copper water quality objective Although the available data did not provide clearly
defined relationship between the six-month median copper concentration of ugfl and
particular sediment copper concentration the Regional Board found in Addendum Noto Cleanup and Abatement Order No 85-91 that the data indicates that the sediment
copper concentration of less than 1000 mg/kg would likely result in water quality which
meets the 1983 Ocean Plan six-month median water quality objective Cleanup and
Abatement Order No 85-91 as amended established copper cleanup level of 1000
mg/kg for Paco Terminals be
On August 1991 report entitledRemedial Action Alternatives for National City
Marine Terminal prepared by Woodward-Clyde Consultants on behalf of the San Diego
UnifIed Port District was submitted to the Regional Board This report contained the
results of toxicity tests conducted on the sediment adjacent to Paco Terminal Nine
different standard organism types were used including shrimp flat fish sea urchin eggs
and embryos clams worms two different amphipods fish larvae and oyster larvae
Eight of the nine organism types tested exhibited no toxicity under standardized toxicity
test conditions The organism Rhepoxynius abronius exhibited toxicresponse which
was found to be unrelated to the copper concentration
SARO6I 463

Shipyard Sediment Cl up LevelsPage
Staff Report February 24 1999
Toxicity tests indicate that the copper in the shipyards sediment is more bioavailable than
the copper in Paco Terminals sediment The Paco Terminals copper cleanup level wasnot used for the shipyards mainly because the relatively insoluble
chalcopyrite copper ore
discharged by Paco Terminals is ilot similar to the wastes generated by the shipyards
Teledyne Ryan Aeronautical PCB Cleanup Level
Cleanup and Abatement Order No 86-92 was issued to Teledyne Ryan Aeronautical
Teledyne Ryan for elevated PCI levels in the Convair Lagoon portion of San Diego
Bay Teledyne Ryan submitted report entitled Recommendations for PCI Action
Levels in Sediments Convair Lagoon San Diego Bay March 1990 Many factors wereevaluated in this report including protection obenthic species historic regulatory
precedent engineering economic feasibility and background concentrations Based on
this report PCI cleanup level of 4.6 mg/kg willprotect against chronic effects to the
typical benthic species and other species in Convair Lagoon The cleanup level is also
expected to reduce the mussel tissue PC concentrations to below the US Food and DrugAdministration tolerance level of 2.0 mg/kg Cleanup and Abatement Order No 86-92as amended established PCI cleanup level of 4.6 mg/kg
On January 22 1997 Teledyne Ryan Aeronautical submitted report titled Baseline
Sediment Toxicity Testing Convair Lagoon Capping Project This report presents the
results of baseline sediment toxicity tests conducted for the Convair Lagoon Capping
Project Six sediment samples were collected three in Convair Lagoon and three at
reference stations outside of Convair Lagoon Ainphipod 10-day survival and reburial
toxicity tests were conducted on each sediment sample using the amphipod
raadidierel1ajaponica Sediment samples from Convair Lagoon contained 39 42 and46 mg/kg PCBs dry weight Reference sediment samples contained 0.17 0.18 and 3.8
mg/kg PCBs dry weight Theaverage survival rate of 85 percent for the three Convair
Lagoon sites is only slightly lower than the average survival rate of 86.3 percent for the
three reference sites The results of the toxicity tests do not indicate significant relative
toxicity of the Convair Lagoon sediment in comparison with the reference site sediment
The results of sediment toxicity tests in Convair Lagoon and at Campbell industries showthat amphipod toxicity occurs at lower PCI level above 0.95 mg/kg at shipyards
compared to the elevated PCB level above 46 mg/kg in Convair Lagoon These toxicitytests indicate that the PCBs in the sediment at Campbell Industries are more bioavailable
than the PCBs at Convair Lagoon The Teledyne Ryan PCB cleanup level was not usedfor the shipyards because the wastes in Convair Lagoon are not similar to the wastes
adjacent to the shipyards
SARO6I 464

Shipyard Sediment Cl up LevelsPage
Staff Report February 24 1999
Bay Protection and Toxic Cleanup Program Screening Values
Sediment samples were collected from approximately 160 stations in San Diego Bay as
part of the Bay Protection and Toxic Cleanup Program BPTCP between October 1992
and May 1994 These BPTCP samples were analyzed for chemicals toxicity andlor
benthic community structure The results of the BPTCP samples were published in
report titled Chemistry Toxicity and Benthic Community Conditions in Sediments of
the Sari Diego Bay Region Final Report September 1996 1996 BPTCP ReportAdditional B1TCP data were published in report titled Chemistry Toxicity and
Berithic Community Conditions in Sediments of the San Diego Bay Region Addendum
Report 1998
This 1996 BPTCP Report used two types of screening values to provide guidance for
evaluating the degree to which sediment chemical pollutant levels are responsible for
effects observed in toxicity test These screening values are the Probable Effects Level
PEL developed by the State of Florida and the Effects Range Median ERMdeveloped by the National Oceanic and Atmospheric Administration NOAA TheERM was developed using large national database of biological effects The PEL was
developed using large database which is dominated by data collected in the southeast
part of the nation The report containing the PEL documentation states that the PELnumbers are broadly applicable in the southeast and that care should be exercised in
applying the PEL elsewhere in North America
In order to better relate the original PEL and ERM numbers to San Diego Bay the 1996
BPTCP Report uses adjustment factors of four times 4x the ERM and 5.9 times 5.9xthe PEL These San Diego Bay adjustment factors were derived using qualitative
examination of the BPTCP data set which indicated that only in the top 10th percentile of
chemical measurements do the values exceed 4x the ERM or 5.9x the PEL The table
below shows the original and adjusted PEL and ERM for selected chemicals
Units PEL 5.9 PEL ERM ERMDryWeight
Copper mg/kg 108 638 270 1080
Lead mg/kg 112 662 218 872
Mercury mg/kg 0.7 4.1 0.7 2.8
Zinc mg/kg 271 1599 410 1640
PCBs mg/kg 0.189 1.114 0.180 0.720
The original and adjusted PEL and ERM values were not used for shipyard cleanup levels
because the PEL and ERM are more appropriately used as screening tool rather than site
specific cleanup levels The site specific Campbell cleanup levels more accurately
represent the relationship between shipyard chemical concentrations in the sediment and
potential adverse biological effects
SARO6I 465
Shipyard Sediment Cl up Levels Page 10
Staff Report February 24 1999
Regional Toxic Hot Spot Cleanup Plan
The Regional Toxic Hot Spot Cleanup Plan Cleanup Plan was adopted by the San
Diego Regional Board on December 16 1998 This Cleanup Plan result of the BPTCPidentifies and ranks candidate toxic hat spots The Cleanup Plan includes
characterization of high priority toxic hot spots and description of preliminary
assessment of actions to address the problems The Cleanup Plan also identifies one high
priority and four medium priority candidate toxic hot spots in San Diego Bay The high
priority site is at Seventh Street ChanneJ Paleta Creek near the Naval Station Themoderate priority sites are between Street and Broadway piers Switzer Creek
Foot of Evans and Sampson Streets and Chollas Creek The Chollas Creek site at
the south boundary ofNASSCO is the only candidate toxic hot spotwhich is near
NASSCO and Southwest Marine Three BPTCP stations located in the mouth of Chollas
Creek had degraded benthic communities and elevated pollutant levels which qualified
the site for medium priority ranking The impairment at Chollas Creek could be caused
by sources other than shipyards such as urban runoff Investigation of this Chollas Creek
site is expected to be addressed during the Total Maximum Daily Load TMDL process
for the Chollas Creek watershed
Indicator Chemicals
Indicator chemicals are used to predict the most likely location of elevated levels of
pollutants in the sediment Indicator chemicals are chosen by identifring chemicals
which are commonly elevated and which co-occur with other elevated chemicals The
goal is for cleanup of sediment containing elevated levels of the indicator chemicals to
also result in cleanup of areas with elevated levels of any other pollutants Sediment data
from several sources was evaluated in determining indicator chemicals for NASSCO and
Southwest Marine
The NPDES permits for NASSCO Order No 85.45 and Southwest Marine Order No83-11 required biannual sediment sampling at seventeen and fifteen stations
respectively Sediment samples from each NPDES station were analyzed for metals or
metals plus organics The results from nine rounds of biahnual sampling from 1992
through 1996 were evaluated in determining the indicator chemicals
As part of the BPTCP sediment samples were collected from approximately 160 stations
in San Diego Bay between October 1992 and May 1994 These BPTCP samples were
analyzed for chemicals toxicity and/or benthic community structure The results from
the chemical analysis of BPTCP samples were evaluated in determining indicator
chemicals
SARO6I 466

Shipyard Sediment CL up Levels Page 11
Staff Report February 24 l999
Sediment quality data from the NPDES biannual monitoring program and from.the
BPTCP were evaluated for each shipyard to determineappropriate indicator chemicals for
each shipyard Copper and zinc were identified as indicator chemicals for NASSCOMercury was also added later for small area ofNASSCO Copper zinc lead mercuryand PCBs were identified as indicator chemicals for Southwest Marine Although onlythe indicator chemicals will be analyzed for it is expected that any other pollutants at
elevated concentrations will be removed with the indicator chemicals
Cleanup Levels for NASSCO and Southwest Marine
in setting cleanup levels at any site the Regional Board must consider the terms and
conditions of State Board Resolution No 92-49 PoLicies and Procedures for
Investigation and Cleanup and Abatement of Discharges These conditions include
site-specific characteristics applicable state and federal statutes and regulations the
Basin Plan nd State Board Resolution 68-16 Statement of Policy with Respeot to
Maintaining High Quality Waters in California Section ll.A.9 of Resolution 92-49
directs Regional Boards to prescribe cleanup levels which are consistent with
appropriate levels set by the Regional Board for analogous discharges that involve similar
wastes site characteristics and water quality considerations The proposed shipyard
cleanup levels for NASSCO and Southwest Marine are in conformance with Resolution
No 92-49
Site-specific characteristics were considered by selecting cleanup levels which were
established for San Diego Bay at similar facilities that involve similar wastes site
characteristics and water quality conditions The BPTCP as discussed above is an
applicable state statute which was considered in establishing these cleanup levels
The Water Quality Confrol Plan San Diego Basin Basin Plan was adopted by this
Regional Board on September 1994 and subsequently approved by the State Water
Resources Control Board State Board on December 13 1994 Subsequent revisions to
the Basin Plan have also been adopted by the Regional Board and approved by the State
Board The Basin Plan designates beneficial uses and narrative and numerical water
quality objective and prohibitions which are applicable to the discharges regulated under
this Order The Basin Plan identifies the following beneficial uses of the waters of San
Diego Bay industrial service supply navigation water contact recreation non-contact
water recreation ocean commercial and sport fishing estuarine habitat preservation of
biological habitats of special significance wildlife habitat preservation of rare and
endangered species marine habitat fish migration and shellfish harvesting
Beneficial uses established in the Basin Plan will be protected by these cleanup levels
The sediment adjacent to NASSCO and Southwest Maxine contains pollutant
concentrations which have been shown to be harmful to the benthic organisms in San
Diego Bay The Marine Habitat Beneficial Use MAR which has been designated for
San Diego Bay includes uses of water that support marine ecosystems These benthic
5AR061467

organisms are part of the marine ecosystem which is protected by the MAR use The
proposed cleanup levels will be protective of the benthic organisms and the MAR use
because the cleanup levels were derived using biological studies involving benthic
organisms
State Board Resolution 68-16 provides that existing high water quality be maintained
when it is reasonable to do so This policy further provides that any adverse change in
water quality be consistent with the maximum public benefit will not unreasonablyaffect beneficial uses and will not result in water quality less than that prescribed in
the policies The proposed cleanup levels are consistent with the maximum public
benefit and will not unreasonably affect beneficial uses because the cleanup levels were
derived to protect beneficial uses for the public benefit Waterquality is not expected to
be less than that prescribed in the policies as result of these cleanup levels
Based on all of the information discussed above the proposed cleanup levels shownbelow are appropriate for NASSCO and Southwest Marine
CLEANUP LEVEL FOR NASSCO SOUTHWESTCONSTITUENT BAY SEDIMENT mg/kg CLEANUP MARINE
Dry Weight ThIDICATOR CLEANUPCHEMICALS INDICATOR
CHEMICALS
Copper 810
Zinc 820
Lead 231
Mercury 4.2
PCBs 0.95
Shipyard Sediment Cliup
Levels
Staff Report
Page 12
Februaxy24 1999
SARO6I 468

1240

RE
CO
RD
OF
WR
ITT
EN
CO
MM
UN
ICA
TIO
NS
BE
TW
EE
NSW
MA
ND
RW
CB
DU
RIN
GD
EV
ELO
PM
EN
TO
FT
HE
DT
R
CH
RO
NO
LO
GIC
AL
IND
EX
IBA
TE
SN
OID
OC
_T
YP
ES
UB
JE
CT
IFR
OM
Halv
ax
Sandor
South
west
Marine
Inc
Ro
drig
ue
zS
an
Die
go
RW
QC
BS
AR
063064
Oth
er
Rem
edia
tion
Costs
at
Various
Cle
apup
Levels
South
west
Marine
Inc
Vin
ce
nt
Ro
drig
ue
zS
an
Die
go
RW
QC
BS
AR
063065
Oth
er
Rem
edia
tion
Costs
at
Various
Cle
anup
Levels
Halv
ax
Sandor
Sandor
South
west
Marine
Inc
Vin
ce
nt
Ro
drig
ue
zS
an
Die
go
RW
QC
BS
AR
063067
Oth
er
Rem
edia
tion
Costs
at
Various
Cle
anup
Levels
Halv
ax
South
west
Ma
rin
eIn
c
Vin
ce
nt
Ro
drig
ue
zS
an
Die
go
RW
QC
BS
AR
063068
E-m
ail
Rem
edia
tion
Costs
at
Various
Cle
anup
Levels
Halv
ax
Sandor
South
west
Ma
rin
eIn
c
Vin
ce
nt
Ro
drig
ue
zS
an
Die
go
RW
QC
B5A
R063069
Oth
er
Rem
edia
tion
Costs
at
Various
Cle
anup
Levels
Halv
ax
Sandor
San
Die
go
RW
QC
B
Vin
ce
nt
Halv
ax
Sandor
NA
SS
CO
19960410
5A
R001337
Letter
Receip
tof
Monitoring
Report
sfo
rO
rder
No
87-0
65
NP
DE
SN
oC
A0108332
Pease
Susan
South
west
Marine
Inc
Robert
us
John
Sa
nD
iego
RW
QC
B19961229
SA
RO
12O
21
Letter
Third
Annual
Sta
tistical
Analy
ses
Report
12/9
6
Halv
ax
Sandor
South
west
Marine
Inc
Robert
us
John
Sa
nD
iego
RW
OC
B19961229
SA
R012023
Report
or
Stu
dy
Third
Annual
Sta
tistical
Analy
ses
Report
12/9
6
Halv
ax
Sandor
Sandor
South
west
Marine
Inc
Robert
us
Jo
hn
Sa
nD
iego
RW
QC
B19970101
SA
R011786
Letter
12/9
6C
om
pliance
Certification
Report
Halv
ax
Halv
ax
Sandor
South
west
Marine
19970127
SA
RO
118O
4Letter
Receip
tof
Monitoring
Report
sfo
rO
rder
No
83-0
11
NP
DE
SN
oC
A0107697
Facility
South
west
Marine
Inc
WD
ID
No
9000000137
Robert
us
John
San
Die
go
South
west
Marine
Inc
Robert
us
John
Inc
Sa
nD
iego
RW
QC
B19970201
SA
R014622
Letter
Com
pliance
Certification
Report
01/9
7H
alv
ax
Sandor
South
west
Ma
rin
eIn
cR
obert
us
John
Sa
nD
iego
RW
QC
B19970301
SA
R014621
Letter
Com
pliance
Certification
Report
02/9
7H
alv
ax
Sandor
South
west
Marine
Inc
Robert
us
John
Sa
nD
iego
RW
QC
B19970401
SA
R014619
Letter
Com
pliance
Certification
Report
03/9
7H
alv
ax
Sandor
South
west
Marine
Inc
Pe
ase
Su
sa
nS
an
Die
go
RW
QC
B19970422
SA
R014992
Oth
er
Request
for
Rem
oval
of
Marine
Fouling
Org
anis
ms
from
Dry
dock
AF
DL-4
8
Halv
ax
FE
XH
BIT
NO
._I
IZLO
lu
____________________
252312
aceq
Fe
bru
ary
28
20
11

RE
CO
RD
OF
WR
ITT
EN
CO
MM
UN
ICA
TIO
NS
BE
TW
EE
NSW
MA
ND
RW
CB
DU
RIN
GD
EV
ELO
PM
EN
TO
FT
HE
DT
R
CH
RO
NO
LO
GIC
AL
IND
EX
frA
BI
DA
TE
IBA
TE
SN
OS
UB
JE
CT
IFR
OM
IM_0R
GIn
cR
obert
us
John
Sa
nD
iego
RW
QC
B15
19970501
SA
R014620
Letter
Com
pliance
Certification
Report
04/9
7H
alv
ax
Sandor
John
Sa
nR
WQ
CB
16
19970601
SA
R013843
Letter
12/9
605/9
7C
om
pliance
Certification
Report
sand
Waste
Hauling
Log
1996
Annual
Chem
ical
Utilization
Audit
and
Tenth
Sem
i-A
nnual
Marine
Sedim
ent
Monitoring
Report
06/9
7
Halv
ax
Sandor
South
west
Ma
rin
eIn
cR
obert
us
John
Die
go
Sa
nR
WQ
CB
17
19970630
SA
R013842
Letter
12/9
605/9
7C
om
pliance
Certification
Report
sand
Waste
Hauling
Log
1996
Annual
Chem
ical
Utilization
Audit
and
Tenth
Sem
i-A
nnual
Marine
Sedim
ent
Monitoring
Report
06/9
7
Halv
ax
Sandor
South
west
Ma
rin
eIn
cR
obert
us
Die
go
18
19970630
5A
R013844
Oth
er
12/9
605/9
7C
om
pliance
Certification
Report
sand
Waste
Hauling
Log
1996
Annual
Chem
ical
Utilization
Audit
and
Tenth
Sem
i-A
nnual
Marine
Sedim
ent
Monitoring
Report
06/9
7
Halv
ax
Sandor
South
west
Ma
rin
eIn
cR
obert
us
John
John
Sa
nD
iego
RW
QC
B
Sa
nR
WQ
CB
19
19970630
SA
R013870
Report
or
Stu
dy
12/9
605/9
7C
om
pliance
Certification
Report
sand
Waste
Hauling
Log
1996
Annual
Che
mic
al
Utilization
Audit
and
Tenth
Sem
i-A
nnual
Marine
Sedim
ent
Monitoring
Report
06/9
7
Halv
ax
Sandor
South
west
Ma
rin
eIn
cR
obert
us
Die
go
Sa
nR
WQ
CB
20
19970630
SA
RO
141O
7D
isc
12/9
605/9
7C
om
pliance
Certification
Report
sand
Waste
Hauling
Log
1996
Annual
Chem
ical
Utilization
Audit
and
Tenth
Sem
i-A
nnual
Marine
Sedim
ent
Monitoring
Report
06/9
7
Halv
ax
Sandor
South
west
Ma
rin
eIn
cR
obert
us
Die
go
252312
Fe
bru
ary
28
2011

RE
CO
RD
OF
WR
ITT
EN
CO
MM
UN
ICA
TIO
NS
BE
TW
EE
NSW
MA
ND
RW
CB
DU
RIN
GD
EV
ELO
PM
EN
TO
FT
HE
DT
R
CH
RO
NO
LO
GIC
AL
IND
EX
TA
BID
AT
EB
AT
ES
NO
IDO
C_T
YP
ES
UB
JE
CT
FR
OM
IFM
_O
RG
ITO
ITO
OR
G
21
19970630
SA
R270299
Letter
1996
19
97
Sto
rmW
ate
rA
nnual
Report
Halv
ax
Sandor
South
west
Marine
Inc
Fu
lto
nG
loria
GR
E
Sa
nD
iego
22
19970630
SA
R270301
Report
or
Stu
dy
1996
19
97
Sto
rmW
ate
rA
nnual
Report
Halv
ax
Sandor
South
west
Marine
Inc
Fu
lto
nG
loria
GR
E
Sa
nD
iego
RW
QC
B
23 24
19970630
SA
RO
141O
8O
ther
RE
E1997A
.WB
112/9
605/9
7
Com
pliance
Certification
Report
sand
Waste
Hauling
Log
1996
Annual
Chem
ical
Utilization
Audit
and
Tenth
Sem
i-A
nnual
Marine
Sedim
ent
Monitorin
gR
eport
06/9
7
Halv
ax
Sandor
South
west
Marine
Inc
Robert
us
John
Sa
nD
iego
RW
QC
B
19970630
SA
RO
141O
9O
ther
SW
M1997A
.RE
P12/9
605/9
7
Com
pliance
Certification
Report
sand
Waste
Hauling
Log
1996
Annual
Chem
ical
Utilization
Audit
and
Tenth
Sem
i-A
nnual
Marine
Sedim
ent
Monitorin
gR
eport
06/9
7
Halv
ax
Sandor
South
west
Marine
Inc
Robert
us
John
Jo
hn
Sa
nD
iego
RW
QC
B
Sa
nR
WQ
CB
25
19970630
SA
R014122
Oth
er
SW
M1997A
.WB
112/9
605/9
7
Com
pliance
Certification
Report
sand
Waste
Hauling
Log
1996
Annual
Chem
ical
Utilization
Audit
and
Tenth
Sem
i-A
nnual
Marine
Sedim
ent
Monitorin
gR
eport
06/9
7
Halv
ax
Sandor
South
west
Marine
Inc
Robert
us
Die
go
26
19970731
SA
R014758
Letter
Receip
tof
Monitoring
Report
sfo
rO
rder
No
83-0
11
NP
DE
SN
oC
AG
107697
Facility
South
west
Marine
Inc
WD
ID
No
9000000137
Robert
us
John
San
Die
go
RW
QC
BH
alv
ax
Sandor
South
west
Marine
Inc
27
19970814
SA
R061569
Letter
Pre
lim
inary
Sedim
ent
Chara
cte
rization
Halv
ax
Sandor
South
west
Ma
rin
eIn
cR
obert
us
John
Sa
nD
iego
RW
QC
B
28
19970820
SA
R050270
Letter
Com
men
tson
Tenta
tive
Ord
er
No
97-3
6H
alv
ax
Sandor
South
west
Marine
Inc
Robert
us
John
Sa
nD
iego
RW
QC
B
29
19970908
SA
R014993
Oth
er
Request
for
Rem
oval
of
Marine
Fouling
Org
anis
ms
from
Dry
dock
AF
DL-4
8
Halv
ax
Sandor
San
Die
go
RW
QC
BP
ea
se
Su
sa
nS
outh
west
Marine
Inc
252312
Fe
bru
ary
28
20
11

RE
CO
RD
OF
WR
ITT
EN
CO
MM
UN
ICA
TIO
NS
BE
TW
EE
NSW
MA
ND
RW
CB
DU
RIN
GD
EV
ELO
PM
EN
TO
FT
HE
DT
R
CH
RO
NO
LO
GIC
AL
IND
EX
ITA
BI
DA
TE
BA
TE
SN
O1D
OC
_P
ES
UB
JE
CT
FR
OM
FM
_OR
G
John
San
Die
go
RW
QC
BH
alv
ax
Sandor
30
19970910
31
19970910
SA
R015003
Letter
Rem
oval
of
Marine
Fouling
Org
anis
ms
from
Dry
dock
AF
DL-4
8
Robert
us
Inc
Robert
us
John
Sa
nD
iego
RW
QC
BS
AR
O15116
Letter
Request
for
Rem
oval
of
Marine
Fouling
Org
anis
ms
from
Dry
dock
AF
DL-4
8
Halv
ax
Sandor
South
west
Marine
South
west
Marine
Inc
Robert
us
John
Sa
nD
iego
RW
QC
B32
19970914
SA
R061570
Report
or
Stu
dy
Pre
lim
inary
Sedim
ent
Chara
cte
rization
Halv
ax
Sandor
Halv
ax
Sandor
South
west
Marine
33
19970930
SA
R014760
Letter
Receip
tof
Monitoring
Report
sfo
rO
rder
No
83-0
11
NP
DE
SN
oC
AG
107697
Facility
South
west
Marine
Inc
WD
ID
No
9000000137
Robert
us
John
San
Die
go
RW
QC
B
Inc
Ro
drig
ue
z
Inc
Sa
nD
iego
RW
QC
B34
1997
1016
SA
R061392
Letter
Com
ments
on
San
Die
go
Bay
Sedim
ent
Investigation
Requirem
ents
Halv
ax
Sandor
South
west
Ma
rin
e
RW
QC
B
Vin
ce
nt
Halv
ax
Sandor
South
west
Marine
35
1997
1021
SA
R050289
Letter
Adoption
of
Ord
er
No
97-3
6R
obert
us
John
Die
go
RW
OC
BH
alv
ax
Sandor
Inc
South
west
Marine
36
1997
1021
SA
R050291
Oth
er
Adoption
of
Ord
er
No
97-3
6R
obert
us
John
Die
go
RW
QC
BH
alv
ax
Sandor
Inc
South
west
Marine
37
19971021
SA
R050294
Ord
er
Adoption
of
Ord
er
No
97-3
6R
obert
us
John
Die
go
RW
QC
BH
alv
ax
Sandor
Inc
South
west
Marine
38
19971021
SA
R050438
Ord
er
Adoption
of
Ord
er
No
97-3
6R
obert
us
John
Die
go
Halv
ax
Sandor
Inc
South
west
Marine
39
199
71021
SA
R050447
Ord
er
Adoption
of
Ord
er
No
97-3
6R
obert
us
John
San
Die
go
RW
QC
B
Halv
ax
Sandor
Inc
South
west
Marine
40
19971021
SA
R050451
Ord
er
Adoption
of
Ord
er
No
97-3
6R
obert
us
John
San
Die
go
RW
QC
B
San
RW
QC
BH
alv
ax
Sandor
Inc
South
west
Marine
41
19971021
SA
RO
SO
461
Ord
er
Adoption
of
Ord
er
No
97-3
6R
obert
us
John
Die
go
Inc
Robert
us
John
Inc
Sa
nD
iego
RW
QC
B42
19971028
SA
R065393
Letter
Request
for
Rescis
ion
of
Ord
er
No
92-6
8H
alv
ax
Sandor
252312
Fe
bru
ary
28
20
11

RE
CO
RD
OF
WR
ITT
EN
CO
MM
UN
ICA
TIO
NS
BE
TW
EE
NSW
MA
ND
RW
CB
DU
RIN
GD
EV
ELO
PM
EN
TO
FT
HE
DT
R
CH
RO
NO
LO
GIC
AL
IND
EX
TP
IID
AT
EIB
AT
ES
NO
100C
_T
YP
ES
UB
JE
CT
FR
OM
IFM
_O
RG
ITO
ITO
OR
G
19971229
SA
R014725
Letter
Receip
tof
Monitoring
Report
sfo
rO
rder
No
97-3
6N
PD
ES
No
CA
G039001
Facility
South
west
Marine
Inc
WD
ID
No
9000000137
Pease
Susan
San
Die
go
RW
QC
BH
alv
ax
Sandor
South
west
Ma
rin
e
Inc
19971231
SA
R014726
Letter
Sam
ple
Collection
Pla
nR
obert
us
John
San
Die
go
RW
QC
BH
alv
ax
Sandor
South
west
Marine
Inc
19971231
SA
RO
151O
4Letter
Sam
ple
Collection
Pla
nR
obert
us
John
San
Die
go
RW
QC
BH
alv
ax
Sandor
South
west
Marine
Inc
19980126
SA
R065358
Letter
Tenta
tive
Ord
er
No
98-1
3A
nO
rder
Rescin
din
gO
rder
No
92-6
8
Morr
isR
obert
San
Die
go
RW
QC
BH
alv
ax
Sandor
South
west
Marine
Inc
47
19980126
SA
R065365
Report
or
Stu
dy
Tenta
tive
Ord
er
No
98-1
3A
nO
rder
Rescin
din
gO
rder
No
92-6
8
Morr
isR
obert
San
Die
go
RW
QC
BH
alv
ax
Sandor
South
west
Marine
Inc
Sa
nR
WQ
CB
19980129
SA
R013667
Oth
er
10/9
71
2/9
7Q
uart
erly
Efflu
ent
Wate
r
Monitorin
gR
eport
Spill
Illicit
Dis
charg
e
Log
Flo
ating
Dry
dock
Subm
erg
ence
Em
erg
ence
Wate
r12/9
7C
om
pliance
Certification
Report
and
10/9
712/9
7
Waste
Hauling
Log
Halv
ax
Sandor
South
west
Marine
Inc
Pe
ase
Die
go
49
19980129
SA
R014751
Oth
er
South
west
Marine
Waste
Hauling
Log
10/9
71
2/9
7
Halv
ax
Sandor
South
west
Marine
Inc
Pe
ase
Su
sa
nS
an
Die
go
RW
QC
B
Sa
nR
WQ
CB
50
19980130
SA
R013664
Letter
10/9
712/9
7Q
uart
erly
Efflu
ent
Wate
r
Monitorin
gR
eport
Spill
Illicit
Dis
charg
e
Log
Flo
ating
Dry
dock
Subm
erg
ence
Em
erg
ence
Wate
r12/9
7C
om
pliance
Certification
Report
and
10/9
712/9
7
Waste
Hauling
Log
Halv
ax
Sandor
South
west
Marine
Inc
Pe
ase
Su
sa
nD
iego
252312
Fe
bru
ary
28
20
11

RE
CO
RD
OF
WR
ITT
EN
CO
MM
UN
ICA
TIO
NS
BE
TW
EE
NSW
MA
ND
RW
CB
DU
RIN
GD
EV
ELO
PM
EN
TO
FT
HE
DT
R
CH
RO
NO
LO
GIC
AL
IND
EX
BA
TE
SN
OID
OC
_T
YP
ES
UB
JE
CT
FR
OM
IFM
_O
RG
ITO
ITO
_O
RG
Sa
nR
WQ
CB
51
19980130
SA
R013666
Oth
er
10/9
712/9
7Q
uart
erly
Efflu
ent
Wate
r
Monitoring
Report
Spill
Illicit
Dis
charg
e
Log
Flo
ating
Dry
dock
Subm
erg
ence
Em
erg
ence
Wate
r12/9
7C
om
pliance
Certification
Report
and
10/9
712/9
7
Waste
Haulin
gLog
Halv
ax
Sandor
South
west
Marine
Inc
Pe
ase
Su
sa
nD
iego
Sa
nR
WQ
CB
52
19980130
SA
R014145
Oth
er
12/9
705/9
8W
aste
Hauling
Log
and
Com
pliance
Certification
Report
s1997
Annual
Chem
ical
Utilization
Audit
and
Tw
elfth
Sem
i-A
nnual
Marine
Sedim
ent
Monitoring
Report
06/9
8
Halv
ax
Sandor
South
west
Marine
Inc
Pe
ase
Die
go
53
19980225
SA
R013672
Letter
Certification
Sta
tem
ent
for
Tra
nsm
itta
l
Letter
date
d01/3
0/9
8
Halv
ax
Sandor
South
west
Marine
Inc
Pe
ase
Su
sa
nS
an
Die
go
RW
QC
B
54
19980226
SA
R065366
Letter
Adoption
of
Ord
er
No
98-1
3A
nO
rder
Rescin
din
gO
rder
No
92-6
8
Robert
us
John
San
Die
go
RW
QC
BH
alv
ax
Sandor
South
west
Marine
Inc
RW
QC
B55
199
80227
SA
R014146
Oth
er
12/9
705/9
8W
aste
Hauling
Log
and
Com
plia
nce
Certification
Report
s1997
Annual
Che
mic
al
Utilization
Audit
and
Tw
elfth
Sem
i-A
nnual
Marine
Sedim
ent
Monitoring
Report
06/9
8
Halv
ax
Sandor
South
west
Ma
rin
eIn
cP
ea
se
Su
sa
nD
iego
56
199
80309
SA
R014728
Letter
South
west
Marines
BM
PP
rogra
mR
obert
us
John
San
Die
go
RW
QC
BH
alv
ax
Sandor
Sandor
South
west
Marine
Inc
South
west
Marine
57
199
80309
SA
R014732
Letter
South
west
Marines
BM
PP
rogra
mR
obert
us
John
San
Die
go
RW
QC
BH
alv
ax
Inc
58
19980311
SA
R014737
Letter
Receip
tof
Monitoring
Report
sfo
rO
rder
No
97-3
6N
PD
ES
No
CA
GO
39001
Facility
South
west
Marine
Inc
WD
ID
No.9
000000137
Robert
us
John
San
Die
go
RW
QC
BH
alv
ax
Sandor
South
west
Marine
Inc
59
199
80312
SA
RO
151O
2Letter
Notice
of
Vio
lation
No
98-3
6R
obert
us
John
San
Die
go
RW
QC
BH
alv
ax
Sandor
South
west
Marine
Inc
252312
Fe
bru
ary
28
20
11

RE
CO
RD
OF
WR
ITT
EN
CO
MM
UN
ICA
TIO
NS
BE
TW
EE
NSW
MA
ND
RW
CB
DU
RIN
GD
EV
ELO
PM
EN
TO
FT
HE
DT
R
CH
RO
NO
LO
GIC
AL
IND
EX
I1D
AT
EB
AT
ES
NO
IDO
C_T
YP
ES
UB
JE
CT
FR
OM
FM
_OR
GIT
O_O
RG
Sa
nR
WQ
CB
60
19980323
SA
RO
1S
112
Letter
Response
toN
otice
of
Vio
lation
Ord
er
No
R9
1998-0
036
Halv
ax
Sandor
South
west
Ma
rin
eIn
cR
obert
us
Die
go
61
19980327
SA
R014147
Oth
er
12/9
70
5/9
8W
aste
Hauling
Log
and
Com
pliance
Certification
Report
s1997
Annual
Chem
ical
Utilization
Audit
and
Tw
elfth
Sem
i-A
nnual
Marine
Sedim
ent
Monitorin
gR
eport
06/9
8
Halv
ax
Sandor
South
west
Ma
rin
eIn
cP
ea
se
Su
sa
nS
an
Die
go
RW
QC
B
62
19980428
SA
R014148
Oth
er
12/9
70
5/9
8W
aste
Hauling
Log
and
Com
pliance
Certification
Report
s1997
Annual
Chem
ical
Utilization
Audit
and
Tw
elfth
Sem
i-A
nnual
Marine
Sedim
ent
Monitorin
gR
eport
06/9
8
Halv
ax
Sandor
South
west
Marine
Inc
Pe
ase
Su
sa
nS
an
Die
go
RW
QC
B
63
19980430
SA
RO
61500
Letter
San
Die
go
Bay
Sedim
ent
Investigation
Quart
erly
Pro
gre
ss
Report
January
Marc
h1998
Halv
ax
Sandor
South
west
Marine
Inc
Robert
us
John
Sa
nD
iego
RW
QC
B
64
19980519
SA
R014149
Oth
er
12/9
70
5/9
8W
aste
Hauling
Log
and
Com
pliance
Certification
Report
s1997
Annual
Chem
ical
Utilization
Audit
and
Tw
elfth
Sem
i-A
nnual
Marine
Sedim
ent
Monitorin
gR
eport
06/9
8
Halv
ax
Sandor
South
west
Ma
rin
eIn
cP
ea
se
Su
sa
nS
an
Die
go
RW
QC
B
65 66
19980529
SA
R050976
Letter
Com
pliance
with
Ord
er
No
83-1
1D
uring
Sta
y
Robert
us
John
San
Die
go
RW
QC
BH
alv
ax
Sandor
South
west
Marine
Inc
19980612
SA
R014764
Letter
copy
of
Best
Managem
ent
Pra
ctices
required
by
Ord
er
No
83-1
1
Halv
ax
Sandor
South
west
Marine
Inc
Robert
us
John
Sa
nD
iego
RW
QC
B
67
19980629
SA
R014741
Letter
dis
posal
and
waste
hauling
logs
Halv
ax
Sandor
South
west
Marine
Inc
Pe
ase
Su
sa
nS
an
Die
go
RW
QC
B
252312
Fe
bru
ary
28
20
11

RE
CO
RD
OF
WR
ITT
EN
CO
MM
UN
ICA
TIO
NS
BE
TW
EE
NSW
MA
ND
RW
CB
DU
RIN
GD
EV
ELO
PM
EN
TO
FT
HE
DT
R
CH
RO
NO
LO
GIC
AL
IND
EX
TA
BID
AT
EB
AT
ES
NO
._D
OC
_TY
PE
SU
BJE
CT
IFR
OM
FM
_OR
GIT
OIT
O_O
RG
68
19980629
SA
R014123
Letter
12/9
705/9
8W
aste
Hauling
Log
and
Com
pliance
Certification
Report
s1997
Annual
Chem
ical
Utilization
Audit
and
Tw
elfth
Sem
i-A
nnual
Marine
Sedim
ent
Monitoring
Report
06/9
8
Halv
ax
Sandor
South
west
Ma
rin
eIn
cP
ea
se
Su
sa
nS
an
Die
go
RW
QC
B
69
19980629
5A
R270369
Letter
1997
1998
Sto
rmW
ate
rA
nnual
Report
Halv
ax
Sandor
South
west
Marine
Inc
Pe
ase
Su
sa
nS
an
Die
go
RW
QC
B
70
19980629
SA
R270370
Report
or
Stu
dy
1997
1998
Sto
rmW
ate
rA
nnual
Report
Halv
ax
Sandor
South
west
Ma
rin
eIn
cP
ea
se
Su
sa
nS
an
Die
go
RW
QC
B
71
19980629
5A
R014742
Oth
er
Hazard
ous
Industr
ial
Waste
Dis
posal
Log
10/9
712/9
7
Halv
ax
Sandor
South
west
Ma
rin
eIn
cP
ea
se
Su
sa
nS
an
Die
go
RW
QC
B
72
19980630
SA
R014124
Oth
er
12/9
705/9
8W
aste
Hauling
Log
and
Com
pliance
Certification
Report
s1997
Annual
Chem
ical
Utilization
Audit
and
Tw
elfth
Sem
i-A
nnual
Marine
Sedim
ent
Monitoring
Report
06/9
8
Halv
ax
Sandor
South
west
Ma
rin
eIn
cP
ea
se
Su
sa
nS
an
Die
go
RW
QC
B
73
19980630
SA
RO
1415O
Oth
er
12/9
705/9
8W
aste
Hauling
Log
and
Com
pliance
Certification
Report
s1997
Annual
Chem
ical
Utilization
Audit
and
Tw
elfth
Sem
i-A
nnual
Marine
Sedim
ent
Monitoring
Report
06/9
8
Halv
ax
Sandor
South
west
Ma
rin
eIn
cP
ea
se
Su
sa
nS
an
Die
go
RW
QC
B
74
19980630
SA
RO
14151
Report
or
Stu
dy
12/9
705/9
8W
aste
Hauling
Log
and
Com
pliance
Certification
Report
s1997
Annual
Chem
ical
Utilization
Audit
and
Tw
elfth
Sem
i-A
nnual
Marine
Sedim
ent
Monitoring
Report
06/9
8
Halv
ax
Sandor
South
west
Ma
rin
eIn
cP
ea
se
Su
sa
nS
an
Die
go
RW
QC
B
252312
Fe
bru
ary
28
20
11

RE
CO
RD
OF
WR
ITT
EN
CO
MM
UN
ICA
TIO
NS
BE
TW
EE
NSW
MA
ND
RW
CB
DU
RIN
GD
EV
ELO
PM
EN
TO
FT
HE
DT
R
CH
RO
NO
LO
GIC
AL
IND
EX
TA
BID
AT
EB
AT
ES
NO
IDO
C_1P
ES
UB
JE
CT
IFR
OM
IFM
OR
GT
OIT
O_O
RG
Su
sa
nS
an
Die
go
RW
QC
B75
19980630
SA
R014375
Report
or
Stu
dy
12/9
70
5/9
8W
aste
Hauling
Log
and
Com
pliance
Certification
Report
s1997
Annual
Chem
ical
Utilization
Audit
and
Tw
elfth
Sem
i-A
nnual
Marine
Sedim
ent
Monitorin
gR
eport
06/9
8
Halv
ax
Sandor
South
west
Marine
Pe
ase
Sandor
South
west
Marine
76
19980720
SA
R014739
Letter
Receip
tof
Monitoring
Report
sfo
rO
rder
No
97-3
6N
PD
ES
No
CA
GO
39001
Facility
South
west
Marine
Inc
WD
ID
No
9000000137
Robert
us
John
San
Die
go
RW
QC
BH
alv
ax
Inc
South
west
77
19980720
SA
R014761
Letter
Receip
tof
Monitoring
Report
sfo
rO
rder
No
83-1
1N
PD
ES
No
CA
G107697
Facility
South
west
Marine
Inc
WD
ID
No
9000000137
Robert
us
John
San
Die
go
RW
QC
BH
alv
ax
Inc
78
19980720
SA
R061566
Map
or
Plo
tP
lan
PC
BS
am
ple
Location
Map
Halv
ax
Sandor
South
west
Ma
rin
eIn
cS
ch
wa
llK
ris
tin
Su
sa
n
Sa
nD
iego
RW
QC
B
Sa
nR
WQ
CB
79
19980825
SA
R014753
Letter
revis
ions
per
request
of
RW
QC
B
incorr
espondence
date
d06/2
0/9
8
Halv
ax
Sandor
South
west
Ma
rin
eIn
cP
ea
se
Su
sa
nS
an
Die
go
RW
QC
B80 81
19980825
5A
R050978
Letter
Revis
ed
Pages
for
Decem
ber
1997
thro
ugh
1998
Sem
iannual
Report
ing
Halv
ax
Sandor
South
west
Marine
Inc
Pe
ase
Sa
nR
WQ
CB
19981027
SA
R013618
Letter
dis
charg
elo
gand
com
pliance
certifica
tion
for
07/9
809/9
8.1
Halv
ax
Sandor
South
west
Ma
rin
eIn
cP
ea
se
Su
sa
n John
Die
go
Sa
nR
WQ
CB
82
19981117
SA
R014971
Report
or
Stu
dy
Technic
al
Report
Halv
ax
Sandor
South
west
Ma
rin
eIn
cR
obert
us
John
Die
go
Sa
nD
iego
RW
QC
B83
19981120
SA
R014970
Letter
Technic
al
Report
Halv
ax
Sandor
South
west
Ma
rin
eR
obert
us
84
19981123
SA
R035059
Letter
Section
Pro
vis
ion
7.A
Sta
tus
Report
Halv
ax
Sandor
South
west
Ma
rin
eIn
cR
obert
us
Halv
ax
Sandor
Die
go
South
west
Marine
85
19981210
SA
R014757
Letter
US
EP
AN
PD
ES
Quart
erly
Non-
Com
pliance
Report
Robert
us
John
San
Die
go
RW
QC
B
Inc
252312
Fe
bru
ary
28
20
11

RE
CO
RD
OF
WR
ITT
EN
CO
MM
UN
ICA
TIO
NS
BE
TW
EE
NSW
MA
ND
RW
CB
DU
RIN
GD
EV
ELO
PM
EN
TO
FT
HE
DT
R
CH
RO
NO
LO
GIC
AL
IND
EX
IIID
AT
EB
AT
ES
_N
O._
DO
C_T
YP
ES
UB
JEC
TF
RO
MIF
M_O
RG
ITO
ITO
_O
RG
South
west
Marine
86
19981210
SA
R050995
Letter
NP
DE
SQ
uart
erly
Non-C
om
pliance
Report
Robert
us
John
San
Die
go
RW
QC
BH
alv
ax
Inc
19981223
SA
R035242
Letter
Dis
charg
eM
onitoring
Report
Form
Halv
ax
Sandor
South
west
Ma
rin
eIn
cR
obert
us
John
Sa
nD
iego
RW
QC
B
88
19990105
SA
R199752
Letter
Rescis
sio
nof
Ord
er
No
98-3
8M
arine
Railw
ay
Rem
oval
Pro
ject
Halv
ax
Sandor
South
west
Ma
rin
eIn
cR
obert
us
John
Sa
nD
iego
RW
QC
B
89
19990128
SA
R013625
Letter
quarte
rly
and
sem
iannual
report
sfo
r07/9
812/9
8
Halv
ax
Sandor
South
west
Marine
Inc
Robert
us
John
Sa
nD
iego
RW
QC
B
90
19990217
SA
R061447
Letter
Tenta
tive
Ship
yard
Sedim
ent
Cle
anup
Levels
and
Dre
dgin
gW
DR
s
Bark
er
David
DT
B
San
Die
go
RW
QC
BH
alv
ax
Sandor
South
west
Marine
Inc
91
199
90217
SA
R061454
Oth
er
Tenta
tive
Ship
yard
Sedim
ent
Cle
anup
Levels
and
Dre
dgin
gW
DR
5
Bark
er
David
DT
B
San
Die
go
RW
QC
BH
alv
ax
Sandor
South
west
Marine
Inc
92
199
90217
SA
R199699
Letter
Tra
nsm
itta
lof
Tenta
tive
Ord
er
No
99-1
4
Sedim
ent
Rem
edia
tion
Pro
ject
Bark
er
David
DT
B
San
Die
go
RW
QC
BH
alv
ax
Sandor
South
west
Marine
Inc
93
19990217
SA
R199700
Ord
er
Tra
nsm
itta
lof
Tenta
tive
Ord
er
No
99-1
4
Sedim
ent
Rem
edia
tion
Pro
ject
Bark
er
David
DT
B
San
Die
go
RW
QC
BH
alv
ax
Sandor
South
west
Marine
Inc
94
19990224
SA
R061457
Report
or
Stu
dy
Tenta
tive
Ship
yard
Sedim
ent
Cle
anup
Levels
and
Dre
dgin
gW
DR
s
Bark
er
David
DT
B
San
Die
go
RW
QC
BH
alv
ax
Sandor
South
west
Marine
Inc
95
199
90308
SA
R199947
Oth
er
National
Resourc
es
Defe
nse
Council
et
al
South
west
Marine
Decis
ion
Halv
ax
Shaun
South
west
Marine
Inc
Sch
wa
llK
ris
tin
Sa
nD
iego
RW
QC
B
96
19990310
SA
R061469
Ord
er
Tenta
tive
Ship
yard
Sedim
ent
Cle
anup
Levels
and
Dre
dgin
gW
DR
s
Bark
er
David
DT
B
San
Die
go
RW
QC
BH
alv
ax
Sandor
Marine
Inc
97
19990325
SA
R062112
Letter
Adoption
of
Resolu
tion
Nos
99-1
2and
99-2
0and
Ord
er
No
99-1
4
Robert
us
John
San
Die
go
RW
QC
BH
alv
ax
Sandor
South
west
Marine
Inc
98
19990325
99
19990325
SA
R062122
SA
R062128
Meeting
Min
ute
s
Ord
er
Adoption
of
Resolu
tion
Nos
99-1
2and
99-2
0and
Ord
er
No
99-1
4
Adoption
of
Resolu
tion
Nos
99-1
2and
Robert
us
John
Robert
us
John
San
Die
go
RW
QC
B
San
Die
go
RW
QC
B
Halv
ax
Sandor
Halv
ax
Sandor
South
west
Marine
Inc
South
west
Marine
99-2
0and
Ord
er
No
99-1
4In
c
252312
10
Fe
bru
ary
28
20
11

RE
CO
RD
OF
WR
ITT
EN
CO
MM
UN
ICA
TIO
NS
BE
TW
EE
NSW
MA
ND
RW
CB
DU
RIN
GD
EV
ELO
PM
EN
TO
FT
HE
DT
R
CH
RO
NO
LO
GIC
AL
IND
EX
ftA
BD
AT
EIB
AT
ES
NO
DO
CY
PE
ISU
BJE
CT
IFR
0M
IFM
_O
RG
ITO
ITO
_O
RG
Inc
Robert
us
John
Sa
nD
iego
RW
QC
B100
19990419
SA
R013617
Letter
Quart
erly
Sem
iannual
Efflu
ent
Halv
ax
Sandor
South
west
Ma
rin
e
Monitorin
gR
eport
sR
eport
ing
Period
01/9
903/9
9
John
Sa
nD
iego
RW
QC
B101
19990429
SA
R013609
Letter
log
VH
Sta
pe
certification
and
letter
for
01/9
903/9
9
Halv
ax
Sandor
South
west
Ma
rin
eIn
cR
obert
us
John
Sa
nD
iego
RW
QC
B102
19990701
SA
R270508
Letter
1998
1999
Sto
rmW
ate
rA
nnual
Report
Halv
ax
Sandor
South
west
Marine
Inc
Robert
us
John
Sa
nR
WQ
CB
103
19990701
SA
R270509
Report
or
Stu
dy
1998
19
99
Sto
rmW
ate
rA
nnual
Report
Halv
ax
Sandor
South
west
Ma
rin
eIn
cR
obert
us
Sandor
South
west
Marine
104
19990708
SA
R035244
Report
or
Inspection
Report
Ric
hte
rP
aul
San
Die
go
RW
QC
BH
alv
ax
Inc
Stu
dy
John
Sa
nR
WQ
CB
105
19990712
SA
R269999
Letter
Notice
of
Term
ination
Halv
ax
Sandor
South
west
Marine
Inc
Robert
us
John
Sa
nD
iego
RW
QC
B106
19990712
SA
R270000
Oth
er
Notice
of
Term
ination
Halv
ax
Sandor
South
west
Marine
Inc
John
Sa
nD
iego
RW
QC
B107
19990716
SA
R013569
Letter
quarte
rly
and
sem
i-annual
report
sfo
r01/9
906/9
9
Halv
ax
Sandor
South
west
Ma
rin
eIn
c
John
Sa
nD
iego
RW
QC
B108
19990830
SA
R035811
Report
or
Stu
dy
of
various
month
lyquarte
rly
and
annual
report
sin
accord
ance
with
Halv
ax
Sandor
South
west
Marine
Inc
109
Ord
er
No
97-3
6John
Sa
nR
WQ
CB
19990830
SA
R035789
Letter
various
month
lyquart
erly
and
annual
report
sin
accord
ance
with
Ord
er
No
97-3
6
Halv
ax
Sandor
South
west
Marine
Inc
Robert
us
John
Sa
nR
WQ
CB
110
19990830
SA
R036512
Report
or
Marine
Sedim
ent
Monitoring
and
Halv
ax
Sandor
South
west
Ma
rin
eIn
cR
obert
us
111
Stu
dy
Report
ing
Annual
Report
08/9
9
Robert
us
John
Sa
nD
iego
RW
QC
B19990830
SA
R035790
Report
or
South
west
Marine
Inc
Technic
al
Report
Halv
ax
Sandor
South
west
Marine
Stu
dy
Section
F.1
a-c
Inc
Robert
us
John
Sa
nD
iego
RW
QC
B112
19990831
SA
R036800
Report
or
Stu
d
ref
1999
for
sw
rn.X
LS
South
west
Marine
NP
DE
SP
erm
itM
arine
Sedim
ent
Monitoring
Report
ing
08/3
1/9
9
Halv
ax
Sandor
South
west
Ma
rin
e
252312
11
Fe
bru
ary
28
20
11

RE
CO
RD
OF
WR
ITT
EN
CO
MM
UN
ICA
TIO
NS
BE
TW
EE
NSW
MA
ND
RW
CB
DU
RIN
GD
EV
ELO
PM
EN
TO
FT
HE
DT
R
CH
RO
NO
LO
GIC
AL
IND
EX
TA
BID
AT
EB
AT
ES
NO
IDO
C_T
YP
EIS
UB
JE
CT
IFR
OM
IFM
_O
RG
Inc
Robert
us
John
Sa
nD
iego
RW
QC
B113
19990831
SA
R036799
Dis
cS
outh
west
Marine
NP
DE
SP
erm
itM
arine
Sedim
ent
Monitoring
Report
ing
08/3
1/9
9
Halv
ax
Sandor
Marine
Robert
us
John
Sa
nD
iego
RW
O.C
B114
19990831
5A
R036848
Report
or
Stu
dy
swm
Table
B.d
oc
South
west
Marine
NP
DE
SP
erm
itM
arine
Sedim
ent
Monitoring
Report
ing
08/3
1/9
9
Halv
ax
Sandor
South
west
Marine
Inc
Robert
us
John
Sa
nD
iego
RW
QC
B115
19990831
SA
R036806
Report
or
Stu
dy
swm
1999
report
MS
W.d
oc
South
west
Marine
NP
DE
SP
erm
itM
arine
Sedim
ent
Monitoring
Report
ing
08/3
1/9
9
Halv
ax
Sandor
South
west
Marine
Robert
us
John
Sa
nD
iego
RW
QC
B116
19990831
SA
R036821
Report
or
Stu
dy
SW
M1999.X
LS
South
west
Marine
NP
DE
SP
erm
itM
arine
Sedim
ent
Monitoring
Report
ing
08/3
1/9
9
Halv
ax
Sandor
South
west
Marine
Inc
Robert
us
John
Sa
nD
iego
RW
QC
B117
19991005
SA
R034660
Report
or
Stu
dy
Quart
erly
Report
07/9
909/9
9H
alv
ax
Sandor
Inc
Robert
us
John
Sa
nD
iego
RW
QC
B118
19991030
SA
R029429
Report
or
Stu
dy
ALT
AS
DG
20
841.p
df
Quart
erly
Report
07/9
909/9
9
Halv
ax
Sandor
South
west
Marine
South
west
Inc
Robert
us
John
Sa
nD
iego
RW
QC
B119
19991030
SA
R030871
Report
or
Stu
dy
ALT
AS
DG
20842.p
df
Quart
erly
Report
07/9
9-0
9/9
9
Halv
ax
Sandor
John
Sa
nD
iego
RW
QC
B120
19991030
SA
R032424
Report
or
Stu
dy
ALT
AS
DG
20856.p
df
Quart
erly
Report
07/9
909/9
9
Halv
ax
Sandor
South
west
Ma
rin
eIn
c
Inc
Robert
us
Robert
us
John
Sa
nD
iego
RW
QC
B121
19991030
SA
R015243
Report
or
Stu
dy
CA
SS
DG
flK
2105657.p
df
Quart
erly
Report
07/9
909/9
9
Halv
ax
Sandor
Inc
Robert
us
John
Sa
nD
iego
RW
QC
B122
19991030
SA
R019736
Report
or
Stu
dy
CA
SS
DG
K2105657.p
df
Quart
erly
Report
07/9
909/9
9
Halv
ax
Sandor
John
Sa
nD
iego
RW
QC
B123
19991030
SA
R032605
Report
or
Stu
dy
CA
SS
DG
ttK
21O
5657.p
df
Quart
erly
Report
07/9
909/9
9
Halv
ax
Sandor
South
west
Ma
rin
eIn
c
Ma
rin
eIn
cR
obert
us
John
Sa
nD
iego
RW
QC
B124
125
19991030
19991030
SA
R015663
SA
R020475
Report
or
Stu
dy
Report
or
CA
SS
DG
K2105719.p
df
Quart
erly
Report
07/9
909/9
9
CA
SS
DG
K2105719.p
df
Quart
erly
Halv
ax
Sandor
Haiv
ax
Sandor
South
west
Marine
Inc
Robert
us
John
Sa
nD
iego
RW
QC
B
Stu
dy
Report
07/9
909/9
9
252312
12
Fe
bru
ary
28
20
11

RE
CO
RD
OF
WR
ITT
EN
CO
MM
UN
ICA
TIO
NS
BE
TW
EE
NSW
MA
ND
RW
CB
DU
RIN
GD
EV
ELO
PM
EN
TO
FT
HE
DT
R
CH
RO
NO
LO
GIC
AL
IND
EX
IFA
BL
DA
TE
NO
1D
0c_
TY
PE
ISU
BJE
CT
IFR
OM
IFM
_O
RG
Inc
Robert
us
John
Sa
nD
iego
RW
QC
B126
19991030
SA
R024837
Report
or
Stu
dy
CA
SS
DG
K2105719.p
df
Quart
erly
Report
07/9
9-0
9/9
9
Halv
ax
Sandor
Sandor
South
west
Marine
Inc
Robert
us
John
Sa
nD
iego
RW
QC
B127
19991030
5A
R032941
Report
or
Stu
dy
CA
SS
DG
K2105719.P
df
Quart
erly
Report
07/9
909/9
9
Halv
ax
South
west
Marine
Inc
Robert
us
John
Sa
nD
iego
RW
QC
B128
19991030
SA
RO
16005
Report
or
Stu
dy
CA
SS
DG
K2105764.p
df
Quart
erly
Report
07/9
909/9
9
Halv
ax
Sandor
South
west
Marine
Inc
Robert
us
John
Sa
nD
iego
RW
QC
B129
19991030
SA
R021147
Report
or
Stu
dy
CA
SS
DG
K2105764.p
df
Quart
erly
Report
07/9
909/9
9
Halv
ax
Sandor
South
west
Ma
rin
eIn
cR
obert
us
John
Sa
nD
iego
RW
QC
B130
19991030
SA
R025239
Report
or
Stu
dy
CA
SS
DG
K2105764.p
df
Quart
erly
Report
07/9
9-0
9/9
9
Halv
ax
Sandor
South
west
Marine
Inc
Robert
us
John
Sa
nD
iego
RW
QC
B131
19991030
SA
R033184
Report
or
Stu
dy
CA
SS
DG
K2105764.p
df
Quart
erly
Report
07/9
909/9
9
Halv
ax
Sandor
South
west
Marine
Inc
Robert
us
John
Sa
nD
iego
RW
QC
B132
19991030
SA
R016534
Report
or
Stu
dy
CA
SS
DG
K2105797.p
df
Quart
erly
Report
07/9
909/9
9
Halv
ax
Sandor
South
west
Ma
rin
eIn
cR
obert
us
John
Sa
nD
iego
RW
QC
B133
19991030
SA
R021926
Report
or
Stu
dy
CA
SS
DG
K2105797.p
df
Quart
erly
Report
07/9
909/9
9
Halv
ax
Sandor
South
west
Marine
Inc
Robert
us
John
Sa
nD
iego
RW
QC
B134
19991030
SA
R025764
Report
or
Stu
dy
CA
SS
DG
UK
2105797.p
df
Quart
erly
Report
o7/9
9-0
9/9
9
Halv
ax
Sandor
South
west
Ma
rin
eIn
cR
obert
us
John
Sa
nD
iego
RW
QC
B135
19991030
5A
R033516
Report
or
Stu
dy
CA
SS
DG
K2105797.p
df
Quart
erly
Report
07/9
909/9
9
Halv
ax
Sandor
South
west
Ma
rin
eIn
cR
obert
us
John
Sa
nD
iego
RW
QC
B136
19991030
SA
RO
17O
S1
Report
or
Stu
dy
CA
SS
DG
K2105847.p
df
Quart
erly
Report
07/9
909/9
9
Halv
ax
Sandor
South
west
Ma
rin
eIn
cR
obert
us
John
Sa
nD
iego
RW
QC
B137
19991030
SA
R022748
Report
or
Stu
dy
CA
SS
DG
K2105847.p
df
Quart
erly
Report
07/9
909/9
9
Halv
ax
Sandor
South
west
Ma
rin
eIn
cR
obert
us
John
Sa
nD
iego
RW
QC
B138
19991030
SA
R026237
Report
or
Stu
dy
CA
SS
DG
K2105847.p
df
Quart
erly
Report
07/9
909/9
9
Halv
ax
Sandor
South
west
Marine
Inc
Robert
us
John
Sa
nD
iego
RW
QC
B139
19991030
SA
R033732
Report
or
Stu
dy
CA
SS
DG
UK
2105847.P
df
Quart
erly
Report
07/9
909/9
9
Sandor
South
west
Ma
rin
eIn
cR
obert
us
John
Sa
nD
iego
RW
QC
B140
19991030
SA
R017618
Report
or
Stu
dy
CA
SS
DG
K2105847A
Quart
erly
Report
07/9
9-0
9/9
9
Halv
ax
Sandor
South
west
Marine
Inc
Robert
us
John
Sa
nD
iego
RW
QC
B141
19991030
SA
R018235
Report
or
1S
tudy
CA
SS
DG
K2105900.P
df
Quart
erly
Report
07/9
9-0
9/9
9
Halv
ax
252312
13
Fe
bru
ary
28
20
11

RE
CO
RD
OF
WR
ITT
EN
CO
MM
UN
ICA
TIO
NS
BE
TW
EE
NSW
MA
ND
RW
CB
DU
RIN
GD
EV
ELO
PM
EN
TO
FT
HE
DT
R
CH
RO
NO
LO
GIC
AL
IND
EX
ITA
BID
AT
EB
AT
ES
_NO
DO
C_T
YP
ES
UB
JE
CT
FR
OM
IFM
_O
RG
ITO
Inc
Robert
us
John
Sa
nD
iego
RW
QC
B1
42
19991030
14
319991030
SA
R023981
Report
or
Stu
dy
CA
SS
DG
K2105900.p
df
Quart
erly
Report
07/9
909/9
9
Halv
ax
Sandor
South
west
Marine
John
Sa
nR
WQ
CB
SA
R034004
Report
or
Stu
dy
CA
SS
DG
K2105900.p
df
Quart
erly
Report
07/9
909/9
9
Halv
ax
Sandor
South
west
Marine
Inc
Robert
us
John
Die
go
Sa
nD
iego
RW
QC
B1
44
19991030
SA
RO
182S
OR
eport
or
Stu
dy
CA
SS
DG
K2105935.p
df
Quart
erly
Report
07/9
909/9
9
Halv
ax
Sandor
South
west
Marine
Inc
John
Sa
nD
iego
RW
QC
B1
45
19991030
SA
R034225
Report
or
Stu
dy
CA
SS
DG
K2105935.p
df
Quart
erly
Report
07/9
909/9
9
Halv
ax
Sandor
South
west
Marine
John
Sa
nR
WQ
CB
14
619991030
14
719991030
148
19991030
149
19991030
SA
R018717
Report
or
Stu
dy
CA
SS
DG
K2105935A
Quart
erly
Report
07/9
909/9
9
Halv
ax
Sandor
South
west
Marine
Inc
Robert
us
John
Die
go
Sa
nR
WQ
CB
SA
R026933
Report
or
Stu
dy
PA
Ds
CA
SS
DG
UK
2105657.p
df
Quart
erly
Report
07/9
909/9
9
Halv
ax
Sandor
South
west
Marine
Inc
Robert
us
John
Sa
nR
WQ
CB
SA
R027497
Report
or
Stu
dy
PA
Hs
CA
SS
DG
K2105900.p
df
Quart
erly
Report
07/9
909/9
9
Halv
ax
Sandor
South
west
Marine
Inc
Robert
us
John
Die
go
Sa
nR
WQ
CB
SA
R028072
Report
or
Stu
dy
PA
Hs
CA
SS
DG
K2105935.p
df
Quart
erly
Report
07/9
909/9
9
Halv
ax
Sandor
South
west
Ma
rin
eIn
cR
obert
us
John
Sa
nR
WQ
CB
150
19991030
SA
R015241
Dis
cQ
uart
erly
Re
port
07/9
909/9
9H
alv
ax
Sandor
South
west
Marine
Inc
Robert
us
John
Sa
nD
iego
RW
QC
B151
19991030
SA
R034653
Vid
eo
Quart
erly
Re
port
07/9
909/9
9H
alv
ax
Sandor
South
west
Marine
Inc
Robert
us
John
Sd
nR
WQ
CB
152
19991030
SA
R034655
Vid
eo
Quart
erly
Re
port
07/9
909/9
9H
alv
ax
Sandor
South
west
Marine
Inc
Robert
us
John
Die
go
RW
QC
B153
19991030
SA
R034656
Vid
eo
Quart
erly
Re
port
07/9
909/9
9H
alv
ax
Sandor
South
west
Marine
Inc
Robert
us
John
Die
go
Sa
nD
iego
RW
QC
B154
19991030
SA
R034657
Vid
eo
Quart
erly
Re
port
07/9
909/9
9H
alv
ax
Sandor
South
west
Marine
Inc
Robert
us
John
Sa
nR
WQ
CB
155
19991030
SA
R034658
Vid
eo
Quart
erly
Report
07/9
909/9
9H
alv
ax
Sandor
South
west
Marine
Inc
Robert
us
RW
QC
B156
19991030
SA
R034659
Letter
Quart
erly
Report
07/9
909/9
9H
alv
ax
Sandor
South
west
Ma
rin
eIn
cR
obert
us
Die
go
Sa
nR
WQ
CB
157
19991030
SA
R034652
Report
or
Stu
dy
San
Die
go
RW
QC
BF
ile
Ship
Data
.mdb
Quart
erly
Report
07/9
909/9
9
Halv
ax
Sandor
South
west
Marine
Inc
Robert
us
Die
go
252312
14
Fe
bru
ary
28
20
11
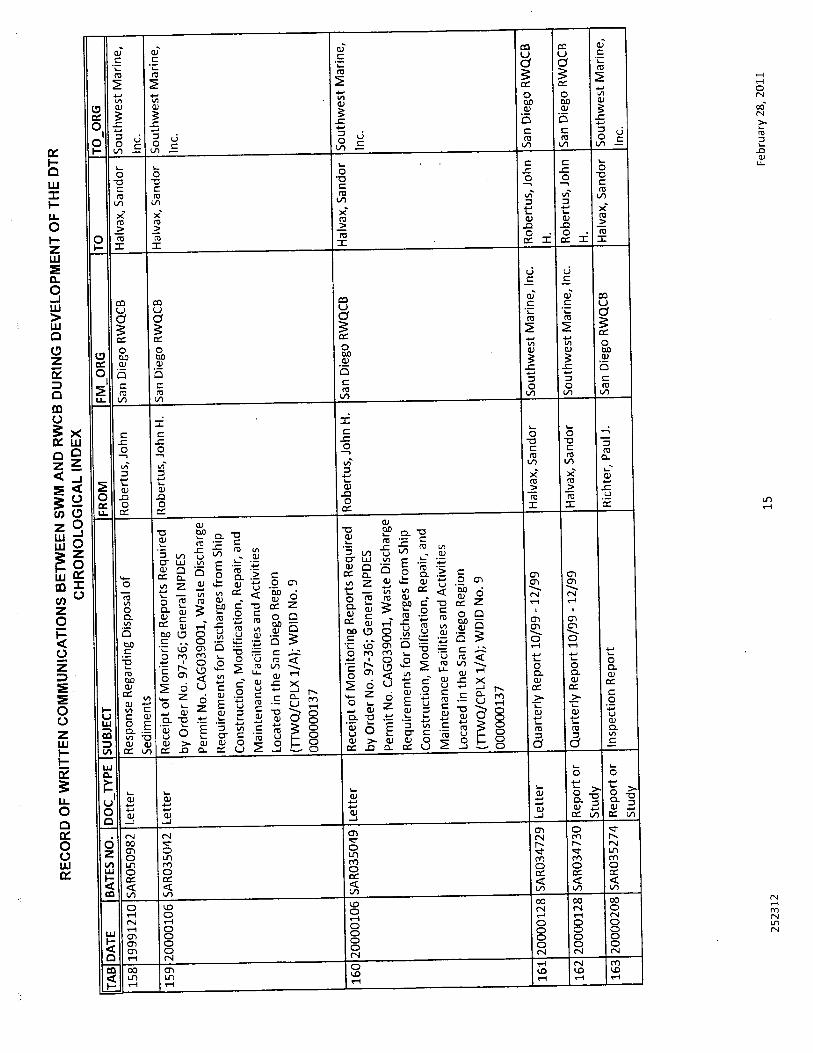
RE
CO
RD
OF
WR
ITT
EN
CO
MM
UN
ICA
TIO
NS
BE
TW
EE
NSW
MA
ND
RW
CB
DU
RIN
GD
EV
ELO
PM
EN
TO
FT
HE
DT
R
CH
RO
NO
LO
GIC
AL
IND
EX
TA
BD
AT
EB
AT
ES
NO
IDO
C.J
YP
ES
UB
JE
CT
of
Robert
us
John
San
Die
go
RW
QC
BH
alv
ax
Sandor
South
west
Marine
158
19991210
SA
R050982
Letter
Response
Regard
ing
Dis
posal
Sedim
ents
Robert
us
John
San
Die
go
RW
QC
B
Inc
Halv
ax
Sandor
South
west
Marine
159
20000106
SA
R035042
Letter
Receip
tof
Monitoring
Report
sR
equired
by
Ord
er
No
97-3
6G
enera
lN
PD
ES
Perm
itN
oC
AG
O39001
Waste
Dis
charg
e
Requirem
ents
for
Dis
charg
es
from
Ship
Constr
uction
Modific
ation
Repair
and
Main
tenance
Facilitie
sand
Activitie
s
Locate
din
the
San
Die
go
Regio
n
TT
WQ
JCP
LX1/A
WD
IDN
o
000000137
John
San
Die
go
RW
O.C
BH
alv
ax
Sandor
Inc
South
west
Marine
160
20000106
SA
R035049
Letter
Receip
tof
Monitoring
Report
sR
equired
by
Ord
er
No
97-3
6G
enera
lN
PD
ES
Perm
itN
oC
AG
O39001
Waste
Dis
charg
e
Requirem
ents
for
Dis
charg
es
from
Ship
Constr
uction
Modific
ation
Repair
and
Main
tenance
Facilitie
sand
Activitie
s
Locate
din
the
San
Die
go
Regio
n
TT
WO
JCP
LX1/A
WD
IDN
o
000000137
Robert
us
Halv
ax
Sandor
South
west
Ma
rin
eIn
cR
obert
us
John
Inc
Sa
nD
iego
RW
QC
B
161
20000128
SA
R034729
Letter
Quart
erly
Report
10/9
912/9
9
Sandor
South
west
Marine
Inc
Robert
us
John
Sa
nD
iego
RW
QC
B
162
20000128
SA
R034730
Report
or
Stu
dy
Quart
erly
Report
10/9
912/9
9H
alv
ax
Ric
hte
rP
aul
San
Die
go
RW
QC
BH
alv
ax
Sandor
South
west
Marine
163
20000208
SA
R035274
Report
or
Stu
dy
Inspection
Report
Inc
252312
15
Fe
bru
ary
28
2011