moscow exchange investor presentation
TRANSCRIPT

July 2020
Investor presentation

History of MOEX: the path of ongoing progress
2
1992Moscow Interbank Currency Exchange (MICEX) established
1995Russian Trading
System (RTS) established
2006National Clearing
Centre (NCC) established
2011Merger of MICEX
and RTS: Moscow Exchange (MOEX)
established
2012Launch of Central
Securities Depository
(CSD)
2013IPO of Moscow
Exchange (MOEX)
Share price up to 25 December 2019
1992+ FX
1993+ Bonds
1996+ Money Market
2001+ Derivatives
Feb
Apr
Jun
Aug
Oct
Dec
Feb
Apr
Jun
Aug
Oct
Dec
Feb
Apr
Jun
Aug
Oct
Dec
Feb
Apr
Jun
Aug
Oct
Dec
Feb
Apr
Jun
Aug
Oct
Dec
Feb
Apr
Jun
Aug
Oct
Dec
Feb
Apr
Jun
Aug
Oct
Dec
Feb
Apr
Jun
2013 2014 2015 2016 2017 2018 2019 2020
MO
EX
sh
are
pri
ce
, R
UB
MOEX completes its IPO;Repo with CCP launched
Euroclear and Clearstream gain access to
corporate bonds in additionto government bonds
Trading in government bonds moves to T+1 settlement
New dividend policy with a minimum payout
ratio of 55%
Launch of GCC repo
Shareholder electronicvoting becomes available
Corporates granted direct access tothe FX Market
Corporates admitted todeposits with CCP
Equity trading moves to
T+2 settlement
55
Eurobonds starttrading on MOEX
Grain trading commences on MOEX
SPO of MOEX
113
Launch of the Unified Collateral Pool
OTC bond platform launched
Inaugural Sustainability
Report
New dividend policy: target payout = FCF,min payout = 60%
of net profit
Launch of RUSFAR –Money Market interest
rate benchmark

Investment and corporate highlights
3
Financial Resilience
▪ Counter-cyclical business model coupled with robust cost control
▪ Secular growth of fees and commissions (F&C) across 7complimentary F&C business lines
▪ Business-driven margin and collateral requirements generatesustainable net interest income (NII)
▪ Operating income F&C/NII split of 60/40 evolving towards F&C
▪ One of the highest EBITDA margins among global peers
▪ Attractive dividend policy: min. payout of 60%; target payout of100% FCFE; track record of distributing 55-89% of 2014-2019 profits
Operational Excellence
▪ All-electronic since 1997
▪ Vast in-house IT expertise: ~1/3 of staff are IT developers,supporting a CAPEX-light business model
▪ Single-tier clearing system requires all participants to provide eligiblecollateral in cash or securities to trade any asset class
▪ Pre-trade risk checks forestall any “fat fingers”/”flash crash” problems
▪ Low-cost product scalability: a new order book launch requires theequivalent of circa USD 10 thousand
Strategic Stance
▪ Low penetration of financial services indicates secular growth potential
▪ The world’s most diversified exchange with trading in 5 asset classesvs ~3 offered by “traditional” exchanges
▪ Complete vertical integration of a trading engine with a clearinghouse and a central securities depository makes up a unique platform
▪ Cornerstone of the Russian financial system: MOEX brings together thetiers of the banking system by managing ~3/4 of its total liquidity flow
▪ The world’s only exchange focused on Russian financial assets in themarket is open for competition (ex. the CSD). OTC is the main competitor
▪ B2B business model: investors trade via locally licensed brokers andbanks. Foreign investors have SMA and ICM services at their disposal
Corporate Governance
▪ A 28-year history of successful and continuous implementation ofinfrastructural and regulatory reforms
▪ No single controlling shareholder: free float of 63% with substantialinternational participation; the largest shareholder owns <12%
▪ Most Supervisory Board members are independent directors (8 outof 12)
▪ Established track record for efficient capital allocation

4
1Q 2020 update5
Financial track record4
Corporate governance and dividends2
Business overview
Market position and competitive strategy 3

Robust and trusted infrastructureTrading platform, NCC as the Central Counterparty (CCP) and NSD as the Central Securities Depository (CSD)
CLEARING SETTLEMENT & DEPOSITORYTRADING
National Clearing Centre (NCC) proprietary funds (capital)1
RUB bln
28.8
1 Jan 2019
56.6
1 Jan 2016
1 Jan 2013
38.5
1 Jan 2017
56.4
1 Jan 2014
1 Jan 2015
71.7
1 Jan 2018
1 Jan 2020
1 Jul 2020
13.2
61.564.7
70.5
▪ NCC cleared ADTV 2,9 RUB trln(2019)
▪ NCC served as a CCP for 92% of trading volumes it cleared in 2019
▪ BBB local currency rating from Fitch
▪ The target NCC capital for 2019 is ~RUB 66 bln (the level of 1 Jan 2019)
▪ As of 1 Jul 2020, N1CCP is 162.8%
Assets on deposit2
RUB trn
31 Dec 2015
31 Dec 2016
31 Dec 2012
31 Dec 2013
31 Dec 2014
31 Dec 2017
31 Dec 2019
21.8
31 Dec 2018
30 Jun
2020
12.3
24.931.7
36.439.4
45.0
52.7 52.4
National Settlement Depository (NSD) proprietary capital3
RUB bln
1 Jan 2016
1 Jan 2013
1 Jan 2020
1 Jan 2014
1 Jan 2015
1 Jan 2017
1 Jan 2018
8.9
6.0
1 Jan 2019
1 Jul 2020
7.3
9.4
11.3
8.8 8.99.7 10.2
▪ MOEX markets ADTV 3,2 RUB trln(2019)
▪ Pre-order validation (100+ risk check scenarios) ensures integrity of trades
▪ World class latency of 200-300 microseconds
▪ >500 trading members (all markets)
Regulatory requirement: 66 RUB bln
Source: Moscow Exchange1 Figures for 1 Jan 20XX are from the audited financial reports prepared in accordance with RAS. The latest figure is as reported by the CBR on a monthly basis.2 Assets on deposit based on Company’s operational data3 Figures in accordance with Russian Accounting Standards as reported to and disclosed by the CBR on a monthly basis4 Numerator of the regulatory ratio (100% requirement)
Trading venue’s net proprietary funds4 (Regulated since 3Q2019)
RUB bln
1 Jul 2019
1 Apr 2020
1 Oct 2019
1 Jan 2019
1 Apr 2019
14.6
1 Jan 2020
14.6
5.6
8.2
12.813.9
Regulatory requirement: 6 RUB bln Regulatory requirement: 9 RUB bln
5
Ex-dividend

Business continuity during coronavirus pandemic
6
Acute intraday volatility
Discrete auctions, no suspensions
NCC reviews market risk parameters for the majority of instruments as a response to high volatility
Additional measures are in place to ensure the stability and availability of IT systems as well as cybersecurity
Business continuity projects Stabilization 2.0 and Stabilization 3.0 are being implemented
A discrete auction lasts 30 min and involves three separate 10-min sessions
Bid/ask limit orders accumulate during a session, get executed at its expiration
Stock price Δ > +/- 20% within 10 min ⇒ discrete auction for this stock
MOEX Russia Index Δ > +/- 15% within 10 min ⇒ discrete auction for all stocks
No reductionin trading
hours
Highercollateral
requirements
~90% of employees work from
home
Extensive precautions in the office
In-office employees rotate in shifts
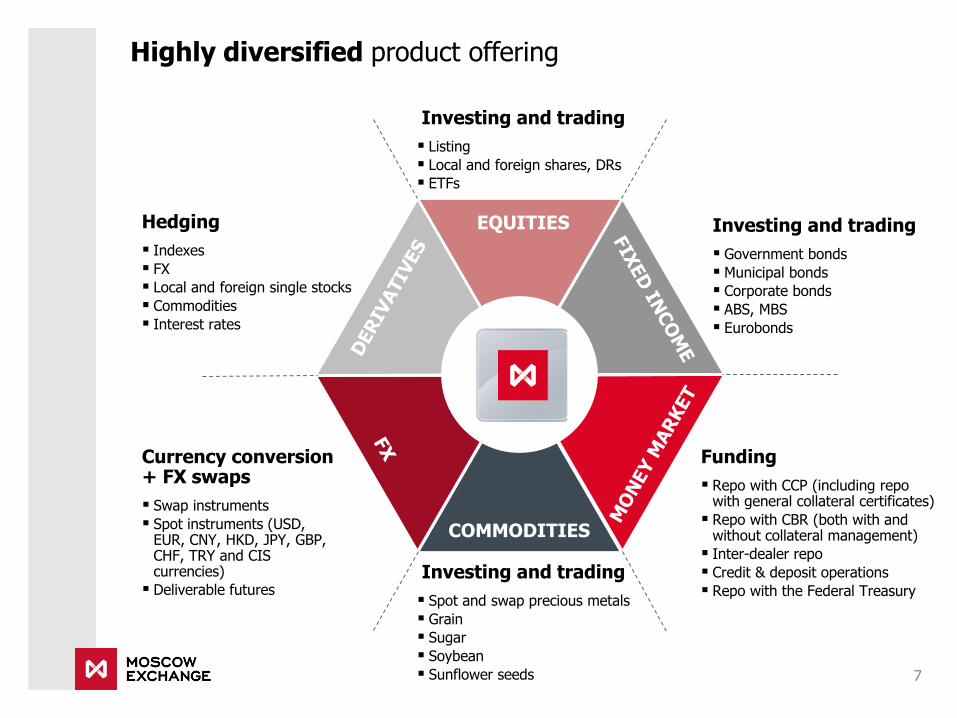
Hedging
▪ Indexes
▪ FX
▪ Local and foreign single stocks
▪ Commodities
▪ Interest rates
7
EQUITIES
COMMODITIES
Investing and trading
▪ Listing
▪ Local and foreign shares, DRs
▪ ETFs
Investing and trading
▪ Government bonds
▪ Municipal bonds
▪ Corporate bonds
▪ ABS, MBS
▪ Eurobonds
Funding
▪ Repo with CCP (including repo with general collateral certificates)
▪ Repo with CBR (both with and without collateral management)
▪ Inter-dealer repo
▪ Credit & deposit operations
▪ Repo with the Federal TreasuryInvesting and trading
▪ Spot and swap precious metals
▪ Grain
▪ Sugar
▪ Soybean
▪ Sunflower seeds
Currency conversion + FX swaps
▪ Swap instruments
▪ Spot instruments (USD, EUR, CNY, HKD, JPY, GBP, CHF, TRY and CIS currencies)
▪ Deliverable futures
Highly diversified product offering
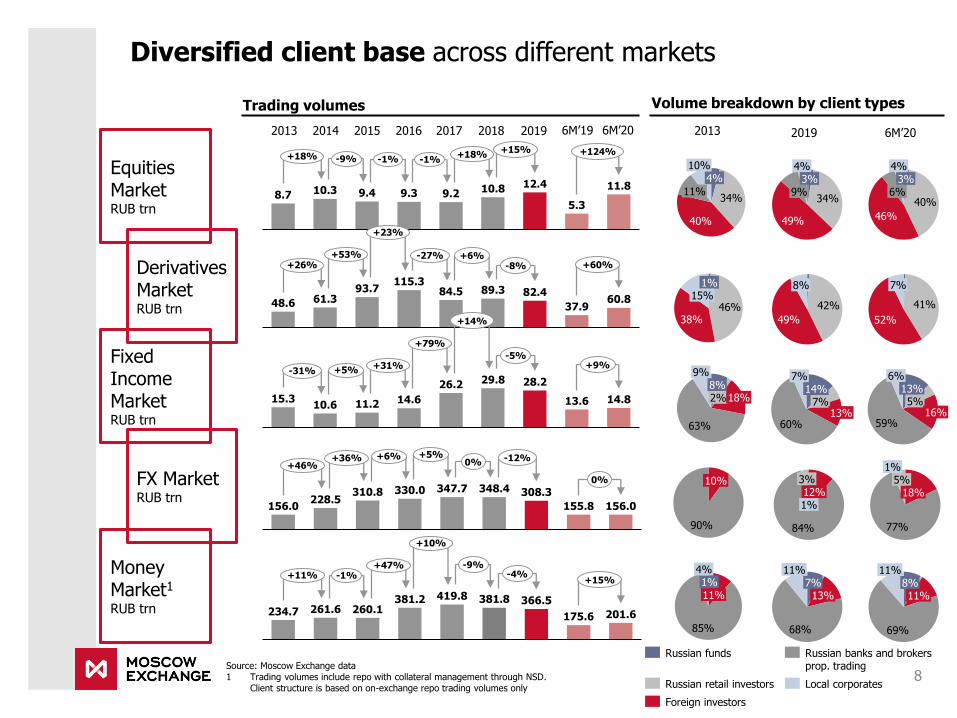
Diversified client base across different markets
8Source: Moscow Exchange data1 Trading volumes include repo with collateral management through NSD.
Client structure is based on on-exchange repo trading volumes only
Trading volumes Volume breakdown by client types
Equities MarketRUB trn
DerivativesMarketRUB trn
Fixed Income MarketRUB trn
FX MarketRUB trn
Money Market1RUB trn
2013
46%38%
1%15%
90%
10%
63%
9%8%2%18%
85%
1%11%
4%
34%
40%
4%
11%
10%
2014 20152013 2016
12.49.4
5.38.7 10.3 9.3 9.2 10.8 11.8
+18% -9% -1% -1%+18%
+15% +124%
48.6 37.9
82.461.3 60.8
93.7115.3
84.5 89.3
+26%+53%
+23%
-27% +6%-8% +60%
14.813.615.310.6 11.2
28.2
14.6
26.2 29.8-31% +5% +31%
+79%
+14%
-5%+9%
155.8
330.0
156.0228.5
310.8 347.7 348.4
156.0
308.3
+46%+36% +6% +5%
0% -12%
0%
201.6
381.2261.6234.7 260.1
419.8 381.8 366.5
175.6
+11% -1%+47%
+10%
-9%-4%
+15%
2017 20192018 2019
42%
49%
8%
84%
3%12%1%
60%
7%14%
7%13%
68%
7%13%
11%
34%
49%
4%3%
9%
6M’19 6M’20 6M’20
41%
52%
7%
77%
1%5%
18%
59%
13%6%
5%16%
69%
8%11%
11%
40%
46%
3%6%
4%
Russian funds
Russian retail investors
Russian banks and brokers prop. trading
Foreign investors
Local corporates

9
1Q 2020 update5
Financial track record4
Corporate governance and dividends
1 Business overview
Market position and competitive strategy 3
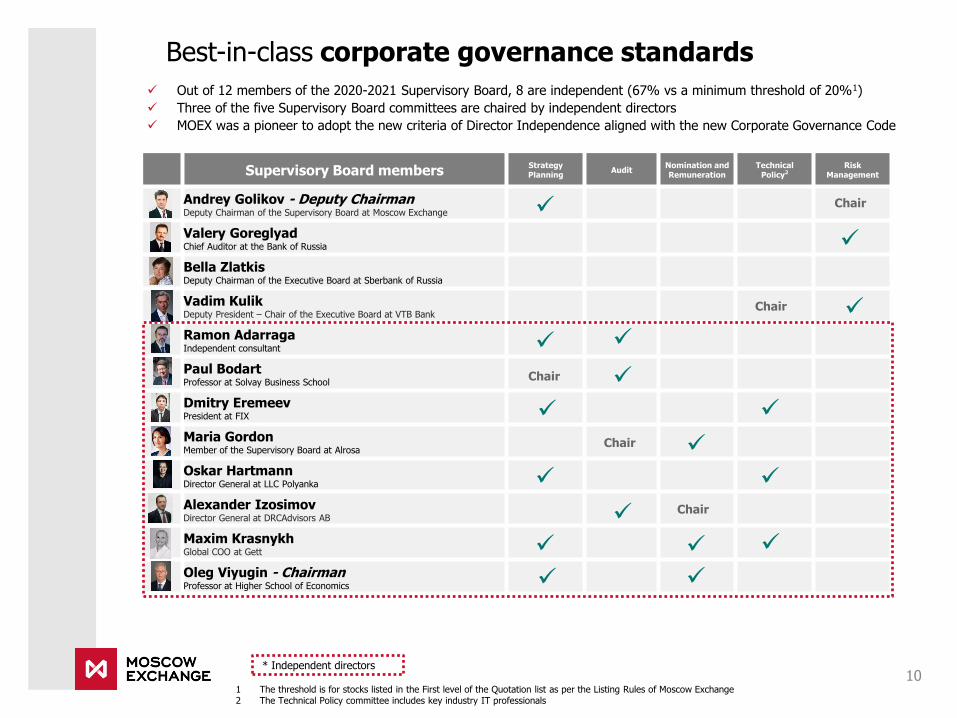
✓ Out of 12 members of the 2020-2021 Supervisory Board, 8 are independent (67% vs a minimum threshold of 20%1)
✓ Three of the five Supervisory Board committees are chaired by independent directors
✓ MOEX was a pioneer to adopt the new criteria of Director Independence aligned with the new Corporate Governance Code
Best-in-class corporate governance standards
10
Supervisory Board membersStrategy Planning
AuditNomination and Remuneration
Technical Policy2
Risk Management
Andrey Golikov - Deputy ChairmanDeputy Chairman of the Supervisory Board at Moscow Exchange
Valery GoreglyadChief Auditor at the Bank of Russia
Bella ZlatkisDeputy Chairman of the Executive Board at Sberbank of Russia
Vadim KulikDeputy President – Chair of the Executive Board at VTB Bank
Ramon AdarragaIndependent consultant
Paul BodartProfessor at Solvay Business School
Dmitry EremeevPresident at FIX
Maria GordonMember of the Supervisory Board at Alrosa
Oskar HartmannDirector General at LLC Polyanka
Alexander IzosimovDirector General at DRCAdvisors AB
Maxim KrasnykhGlobal COO at Gett
Oleg Viyugin - ChairmanProfessor at Higher School of Economics
* Independent directors
1 The threshold is for stocks listed in the First level of the Quotation list as per the Listing Rules of Moscow Exchange2 The Technical Policy committee includes key industry IT professionals
1
✓
✓
✓
Chair ✓
Chair
Chair
✓
✓
✓
✓
Chair
Chair
✓
✓
✓
✓
✓
✓
✓
✓
✓
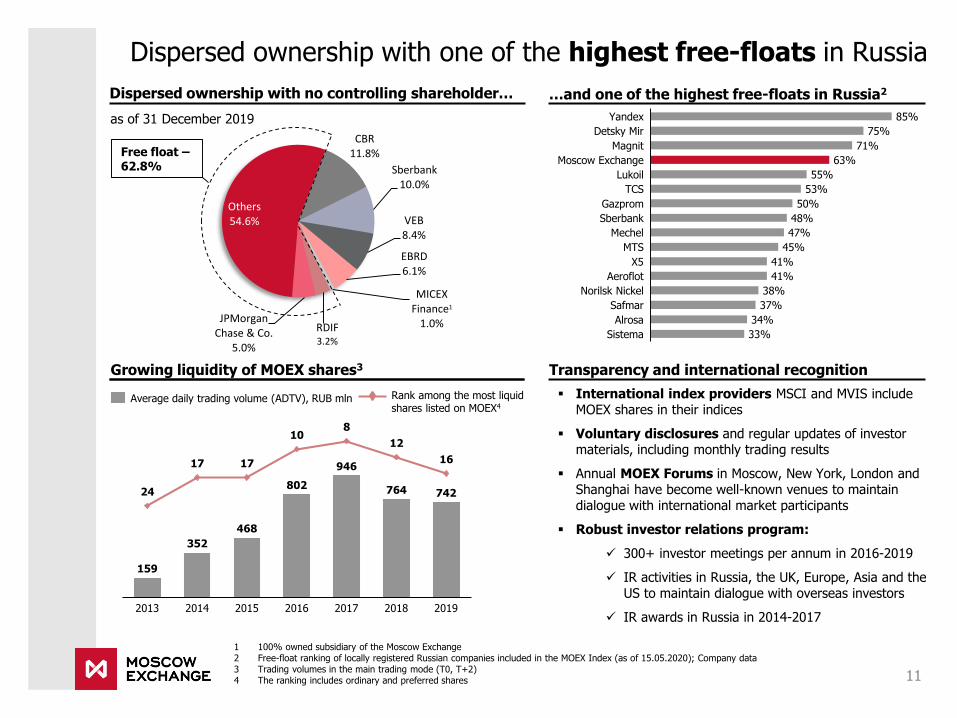
▪ International index providers MSCI and MVIS include MOEX shares in their indices
▪ Voluntary disclosures and regular updates of investor materials, including monthly trading results
▪ Annual MOEX Forums in Moscow, New York, London and Shanghai have become well-known venues to maintain dialogue with international market participants
▪ Robust investor relations program:
✓ 300+ investor meetings per annum in 2016-2019
✓ IR activities in Russia, the UK, Europe, Asia and the US to maintain dialogue with overseas investors
✓ IR awards in Russia in 2014-2017
Dispersed ownership with one of the highest free-floats in Russia
11
1 100% owned subsidiary of the Moscow Exchange2 Free-float ranking of locally registered Russian companies included in the MOEX Index (as of 15.05.2020); Company data3 Trading volumes in the main trading mode (T0, T+2)4 The ranking includes ordinary and preferred shares
Dispersed ownership with no controlling shareholder… …and one of the highest free-floats in Russia2
Transparency and international recognition
24
17 17
108
12
16
20152013 20172014 2016
159
2018 2019
352
468
802
946
764 742
Average daily trading volume (ADTV), RUB mln
Growing liquidity of MOEX shares3
Rank among the most liquid shares listed on MOEX4
as of 31 December 2019
TCS
41%
Gazprom
Lukoil
34%
Yandex
Magnit
Moscow Exchange
Alrosa
Sberbank
Mechel
MTS
38%
Safmar
X5
47%
55%
Norilsk Nickel
Sistema
85%
71%
75%
63%
53%
50%
48%
45%
41%
37%
33%
Detsky Mir
Aeroflot
Free float –62.8%
CBR11.8%
Sberbank10.0%
VEB8.4%
EBRD6.1%
MICEX Finance1
1.0%RDIF3.2%
JPMorgan Chase & Co.
5.0%
Others54.6%

Sources: Bloomberg, Moscow Exchange1 As of 30 June 2020
The established dividend story continues
12
History of dividend growth
DPS for the financial year, RUB
▪ MOEX has been paying substantial dividends since the onset of its public history
▪ Dividend policy approved in October 2019 sets 60% of net profit as the minimum payout and the target payout of 100% FCFE
▪ In 2019 MOEX paid a DPS of RUB 7.70 for 2018, which amounts to 89% of the consolidated IFRS net profit for the year
▪ In 2020 a DPS of RUB 7.93 for 2019, which amounts to
89% of the consolidated IFRS net profit for the year, was approved by the AGM
Dividend yields of MOEX and exchange peers, 2020E1
%
Comments
22% CAGR of DPS ’13-19
ХХ% Payout ratio
201720162011
2.38
20092008 201520122010 20142013
1.22
5.47
2.49
2018
7.96
0.16
2019
0.14 0.16 0.31
3.87
7.117.68 7.70 7.93
35%
MOEX IPO
47%
55%
58%69%
89%
Interim dividend
89%
Euro
next
NASD
AQ
OM
X
MO
EX
B3
Wars
aw
SE
JSE
CM
E
HKEX
Dubai Fin
.M
ark
et
LS
E
7.9
5.95.5
3.73.1
2.42.42.21.6
0.9
89%
2020 Dividend: explaining the new formula
RUB bln
CAPEX 2019
20.2
IFRSNI 2019
FCFE before
M&A, DWCD&A2019
3.4 1.8
21.8
DWC 2020(regulatory)
1.4
2020 M&A outlay
2.3
18.1
Div2019
Recommended dividends

13
1Q 2020 update5
Financial track record4
Corporate governance and dividends
1 Business overview
Market position and competitive strategy
2

Exchange CountryAsset classes Trade and post-trade services
Equity Bonds Derivatives FXCommodities
Trading Clearing DepositoryMarket
Data
CME USA × × √ × × √ √ × √
HKEx Hong Kong √ √ √ × × √ √ √ √
Deutsche Boerse Germany √ √ √ × × √ √ √ √
ICE - NYSE USA √ √ √ × × √ √ × √
B3 Brazil √ √ √ √ √ √ √ √ √
LSE UK √ √ √ × × √ √ × √
ASX Australia √ √ √ × × √ √ √ √
SGX Singapore √ √ √ × × √ √ √ √
Japan Exchange Japan √ √ √ × × √ √ × √
NASDAQ OMX USA √ √ √ × × √ √ × √
MOEX Russia √ √ √ √ √ √ √ √ √
CBOE USA × × √ × × √ × × √
BME Spain √ √ √ × × √ √ √ √
TMX Canada √ √ √ × √ √ √ √ √
BMV Mexico √ √ √ × × √ √ √ √
Bursa Malaysia Malaysia √ √ √ × × √ √ √ √
JSE South Africa √ √ √ × × √ √ × √
WSE Poland √ √ √ × √ √ √ √ √
MOEX product offering vs other exchanges
14Source: exchanges’ websites

Leading positions in a global context in 6M2020
Among top 25 exchanges by equity trading volumes globally3
Rank Exchange CountryMkt Cap
(USD bln)Securities
listedTrading vol.(USD bln)
1 Nasdaq - US USA 14,646 3,156 12,163
2 CBOE USA na na 10,204
3 Shenzhen SE China 3,917 2,249 7,652
4 Shanghai SE China 4,902 1,627 4,131
5 Japan Exchange Japan 5,664 3,714 3,113
6 Korea Exchange Korea 1,409 2,283 1,850
7 HKEx Hong Kong 4,890 2,487 1,369
8 LSE Group UK 3,230 2,355 1,172
9 Euronext EU 4,083 1,460 1,133
… … … … … …
23 Moscow Exchange Russia 637 215 170
2rd largest exchange in fixed income1
Rank Exchange CountryTrading vol.(USD bln)
Incl.REPOs
1 BME Spain 2,256 √
2 Moscow Exchange Russia 1,684 √
3 Johannesburg SE S. Africa 1,102 √
4 Korea Exchange Korea 870 ×
5 Shanghai SE China 534 ×
6 Shenzhen SE China 474 ×
7 Tel-Aviv SE Israel 157 ×
8 LSE Group UK 131 ×
9 Taipei Exchange Taiwan 128 √
10 Santiago SE Chile 118 √
6th largest exchange in derivatives2
Rank Exchange CountryContracts traded
(mln)
1 NSE India India 3,733
2 CME Group USA 2,783
3 B3 Brazil 2,292
4 CBOE USA 1,292
5 Nasdaq - US USA 1,181
6 Moscow Exchange Russia 1,103
7 Korea Exchange Korea 1,077
8 Deutsche Boerse Germany 1,055
9 Shanghai Fut. Exchange China 913
10Dalian Commodity
ExchangeChina 765
14th largest publicly listed exchange by Mkt Cap4
Rank Exchange CountryMkt Cap
(USD bln)
1 CME USA 58.3
2 HKEx Hong Kong 54.0
3 ICE&NYSE USA 50.1
4 LSE Group UK 36.4
5 Deutsche Boerse Germany 34.5
6 B3 Brazil 20.8
7 Nasdaq OMX USA 19.6
8 Japan Exchange Japan 12.4
9 ASX Australia 11.4
10 CBOE USA 10.2
11 Euronext EU 7.0
12 SGX Singapore 6.4
13 TMX Group Canada 5.6
14 Moscow Exchange Russia 3.6
Sources: Moscow Exchange, WFE as of 09 July 2020, Bloomberg, LSE Group1. Due to different methodologies applied, data on fixed income trading may not be directly comparable among exchanges. Data for 6M2020, except BME and
Shanghai Stock Exchange (5M2020)2. Data for 6M2020, except B3 and Dalian Commodity Exchange (5M2020)3. Top equity trading exchanges are ranked by EOB trading volume. Data for 6M2020, except Shanghai SE and Euronext (5M2020)4. Market capitalization of public exchanges based on Bloomberg data as of 30 June 2020
15
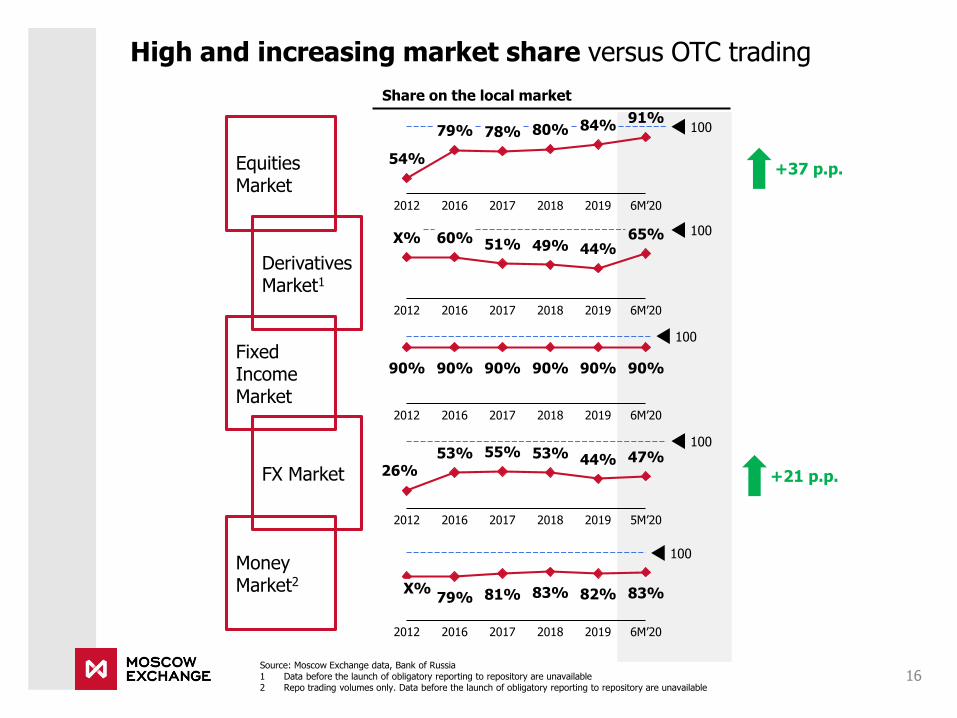
High and increasing market share versus OTC trading
Source: Moscow Exchange data, Bank of Russia1 Data before the launch of obligatory reporting to repository are unavailable2 Repo trading volumes only. Data before the launch of obligatory reporting to repository are unavailable
Share on the local market
Equities Market
DerivativesMarket1
Fixed Income Market
FX Market
MoneyMarket2
54%
78%
2012
79%
2016
80%
2017 2018
84%
2019
91%
6M’20
100
+37 p.p.
2012 6M’20
X%44%
2018
49%
2017
60%
2016
51%
2019
65% 100
2012 2016
90% 90%90% 90%
2017 2018
90%
2019
90%
6M’20
100
53%26%
2012
53%
2016
55%
20182017
44%
2019 5М’20
47%100
+21 p.p.
16
81%
2016
X%
2012
79%
2017
83%
2018
82%
2019
83%
6M’20
100

Strategy 2024: mission, areas of responsibility and areas of development
17
Mission
We bring trust, efficiency and
innovation to the financial markets,
helping companies and citizens
achieve tomorrow's goals
1 mission
2areas of responsibility
3 areas of development
Core Markets
Penetration
Financial
Platform
Market
Gateway
Balance Sheet Management
Culture of Trust
and Responsibility
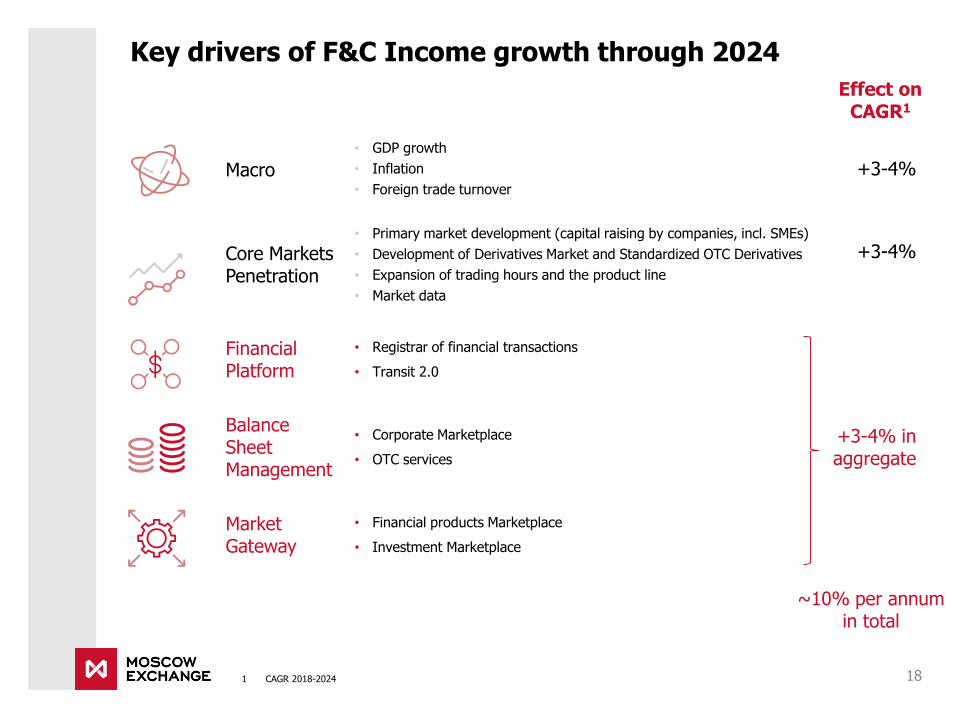
Key drivers of F&C Income growth through 2024
18
Macro
• GDP growth
• Inflation
• Foreign trade turnover
+3-4%
Core Markets Penetration
• Primary market development (capital raising by companies, incl. SMEs)
• Development of Derivatives Market and Standardized OTC Derivatives
• Expansion of trading hours and the product line
• Market data
+3-4%
Financial Platform
• Registrar of financial transactions
• Transit 2.0
+3-4% in aggregate
BalanceSheet Management
• Corporate Marketplace
• OTС services
Market Gateway
• Financial products Marketplace
• Investment Marketplace
Effect on CAGR1
~10% per annumin total
1 CAGR 2018-2024
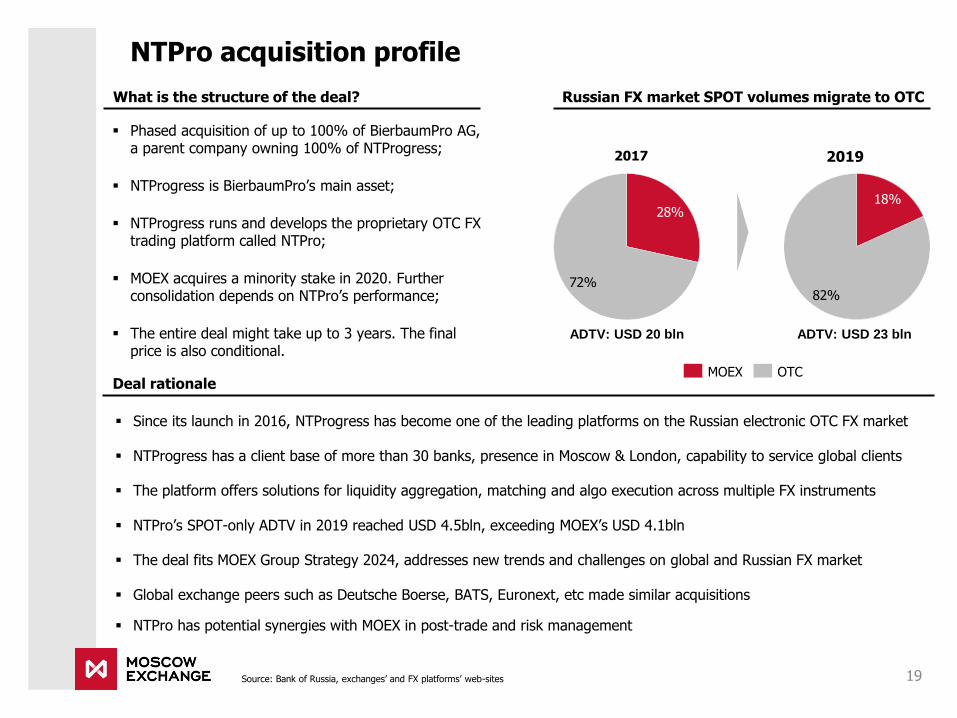
NTPro acquisition profile
19Source: Bank of Russia, exchanges’ and FX platforms’ web-sites
28%
72%
Russian FX market SPOT volumes migrate to OTC
2017 2019
ADTV: USD 20 bln ADTV: USD 23 bln
Deal rationale
What is the structure of the deal?
▪ Since its launch in 2016, NTProgress has become one of the leading platforms on the Russian electronic OTC FX market
▪ NTProgress has a client base of more than 30 banks, presence in Moscow & London, capability to service global clients
▪ The platform offers solutions for liquidity aggregation, matching and algo execution across multiple FX instruments
▪ NTPro’s SPOT-only ADTV in 2019 reached USD 4.5bln, exceeding MOEX’s USD 4.1bln
▪ The deal fits MOEX Group Strategy 2024, addresses new trends and challenges on global and Russian FX market
▪ Global exchange peers such as Deutsche Boerse, BATS, Euronext, etc made similar acquisitions
▪ NTPro has potential synergies with MOEX in post-trade and risk management
▪ Phased acquisition of up to 100% of BierbaumPro AG, a parent company owning 100% of NTProgress;
▪ NTProgress is BierbaumPro’s main asset;
▪ NTProgress runs and develops the proprietary OTC FX trading platform called NTPro;
▪ MOEX acquires a minority stake in 2020. Further consolidation depends on NTPro’s performance;
▪ The entire deal might take up to 3 years. The final price is also conditional.
MOEX OTC
18%
82%

20
Reported international funds’ holdings of Russian equities
North America%
UK%
Europe without UK%
WorldUSD bln
Source: ThomsonONE – as of period end, including DRs on Russian shares
- share in total holdings
2015 2017 1Q’18 2Q’18
85.6
4Q’18 2Q’19
75.4
4Q’192013 1Q’19
70.6
50.2
70.6 71.579.7 79.3 80.3 83.3 79.8
2Q’203Q’18
68.968.4
1Q’203Q’19
+37%
2015
41%
49%
2013
53%
20192018
54%
51%
2Q’20
20%
2Q’20
22%
21%
2013
21%
20192015 2018
19%
33%
201920152013 2018
27%
23% 24%
28%
2Q’20
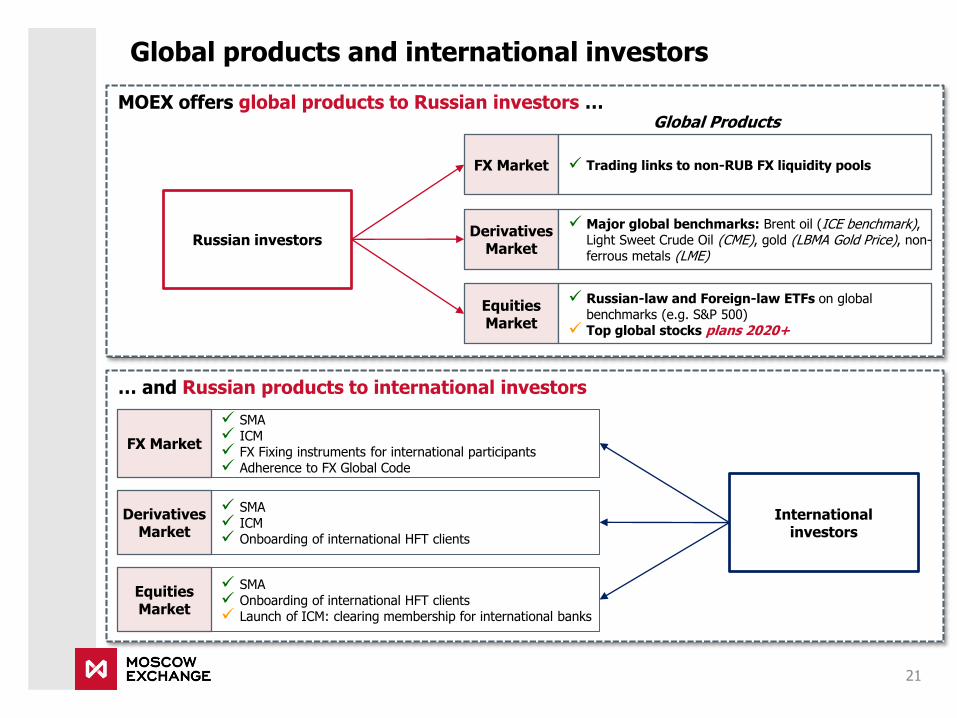
MOEX offers global products to Russian investors …
… and Russian products to international investors
Global products and international investors
21
Global Products
FX Market
Russian investorsDerivatives
Market
Equities Market
✓ Trading links to non-RUB FX liquidity pools
✓ Major global benchmarks: Brent oil (ICE benchmark), Light Sweet Crude Oil (CME), gold (LBMA Gold Price), non-ferrous metals (LME)
✓ Russian-law and Foreign-law ETFs on global benchmarks (e.g. S&P 500)
✓ Top global stocks plans 2020+
International investors
FX Market
Derivatives Market
Equities Market
✓ SMA✓ ICM✓ FX Fixing instruments for international participants✓ Adherence to FX Global Code
✓ SMA✓ Onboarding of international HFT clients✓ Launch of ICM: clearing membership for international banks
✓ SMA✓ ICM✓ Onboarding of international HFT clients

▪ Bank of Russia became a regulator of the pension system in 2013
▪ Adopted changes in non-state pension fund regulation:
➢ “One year non-loss” rule was abolished
➢ Investment horizon of NPFs was extended to 5 years
➢ Customers are now incentivized to stay with the fund for not less than 5 years
➢ Guarantee fund mechanism (similar to the Deposit Insurance Agency in the banking system)
➢ New allocations to NPFs remained under moratorium until 2019, which reduced growth potential and left room for organic growth only
Local institutional investors: the potential of pension funds
Pension assets in Russia
RUB trn
22
Key highlights of the pension reform
Non-state pension funds asset allocation dynamics1
Source: Bank of Russia1 Including NPFs Mandatory savings and NPFs Reserves
2.1
2013 201720162014 3Q 20192015
2.0
2018
1.1
4.0
5.6
1.9
2.5
5.7
0.8
1.45.3
2.1
3.8
4.8
1.8
6.0
1.1
1.9
0.9
1.7
1.0
1.31.1
1.9
1.2
2.6
1.9
2.8
+4%
+20%
+10% +6% +1%+6%
Non-state pension funds. Mandatory savings
State Pension Fund. Mandatory savings
Non-state pension funds. Reserves
69%
16% 15% 17% 20% 15% 9% 8%
37% 36%46%
51% 63% 75% 80%
47% 49%37%
29% 22% 16% 12%
201620142013 2015 2017 2018 3Q 2019
Deposits and other assets
Bonds
Equities
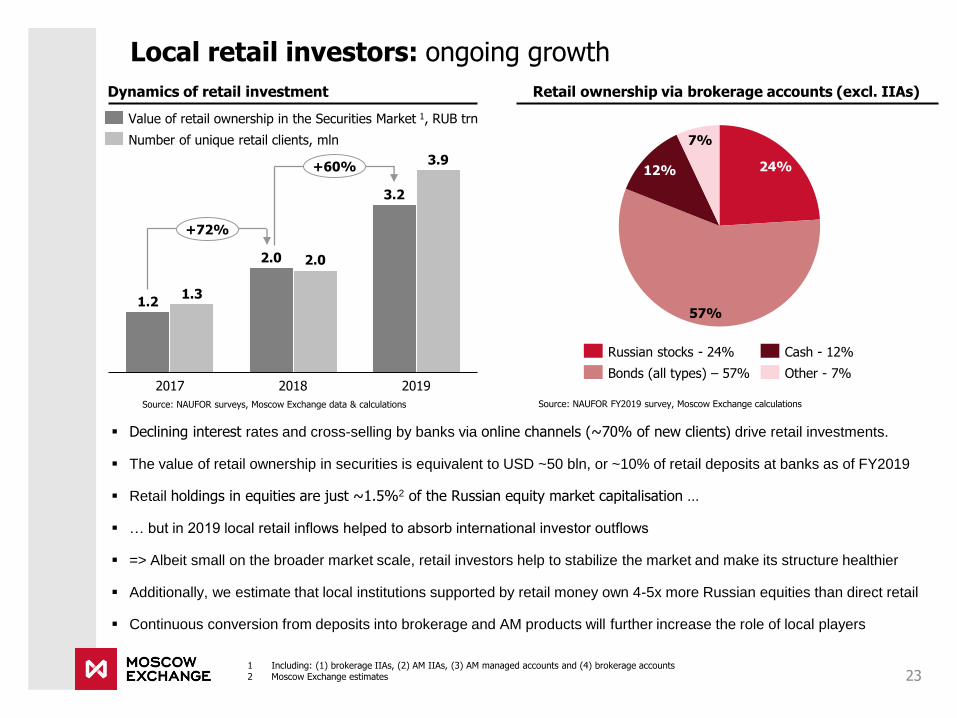
▪ Declining interest rates and cross-selling by banks via online channels (~70% of new clients) drive retail investments.
▪ The value of retail ownership in securities is equivalent to USD ~50 bln, or ~10% of retail deposits at banks as of FY2019
▪ Retail holdings in equities are just ~1.5%2 of the Russian equity market capitalisation …
▪ … but in 2019 local retail inflows helped to absorb international investor outflows
▪ => Albeit small on the broader market scale, retail investors help to stabilize the market and make its structure healthier
▪ Additionally, we estimate that local institutions supported by retail money own 4-5x more Russian equities than direct retail
▪ Continuous conversion from deposits into brokerage and AM products will further increase the role of local players
Local retail investors: ongoing growth
23
Retail ownership via brokerage accounts (excl. IIAs)
2017 2018
1.3
2019
3.2
1.2
2.0 2.0
3.9
+72%
+60%
Dynamics of retail investment
24%
57%
12%
7%
Russian stocks - 24% Cash - 12%
Other - 7%Bonds (all types) – 57%
Source: NAUFOR surveys, Moscow Exchange data & calculations Source: NAUFOR FY2019 survey, Moscow Exchange calculations
1 Including: (1) brokerage IIAs, (2) AM IIAs, (3) AM managed accounts and (4) brokerage accounts2 Moscow Exchange estimates
Value of retail ownership in the Securities Market 1, RUB trn
Number of unique retail clients, mln

Unique retail clients as % of population2
Retail money: aiming to grow the culture of investing
24
Russians hold majority of savings in banks and cash1
Sources: World Bank, Allianz, CBR, Moscow Exchange1 As of the end of 2018, Russia - 20192 Russia – 4М2020, Turkey - 2018, Indonesia, Brazil – 2019, China – as of 2019 beginning
New retail clients
thousand
Russians hold
0.4%
3.4%
China IndonesiaTurkeyRussia
1.4%
Brazil
10.6%
0.8%
RUB 31 trn with banks
RUB 6 trn in cash
…vs RUB 41 trn of the Russian equity market’s
market cap
2019 6M2020
2016
2.0
2013 201820152014 2017
5.4
0.9 0.9 1.0 1.1 1.3
3.9+7% +7%
+10%
+19%
+49%
+97%
+39%
72
2017
1 534
20142013 20182015 20192016 6M2020
59 106 147252
702
1 960
+22%
+48%
+39%
+71%
+179%
+179%
14%25%
41%33%
19% 15%
47%59%
67%32%
56%37%
41%
21% 25%
6%
28% 13%51%
16% 22% 26%
53%60%
47%
13%
8%
11%
MexicoBrazilUK GermanyUSA Italy China India Russia
Others Bank depositsSecurities CashInsurance and pensions
Number of unique retail clients
mln

2013-Jun2020:
x12.2 times
Retail clients: a growing segment of the Russian financial market
25
Dec2018
Dec2013
57,946
Dec2017
Dec2015
Dec2019
Jun2020
705,300
74,911109,538
190,235
392,163
+29%
+46%
+74%
+106%
+80%
Number of active retail client accounts
895
Dec2013
May2020
Dec2015
Dec2018
60,651
25,461
293,372
Dec2017
Dec2019
15,159
146,789
~17 times
+68%
+138%
+142%
+100%
Dec2017
Dec2013
46,285
55,476
28,068
63,931
77,585
Jun2020
Dec2019
Dec2015
Dec2018
44,860
+60%
+3%
+20%
+15%
+21%
Equities Market FX Market1Derivatives Market
Regulatory changes stimulating retail participation in financial market:
▪ Introduction of individual investment accounts for private investors since 2015
▪ Tax exemption on capital gains on securities held for 3+ years (up to RUB 9 mln for securities purchased after 1 Jan 2014)
▪ Tax breaks on coupon payment on corporate bonds (for bonds issued after 2017)
▪ Retail investors are allowed to remotely open a brokerage account. This simplifies the process for retail investors in Russia’s
far-flung regions
1 DMA clients
2013-Jun2020:
x2.8 times2013-May2020:
x328 times
Individual Investment Accounts (IIA) in detail
26
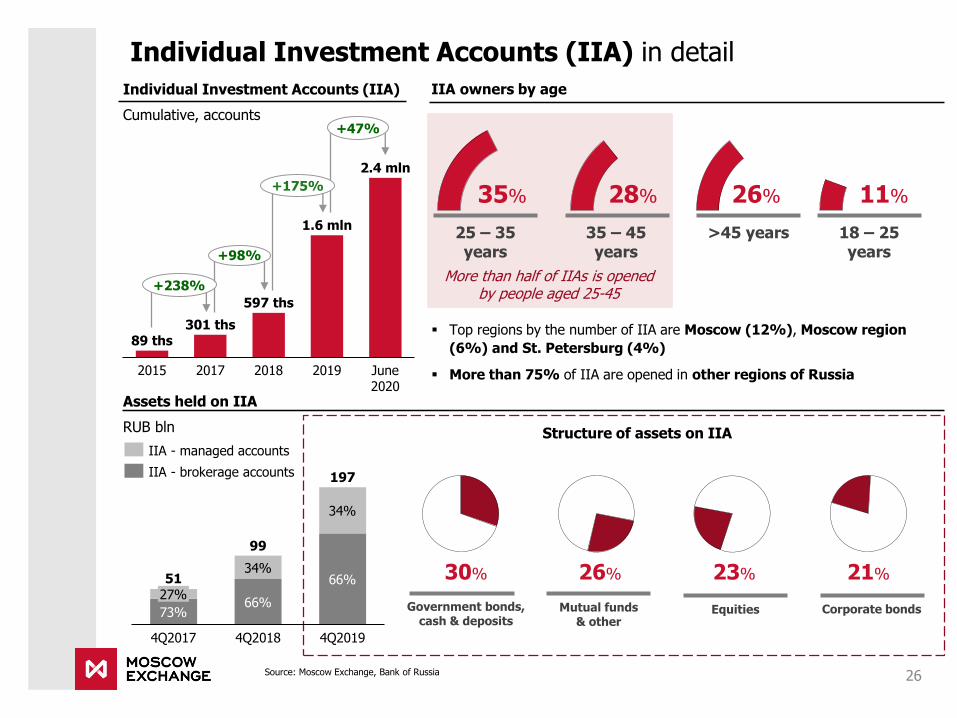
89 ths301 ths
597 ths
201920182015 2017 June 2020
2.4 mln
1.6 mln
+238%
+98%
+175%
+47%
Individual Investment Accounts (IIA)
Cumulative, accounts
▪ Top regions by the number of IIA are Moscow (12%), Moscow region
(6%) and St. Petersburg (4%)
▪ More than 75% of IIA are opened in other regions of Russia
IIA owners by age
Assets held on IIA
RUB bln
197
34%
34%
4Q2017
27%
73%
51
66%
66%
4Q2018 4Q2019
99
IIA - managed accounts
IIA - brokerage accounts
Structure of assets on IIA
Source: Moscow Exchange, Bank of Russia
25 – 35 years
35% 28%
35 – 45 years
26%
>45 years
11%
18 – 25 years
More than half of IIAs is opened by people aged 25-45
23% 21%30% 26%
Equities Corporate bondsGovernment bonds,cash & deposits
Mutual funds& other

MOEX Marketplace: the blueprint
27
THE CONCEPT:
▪ Retail deposits (RUB 31 trn) is the single largest asset pool that might drive growth of on-exchange products
▪ It lacks a fast, convenient interface for retail deposit management across banks - an area MOEX can digitalize
▪ MOEX will expand its core expertise to standardize and unify the market of retail deposits, making it truly online
MOEX HAS:
▪ Market neutrality & trust: no room for conflicts of interest since MOEX does not originate loans or deposits
▪ Essential infrastructure: NSD is the centerpiece, managing the financial transactions registrar (FTR)
▪ Tech expertise: IT development; 25+ years of interaction with banks via API in securities & FX trading etc.
MOEX GETS:
▪ A new source of fee income: long-term revenue potential can be measured on a scale of RUB billions
▪ Business development: cross-selling to a new audience, many times larger that the existing set of active clients
▪ Market intelligence & behavioral data: obtaining a complete financial profile of a wide retail client base
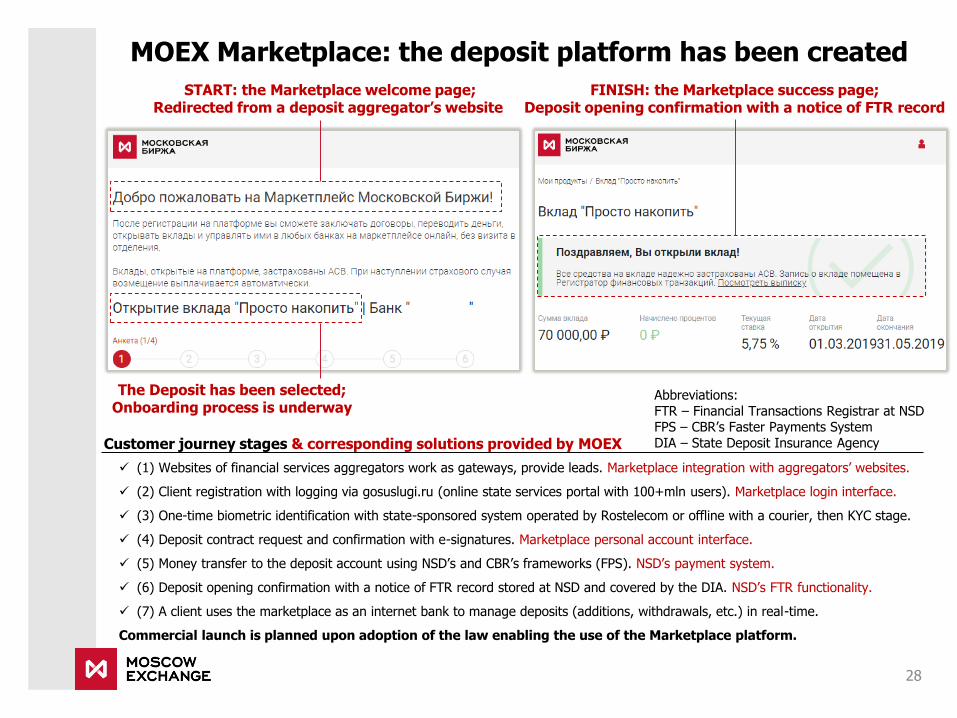
MOEX Marketplace: the deposit platform has been created
28
Customer journey stages & corresponding solutions provided by MOEX
✓ (1) Websites of financial services aggregators work as gateways, provide leads. Marketplace integration with aggregators’ websites.
✓ (2) Client registration with logging via gosuslugi.ru (online state services portal with 100+mln users). Marketplace login interface.
✓ (3) One-time biometric identification with state-sponsored system operated by Rostelecom or offline with a courier, then KYC stage.
✓ (4) Deposit contract request and confirmation with e-signatures. Marketplace personal account interface.
✓ (5) Money transfer to the deposit account using NSD’s and CBR’s frameworks (FPS). NSD’s payment system.
✓ (6) Deposit opening confirmation with a notice of FTR record stored at NSD and covered by the DIA. NSD’s FTR functionality.
✓ (7) A client uses the marketplace as an internet bank to manage deposits (additions, withdrawals, etc.) in real-time.
Commercial launch is planned upon adoption of the law enabling the use of the Marketplace platform.
START: the Marketplace welcome page;Redirected from a deposit aggregator’s website
The Deposit has been selected;Onboarding process is underway
FINISH: the Marketplace success page;Deposit opening confirmation with a notice of FTR record
Abbreviations:FTR – Financial Transactions Registrar at NSDFPS – CBR’s Faster Payments SystemDIA – State Deposit Insurance Agency

15%13%13%
12% 12%14%
17%18%
22%
20%22%
Bond market – why we are strong believers
29Sources: Bank of Russia, Cbonds, Rosstat, Moscow Exchange 1 Including banks and financial institutions
Local bonds vs Eurobonds of Russian corporates1
RUB trn
Growth of outstanding local bonds
RUB trn
51%
16.0
7.1
48%
52%
17.7
2018
53%
48%47%
20192009
42%
2010
49%
20132011
52%
2012
45%
2014
53%
40%47%
58%
56%
44%
2015
55%
20.0
2016
19.5
60%
5.4
2017
61%
39%
11.168%
32%
6.2
8.7
18.219.1
RUB bonds
Eurobonds
6.2
0.7
3.10.4 2.9
0.6
2.5
2.2
2009
4.7
3.0
13.6
2010
8.1
0.311.4
3.6
2011
0.4
3.5
4.3
2012
0.5
0.7
3.9
5.3
20162013
0.5
6.6
2014
19.4
0.6
5.0
11.8
2015
5.5
9.2
13.6
0.7
0.4
9.7
7.0
11.9
2017
7.9
8.1
7.2
9.3
2019
5.0
17.7
20.5
23.7
2018
Regional Government Corporate
Share of GDP
71%
21%19%
81%
20122009 2019
79%
27%
73%
2015
29%
2018
70%
30%
29.2
41.3
67.6 68.0 67.5Loans (incl. foreign debt)
Corporate bonds(incl. eurobonds)
RUB trn
Corporate loans vs corporate bonds in Russia Bond primary market trading volume
RUB trn
2015
1.6
2009 2012
5.9
2.6
2018 2019
2.1
3.5
7.0
8.6
5.46.1
CBR bonds
Overnight bonds
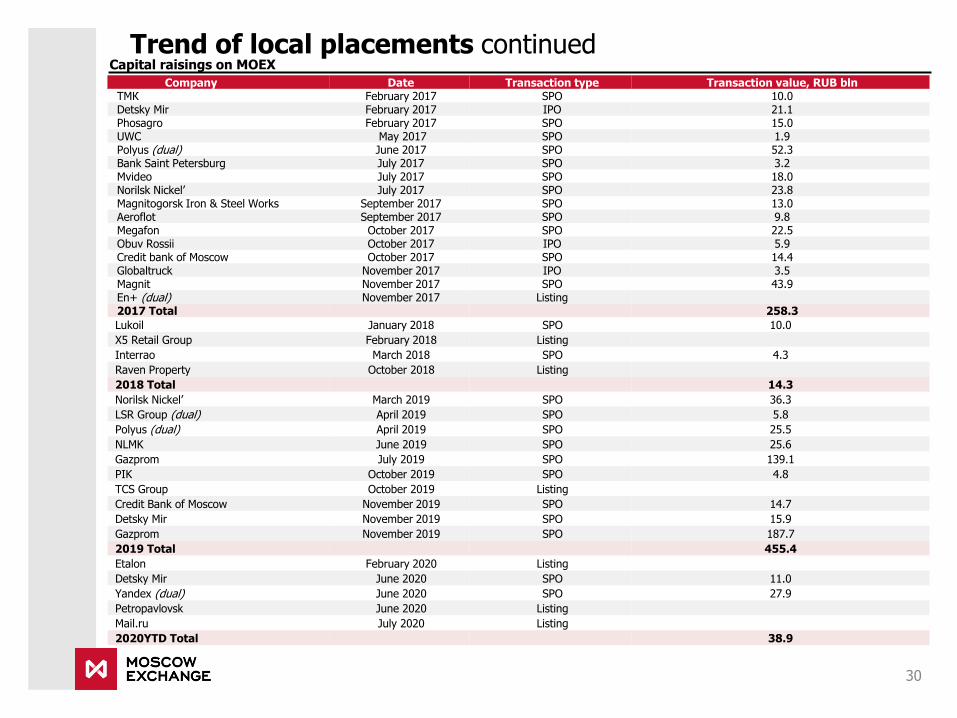
Trend of local placements continued
30
Capital raisings on MOEX
Company Date Transaction type Transaction value, RUB blnТМК February 2017 SPO 10.0Detsky Mir February 2017 IPO 21.1Phosagro February 2017 SPO 15.0UWC May 2017 SPO 1.9Polyus (dual) June 2017 SPO 52.3Bank Saint Petersburg July 2017 SPO 3.2Mvideo July 2017 SPO 18.0Norilsk Nickel’ July 2017 SPO 23.8Magnitogorsk Iron & Steel Works September 2017 SPO 13.0Aeroflot September 2017 SPO 9.8Megafon October 2017 SPO 22.5Obuv Rossii October 2017 IPO 5.9Credit bank of Moscow October 2017 SPO 14.4Globaltruck November 2017 IPO 3.5Magnit November 2017 SPO 43.9En+ (dual) November 2017 Listing2017 Total 258.3
Lukoil January 2018 SPO 10.0
X5 Retail Group February 2018 Listing
Interrao March 2018 SPO 4.3
Raven Property October 2018 Listing
2018 Total 14.3
Norilsk Nickel’ March 2019 SPO 36.3
LSR Group (dual) April 2019 SPO 5.8
Polyus (dual) April 2019 SPO 25.5
NLMK June 2019 SPO 25.6
Gazprom July 2019 SPO 139.1
PIK October 2019 SPO 4.8
TCS Group October 2019 Listing
Credit Bank of Moscow November 2019 SPO 14.7
Detsky Mir November 2019 SPO 15.9
Gazprom November 2019 SPO 187.7
2019 Total 455.4
Etalon February 2020 Listing
Detsky Mir June 2020 SPO 11.0
Yandex (dual) June 2020 SPO 27.9
Petropavlovsk June 2020 Listing
Mail.ru July 2020 Listing
2020YTD Total 38.9

6%
13%
23% 20%
32%
MOEX listings of Russian companies incorporated abroad
31
Polymetal
ADTV, USD mln
Yandex
ADTV, USD mln
X5 Retail Group
ADTV, USD mln
TCS Group
ADTV, USD mln
MOEX
LSE
10,4
20172016
9,2 10,00,6
1,43,2
2018
15,0
3,8
2019
29,9
13,8
1H2020
30% 36%50%
3,6
2016
5,8
20182017
9,7
12,3
6,6
5,3
2019
9,3
9,5
1H2020
Source: Bloomberg as of 02.07.2020 for LSE on-book and Nasdaq volumes, Moscow Exchange
40%47%
0,4
2016 2017
1,1
2,32,2
2018
1,6
2019
6,9
6,1
1H2020
2% 4%
12%19%
2%
LSE
MOEX
Nasdaq
MOEX
126,4
1,0 5,344,8
2016
71,8
2017
1,6
2018
91,7
13,0
2019
116,8
28,0
1H2020
LSE
MOEX
▪ 13 Russian companies incorporated abroad have obtained a secondary listing on Moscow Exchange
▪ Listing on MOEX has substantially increased their total liquidity; MOEX share in trading volumes is growing
▪ Shares of Polymetal and Yandex & depositary receipts of X5 Retail Group and TCS Group are included in the MOEX Russia Index
▪ Polymetal shares & depositary receipts of X5 Retail Group are included in the MSCI Russia Index
MOEX share in Average Daily Trading Volumes (ADTV)

Corporates on the FX and Money Markets
32Source: Moscow Exchange
Direct access to the FX Market
▪ corporates43
ADTV,RUB bln
Deposits with the CCP for corporates
▪ corporates127
ADTV,RUB bln
2017since
launch2018 2019 6М 2020
1.3
2.0
4.2
5.4
+59%
+108%
+29%
73.7
76.6
22.227.5
2017since
launch
108.0
2019
137.6
2018
76.8
175.9
6M 2020
4.1
49.7
184.6
214.5
253.6
0.1
+3.7x
+16%
+18%
GCC (REPO - Deposits)
GCC (REPO - REPO)
GCC (REPO - Deposits of the FederalTreasury)
Key features
Unified sales channel
Wide range of treasury products
Unbundled trading, clearing and settlement services
Share of corporatesas % of all MOEX’s clients
25%
Share of depositsin total volume of GCC REPO
29%
Launched in 2017
Launched in 2017

Daily updated curve since launch on 18 April 2019
Based on the most liquid segment of the Russian money market – GCC repo
Five available terms: ON, 1W, 2W, 1M and 3M
Serves as underlying for overnight index swaps (OIS) and futures
200+ market participants; 20 market makers
4.40
4.30
4.35
4.50
4.60
4.25
4.45
4.55
4.20
4.65
ON
4.25%
4.40%
1W
4.42%
2W
4.46%
1M
4.48%
3M
Russian Secured Funding Average Rate curve
as of 6 July 2020
▪ Launch of futures and overnight index swaps on RUSFAR
▪ USD-denominated RUSFAR becomes the first “clean”
benchmark for the cost of secured USD lending in Russia,
i.e. unaffected by collateral type
▪ Complete and fully-functioning set of 20 market makers
▪ April 2020 – Launch of RUSFAR real-time, calculated
every 15 minutes from 10:00 to 12:30 everyday
RUSFAR – update on the new benchmark’s development
33
Progress in 2Q’19 and beyond Trading volumes of RUSFAR-linked contracts
▪0.5RUB bln
RUSFAR overnight index swapstrading volumes since 13 May 2019
▪960 RUB mln
RUSFAR futurestrading volumes since 21 May 2019
Data on the number of participants and volumes of transactions are as of Apr’20

MOEX OTC platforms and solutions
34
OTC bond platform
2200+ bonds (locals and Eurobonds)Integration with NSD/NCC
79 participants
Plans: external reference prices, access for corporates, addition of stocks, DRs and REPO
RFS (Request for Stream) Quotation System on derivatives market
All instruments on derivatives market
Trading in large lots in anonymous mode
Plans: 50+ largest participants
Standardized OTC derivatives market
FX swaps, FX forwards, interest rate swaps, cross currency swaps, overnight indexed swaps, flex-options
51 participants
Participants have started to trade longer maturities
Plans: search for liquidity system, IRS (KetRate), OIS (Implied rate); maturity up 10 years (now up to 5)
Data on the number of participants and volumes of transactions are as of Mar’19
FX links to global liquidity pools
Non-RUB FX pairs: EUR/USD, GBP/USD
58 participants, 3 liquidity providers
>7000 transactions with a total value ofUSD 3500 mln
Plans: swaps, gold, oil, new liquidity providers
Completed
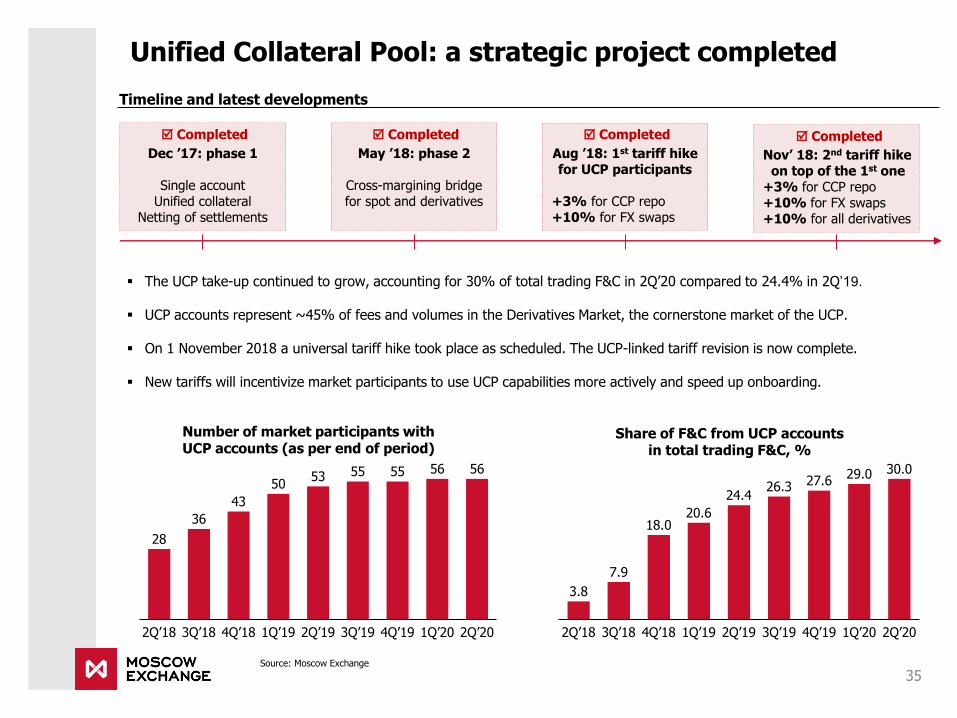
Unified Collateral Pool: a strategic project completed
35
Timeline and latest developments
▪ The UCP take-up continued to grow, accounting for 30% of total trading F&C in 2Q’20 compared to 24.4% in 2Q’19.
▪ UCP accounts represent ~45% of fees and volumes in the Derivatives Market, the cornerstone market of the UCP.
▪ On 1 November 2018 a universal tariff hike took place as scheduled. The UCP-linked tariff revision is now complete.
▪ New tariffs will incentivize market participants to use UCP capabilities more actively and speed up onboarding.
Dec ’17: phase 1
Single accountUnified collateral
Netting of settlements
May ’18: phase 2
Cross-margining bridgefor spot and derivatives
Aug ’18: 1st tariff hikefor UCP participants
+3% for CCP repo+10% for FX swaps
Nov’ 18: 2nd tariff hikeon top of the 1st one
+3% for CCP repo+10% for FX swaps+10% for all derivatives
Completed Completed Completed
24.4
1Q’202Q’18
18.0
3Q’18
20.6
4Q’18 1Q’19 2Q’19 4Q’193Q’19
3.8
30.0
7.9
26.3 27.629.0
2Q’20
28
36
43
5053 55 55 56 56
1Q’193Q’182Q’18 1Q’204Q’18 4Q’192Q’19 3Q’19 2Q’20
Share of F&C from UCP accounts in total trading F&C, %
Number of market participants with UCP accounts (as per end of period)
Source: Moscow Exchange
36
1Q 2020 update5
Financial track record
3
Corporate governance and dividends
1 Business overview
Market position and competitive strategy
2

5.7 8.0 9.411.2 11.1
16.921.5
24.6 30.446.0
43.6 38.5 39.943.2
2006 2007 2008 2009 2010 2011 2012 2013 2014 2015 2016 2017 2018 20190%
50%
100%
150%
200%
250%
300%
350%
MOEX business model continues to deliver
37
Operating income1
RUB blnR
ebase
d t
o 1
00%
MICEX Index, %MICEX Index, %
According to Moscow Exchange Consolidated Financial Statements for the relevant period1 RTS data is consolidated from 29 June 20112 IT Services and Other fee income includes Information services, Sale of software and technical services and Other fee income
Unique business model allows MOEX to increase operating income regardless of the stage of the economic cycle:
▪ Business lines are diversified, while markets have limited growth correlation
▪ Growth drivers differ across markets and products
Key highlights
CAGR of ~17% in 2006-2019
Fee & commission income evolution1
Listing: 3%Bonds: 10%Equities: 9%
Derivatives
FX
Money Market
Depository and Settlement
IT Services + Other fee income
42%27% 23% 20% 18% 18% 19% 19% 21%
8%
11% 12%11% 8% 10% 9% 10% 11%
10%18% 20%
21%22% 24% 27% 27% 27%
16% 18% 19% 22% 24% 22% 18% 17% 14%
18% 17% 18% 20% 19% 18% 20% 19% 20%
10% 8% 8% 8% 7% 8% 8%
2016
6%
2018
6%
20142011 2012 2013 2015 2017 2019
FXEquities, Bonds, Listing
Derivatives Depository and Settlement
IT Services and Other fee income2Money Market

27.4%18.8%
21.4% 17.1%16.8% 17.5%
EBITDA and EBITDA margin
RUB bln
38
2019 summary of financials
Operating income
RUB bln
Net income
RUB bln
54%
39%
61%
2014
47%
55%53%
2015
46%
2016
45%
2017
40%
60%
2018
39%
39.9
61%
2019
30.4
46.043.6
38.543.2
+7%+8%
Fee and commission income1
Interest and finance income2
20182015 20192014 2016 2017
20.31.9
22.120.827.9
1.016.0
25.2
+7%
+7%
Source: Moscow Exchange1 Includes Other operating income2 Includes Interest and other finance income, Interest expense, Net gain on financial assets AFS/FVTOCI and Foreign exchange gains less losses3 Remaining administrative expenses are calculated as General and administrative expenses less Depreciation of property and equipment, Amortisation of
intangible assets and Equipment and intangible assets maintenance4 Adjustments are related to 1) IFRS 9 movement in allowance for ECLs and 2) one-off provisions in FY 2018 and FY 20195 Adjustments are related to 1) IFRS 9 movement in allowance for ECLs, 2) change in amortization schedules and 3) one-off provisions in FY 2018 and FY
2019
Operating expenses (excluding provisions)
RUB bln
Adjusted ROE
28.1%34.1% 24.5%34.9% 35.7%36.2%
20162015
2.41.0
2014 20192017 2018
33.628.1
21.6
36.528.7 31.1
+8%+9%
Remaining administrative expenses3 D&A and IT maintenance
Personnel expenses
6.2
2014
5.4
2.1
2019
3.0
2.5
2015
3.1
5.9
15.4
3.3
2016
12.33.2
4.1
2017
3.4
6.55.8
4.5
3.4
7.1
4.9
2018
2.9
10.4
14.511.3
13.4
+8%+7%
Cost-to-income ratio
79.4%71.1% 77.1% 72.8% 71.9%
72.0%
Adjusted EBITDA margin
X% CAGR ’14-19
Adjustments4
Reported EBITDA
Adjustments5
Reported net income

Fee and commission income (F&C)
RUB bln
Cost (excl. D&A & provisions) to F&C ratio
Fee & commission income: strong and sustainable growth
39
20182016
19.8
2015 2017 2019
26.2
21.2
17.8
23.6
+10.2% +10.7%
X% CAGR ’15-19
2015 2016 2017 2018 2019
45.4%
47.0%
53.3%
50.3% 49.4%
F&C income for 2019 increased 10.7% YoY F&C growth was delivered in a cost efficient way
Source: Moscow Exchange
40
Interest and finance income
Interest and finance income1
RUB bln
Source: NFEA, Bloomberg, Moscow Exchange operational information and Consolidated Financial Statements1 Includes Interest and other finance income, Interest expense, Net gain on financial assets AFS/FVTOCI and Foreign exchange gains less losses2 Average daily rate for the period3 Based on average daily investment portfolio sources for the period according to management accounts
Client funds by currency Investment portfolio by type of asset
Investment portfolio sources3
RUB bln
95%
7%
93%
2014
92%
5%
2015
8%
2016
11%
2017
89%
12%
88%
2018
11%670
89%
2019
700
1,149
905
749 765
+1.8%
+14.2%
Client fundsMOEX’s own funds
14.3
2018 201920162014 2015 2017
17.3
23.728.1
16.1 16.7
+3.2%
+4.1%
10.78.8
2.0
0.1 0.4
13.0
2.4
1.00.1
2.6
9.2
2.3
7.4
1.8
2.4
7.4
2.1
2.2
Effective yield, %Mosprime2, % Libor2, %
X% CAGR ’14-19
4%
62%
23%
12%Other
EUR
USD
RUB
2019
6%
68%
11%
14%
2%
REPO
FX depositsand curr. accounts
FX securities
RUB deposits and curr.accounts
RUB securities
2019
CAPEX and OPEX: 2019-2020
41Source: Moscow Exchange, gks.ru
Capital expenditures
RUB bln
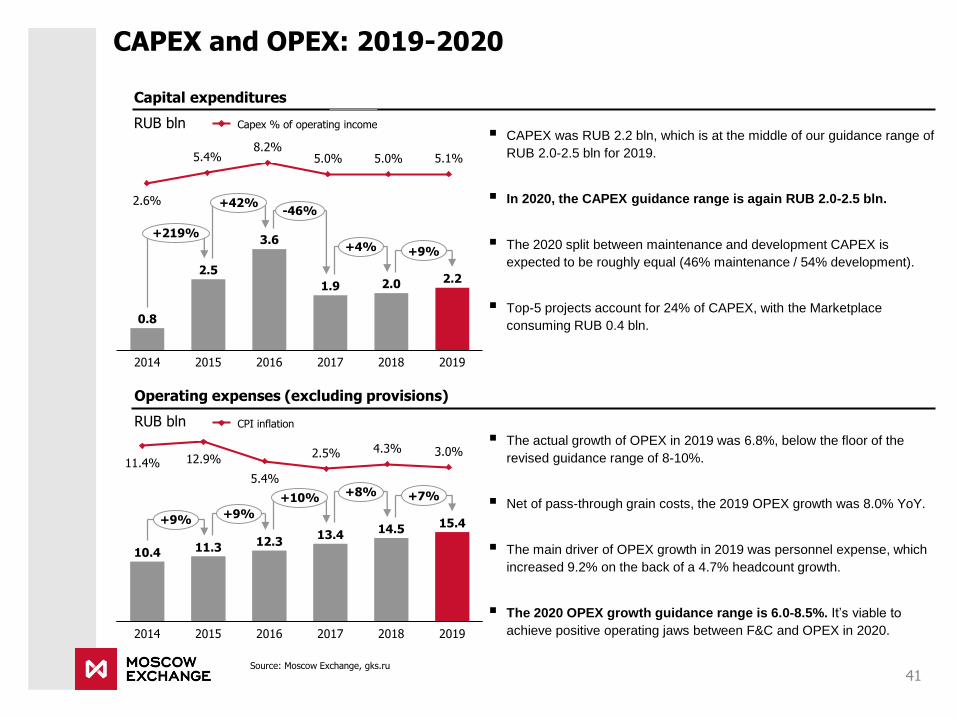
▪ The actual growth of OPEX in 2019 was 6.8%, below the floor of the
revised guidance range of 8-10%.
▪ Net of pass-through grain costs, the 2019 OPEX growth was 8.0% YoY.
▪ The main driver of OPEX growth in 2019 was personnel expense, which
increased 9.2% on the back of a 4.7% headcount growth.
▪ The 2020 OPEX growth guidance range is 6.0-8.5%. It’s viable to
achieve positive operating jaws between F&C and OPEX in 2020.
Operating expenses (excluding provisions)
RUB bln
▪ CAPEX was RUB 2.2 bln, which is at the middle of our guidance range of
RUB 2.0-2.5 bln for 2019.
▪ In 2020, the CAPEX guidance range is again RUB 2.0-2.5 bln.
▪ The 2020 split between maintenance and development CAPEX is
expected to be roughly equal (46% maintenance / 54% development).
▪ Top-5 projects account for 24% of CAPEX, with the Marketplace
consuming RUB 0.4 bln.
2014 20162015 2017
1.9
2018 2019
0.8
2.5
3.6
2.0 2.2
+219%
+42%-46%
+4% +9%
2.6%
5.4% 5.0%8.2%
5.0% 5.1%
Capex % of operating income
2.5%
5.4%
11.4% 12.9%4.3% 3.0%
CPI inflation
12.3
2018 20192014 20162015 2017
15.414.5
10.4 11.313.4
+9%+9%
+10% +8% +7%

42
1Q 2020 update
4 Financial track record
3
Corporate governance and dividends
1 Business overview
Market position and competitive strategy
2

19.8%
15.8%18.7% 18.1% 17.7%
EBITDA and EBITDA margin
RUB bln
43
1Q 2020 summary of financials
Operating income1
RUB bln
Net income
RUB bln
41%
1Q 2019
38%
2Q 2019
62% 59%
40%
60%
3Q 2019
67%
36%
12.0
4Q 2019
64%
10.3 10.711.1
1Q 2020
11.2
33%
+16.6% +7.2%
Fee and commission income
Interest and finance income
1.90.1
-0.1
1Q 2019 3Q 20192Q 2019
-0.1
4Q 2019
0.75.05.55.8 5.7
1Q 2020
6.6
+30.9% +15.8%
Source: Moscow Exchange1 Includes Other operating income, Interest and other finance income, Interest expense, Net gain on financial assets FVTOCI and Foreign exchange gains less losses
2 Includes Remaining administrative expenses are calculated as General and administrative expenses less D&A and Equipment and intangible assets maintenance3 Adjustments are related to 1) IFRS 9 movement in allowance for ECLs and 2) one-off provisions’ accrual/release
Operating expenses (excl. other operating expenses)
RUB bln
Adjusted ROE
30.7%
35.4%36.3% 34.9% 36.2%
73.1%
2.4
70.0%
1Q 2019
-0.1
2Q 2019
72.5%
7.70.1
3Q 2019
72.2%
9.1
-0.1
4Q 2019
7.28.1 8.1
1Q 2020
0.9
76.0%
+26.5% +12.8%
Remaining administrative expenses2
Personnel expenses
D&A and IT maintenance
3.9
1.8
0.8
1.2
4.0
1Q 2019
0.8 1.0
1.8
1.2
2Q 2019
0.8
1.8
1.2
3Q 2019
1.8
1.3
4Q 2019
3.73.83.7
1Q 2020
1.2
1.8
0.7
-1.6% -9.2%
Cost-to-income ratio
Reported EBITDA = PBT + D&A
Adjusted EBITDA margin
Adjustments3
Adjustments3
Reported net income
7%
29%
11%
9%
14%
11%
6.12
19%
1Q 2019
8%
11%
14%
1Q 2020
14%
14%
18%
22%
7.91
+29.3%
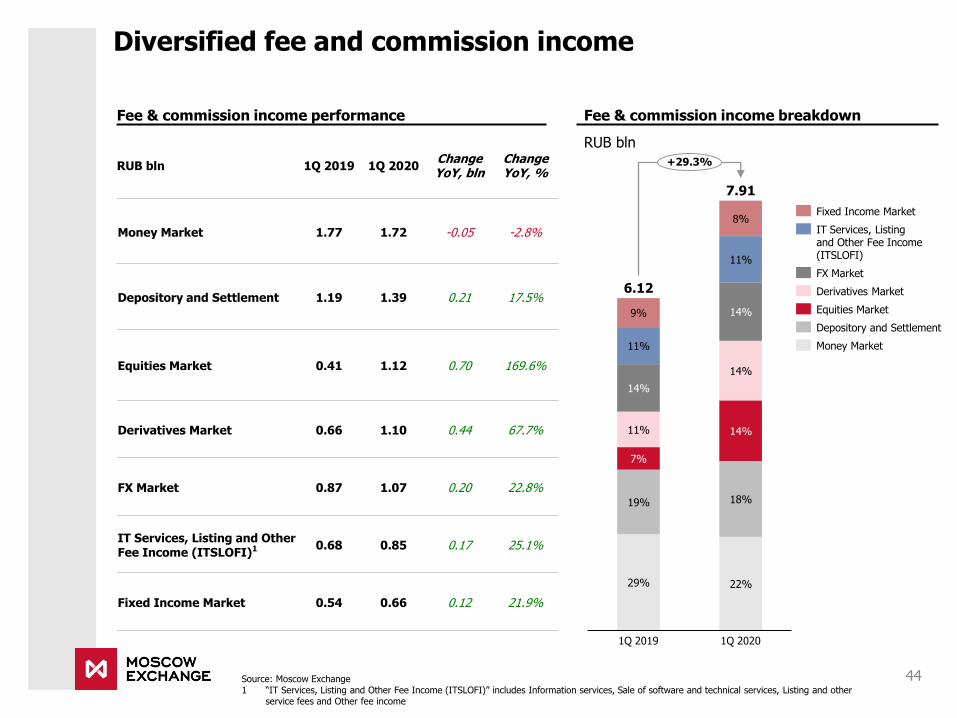
Diversified fee and commission income
44Source: Moscow Exchange1 “IT Services, Listing and Other Fee Income (ITSLOFI)” includes Information services, Sale of software and technical services, Listing and other
service fees and Other fee income
Fee & commission income performance Fee & commission income breakdown
RUB bln
RUB bln 1Q 2019 1Q 2020ChangeYoY, bln
ChangeYoY, %
Money Market 1.77 1.72 -0.05 -2.8%
Depository and Settlement 1.19 1.39 0.21 17.5%
Equities Market 0.41 1.12 0.70 169.6%
Derivatives Market 0.66 1.10 0.44 67.7%
FX Market 0.87 1.07 0.20 22.8%
IT Services, Listing and Other Fee Income (ITSLOFI)1 0.68 0.85 0.17 25.1%
Fixed Income Market 0.54 0.66 0.12 21.9%
Fixed Income Market
IT Services, Listing and Other Fee Income(ITSLOFI)
FX Market
Equities Market
Derivatives Market
Depository and Settlement
Money Market

Money Market
Source: Moscow Exchange, NFA1 Overnight rate, average for the period
Trading volumes
RUB trn
Fee & commission income
RUB mln
Comments
1Q 2019 2Q 2019 3Q 2019 4Q 2019
1,771
1Q 2020
1,789 1,652 1,768 1,722
-2.8%
Trading volumes of repo with CCP
RUB trn, %
3Q 2019
12%10%
14%
6.7
64%
7.8
10%
17%
12%10%12%
57%
19%
2Q 2019
7.3
17%
56%
84.520%
0%
57%
13%
4Q 2019
6.2
15%9%
79.1
1%
59%
14%
1Q 2020
95.2
7.8
1Q 2019
87.695.2
+20.3%
62%
5%
2015 3M’202013
84%
20162014
30%
73% 76%
2017 2018
88%
2019
89%
3.725.0
66.7
176.2
231.5
259.4 256.1
69.5
Repo with CCP trading volumes, RUB trln
Share of repo with CCP in total ’interdealer’ repo (including GCC repo)
MosPrime rate1, %
Inter-dealer repo
Single-security repo with CCPDeposit and credit operations
Repo with the Federal Treasury
Repo with the CBR
GCC repo
▪ F&C contracted by 2.8% YoY, whereas trading volumesincreased 20.3% YoY.
▪ The discrepancy between the YoY dynamics of F&C and
volumes was due to: [1] Shorter terms of value-added GCC
repo, [2] IFRS adjustments, [3] smaller size of the position
(open interest), [4] lower effective fee of the credit market.
▪ Recently introduced repo with the Federal Treasury (non-CCP)
showed meaningful volumes of RUB 1.3 tn in 1Q’20.
▪ Interdealer repo volumes were up 10.4% YoY, while repo with
CBR amounted to RUB 1.5 tn, up 12x (both non-CCP).
▪ The share of CCP repo in total ‘interdealer’ repo stood at 89%.
22%
1Q 2020
45
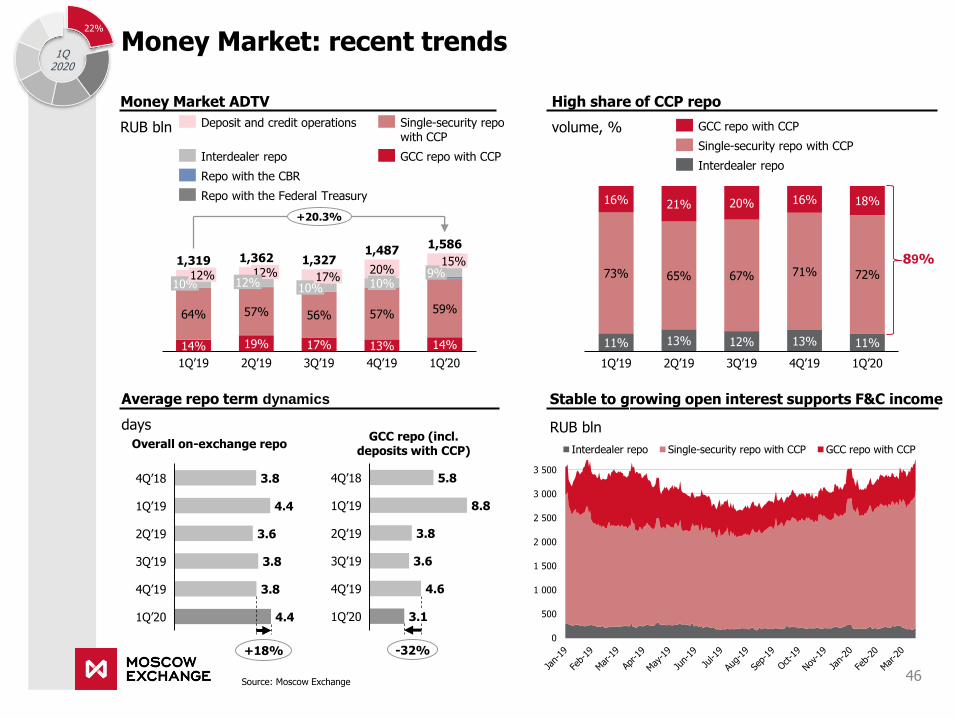
High share of CCP repo
volume, %
Money Market ADTV
RUB bln
Stable to growing open interest supports F&C income
RUB bln
Average repo term dynamics
days
56%
1Q’19
10%12%
64% 57%
2Q’19
14%
9%12%
57%
10%17%
17%
3Q’19
1,36220%10%
13%
4Q’19
15%
59%
14%
1Q’20
19%
12%
1,319
1,586
1,3271,487
+20.3%
11% 13% 12% 13% 11%
73% 65% 67% 71% 72%
16% 21% 20% 16% 18%
1Q’19 2Q’19 1Q’203Q’19 4Q’19
4.4
3.8
1Q’20
1Q’19
4Q’18
2Q’19
4Q’19
3Q’19
3.8
3.6
3.8
4.4
+18%
Overall on-exchange repo
3Q’19
4Q’18
1Q’19
2Q’19
4.64Q’19
3.11Q’20
5.8
8.8
3.8
3.6
-32%
GCC repo (incl. deposits with CCP)
Deposit and credit operations
Interdealer repo
Repo with the Federal Treasury
Repo with the CBR
Single-security repowith CCP
GCC repo with CCP
GCC repo with CCP
Single-security repo with CCP
Interdealer repo
89%
Money Market: recent trends
46Source: Moscow Exchange
22%
1Q 2020
0
500
1 000
1 500
2 000
2 500
3 000
3 500
Interdealer repo Single-security repo with CCP GCC repo with CCP

18%
Depository and Settlement Services
Assets on deposit (average for the period)
RUB trn
Fee & commission income
RUB mln
Source: Moscow Exchange
50.6
15%
1Q 2019
42%
17%
41%
15%
42%
18%
14%
26%
1Q 20202Q 2019
18%
15%
43%
18%
25%
43%
3Q 2019
14%
26%
17%
4Q 2019
27%26%
45.5 47.0 48.051.3
+12.7%
4Q 20191Q 2019 2Q 2019 3Q 2019 1Q 2020
1,3011,187
1,3131,426 1,394
+17.5%
Other
Equities
OFZ
Corporate and regional bonds
Comments
Fee & commission income breakdown
1Q 2020
72%
17%8%
3%
Depository transactions and clearing services
Safekeeping
Services for issuers
Settlement and cash services
Other
Collateral management services 1.1%
Clearing 6.9%
Book-entry transfers 8.6%
▪ F&C income grew 17.5% YoY; average assets on deposit
increased 12.7% YoY.
▪ The YoY growth in assets on deposit was still registered
across all asset classes: federal government bonds were up
20.9% YoY, equities were up 8.6% YoY, corporate and
regional bonds were up 17.6% YoY.
▪ F&C income growth compared to 1Q’19 was driven mainly by
safekeeping.
▪ The discrepancy between growth rates of F&C income and
assets is the result of business lines beyond safekeeping, such
as book-entry transfers, settlement and cash services as well
as clearing.
1Q
2020
47
2,6282,896
2,4802,740 2,877
48
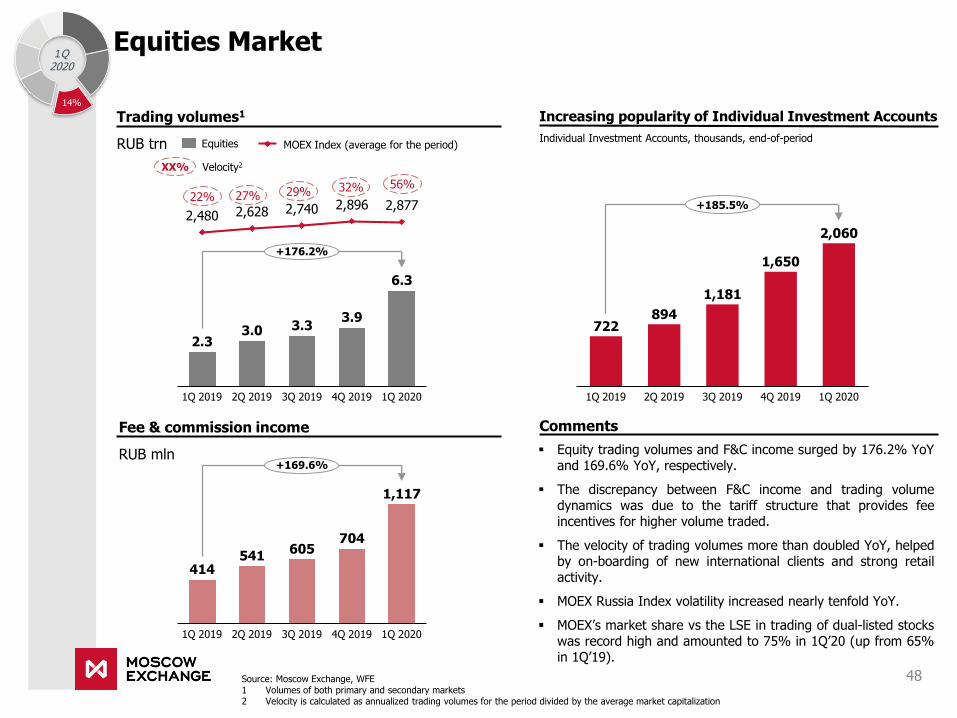
▪ Equity trading volumes and F&C income surged by 176.2% YoYand 169.6% YoY, respectively.
▪ The discrepancy between F&C income and trading volumedynamics was due to the tariff structure that provides feeincentives for higher volume traded.
▪ The velocity of trading volumes more than doubled YoY, helpedby on-boarding of new international clients and strong retailactivity.
▪ MOEX Russia Index volatility increased nearly tenfold YoY.
▪ MOEX’s market share vs the LSE in trading of dual-listed stockswas record high and amounted to 75% in 1Q’20 (up from 65%in 1Q’19).
Source: Moscow Exchange, WFE 1 Volumes of both primary and secondary markets2 Velocity is calculated as annualized trading volumes for the period divided by the average market capitalization
Equities Market
XX% Velocity2
Trading volumes1
RUB trn
Fee & commission income
RUB mln
Equities
414541
605704
2Q 2019 1Q 20201Q 2019 3Q 2019 4Q 2019
1,117
+169.6%
Comments
1Q 2019 1Q 20202Q 2019 3Q 2019 4Q 2019
2.33.0 3.3
3.9
6.3
+176.2%
22%32%
27% 29%
1Q2020
MOEX Index (average for the period)
722894
1Q 20201Q 2019 3Q 2019 4Q 20192Q 2019
1,181
1,650
2,060
+185.5%
Increasing popularity of Individual Investment Accounts
Individual Investment Accounts, thousands, end-of-period
56%
14%

Trading volumes
RUB trn Volatility index (RVI)
Interest rates
Commodities
Currencies
Indices
Equities
Derivatives Market
Fee & commission income
RUB mln
Open interest
RUB bln
Comments
Source: Moscow Exchange
655 643774 781
1Q 2019 4Q 20192Q 2019 3Q 2019 1Q 2020
1,099
+67.7%
23 21 21 20
40
43%
26%
32%
7%24%
36%40%
5%
1Q 2019
35%
24%
2Q 2019
37%34%
5%22%
3Q 2019
32%
37%
5%
4Q 2019
27%
27%
1Q 2020
33.6
4%
18.7 19.224.1
20.4
+79.6%
▪ F&C grew 67.7% YoY, trading volumes increased by 79.6% YoY.
▪ Trading volumes of FX derivatives expanded by 92.7% YoY and88.7% QoQ on the back of a volatility spike.
▪ Index derivatives’ volumes surged by 107.1% YoY and 75.2%QoQ, while volumes of equity derivatives added 36.5% YoY.
▪ Trading volumes of commodity contracts improved by 49.5% YoY
and 37.5% QoQ.
▪ Open interest remained virtually flat YoY, up by 4.8%.
▪ The effective fee was down YoY due to: [1] a shift in the mix in
favor of less profitable FX and index derivatives (70% in 1Q’20 vs
63% in 1Q’19), [2] IFRS adjustments, [3] lower share of options.
1Q 2020
627577
626
701657
3Q 20191Q 2019 2Q 2019 4Q 2019 1Q 2020
+4.8%
49
14%

FX Market
Fee & commission income
RUB mln
872 886 933858
2Q 20191Q 2019 3Q 2019 4Q 2019 1Q 2020
1,070
+22.8%
Comments
Trading volumes
RUB trn
70%78%
20%
1.2
30%22%
80%
22%
78%
1Q 2019
1.1
77%
2Q 2019
2.0
23%
3Q 2019
1.3
4Q 2019
9.0
1Q 2020
80.975.8 80.0 70.082.4
+6.7%
Volatility USD/RUB,%1 Spot Swap
Source: Moscow Exchange, CBR1 Calculated as daily standard deviation for the period divided by the average value for the period
Spot trading volumes
RUB trn
1Q 2019 1Q 2020
16.9
24.3
+44.2%
Swap trading volumes
RUB trn
1Q 2019 1Q 2020
56.558.9
-4.1%
1Q 2020
▪ Fee income increased by 22.8% YoY, volumes grew 6.7% YoY.
▪ Spot volumes were up 44.2% YoY due to volatility surge and
higher demand for CCP services in changing economic conditions.
▪ Swap and forward volumes declined by 4.1% YoY.
▪ MOEX’s 1Q’20 market share vs onshore OTC added 2.7 pp QoQ
to reach 45.5%.
▪ The effective fee was supported by: [1] a higher share of spot
trading, [2] clients using more expensive tariff plans.
▪ The number of active clients approached 247,000 – up 4x YoY –
with retail accounting for nearly 99% of these.
▪ The ADTV of corporates was RUB 4.5 bln in 1Q’20, up 69% YoY.
50
14%

51
IT Services, Listing and Other Fee Income (ITSLOFI)
31%
29%
34%
11%
24%24%
31%
2Q 2019
11%
34%
31%
3Q 2019
6%25%
30%635
27%
38%
4Q 2019
16%
34%
25%
804
1Q 2020
20%
1Q 2019
852
19%
681639
+25.1%
Other fee and commission income
Listing and other fees related to Securities Market
Information services
Sale of software and technical services
IT Services, Listing and Other Fee Income1 (ITSLOFI)
RUB mln
Comments
Source: Moscow Exchange1 Includes Other fee and commission income
▪ Listing and other fees related to the Securities Marketincreased 4.0% YoY.
▪ Sales of information services rose by 36.9% YoY on the backof extra revenue from audit of information use and RUBweakening.
▪ Sales of software and technical services grew 6.7% YoY.
▪ Other fee and commission income expanded by 53.2% YoYas lower contribution from the Grain Market was more thancompensated for by additional fee on EUR balances.
▪ The additional fee for recording individual clearing collateralon EUR balances is 0.2% on top of the ECB rate, effective 1January 2020.
1Q
2020
11%

52
Fixed Income Market
Source: Moscow Exchange1 Trading volumes on the Fixed Income Market include placements
Trading volumes1
RUB trn
Fee & commission income
RUB mln
63%77%
28%23%
72%
1Q 2019
37%
2Q 2019 3Q 2019
63%
37%
4Q 2019 1Q 2020
75%
25%
4.6
6.3
4.6
6.86.3
+36.2%
Government and CBR bonds (OFZ, OBR)
Corporate, municipal and other bonds (excl. overnight bonds)
537
752
500
762655
2Q 20191Q 2019 3Q 2019 4Q 2019 1Q 2020
+21.9%
Comments
▪ Fee income increased by 21.9% YoY on the back of a 36.2%YoY growth in trading volumes (excl. overnight bonds).
▪ Primary placements were up 14.1% YoY (excl. overnight bonds)due to higher placements of corporate and municipal bonds (up50.7% YoY). Placements of OFZs were up 9.3% YoY.
▪ Secondary trading volumes increased by 64.2% YoY, mainly dueto the 87.5% YoY rise in OFZ trading.
▪ The QoQ effective fee dynamics were affected by a lower shareof the primary market in total volumes (excl. overnight bonds)and also a lower share of corporate placements.
1Q2020
Primary market
RUB trn
57%
3Q’19
72%
36%
82%76%
18%
1Q’19
43%28%
2Q’19
64%
4Q’19
24%
1Q’20
2.6
3.6
1.9
3.7
2.9
+14.1%
Government and CBR bonds (OFZ, OBR)
Corporate, municipal and other bonds (excluding ON bonds)
8%

53
Interest and finance income in 1Q’20
1Q 2019
0.44.0
3.9
0.0
4.1 3.5
4.1
2Q 2019
0.7
3Q 2019
0.4
3.7
4Q 2019
0.7
3.3
1Q 2020
3.9 4.5 4.2
+2.1% -1.9%
Interest and finance income1
RUB bln
7,8 7,87,3
6,76,2
2,4 2,4 2,2
1,6 1,22,1 2,3 2,2
2,1 2,1
Mosprime2, % Effective yield, %Libor (USD)2, %
Source: NFA, Bloomberg, Moscow Exchange1 Interest and other finance income, Interest expense, Net gain on financial assets at fair value through other comprehensive income
and Foreign exchange gains less losses2 Average daily rate for the period3 Based on average daily investment portfolio sources for the period according to management accounts
Client funds by currency Investment portfolio by type of asset
58%
12%
15%
10%
6%
REPO
FX depositsand curr. accounts
FX securities
RUB securities
RUB deposits and current accounts
1Q 2020
Investment portfolio sources3
RUB bln
11%
3Q 2019
88%
12%
1Q 2019
89%
2Q 2019
11%
1Q 2020
89%
11%
89%
4Q 2019
13%
87%
746 767 771 777 747
+0.1% -3.9%
MOEX’s own funds Client funds
Net gains/losses on FVTOCI Core NII
51%
34%
14%1%
Other
EUR
RUB
USD
1Q 2020
63%
22%
12%3%
1Q 2019

Operating expenses in 1Q’20 (excl. provisions)
54Source: Moscow Exchange1 Remaining administrative expenses are calculated as General and administrative expenses less Depreciation of property and equipment, Amortisation
of intangible assets, Equipment and intangible assets maintenance
Operating expenses
RUB mln
CommentsHeadcount
▪ OPEX for 1Q’20 declined by 1.6% YoY, naturally coming below theFY’20 OPEX growth guidance range of 6.5-9.5%.
▪ Bonus provision reduction of 38.0% YoY mitigated personnelexpenses growth in 1Q’20 amid a 4.4% headcount increase.
▪ D&A contraction of 8.8% YoY drove a 3.0% YoY decline in D&Aand IT maintenance.
▪ Remaining administrative expenses declined by 8.0% thanks tosavings on professional services – that contained grain pass-through expenses in 1Q’19 – and information services.
▪ Anti-COVID protection costs were immaterial due to early response.
▪ CAPEX for the quarter was RUB 0.6 bln.
▪ Updated FY’20 OPEX growth guidance: 6.0-8.5%.
Major expense items
RUB mln
3,874
47%
2Q 2019
53% 53%
1Q 2019
54%
47%46%
3Q 2019 4Q 2019
56%
44%
51%
49%
1Q 2020
3,737 3,6783,7764,049
-1.6% -9.2%
General and administrative expenses
Personnel expenses1Q 2019 1Q 2020
ChangeYoY
Personnel expenses 1755.9 1794.7 2.2%
D&A and IT maintenance 1204.9 1169.1 -3.0%
Remaining administrative expenses1 776.1 714.4 -8.0%
Incl. Professional Services 155.5 107.5 -30.9%
Total OPEX 3736.9 3678.2 -1.6%
Cost / Income Ratio 36.3% 30.7% -5.6 p.p.
1Q 2019 2Q 2019 3Q 2019 4Q 2019 1Q 2020
1,737 1,8131,748 1,792 1,791
+4.4% +1.2%
Appendix
55

Dual listed stocks virtual index spread dynamics
56
▪ Moscow Exchange is the liquidity center for Russian securities with ~70% market share in total trading volumes
▪ Aggregated spreads for most liquid dual listed stocks are substantially lower in Moscow implying lower all-in trading costs
Data as of 03 February 20201. MICEX Virtual Index – index calculated based on prices and EOB data of the most liquid Russian dual listed stocks. Data since December 2015 include trading auctions
on MOEX. Data for March-April 2018, January-May 2020 are based on Bloomberg data for LSE, data for other periods were provided by Liquidmetrix
2. The value of the spread is quoted in basis points (0.01%)Source: LiquidMetrix
Spreads measure the bid to offer spread of the best visible orders in the book, the result is based on measurements of the order books every 30 seconds
Bid - ask spread 1 Contract
(b.p.)
Bid - ask spread 50k
EUR deal (b.p.)
Analysis provided by
Average Bid - ask spread 50k EUR deal (b.p.2)
2018 2019
3.9
9.4
22.1
LSEMOEX
13.5
3.0
7.7
10.0
MOEX LSE
16.2
MOEX vs LSE market share (MICEX Virtual Index1)
55% 56% 58% 58%63%
69%77%
45% 44% 42% 42%37%
31%23%
20162014 20182015 2017 6M’202019
LSE MOEX

Blue Chips bid - ask spread dynamics for 50k EUR deal (1)
Gazprom
Sberbank
Lukoil
Norilsk Nickel
Magnit
Analysis provided by
Bid-ask spreads for majority of the Russian “Blue Chips” are substantially lower on Moscow Exchange than on other trading venues
Data as of 3 February 20201 Data since December 2015 include trading auctions on MOEX2 The value of the spread is quoted in basis points (0.01%)Source: LiquidMetrix
Average Bid - ask spread 50k EUR deal (b.p.2)
2018 2019
Market share1
2018 2019
40%60%
73%
27%
52%48%
50%50%
32%
68%
13.7
9.3
6.4
12.1
9.0 9.7
16.012.4
MOEX
53.2
LSE
22.8
71%
29%
78%
22%
42%58%
38%62%
75%
25%
LSE MOEX
6.59.6
4.9
9.1
7.56.0
11.28.9
LSEMOEX
19.4
52.9
57

Blue Chips bid - ask spread dynamics for 50k EUR deal (2)
Bid-ask spreads for majority of the Russian “Blue Chips” are substantially lower on Moscow Exchange than on other trading venues
Data as of 3 February 20201 Data since December 2015 include trading auctions on MOEX2 The value of the spread is quoted in basis points (0.01%)Source: LiquidMetrix
VTB
Tatneft
Rosneft
Novatek
Surgutneftegas
Analysis provided byMarket share1
2018 2019
84%
16%
49%51%
48%52%
58%42%
68%
32%
Average Bid - ask spread 50k EUR deal (b.p.2)
2018 2019
25.8
120.2
17.914.2
10.616.1
14.617.9
MOEX
17.7
LSE
33.4
90%
10%
38%62%
35%65%
56%44%
84%
16%
MOEXLSE
30.1
125.4
17.320.4
12.916.0
16.222.4
MOEX LSE
20.2
35.1
58

DR programDepositary
bank
Depository Service
Fee1 (DSF), USD per DR
Dividend Fee2,
USD per DR
DSF + Dividend Fee as %
of dividend amount3
DRscancellatio
ns fee, USD per
DR
VTB Bank BNY Mellon 0,030 0,004 99% 0,05
RusHydro BNY Mellon 0,020 0,007 47% 0,05
Rossiyskiye Seti BNY Mellon 0,020 0,009 38% 0,05
Surgutneftegaz BNY Mellon 0,020 0,012 32% 0,05
TMK BNY Mellon 0,020 0,019 25% 0,05
FSK YeES BNY Mellon 0,010 0,015 20% 0,05
Rostelekom JPM 0,005 0,020 10% 0,05
Megafon BNY Mellon 0,030 0,020 9% 0,05
Phosagro Citi 0,020 - 5% 0,05
Gazprom BNY Mellon - 0,020 4% 0,05
Sberbank JP Morgan 0,008 0,020 3% 0,05
Norilsk Nickel BNY Mellon 0,010 0,020 2% 0,05
Rosneft JPM 0,004 - 2% 0,05
NLMK Deutsche Bank 0,020 - 2% 0,05
Magnit JPM 0,008 - 2% 0,05
Tatneft BNY Mellon 0,020 0,020 1% 0,05
Novatek BNY Mellon 0,010 0,020 1% 0,05
Lukoil Citi - 0,020 1% 0,05
Severstal Deutsche Bank - - 0% 0,05
Average 0.013 0.012 16% 0.05
• A depository service fee and a dividend
fee are to be paid by a DR holder to the
depositary bank while there are no such
fees for holders of local shares
• Majority of DRs cancellations are also
charged 0.05 USD per DR
Gross DSF and dividend fees calculated for Top-3 international funds holding DRs of Russian companies4
Fees to be paid to depositary bank for some of DR programs of Russian companies
Fund A 3,079,157 USD
Fund B 1,908,931 USD
Fund C 600,064 USD
1 Service fees are charged annually, on an arbitrary date. Calculated based on number of DRs in a client’s account on the record date2 Dividend fees are charged when dividends are paid 3 As % of dividend amount after tax4 Calculations based on Thomson Reuters data as of June 2019Source: BNY Mellon, Deutsche Bank, JP Morgan, Citi, Thomson Reuters
DR holders pay substantial EXTRA FEES to depository banks
59
Cost of cancellation of all DRs in portfolios to local shares for Top-3 funds
Fund A 7,240,240 USD
Fund B 4,374,476 USD
Fund C 1,118,330 USD

Dividend payments for DR holders
60Source: Moscow Exchange1 Average weighted USD/RUB FX rate at Moscow Exchange2 FX rate for dividends conversion3 Publicly available information on the Custodian - DR issuer web site
▪ FX rates for conversion of dividends aredetermined in a non-transparent manner
▪ According to information from notices forDR holders3:
➢ Custodian - DR issuer has no obligation toobtain the "best price" for any FX Trade
➢ The conversion rate reflects a foreigncurrency transaction ("FX Trade")executed by the Custodian - DR issuer asprincipal counterparty and not as agent,fiduciary or broker
FX rate determination for dividends
IssuerRecord
date
Local Shares DR
Payable date
FX rate1 Payable date
FX rate2 Diff.
Inter RAO YEES 31-May-19 18-Jun-19 63.2 25-Jun-19 64.2 1.6%
PIK Group 3-Jun-19 13-Jun-19 64.4 20-Jun-19 64.8 0.7%
TransContainer 31-May-19 13-Jun-19 64.4 20-Jun-19 64.8 0.7%
VTB Bank 24-Jun-19 8-Jul-19 63.5 15-Jul-19 63.8 0.5%
ММК 20-Jun-19 8-Jul-19 63.5 15-Jul-19 63.8 0.5%
RusHydro 9-Jul-19 26-Jul-19 63.2 2-Aug-19 63.5 0.4%
Rosneft 17-Jun-19 5-Jul-19 63.6 12-Jul-19 63.9 0.4%
Payable date for ordinary shares
in RUB
Date of notice and determination of FX rate
for RUB to USD conversionPayable date for DR
in USD
Days
1 2 3 4 5 6 7
DR holders received their dividends one week later compared to holders of the ordinary shares

Consolidated Statement of Profit or Loss
61
RUB mln 2019 2018 % chg.
Fee and commission income 26,181.4 23,647.1 11%
Interest and finance income1
16,713.0 16,061.0 4%
Other operating income 335.1 193.3 73%
Operating Income 43,229.5 39,901.4 8%
General and administrative expenses -8,321.4 -7,941.4 5%
Personnel expenses -7,113.9 -6,512.3 9%
Operating Expense (before Other operating expenses)
-15,435.3 -14,453.7 7%
Operating Profit Before Tax (before Other operating expenses)
27,794.2 25,447.7 9%
Other operating expenses -2,614.8 -1,075.2 143%
Income tax expense -4,978.8 -4,652.2 7%
Net Profit 20,200.6 19,720.3 2%
Earnings per share
Basic earnings per share, rubles 8.96 8.76 2%
Diluted earnings per share, rubles 8.96 8.74 3%
Source: Moscow Exchange, Consolidated Interim Financial Statements1 Interest and other finance income, Interest expense, Net loss on financial assets available-for-sale, Foreign exchange gains less losses

Consolidated Statement of Financial Position
62
RUB mln 31 December 2019 31 December 2018 % chg.
Assets:
Cash and cash equivalents 466,098.8 416,391.2 12%
Central counterparty financial assets 3,262,670.6 3,312,020.2 -1%
Financial assets1 253,538.2 310,481.1 -18%
Property and equipment and intangible assets 22,435.6 23,578.2 -5%
Goodwill 15,971.4 15,971.4 0%
Other assets2 7,879.8 4,142.4 90%
Total Assets 4,028,594.4 4,082,584.5 -1%
Source: Moscow Exchange, Consolidated Financial Statements1 Financial assets at fair value through profit or loss, Due from financial institutions, Investments available-for-sale, Financial assets at fair value
through other comprehensive income 2 Current tax prepayments, Deferred tax asset, Other assets3 Margin account, Deferred tax liability, Current tax payables, Other liabilities excluding Derivative financial liabilities
RUB mln 31 December 2019 31 December 2018 % chg.
Liabilities:
Balances of market participants 565,922.6 606,479.8 -7%
Overnight bank loans 49,229.1 5,003.1 884%
Derivative financial liabilities 32.8 104.2 -69%
Central counterparty financial liabilities 3,262,670.6 3,312,020.2 -1%
Distributions payable to holders of securities 11,714.1 24,676.0 -53%
Other liabilities3
7,167.0 8,696.6 -18%
Total Liabilities 3,896,742.0 3,956,979.9 -2%
Total Equity 131,852.4 125,604.6 5%
Total Liabilities and Equity 4,028,594.4 4,082,584.5 -1%

Disclaimer
63
NOT FOR RELEASE OR DISTRIBUTION OR PUBLICATION IN WHOLE OR IN PART IN OR INTO THE UNITED STATES, AUSTRALIA, CANADA OR JAPAN.
•This presentation has been prepared and issued by Public Joint Stock Company "Moscow Exchange MICEX-RTS" (the “Company”). Unless otherwise stated, the Company is the source for all data and assumptions contained in this document. Such data and assumptions are provided as at the date of this document and is subject to change without notice. Certain industry, market and competitive position data contained in this document come from official or third party sources believed to be reliable but the Company does not guarantee its accuracy or completeness. The Company does not intend to have any duty or obligation to update or to keep current any information contained in this presentation.
•Neither the presentation nor any copy of it may be taken or transmitted into the United States of America, its territories or possessions, or distributed, directly or indirectly, in the United States of America, its territories or possessions as defined in Regulation S under the US Securities Act 1933, as amended (the “Securities Act), except to “qualified institutional buyers” as defined in Rule 144A under the Securities Act. Any failure to comply with this restriction may constitute a violation of United States securities laws. The presentation is not an offer or sale of securities in the United States. Moscow Exchange Group has not registered and does not intend to register any securities in the United States or to conduct a public offering of any securities in the United States.
•This presentation does not constitute an advertisement or a public offer of securities in any jurisdiction. It is not intended to be publicly distributed in any jurisdiction. This document is only being made available to interested parties on the basis that: (A) if they are UK persons, they are persons falling within Articles 19 or 49 of the Financial Services and Markets Act 2000 (Financial Promotion) Order 2005; or (B) they are outside the United Kingdom and are eligible under local law to receive this document. Recipients of this document in jurisdictions outside the UK should inform themselves about and observe any applicable legal requirements.
This presentation is not a prospectus for purposes of Directive 2003/71/EC (and amendments thereto, including Directive 2010/73/EU, to the extent implemented in any relevant Member State and any relevant implementing measure in the relevant Member State) (the “Prospectus Directive”). In any EEA Member State that has implemented the Prospectus Directive, this presentation is only addressed to and is only directed at qualified investors in that Member State within the meaning of the Prospectus Directive.
This presentation is not directed to, or intended for distribution to or use by, any person or entity that is a citizen or resident or located in any locality, state, country or other jurisdiction where such distribution, publication, availability or use would be contrary to law or regulation or which would require any registration or licensing within such jurisdiction.
•This document does not constitute or form part of, and should not be construed as, an offer or invitation for the sale or subscription of, or a solicitation of any offer to buy or subscribe for, any securities, nor shall it or any part of it or the fact of its distribution form the basis of, or be relied on in connection with, any offer, contract, commitment or investment decision, nor does it constitute a recommendation regarding the securities of the Company.
•The information in this document has not been independently verified. No representation or warranty, express or implied, is made as to, and no reliance should be placed on, the fairness, accuracy or completeness of the information, assumptions or opinions contained herein. None of the Company, or any of its subsidiaries or affiliates or any of such person's directors, officers or employees, advisers or other representatives, accepts any liability whatsoever (whether in negligence or otherwise) arising, directly or indirectly, from the use of this document or otherwise arising in connection therewith.
•This presentation includes forward-looking statements. All statements other than statements of historical fact included in this presentation, including, without limitation, those regarding MOEX financial position, business strategy, management plans and objectives for future operations are forward-looking statements. These forward-looking statements involve known and unknown risks, uncertainties and other factors, which may cause our actual results, performance, achievements or industry results to be materially different from those expressed or implied by these forward-looking statements. These forward-looking statements are based on numerous assumptions regarding our present and future business strategies and the environment in which we expect to operate in the future. Important factors that could cause our actual results, performance, achievements or industry results to differ materially from those in the forward-looking statements include, among other factors:
–perception of market services offered by the Company and its subsidiaries;
–volatility (a) of the Russian economy and the securities market and (b) sectors with a high level of competition that the Company and its subsidiaries operate;
–changes in (a) domestic and international legislation and tax regulation and (b) state policies related to financial markets and securities markets;
–competition increase from new players on the Russian market;
–the ability to keep pace with rapid changes in science and technology environment, including the ability to use advanced features that are popular with the Company's and its subsidiaries' customers;
–the ability to maintain continuity of the process of introduction of new competitive products and services, while keeping the competitiveness;
–the ability to attract new customers on the domestic market and in foreign jurisdictions;
–the ability to increase the offer of products in foreign jurisdictions.
•Forward-looking statements speak only as of the date of this presentation and we expressly disclaim any obligation or undertaking to release any update of, or revisions to, any forward-looking statements in this presentation as a result of any change in our expectations or any change in events, conditions or circumstances on which these forward-looking statements are based. Past performance should not be taken as an indication or guarantee of future results, and no representation or warranty, express or implied, is made regarding such future performance.