mortality rates and improvement over …...actuarial society 2016 convention 23 –24 november...
TRANSCRIPT

Actuarial Society 2016 Convention 23 – 24 November 2016
MORTALITY RATES AND IMPROVEMENT OVER
TIME AT ADVANCED AGES IN SOUTH AFRICA
Ronald Richman and Rob Dorrington

Actuarial Society 2016 Convention 23 – 24 November 2016
Agenda
1. Background
2. Method
3. Results
4. Conclusion
2

Actuarial Society 2016 Convention 23 – 24 November 2016
Background• Why should actuaries care about population mortality rates at
the older ages?
• Data on insured lives not always sufficient to estimate:
• level and trend at older ages
• stochastic models of mortality
• Valuation of cashflows for damages use population mortality
rates
• In South Africa actuaries need to use professional/expert
judgement:
• Data for SAIML/SAIFL98 not robust after age 85 and rates
approximated
• Mortality improvement rates from other countries often used as a
proxy
• SCR Longevity in SAM relies on work performed for SII
• Reliant on old population lifetables (SALT85) for damages
• Why not use the population data to calculate rates?3

Actuarial Society 2016 Convention 23 – 24 November 2016
Use census data to estimate mx
• log mx for
males
• Flat or
decreasing
with age
• Expect straight line
on log
scale if
follows
Gompertz
• Similar for
females
• What has
gone
wrong?4
0.02
0.20
2.00
70
73
76
79
82
85
88
91
94
97
10
0
10
3
10
6
mx
Age last birthday on 10 October
Males
1996 raw
2001 raw
2011 raw

Actuarial Society 2016 Convention 23 – 24 November 2016
Census data are messy• Misreporting at
older ages
• Heaping on
years of birth
ending on ‘0’,
1914 & 1918
• Often, too many
enumerated at
older ages (183 at 115+)
producing rates
that may be too
low
• Population
estimates
uncertain5

Actuarial Society 2016 Convention 23 – 24 November 2016
Agenda
1. Background
2. Method
3. Results
4. Conclusion
6

Actuarial Society 2016 Convention 23 – 24 November 2016
The plan• Death data often reported with greater accuracy than
population data (ID number)
• Deaths are not fully reported in South Africa so correct
the data before use – death distribution methods (see
paper for details and references)
• Reconstruct the population using only the death data –
the method of extinct generations (EG):
• Not feasible to wait for deaths to occur, so project the
future deaths based on the past deaths – How?
7
xi
ciDcxN ),(),(

Actuarial Society 2016 Convention 23 – 24 November 2016
Similar problems, similar solutions
1. Predict future deaths occurring for each
cohort based only on past death information
2. Predict outstanding claims to be reported in
the future for each accident period based
only on past claim payments
• Demographic solution: NEG Methods (NEG)
• Actuarial solution: Chain ladder and
extensions

Actuarial Society 2016 Convention 23 – 24 November 2016
Triangles
9

Actuarial Society 2016 Convention 23 – 24 November 2016
GAM Model
10
txfxfxtf
eODPD
txt
txtxt
*)()()(
)(~
,
,,
• Chain ladder = ODP
GLM
• Use GAM (GLM plus
smoothing) to model the deaths directly
(NEG-GAM)
• Implicitly model
mortality as the
percentage of the
cohort dying at
each age
• Insight into chain
ladder method
• Period trend
)(| xfqxt )(),( xtfcxN
txf *)(

Actuarial Society 2016 Convention 23 – 24 November 2016
Control variables
11
txxt
txt
tx
txfxfxtf
eODPD txt
*)()()(
)(~
,
,,
Legend
Year of birth heaping -
Age heaping -
Completeness -
xt
x
t

Actuarial Society 2016 Convention 23 – 24 November 2016
Agenda
1. Background
2. Method
3. Results
4. Conclusion
12

Actuarial Society 2016 Convention 23 – 24 November 2016
National Completeness• (1) – Logistic
curve fit
through point
estimates of
completeness
• (2) – Peaks at
87%
• (3) – Falls
mainly due to late reported
deaths
• Warning – do
not use death
data unless
corrected!
13
(1)
(2)
(3)
50%
55%
60%
65%
70%
75%
80%
85%
90%
19
84
19
86
19
88
19
90
19
92
19
94
19
96
19
98
20
00
20
02
20
04
20
06
20
08
20
10
20
12
National

Actuarial Society 2016 Convention 23 – 24 November 2016
National Population 70+• Sensible
trajectory
• Higher than
earlier censuses
– expected since these
were
undercounted
relative to 2011
Census
• Too low
compared to
Census 2011?
• Modelling
issue
• Census
overcount14
-
500 000
1 000 000
1 500 000
2 000 000
2 500 000
19
85
19
87
19
89
19
91
19
93
19
95
19
97
19
99
20
01
20
03
20
05
20
07
20
09
20
11
20
13
20
15
Po
pu
lati
on
est
ima
tes i
n i
nte
rva
l 7
0+
Year
National
Census
Survey
AltMYE
ASSA
StatSA
UNPD
USCB
NEG - GAM

Actuarial Society 2016 Convention 23 – 24 November 2016
Age exaggeration• Ratio of
estimated
population to
census
population in
increasing
open intervals
• Age
exaggeration from around
79
• Explains
“flattened” mortality rates
15
0%
20%
40%
60%
80%
100%
120%
72
75
78
81
84
87
90
93
96
99
10
2
10
5
10
8
11
1Rat
io o
f N
EG-G
AM
to
Ce
nsu
s at
age
s x+
Age last birthday on 10 October
National
1996
2001
2011

Actuarial Society 2016 Convention 23 – 24 November 2016
mx - Males• Sensible
ranking of
mortality rates
at younger
ages
• Cross-over at
ages 86-88
• High rates at
younger ages should imply
high rates at
older ages
• Unless select
effect (little
evidence)
16
0.02
0.20
2.00 7
0
73
76
79
82
85
88
91
94
97
100
103
106
109
mx
Age last birthday
Males
African
Indian
Coloured
White
National

Actuarial Society 2016 Convention 23 – 24 November 2016
mx - Females• Similar points to
males
• White Female
mortality seems
too high at
highest ages
• Crosses over
rates for
males at age
101
• Would expect
rates to
remain lower
than males
over whole
age range
17
0.02
0.20
2.00 7
0
73
76
79
82
85
88
91
94
97
100
103
106
109
mx
Age last birthday
Females
African
Indian
Coloured
White
National
Actuarial Society 2016 Convention 23 – 24 November 2016
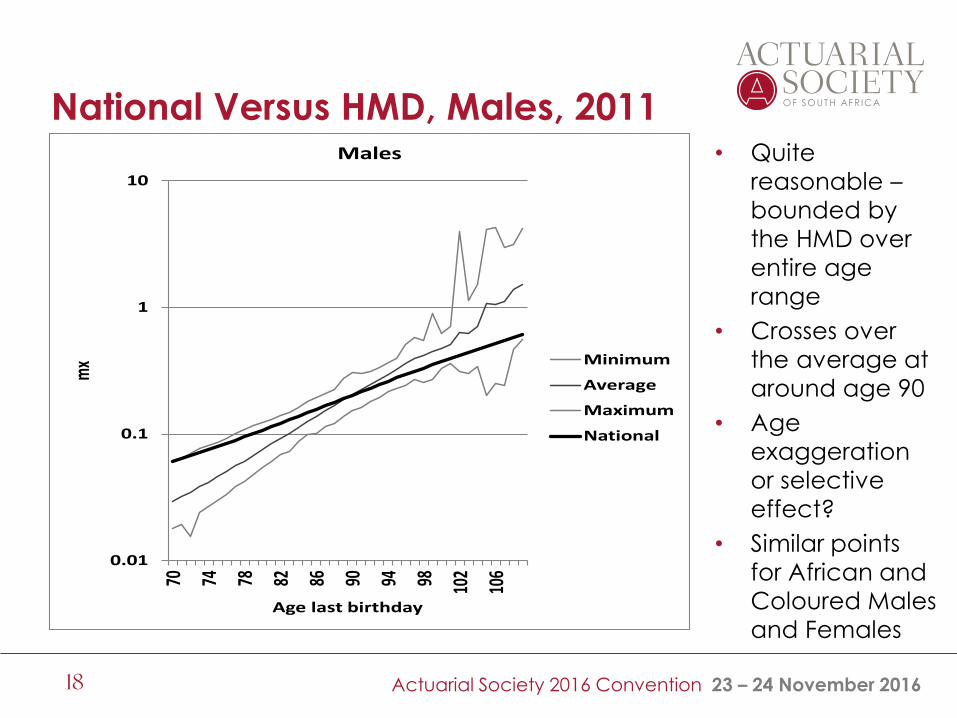
National Versus HMD, Males, 2011• Quite
reasonable –
bounded by
the HMD over
entire age
range
• Crosses over
the average at
around age 90
• Age
exaggeration
or selective
effect?
• Similar points
for African and
Coloured Males
and Females
18
0.01
0.1
1
1070 74 78 82 86 90 94 98 10
2
106
mx
Age last birthday
Males
Minimum
Average
Maximum
National

Actuarial Society 2016 Convention 23 – 24 November 2016
Indian Versus HMD, Females, 2011• Reasonable –
rates remain
high until oldest
ages
• Tends towards
and crosses
over average
rates in HMD at
oldest ages
• Similar
comments for
Whites and
Indian males
19
0.01
0.1
1
1070 74 78 82 86 90 94 98 10
2
106
mx
Age last birthday
Females
Minimum
Average
Maximum
Indian

Actuarial Society 2016 Convention 23 – 24 November 2016
Preliminary mortality improvement• Please do not use
without permission
• Rates appear
reasonable for all
groups at ages 70-
79
• Improvements since
1985 shown at these
ages
• Only a marginal
decline in mortality
nationally
• Improvements for
males and females
comparable,
except for white
males vs females –
needs more
investigation20
Group SexRate of
improvement per annum
African Male -0.30%
African Female -0.30%
Asian Male 1.70%
Asian Female 1.30%
Coloured Male 2.10%
Coloured Female 2.20%
White Male 1.40%
White Female 0.70%
National Male 0.50%
National Female 0.00%
Weighted Average Male 0.21%
Weighted Average Female 0.13%

Actuarial Society 2016 Convention 23 – 24 November 2016
White Versus Insured, Males, 2011• Significantly higher
than SAIML98
• Lower than PA(90)
rates until age 79
• Lower than (but
quite close to) the
rates in Table 1 of
Koch (2016) at all
ages
• Population rates
lower/close to
rates used by
actuaries to value
retirement benefits
and damages for
“select”
populations
21
0.01
0.10
1.00
70
73
76
79
82
85
88
91
94
97
10
0
10
3
10
6
mx
Age last birthday
Males
NEG-GAM 2011
D&T
PA90
Koch - Table 1

Actuarial Society 2016 Convention 23 – 24 November 2016
Agenda
1. Background
2. Method
3. Results
4. Conclusion
22

Actuarial Society 2016 Convention 23 – 24 November 2016
Conclusion• SA death data provide valuable information to actuaries
once corrected using demographic methods
• NEG or “Exposure free” modelling in regression framework provides a powerful framework for modelling mortality at
the older ages in South Africa…
• … and perhaps for developed countries as well?
• Issues requiring more investigation:
• Population estimates perhaps too low
• Rates crossing over
• Professional need to acknowledge uncertainty/expert
judgement:
• Uncertainty around level and trend
• 1-in-200 Longevity risk capital
23