mortality and socio-economic status in two eighteenth-century dutch villages
TRANSCRIPT

This article was downloaded by: [Nipissing University]On: 08 October 2014, At: 14:25Publisher: RoutledgeInforma Ltd Registered in England and Wales Registered Number: 1072954 Registeredoffice: Mortimer House, 37-41 Mortimer Street, London W1T 3JH, UK
Population Studies: A Journal ofDemographyPublication details, including instructions for authors andsubscription information:http://www.tandfonline.com/loi/rpst20
Mortality and Socio-economic Status inTwo Eighteenth-century Dutch VillagesJona Schellekens aa Department of Demography, The Hebrew University,Jerusalem, 91905, IsraelPublished online: 04 Jun 2010.
To cite this article: Jona Schellekens (1989) Mortality and Socio-economic Status in TwoEighteenth-century Dutch Villages, Population Studies: A Journal of Demography, 43:3, 391-404,DOI: 10.1080/0032472031000144206
To link to this article: http://dx.doi.org/10.1080/0032472031000144206
PLEASE SCROLL DOWN FOR ARTICLE
Taylor & Francis makes every effort to ensure the accuracy of all the information (the“Content”) contained in the publications on our platform. However, Taylor & Francis,our agents, and our licensors make no representations or warranties whatsoever as tothe accuracy, completeness, or suitability for any purpose of the Content. Any opinionsand views expressed in this publication are the opinions and views of the authors,and are not the views of or endorsed by Taylor & Francis. The accuracy of the Contentshould not be relied upon and should be independently verified with primary sourcesof information. Taylor and Francis shall not be liable for any losses, actions, claims,proceedings, demands, costs, expenses, damages, and other liabilities whatsoeveror howsoever caused arising directly or indirectly in connection with, in relation to orarising out of the use of the Content.
This article may be used for research, teaching, and private study purposes. Anysubstantial or systematic reproduction, redistribution, reselling, loan, sub-licensing,systematic supply, or distribution in any form to anyone is expressly forbidden. Terms& Conditions of access and use can be found at http://www.tandfonline.com/page/terms-and-conditions

Population Studies, 43 (1989), 391~.04
Printed in Great Britain
Mortality and Socio-economic Status in Two Eighteenth-century Dutch Villages
JONA S C H E L L E K E N S *
I N T R O D U C T I O N
This study is an analysis of mortality levels and their patterns of change among different socio-economic groups in two eighteenth-century Dutch villages. The population of these two villages has been divided into three sub-populations, which correspond approximately to farmers, cottagers, and agricultural labourers.
In the two villages studied there were large differences in mortality levels between farmers and agricultural labourers. While such differences have been found between socio-economic groups among pre-transition urban populations in Western Europe, they have not been found in other village studies in Western Europe.
Mortality differentials may result from a higher exposure or from lower resistance to contagious disease among the poorer sections of the population. A lower resistance to disease is often associated with malnutrition? According to McKeown malnutrition was a major cause for the high mortality before modern population growth started during the second half of the eighteenth and the beginning of the nineteenth centuries? As we will show, the villages studied here do not show any sign of such a link. Instead, the differential mortality seems to have been associated with differential exposure to contagious disease. The higher mortality among the poorer sections of the population may have been related to overcrowding, poor hygiene, polluted water, or a combination of these. It will be shown that the quality of the drinking water was probably of only minor importance. This leaves overcrowding and poor hygiene as candidates for explaining most of the differential mortality.
Mortality levels in many Western European countries were relatively low during the second half of the eighteenth century. In Gilze and Rijen mortality levels were also relatively low at that time. This lower level of mortality seems to have been associated with political changes that affected the spread of diseases, rather than with a rise in the standard of living. As there was less warfare during the second half of the eighteenth century the number of severe epidemics afflicting the villages decreased.
T H E D A T A A N D THE V A R I A B L E S
This study consists of a family reconstitution of Gilze and Rijen from church records on births and deaths, as well as annual population listings based on poll-tax records.
The villages of Gilze and Rijen are situated halfway between the cities of Breda and Tilburg in the south of the Netherlands. The villages formed one administrative unit. The total population during the period studied, 1726-1805, ranged from a low of 1,550 inhabitants in 1749 to a high of 1,932 in 1803. Not all of the eighteenth-century church
* Department of Demography, The Hebrew University, Jerusalem, 91905, Israel. 1 For a discussion on the nutrition mortality link, see Hunger and History, ed. R. I. Rotberg and T. K.
Rabb (Cambridge, 1985). T. McKeown, 'Food, infection and population' , Journal of Interdisciplinary History, 14 (1983),
pp. 227-247.
391
Dow
nloa
ded
by [
Nip
issi
ng U
nive
rsity
] at
14:
25 0
8 O
ctob
er 2
014
392 J O N A S C H E L L E K E N S
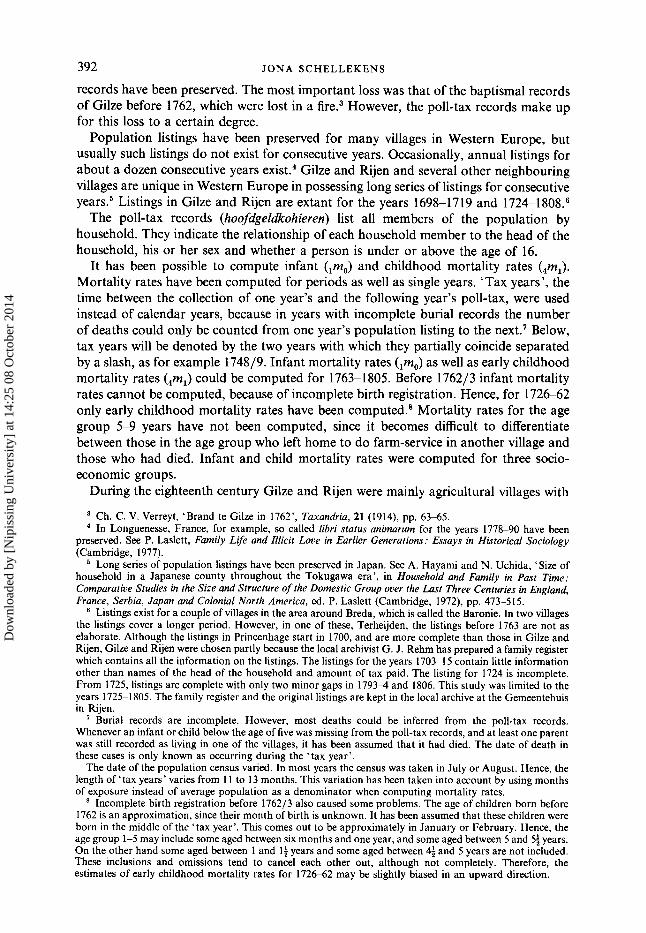
records have been preserved. The most important loss was that of the baptismal records of Gilze before 1762, which were lost in a fire. 3 However, the poll-tax records make up for this loss to a certain degree.
Population listings have been preserved for many villages in Western Europe, but usually such listings do not exist for consecutive years. Occasionally, annual listings for about a dozen consecutive years exist. 4 Gilze and Rijen and several other neighbouring villages are unique in Western Europe in possessing long series of listings for consecutive years. 5 Listings in Gilze and Rijen are extant for the years 1698-1719 and 1724-1808. 8
The poll-tax records (hoofdgeldkohieren) list all members of the population by household. They indicate the relationship of each household member to the head of the household, his or her sex and whether a person is under or above the age of 16.
It has been possible to compute infant (lm0) and childhood mortality r a t e s (4ml) .
Mortality rates have been computed for periods as well as single years. 'Tax years', the time between the collection of one year's and the following year's poll-tax, were used instead of calendar years, because in years with incomplete burial records the number of deaths could only be counted from one year's population listing to the next. 7 Below, tax years will be denoted by the two years with which they partially coincide separated by a slash, as for example 1748/9. Infant mortality rates (lm0) as well as early childhood mortality rates (4rnl) could be computed for 1763-1805. Before 1762/3 infant mortality rates cannot be computed, because of incomplete birth registration. Hence, for 1726-62 only early childhood mortality rates have been computed. 8 Mortality rates for the age group 5-9 years have not been computed, since it becomes difficult to differentiate between those in the age group who left home to do farm-service in another village and those who had died. Infant and child mortality rates were computed for three socio- economic groups.
During the eighteenth century Gilze and Rijen were mainly agricultural villages with
3 Ch. C. V. Verreyt, 'Brand te Gilze in 1762', Taxandria, 21 (1914), pp. 63-65. 4 In Longuenesse, France, for example, so called libri status animarum for the years 1778-90 have been
preserved. See P. Laslett, Family Life and Illicit Love in Earlier Generations: Essays in Historical Sociology (Cambridge, 1977).
5 Long series of population listings have been preserved in Japan. See A. Hayami and N. Uchida, ' Size of household in a Japanese county throughout the Tokugawa era' , in Household and Family in Past Time: Comparative Studies in the Size and Structure o f the Domestic Group over the Last Three Centuries in England, France, Serbia, Japan and Colonial North America, ed. P. Laslett (Cambridge, 1972), pp. 473-515.
Listings exist for a couple of villages in the area around Breda, which is called the Baronie. In two villages the listings cover a longer period. However, in one of these, Terheijden, the listings before 1763 are not as elaborate. Although the listings in Princenhage start in 1700, and are more complete than those in Gilze and Rijen, Gilze and Rijen were chosen partly because the local archivist G. J. Rehm has prepared a family register which contains all the information on the listings. The listings for the years 1703-15 contain little information other than names of the head of the household and amount of tax paid. The listing for 1724 is incomplete. From 1725, listings are complete with only two minor gaps in 1793 ~ , and 1806. This study was limited to the years 1725 1805. The family register and the original listings are kept in the local archive at the Gemeentehuis in Rijen.
7 Burial records are incomplete. However, most deaths could be inferred from the poll-tax records. Whenever an infant or child below the age of five was missing from the poll-tax records, and at least one parent was still recorded as living in one of the villages, it has been assumed that it had died. The date of death in these cases is only known as occurring during the ' tax year'.
The date of the population census varied. In most years the census was taken in July or August. Hence, the length o f ' t a x years' varies from 11 to 13 months. This variation has been taken into account by using months of exposure instead of average population as a denominator when computing mortality rates.
s Incomplete birth registration before 1762/3 also caused some problems. The age of children born before 1762 is an approximation, since their month of birth is unknown. It has been assumed that these children were born in the middle of the ' tax year'. This comes out to be approximately in January or February. Hence, the age group 1-5 may include some aged between six months and one year, and some aged between 5 and 54 years. On the other hand some aged between 1 and 1½ years and some aged between ~ and 5 years are not included. These inclusions and omissions tend to cancel each other out, although not completely. Therefore, the estimates of early childhood mortality rates for 1726~52 may be slightly biased in an upward direction.
Dow
nloa
ded
by [
Nip
issi
ng U
nive
rsity
] at
14:
25 0
8 O
ctob
er 2
014

EIGHTEENTH-CENTURY DUTCH MORTALITY LEVELS 393
little if any cottage industry. 9 In Western Europe farmer households were usually larger than households of agricultural labourers, since the latter sent their sons and daughters to serve in farmer households. This feature makes it possible to divide the households into different socio-economic groups by using the size of the labour force living in the household as a criterion (see Appendix for further details). These socio-economic groups correspond, approximately, to farmers, cottagers and agricultural labourers. Mortality levels and change for these groups will be analysed separately.
M O R T A L I T Y LEVELS AND C H A N G E BY S O C I O - E C O N O M I C G R O U P
According to Sharlin 'one would expect to find occupational variations in fertility and nuptiality, but not in mortality' in eighteenth-century Western Europe? ° He argued that all 'are subject to the same environmental conditions- the same sources of water and means of waste disposal, the same epidemiology including plagues and various other contagious diseases, the same effects of war, and generally similar diets including times of deprivation due to harvest failure'. H Studies of urban populations, however, do not seem to support Sharlin's argument. Perrenoud has shown that substantial differences existed between upper and lower classes in seventeenth-century Geneva. 12 Finlay found large differences for late sixteenth to mid-seventeenth century London. la The estimated difference in life expectancy between the poorest and wealthiest sections of these urban populations was 10-15 years? 4 Galloway recently published some estimates of life expectancy at birth for different social strata in eighteenth-century Rouen. These figures show differences of approximately eight years between labourers and notables? 5
Whereas urban studies have often pointed to the existence of substantial mortality differentials, village studies usually stress the similarity of mortality patterns among poorer and wealthier sections of the population. For example, in Knodel's study of 14 German village populations, mortality within these villages appears to have been similar in different social strata. TM However, the villages studied here are unlike all other villages
9 According to the Census of 1810, 56 per cent of the households were engaged in agriculture, while an additional 27 per cent consisted of agricultural labourers.
lo A. Sharlin, 'Methods for estimating population total, age distribution and vital rates in family reconstitution studies', Population Studies, 32 (1978), pp. 511-52 I.
11 A. Sharlin, loc. cit. in footnote II, pp. 512-513. 12 A. Perrenoud, 'L'in6galit6 sociale devant la mort /~ Gen~ve au XVIF sibcle', Population, 30, Num~ro
Special (1975), pp. 211 243. la R. A. P. Finlay, 'Gateways to death? London child mortality experience, 1570-1653', Annales de
D6mographie Historique (1978), pp. 105-134. 14 Perrenoud estimated life-expectancy at birth to be 18.5 years for the lower class oflabourers, 24.7 for the
middle class and 35.9 for the upper class. Basing ourselves on the probability of dying among infants (q0) and children between age 1 and 5 (4ql) as reported by Finlay 0978), loc. cir. in footnote 13, and using model life tables from A. J. Coale and P. Demeny, Regional Model Life Tables and Stable Population (Princeton, 1966), we estimated life expectancy for different parishes in London to have ranged from 25.0 to 43.5.
1~ Life expectancy at birth in the second half of the eighteenth century is estimated to have been 24.5 years among labourers and 32.5 years among notables. See P. R. Galloway, ' Differentials in demographic responses to annual price variations in pre-revolutionary France: a comparison of rich and poor areas in Rouen, 1681 to 1787', European Journal o f Population, 2 (1986), pp. 269-305.
16 See John E. Knodel, Demographic Behaviour in the Past: A Study of Fourteen German Village Populations in the Eighteenth and Nineteenth Centuries (Cambridge, 1988), p. 74. See also B. Derouet, 'Une d6mographie diff~rentielle: cl~s pour un syst~me auto-r~gulateur de populations rurales d'Ancien R~gime', Annales E, conomies Socidtds Civilisations, 35 (1980), pp. 3-41, for mortality figures on 14 French parishes which also suggest little differential mortality. P. Thestrup, ' Methodological problems of a family reconstitution study in a Danish rural parish before 1800', The Scandinavian Economic History Review, 20 (1972), pp. 1 26, has provided evidence for differential infant mortality (q0) among farmers and cottagers (243 and 326 per 1,000 births respectively). Using Model West life tables from Coale and Demeny's Regional Model Life Tables (op. cit. in footnote 15) for both occupational groups, these mortality figures would correspond to life expectancy at birth of approximately 31 for farmers and 22.5 for cottagers and lodgers. However, using Model East for the cottagers and lodgers would give a much higher estimate of 27.5 years.
Dow
nloa
ded
by [
Nip
issi
ng U
nive
rsity
] at
14:
25 0
8 O
ctob
er 2
014

394 J O N A S C H E L L E K E N S
Table 1. Early childhood mortality rates (per 1,000) and life expectancies at birth by socio-economic class in 1726-1805
Class
Early Life expectancy No. of years childhood of exposure mortality Model Model Combi- between
4ml West North nation a age 1 and 5
Lower 55.8 27.7 30.9 30.9 2600.8 Middle 35.2 38.0 41.4 38.0 4659.5 Upper 24.6 45.2 48.5 45.2 3459.7
a Model North for lower class and Model West for middle and upper class.
studied so far in that large mortality differentials between socio-economic groups are found, as can be seen in Table 1. The estimated difference between the life expectancies of the lower and upper classes exceeds ten years, whether Model West, Model North, or a combination of these, in Coale and Demeny's Regional Model Life Tables is used. 17
Somewhat better estimates for life expectancy at birth may be obtained for the second half of the period studied (1763-1805), when infant mortality rates can be computed. Infant and early childhood mortality rates for this period are shown in Table 2. It can be seen that mortality differentials among infants are small compared to those among children aged 1-5. The reason is probably the prolonged period of breastfeeding which was customary among all classes. Mortality rates for the lower class seem to fit Model North of Coale and Demeny's Regional Model Life Tables better, while the rates for the middle and upper classes seem to fit Model West better. However, both models give similar estimates for life expectancy at birth, which range from 37.5 for the lower to 47.2 for the upper class.
Table 2. Infant and early childhood mortality rates (per 1,000) and life expectancy at birth by socio-economic class in the period 1763-1805
Li~ expectancy Early
Infant childhood Model Model Combi- Class mortality mortality West North nation a
Lower 180.0 45.2 37.5 37.5 37.5 Middle 197.7 31.5 40.4 40.3 40.4 Upper 156.2 20.4 47.3 47.1 47.3
a Model North for lower class and Model West for middle and upper class.
No estimates of infant mortality are available before 1762/3. Hence, our estimates of life expectancy at birth for 1726-62 are based on early childhood mortality only. Mortality levels seem to have been higher then for all socio-economic groups. Assuming similar age patterns of mortality before and after 1763 - Model North for lower class and Model West for middle and upper c lass - the estimates of life expectancy for 1726-62 range from 26.6 for the lower class to 41.9 for the upper (see Table 3).
According to our estimates, mortality was relatively low in 1763-1805. Life expectancy at birth rose among all classes, but especially among the lower class (see Table 3).
17 Judging by the ratio of the infant mortality rate (lm0) and the early childhood mortality rate (4ml) Models West and North, depending on the class, seem to fit mortality experience in Gilze and Rijen best. For the mortality models used see Coale and Demeny, op. cit. in footnote 14.
Dow
nloa
ded
by [
Nip
issi
ng U
nive
rsity
] at
14:
25 0
8 O
ctob
er 2
014

E I G H T E E N T H - C E N T U R Y D U T C H M O R T A L I T Y L E V E L S 395
Table 3. Early childhood mortality rates (per 1,000) and life expectancy at birth e o for 1726-62 and change in e o by socio-economic class f r o m 1726-62 to 1763-1805
Life expectancy Early at birth 1726~52
childhood Change in e 0 mortality Model M o d e l Combi- from 1726452
Class 1726452 West North nation a to 1763-1805
Lower 67.5 23.4 26.6 26.6 10.9 Middle 39.1 35.7 39.0 35.7 4.7 Upper 29.2 41.9 45.3 41.9 5.4
Model North for the lower class and Model West for the middle and upper class.
FACTORS AFFECTING MORTALITY LEVELS
In this section we try to identify social and environmental determinants of the mortality differentials we have found. For this purpose we use an adapted version of Mosley's analytical framework for infectious diseases, which are the most likely candidates for explaining these differences. TM
Mosley distinguished between five variables that intervene between social and en- vironmental determinants and mortality. These include:
(1) Infectious dose of the agent. (2) Mechanism of transmission. Agents may be transmitted through water, food,
animals, air, or direct contact between human beings. (3) Generation time and duration of infectiousness of the host. The generation time
represents the interval between the entry of the agent into the host until peak infectiousness occurs. The duration of infectiousness of the host represents the period during which the host is actively excreting the agent.
(4) Gradient of illness. There is a great variability in the fatality rates of different diseases. Host factors, such as age and nutrition, also influence the gradient of illness.
(5) Immunity. These five intervening variables may be classified into two groups. The first three are
related to the likelihood of contracting a disease, while the last two are related to the likelihood of surviving once a disease has been contracted. The likelihood of contracting a disease is determined by a number of social and environmental factors, such as the degree of overcrowding, personal hygiene as expressed in cleanliness of clothing and b o d y - especially h a n d s - the quality of the water, and the degree to which food is infected. The likelihood of surviving a diseaseis related to age and nutrition, among others. We shall show that differential mortality in Gilze and Rijen was probably not related to a differential likelihood of surviving, but rather to differentials in the chance of contracting certain diseases.
Nutrit ion is ' the most important acquired host factor modulating the gradient of illness' and probably also immunity. 19 According to McKeown a supposedly high level of malnutrition caused high mortality in the past. 2° Therefore, the mortality differential in Gilze and Rijen may have been caused partially by malnutrition among the poorer sections of the population. However, several studies have shown that nutrition may have been less important during the eighteenth century, than it was previously. Bruneel has
as W. H. Mosley, ' Biological contamination of the environment by man', in Biological and Social Aspects of Mortality and the Length of Life, ed. S. H. Preston (Libge, 1980), pp. 3~68.
a9 Mosley, loc. cit. in footnote 18. 20 McKeown, Ioc, cir. in footnote 2.
Dow
nloa
ded
by [
Nip
issi
ng U
nive
rsity
] at
14:
25 0
8 O
ctob
er 2
014

396 JONA SCHELLEKENS
noted, that from the first quar ter of the eighteenth century the l ink between famine and mortal i ty disappeared in rural Brabant . 21 Gal loway found little evidence of a nu t r i t i on -mor ta l i ty l ink in eighteenth-century Rouen. 22
Judging by the lack of any significant correlat ion between the price of rye 23 - the main
cereal c o n s u m e d - and child mortal i ty among children of agricultural labourers between the ages of one and five years, there does no t seem to have been a nu t r i t i on -mor ta l i t y l ink in Gilze and Rijen. No significant rise in early chi ldhood
mortal i ty (4ml) was found among the lower class dur ing years when the price of rye was
high. Neither was there any rise in 4ml in the lower class one to two years after a year with high prices (see Table 4). Also, no rise in 4ml was observed among the lower class after two consecutive years of high prices (see Table 5). 24 Actually, mortal i ty was higher
dur ing periods when the price of rye was low, because most morta l i ty crises did not coincide with, or occur immediately after, years with relatively high prices of rye.
Table 4. Early childhood mortality 4ml (per 1,000) among the lower class in years following a rise in the price of rye, and in other years during the period 1726-1805
Mortality during years following a rise in the price Mortality in
of rye other years
Lag No. of No. of (years) 4ml years a 4ml y e a r s Significance
0 51.1 12 60.0 66 0.69 1 47.3 11 60.5 66 0.76 2 45.9 10 60.4 66 0.77
a The number of years decreases as the lag increases, since years with relatively high prices of rye are heaped at the end of the period studied.
Table 5. Early childhood mortality 4ml (per 1,000) among the lower class in years following periods of two consecutive years with high prices, and in other years during the period 1726-1805
Mortality during years following a rise in the price Mortality in
of rye other years
Lag No. of No. of (years) amt years 4rnl y e a r s Significance
0 43.6 11 44.0 58 0.52 1 38.6 10 44.6 58 0.70 2 36.1 9 44.5 58 0.76
21 C. Bruneel, ' La mortalit6 dans les campagnes: Le Duch~ de Brabant aux XVII e et XVIII e si~cles', Recueil de Travaux d'Histoire et de Philologie, 6 e s~rie, fascicule 10 (1977).
2~ Galloway, Ioc. eit. in footnote 15. 23 The price of rye used in the analysis is that at the Amsterdam market. Price series in nearby Breda are
not as complete, but are highly correlated with Amsterdam prices. See N. W. Posthumus, Nederlandse Prijsgeschiedenis, vol. 2 (Leiden, 1964).
24 No serial correlation was found to exist among 4ml of the lower class. Therefore, a simple t test was used to test the hypothesis of no difference of 4ml between periods following high prices, and other periods.
Dow
nloa
ded
by [
Nip
issi
ng U
nive
rsity
] at
14:
25 0
8 O
ctob
er 2
014

E I G H T E E N T H - C E N T U R Y D U T C H M O R T A L I T Y L E V E L S 3 9 7
Since nutrition (as indexed by the price of rye), did not explain any of the differential mortality, we turn to the other category of intervening var iables- the likelihood of contracting a d isease- and their determinants. In particular, we shall consider the mechanism of transmission, which makes it possible to put relevant environmental factors into the framework. McKeown has differentiated between five kinds of infectious diseases, according to their mechanism of transmission :25
(1) Water-borne diseases, such as cholera and typhoid, are associated with a polluted water-supply. Cholera reached Europe during the nineteenth century and is, therefore, of no relevance here. 26
(2) Food-borne diseases, such as dysentery, which are associated with personal hygiene, such as cleanliness of the hands. Typhoid also belongs to this category.
(3) Animal-borne diseases, such as typhus. Typhus, which is transmitted by lice, is associated with overcrowding and lack of personal hygiene, such as clean clothing.
(4) Air-borne diseases, such as smallpox, measles and tuberculosis, are also associated with cramped living conditions.
(5) Diseases caused by direct contact between human beings, such as syphilis. The last category, generally, is not responsible for very many deaths, and we may,
therefore, discard it. 27 Differential mortality from water-borne diseases was probably limited, as will be shown below. This leaves one or more of food-, animal-, or air-borne diseases as the more likely candidates for explaining differential mortality.
The quality of water supplies is supposed to have been responsible for some of the differential mortality in cities. This mortality was usually associated with the segregation of the living quarters of the poorer and the wealthier sections of urban populations, za However, in villages, such as Gilze and Rijen, this segregation existed only to a very limited extent, as may be seen clearly from the Census of 1810, in which the number of households were listed by occupation of the head of household and by neighbourhood or hamlet. 29 Agricultural labourers were to be found in significant numbers in 16 of the 17 neighbourhoods defined in the census. Nowhere did they amount to more than 60 per cent of the population, and usually to much less (see Figure 1).
Having discounted water-borne diseases as a likely candidate for explaining differential mortality, we now consider food-, animal-, and air-borne diseases. By examining causes of death, we shall try to show that overcrowding as well as relatively poor hygiene among the lower class explain part of the differential mortality.
Causes of death were not generally registered in the burial records. Only one case is known, for which the cause of death was registered, and this was a case of dysentery in 1781. 30 Nevertheless, it is possible to determine the principal cause of death in many years of high mortality indirectly, since most of the more severe epidemics also occurred in other areas of Western Europe at about the same time. This is especially true for the lower class. Nine out of the ten years with the heaviest early-childhood mortality among
25 T. McKeown, The Modern Rise of Population (London, 1976), pp. 110~115. 26 M. W. Flinn, The European Demographic System 1500-1820 (Baltimore, 1981), p. 94. 27 McKeown, op. cit. in footnote 25, p. 15. 28 For instance, the high mortality in the London parish of St Mary Somerset between years 1605 and
1653 relative to other London parishes may have been related to its location near the Thames. See Finlay, loc. cit. in footnote 13. For segregation in pre-industrial cities see G. Sjoberg, The Pre-industrial City, Past and Present (New York, 1960).
29 The results of the Census of 1810 are kept at the Rijksarchief Antwerpen (Provinciaal Archief Antwerpen, J.168A and J.169).
30 The year 1781 was not one in which early childhood mortality (4m~) in Gilze and Rijen was exceptionally high. An epidemic of dysentery hit some villages in the nearby area of the Meierij during the same year. See H. F. J. M. van den Eerenbeemt, ' De " R o d e D o o d " in Stad en Meierij; een Dysenterie-Epidemie in de Jaren 1779-1783', Economisch- en SociaaI-Historisch Jaarboek, 36 (1973), pp. 75-101.
Dow
nloa
ded
by [
Nip
issi
ng U
nive
rsity
] at
14:
25 0
8 O
ctob
er 2
014

398 J O N A S C H E L L E K E N S
HEIKANT
LAAREINDE, HOEK & LEEGSTRAAT
i l l RUEN
[ ~ MOLENSCHOT ~]~ HAANSBERG
HOILTEN F ~
~ AART & ~ NERHOVEN v ~ U R G VOSSENBF
O' ZE
LANGERIJT ~ HORST [~] I ~
Figure 1. Proportion of households of agricultural labourers in Gilze and Rijen neighbourhoods and hamlets in 1810. Iqq, No households of agricultural labourers; [ ] , 1-20 per cent; J , 2 1 4 0 per cent; i , 41-60 per cent.
the lower class were found to coincide with mortality crises in the Netherlands, England and Germany. For instance, the 1727/8 epidemic among the lower class in Gilze and Rijen was probably connected with the mortality crises between August 172~/and spring 1730 in England, 31 while the epidemic of 1736/7 was probably connected with a mortality crisis in Germany that occurred during the same year. 3~ In these two cases the major cause of death is not known. The 1742/3 epidemic may have been a continuation of the dysentery epidemic that hit neighbouring Brabant in 1741. The mortality crisis from July 1741 to October 1742 in England was probably caused by this dysentery epidemic. 33 There is greater certainty about the cause of the 1746/7 epidemic. This was probably due to dysentery, since Brabant was hit by a dysentery epidemic during the latter half of 1746. 34 That year's high mortality may have been a continuation of the high
zl E. A. Wrigley and R. S. Schofield, The Population History o f England 1541-1871 (Cambridge, 1981), p. 681.
32 j. D. Post, 'Climatic variability and the European mortality wave of the early 1740s', Journal o f Interdisciplinary History, 15 (1984), pp. 1-30.
zz Bruneel, Ioc. cir. in footnote 21, and Wrigley and Schofield, op. cit. in footnote 31, p. 669. 34 Bruneel, loc. cit. in footnote 21.
Dow
nloa
ded
by [
Nip
issi
ng U
nive
rsity
] at
14:
25 0
8 O
ctob
er 2
014

EIGHTEENTH-CENTURY DUTCH MORTALITY LEVELS 399
mortal i ty in 1745/6. The 1748/9 epidemic, which was the worst that affected the lower class, was probably caused by dysentery. In 1748, the last year o f the War o f the Austr ian Succession, the French invaded the Dutch Republic and laid siege to a town not far f rom Gilze and Rijen. This epidemic may have been transmitted by soldiers f rom the Meuse area, where an epidemic o f dysentery occurred in 1747. 35 The timing of the epidemic, starting in August , also suggests it may have been caused by dysentery. Typhus occurred in the Rhine area in Germany during the early 1760s. 30 Hence, typhus is likely to have caused the high mortal i ty o f 1761/2. 1776/7 is the only year with relatively high mortali ty, for which no evidence was found elsewhere. A dysentery epidemic hit the neighbouring village o f Tilburg in 1779. 37 We may, therefore, assume an epidemic o f dysentery was the cause o f the above average early chi ldhood mortal i ty in 1779/80 in Gilze and Rijen. Typhus caused a mortal i ty crisis in Bavaria and Swabia in 1799. 3s Hence, the 1800/1 epidemic may have been caused by typhus.
Morta l i ty crises among the middle and upper classes often did not coincide with those among the lower class (see Table 6). Mortal i ty crises a m o n g the middle and upper classes tended to be relatively less severe. The probable cause o f death during crises a m o n g the middle and upper classes could only be established for two and three years respectively. 30
Table 6. The ten years o f highest early childhood mortal i ty by socio-economic class during the period 1726-1805
Lower class Middle class Upper class
Rank 4ml Year 4ml Year 4ml Year
1 346.8 1748/9 144.3 1734/5 116.1 1752/3 2 251.4 1761/2 125.0 1773/4 85.9 1790/1 3 179.3 1745/6 107.9 1768/9 80.5 1742/3 4 173.6 1742/3 89.2 1748/9 75.6 1803/4 5 133.9 1800/1 87.6 1752/3 74.9 1773/4 6 121.4 1736/7 81.0 1774/5 71.5 1748/9 7 115.3 1779/80 77.6 1766/7 67.6 1747/8 8 114.9 1746/7 71.1 1730/I 64.5 1734/5 9 108.2 1776/7 69.8 1750/1 64.3 1751/2
10 104.7 1727/8 67.8 1743/4 63.3 1749/50
The eight severest mortal i ty crises among the lower class all occurred during or immediately after wars (see Table 7). This may explain why dysentery and typhus were found to be the main causes o f the mortal i ty crises a m o n g the lower class in Gilze and Rijen. Dysentery was often transmitted by soldiers to civilian populat ions and was known as a soldier's disease. 4° Typhus acquired the name 'war -p lague ' , because it
z8 M. P. Gutman, War and Rural Life in the Early Modern Low Countries (Princeton, 1980), p. 230. 3e F. Prinzing, Epidemics Resulting from Wars (Oxford, 1916), p. 84. 37 Van den Eerenbeemt, loc. cit. in footnote 30. 38 Prinzing, op. cir. in footnote 36, p. 98. 38 The mortality crisis in 1734/5 among the middle class, which also affected the upper class, but not the
lower class, may have been caused by typhus. In 1734 typhus appeared along the Rhine in Germany. See Prinzing op. cit. in footnote 36, p. 80. The 1748/9 mortality crisis, which was probably caused by dysentery, affected all three classes. The 1742/3 crisis, which was also probably caused by dysentery, affected the lower and the upper classes, but not the middle class. Maybe the relatively high mortality among the middle class in 1743/4 and among the upper class in 1749/50 were a continuation of mortality crises in previous years.
40 For example, many died of dysentery, when dysentery-infected soldiers entered the city of 's-Hertogenbosch in 1701. The 1779 dysentery epidemic was transmitted to the Meierij by a woman returning from the town of Weert, which had been affected by soldiers returning from Germany. See van den Eerenbeemt, op. cit. in footnote 30.
Dow
nloa
ded
by [
Nip
issi
ng U
nive
rsity
] at
14:
25 0
8 O
ctob
er 2
014

400 JONA SCHELLEKENS
Table 7. Early childhood mortality rates (4ml) (per 1,000) among the three classes, major causes of death and wars in years of mortality crises among the lower class
4ml Likely
Lower Middle Upper major cause Year class class class of death War
1736/7 121.4 45.5 20.0 ? Polish Succession 1742/3 173.6 31.7 8 0 . 5 Dysentery Austrian Succession 1745/6 179.3 32.3 42.6 Dysentery Austrian Succession 1746/7 114.9 53.6 44.4 Dysentery Austrian Succession 1748/9 346.8 89.2 7 1 . 5 Dysentery Austrian Succession 1761/2 251.4 32.8 1 7 . 2 Typhus Seven Years 1779/80 115.3 0.0 24.4 Dysentery Bavarian Succession 1800/1 133.9 30.3 3 0 . 3 Typhus Second Coalition
appeared in almost every war between the beginning of the sixteenth and the middle of the nineteenth centuries. 41
Dysentery and typhus were not the only diseases associated with wars. Prinzing names six diseases which deserve the name of 'war pestilences': 4z typhus, bubonic plague, cholera, typhoid, dysentery and smallpox. Of these, bubonic plague and cholera, did not occur in eighteenth-century Northwest Europe. No evidence of smallpox and typhoid epidemics was found in Gilze or Rijen. Smallpox may have been more endemic than epidemic. 43 Typhoid may have been confused with typhus. 44
Comparing mortality rates between classes during years when epidemics of dysentery are assumed to have occurred, large differences in mortality are noticed (see Table 7). Although four to six years of dysentery epidemics are insufficient for statistical analyses, they suggest that differential mortality may have been related to a differential likelihood of contracting food-, and animal-borne diseases, such as dysentery. It is, therefore, likely, that differential mortality in Gilze and Rijen was related in part to differences in hygiene. Dysentery was often transmitted through food that had been touched by infected hands, while other methods of transmission, for instance through water, were less common. 45 More frequent use of personal instead of communal silverware by the more wealthy, which was becoming more common since the second half of the seventeenth century, could have had some effect on the incidence of diseases such as dysentery among the wealthier sections of the population. 46
We know relatively little about differential levels of hygiene. We know more about housing conditions. The number of people per room - or bedstead - was probably larger among the lower class. Hence, we would expect a higher mortality from louse-borne typhus among the lower class. Although two mortality crises, which were probably caused by typhus, in 1761/2 and 1800/1, can hardly be called evidence, differential mortality levels during these crises do lend support to our assumption, that there was a link between overcrowding and mortality (see Table 7).
FACTORS AFFECTING CHANGE
Early-childhood mortality was relatively low during the second half of the eighteenth century among all groups (see Tables 2 and 3), and this was also true of other parts of
41 Prinzing, op cit. in footnote 36, p. 328. 48 Prinzing, op. cit. in footnote 36, p. 4. 43 Wrigley and Schofield, op. cit. in footnote 31, p. 669. 44 McKeown, op. cit. in footnote 25, p. 59. 4s Bruneel, op. cit. in footnote 21, p. 524. 46 A. Somers Cocks, 'Baroque silver, 1610-1725 ', in The History o f Silver, ed. C. Blair (New York, 1987),
p. 102.
Dow
nloa
ded
by [
Nip
issi
ng U
nive
rsity
] at
14:
25 0
8 O
ctob
er 2
014

EIGHTEENTH-CENTURY DUTCH MORTALITY LEVELS 401
Europe . 47 M c K e o w n cons idered improved nut r i t ion to have been the m a j o r reason, as
However , this does not seem to be t rue o f Gi lze and Rijen. N o n u t r i t i o n - m o r t a l i t y link seems to have existed at this per iod. Hence, an i m p r o v e d food supply is unl ikely to have been the cause for the rise in life expec tancy a m o n g the lower class. Ne i the r does an improvemen t in food supplies expla in a rise in life expec tancy a m o n g the weal th ier sections o f the popu la t ion . Three a l te rna t ive exp lana t ions are : improvemen t s in the water supply, less ove rc rowding and bet ter hygiene. However , little is k n o w n a b o u t changes in any o f these.
L o o k i n g more closely at the years o f ex t reme ear ly ch i ldhood mor t a l i t y ( ranked 1-8 in Table 6) a m o n g the lower class, we not ice tha t these years are not scat tered r a n d o m l y th rough the whole pe r iod s tudied, but ra ther c lus tered a r o u n d years o f war fa re in Wes te rn o r Cen t ra l Europe (see Tab le 7). All wars fought between 1726 and 1805 were accompan ied by mor ta l i t y crises a m o n g the lower class in Gilze and Rijen. 40 Dur ing the Aus t r i an W a r o f Succession, especially, the lower classes in Gilze and Rijen were affected by high mor ta l i ty . Mor t a l i t y crises dur ing this war account for much o f the higher mor ta l i t y levels in 1726~2 . The impac t o f the epidemics dur ing this war is borne ou t by the fact tha t app rox ima te ly five years or 46 per cent o f the es t imated difference o f 10.9 years between the life expec tancy at b i r th a m o n g the lower class in 1725-62 and 1763-1805 is expla ined by the mor ta l i t y crises dur ing the W a r o f the Aus t r i an Succession (see Table 8). 50 Mor t a l i t y crises dur ing the W a r o f the Aus t r i an Succession also expla in much o f the relat ively high mor t a l i t y levels in 1726-62 a m o n g the middle and upper classes.
Table 8. Life expectancy and change in life expectancy at birth e o by socio-economic class without the war years 1740-49
Without war years With war years
e0 eo
Class 17264/2 1763-1805 Change 1726-62 1763-1805 Change
Lower 31.6 37.5 5.9 26.6 37.5 10.9 Middle 37.0 40.4 3.4 35.7 40.4 4.7 Upper 45.0 47.3 2.3 41.9 47.3 5.4
As the incidence o f wars in Wes te rn and Cent ra l E u r o p e d iminished, years with ext reme mor ta l i t y in Gilze and Rijen, especial ly a m o n g the lower class, became less frequent . The existence o f a connec t ion between wars and epidemics , and between the m o v e m e n t o f soldiers and the incidence o f epidemics in par t icu la r , has, o f course, been no ted previously. 51 However , few studies have shown warfa re to be o f such impor t ance
47 Flinn, op. cit. in footnote 26, pp. 91-95. 4s McKeown, op. cit. in footnote 25. 49 It is not known, whether the War of the First Coalition was accompanied by a mortality crisis, since no
mortality rates could be computed for 1792-5. 5o When estimating change in life expectancy at birth (%) the Model North estimates for e o among the lower
class and the Model West estimates for the other two classes were used. Since population listings for 1793 and 1794 are missing, mortality rates from 1792/3 to 1794/5 are unknown. However, to invalidate our conclusions, a mortality crisis which was more severe than those in the 1740s would be needed. This is unlikely, because such a crisis would have left its imprint on the population structure in following years.
5~ The connection between wars and epidemics, and especially soldiers and epidemics, was already noted in the eighteenth century. See van den Eerenbeemt, loc. cit. in footnote 30. See also Prinzing, op. cit. in footnote 36. It has been observed that many of the mortality crises in eighteenth-century Germany coincided with wars. See E. Franqois, 'La mortalit6 urbaine en Allemagne au XVIII e sibcle', Annales de Ddmographie Historique (1978), pp. 135-165.
Dow
nloa
ded
by [
Nip
issi
ng U
nive
rsity
] at
14:
25 0
8 O
ctob
er 2
014

402 J O N A S C H E L L E K E N S
when explaining mortality change. It is possible, that Gilze and Rijen were unrepresentative of other villages in Europe, because of their proximity to the international border and the presence of relatively large numbers of soldiers during times of war.
D I S C U S S I O N
In this study we have presented mortality estimates for different socio-economic groups in an agricultural community. Large differences were found to exist between these groups. Although similar differences are not unheard of in cities, they were rarely found in European villages. While the estimated life expectancy of agricultural labourers is within the range of most village populations in the eighteenth century, life expectancy at birth for the farmers was relatively high. The reason is not difficult to guess. The Netherlands were among the wealthiest nations at that time. The English alone, probably, surpassed the Dutch in standard of living, at least during the second half of the eighteenth century. In England also sub-populations with high life expectancies at birth may be found, such as Finlay's among farmers in Cartmel. 52 Thus, it seems that Sharlin's hypothesis of an absence of occupational variations in mortality, may need to be modified.
The differential mortality in Gilze and Rijen was probably not related to malnutrition or polluted water supplies. Relative overcrowding and poor hygiene among agricultural labourers were much more probable causes. Overcrowding may also have affected the chances of contracting air-borne diseases, such as smallpox, measles and tuberculosis. It is unlikely that farmers washed their hands more often. Possibly, they changed their clothes more often, and this could lower their chances of being infected with the louse- borne typhus. Or else, they may have used more individual tableware, which could have lowered their chances of contracting dysentery.
McKeown has argued that the European rise of population of the eighteenth and early nineteenth centuries can only be explained in terms of nutrition levels. 53 Flinn suggested that a reduced contact between military and civilian populations may also have had some influence on the level of mortality. 54
No indication for the existence of a nutrition-mortality link was found in Gilze and Rijen - at least as indicated by the price of rye. It was found, that the eight years with the highest mortality among the lower class occurred during or immediately following wars fought in Western or Central Europe. As there was a diminution in the amount of military activity and movement on land in Europe after the War of the Austrian Succession, there was a drop in the frequency of years of extreme mortality. These observations are consistent with the argument put forward by Flinn.
In general, differences in the standard of living explain the differential mortality levels in Gilze and Rijen. However, political changes affecting the spread of disease like dysentery and typhus, rather than an improvement in the standard of living, seem to explain much of the change in mortality levels.
A C K N O W L E D G E M E N T S
The author wishes to express his gratitude to the Israel Foundation Trustees for earlier financing of the project of which this article forms part. Thanks are due to the Lady
5~ R. Finlay, 'Differential child mortality in pre-industrial England: the example of Cartmel, Cumbria, 1600-1750', Annales de Ddmographie Historique (1981), pp. 67-79.
53 McKeown, op. cit. in footnote 25. ~4 Flinn, op. cit. in footnote 26, p. 95.
Dow
nloa
ded
by [
Nip
issi
ng U
nive
rsity
] at
14:
25 0
8 O
ctob
er 2
014

EIGHTEENTH-CENTURY DUTCH MORTALITY LEVELS 403
Davis Fellowship Trust for the 1988-9 fellowship under which part of the work for this
paper was done. Thanks are also due to Rona ld Freedman, Dov Fr iedlander and John
Wi lmoth who read earlier versions of this paper and made impor t an t comments .
APPENDIX
Households were divided into socio-economic groups according to the average number of males above the age of 16 living in the household over the years. Households with fewer than one male above the age of 16 were defined as lower class. Households with fewer than two males but at least one male on average above the age of 16 were defined as middle class. Households with at least two males above the age of 16 were defined as upper class.
The average number of males above the age of 16 among agricultural labourers is not expected to exceed one, since almost all their sons went into service before that age. Hence, we expected our lower class to correspond to the occupational group of the agricultural labourers. The Census of 1810, in which households are listed by occupation of the head, gives a proportion of 26.8 per cent for households of agricultural labourers. This figure may be compared with the percentage of households, categorized by us as belonging to the lower class in the last population listing of 1808. In 1808 we counted 27.3 per cent of households as belonging to the lower class. The two percentages are close, suggesting that our lower class includes mostly agricultural labourers.
Socio-economic indicators exist for some of the households, which enabled us to check the degree to which our classes reflect a socio-economic stratification. Tax records in which the number of horses and cows in each household in 1717 are given show that statistically significant differences existed between our classes as far as ownership of farm animals is concerned. Most households counted in 1717 still existed in 1725, and from that year onwards reliable poll-tax records exist. Among the upper class close to 90 per cent of the households owned at least three cows compared with 50 per cent among the lower class (see Tables 9 and 10).
Table 9. Number of cows owned by households in 1717 by class
Proportion of households with No. of
Class No cows 1-2 cows 3 + cows Total households
Lower 17.2 32.8 50.0 100.0 64 Middle 9.5 27.0 63.5 100.0 74 Upper 1.7 8.5 89.8 100.0 59
Table 10. Number of horses owned by households in 1717 by class
Proportio n of households No. of
Class No horses l + horses Total households
Lower 52.4 47,6 100.0 63 Middle 44.4 55.6 I00.0 72 Upper 16.9 83.1 100.0 59
A sample of 54 recorded divisions of inheritances between 1725 and 1785 shows a statistically significant difference between the size of holdings of the middle and upper class as defined by us (see Table 1 l). From 1737 onwards all heirs were required to sign their name on the agreement for the division of inheritances. Those unable to sign their name, signed with an 'X ' . All inheritances during the period 1737-85 which were recorded in the court rolls of Gilze and Rijen were scanned for signatures. A reasonable amount of cases from the lower class were found to be included in the computations. For each household the proportions of sons and daughters, who were able to sign, were computed. The ability to sign one's name was found to be statistically correlated with status among men as well as women (see Table 12).
Dow
nloa
ded
by [
Nip
issi
ng U
nive
rsity
] at
14:
25 0
8 O
ctob
er 2
014
404 J O N A S C H E L L E K E N S
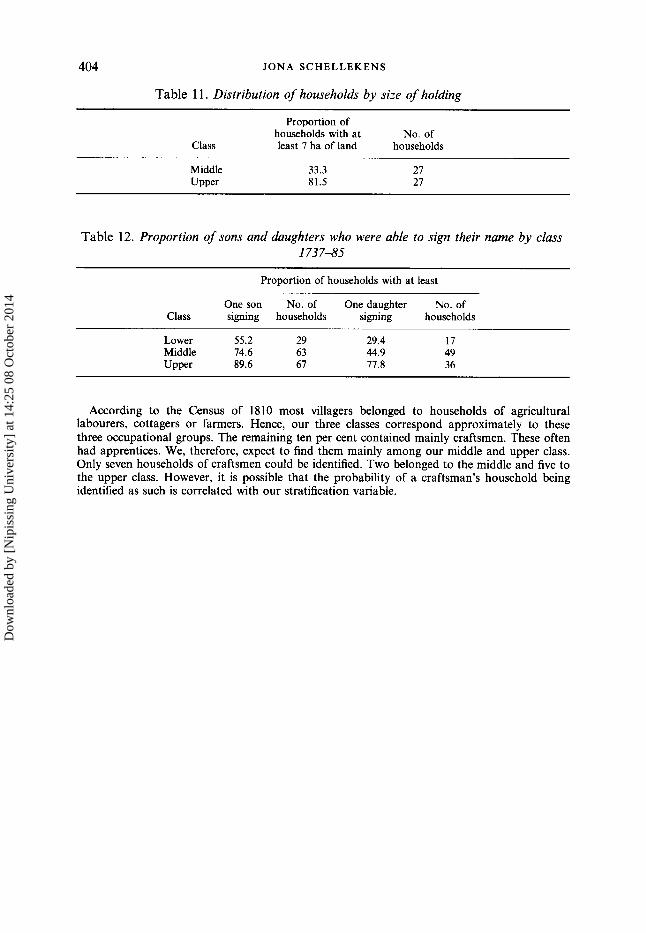
Table 11. Distribution of households by size of holding
Proportion of households with at No. of
Class least 7 ha of land households
Middle 33.3 27 Upper 81.5 27
Table 12. Proportion of sons and daughters who were able to sign their name by class 173 7--85
Proportion of households with at least
One son No. of One daughter No. of Class signing households signing households
Lower 55.2 29 29.4 17 Middle 74.6 63 44.9 49 Upper 89.6 67 77.8 36
According to the Census of 1810 most villagers belonged to households of agricultural labourers, cottagers or farmers. Hence, our three classes correspond approximately to these three occupational groups. The remaining ten per cent contained mainly craftsmen. These often had apprentices. We, therefore, expect to find them mainly among our middle and upper class. Only seven households of craftsmen could be identified. Two belonged to the middle and five to the upper class. However, it is possible that the probability of a craftsman's household being identified as such is correlated with our stratification variable.
Dow
nloa
ded
by [
Nip
issi
ng U
nive
rsity
] at
14:
25 0
8 O
ctob
er 2
014