mortality and morbidity in agriculture in the united states – policy implications risto h....
TRANSCRIPT

Mortality and Morbidity in Agriculture in the
United States – Policy Implications
Risto H. Rautiainen, MS,
Stephen J. Reynolds, PhD, CIH
Great Plains Center for Agricultural Health,
Aims
Characterize trends since Ag at Risk, 1998 in • Agriculture• Agricultural populations• Prevalence and incidence of
• Fatal occupational injuries• Non-fatal occupational injuries• Work related diseases
Conclusions
Recommendations
Trends in Agriculture
• Rapid decrease in farms and farm workforce in early and mid part of the 20th century
• Relatively slow changes since 1970’s
• Part time farming has increased
• Large scale farming has increased

Number of Farms and Farm Workers in the United States. Sources: USDA NASS, BLS CPS
0
1000
2000
3000
4000
5000
6000
7000
8000
9000
Year
1949
1952
1955
1958
1961
1964
1967
1970
1973
1976
1979
1982
1985
1988
1991
1994
1997
Num
ber
in th
ousa
nds
Workers
Farms


Fatal Injuries in Agriculture

Sources of Information
• National Safety Council (NSC)
• NIOSH National Traumatic Occupational Fatalities (NTOF)
• Bureau of Labor Statistics (BLS), Census of Fatal Occupational Injuries (CFOI)
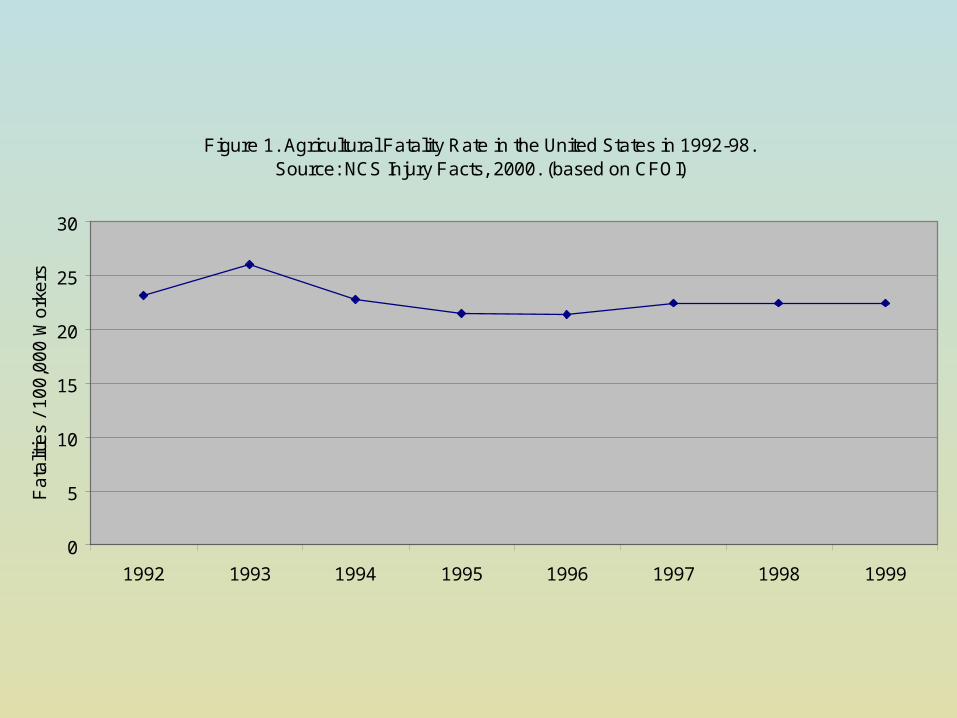
Figure 1. Agricultural Fatality Rate in the United States in 1992-98. Source: NCS Injury Facts, 2000. (based on CFOI)
0
5
10
15
20
25
30
1992 1993 1994 1995 1996 1997 1998 1999
Fa
talit
ies
/ 1
00
,00
0 W
ork
ers

Comparison of Occupational Fatality Rates
0
5
10
15
20
25
USA Ag USA Other Canada Ag Finland Ag
Fa
talit
ies/
10
0,0
00

Tractor Fatality Rate in 1988-98. Source: NSC Injury Facts 2000.
0
2
4
6
8
10
12
1988 1989 1990 1991 1992 1993 1994 1995 1996 1997 1998
Fa
talit
ies/
10
0,0
00
Tra
cto
rs
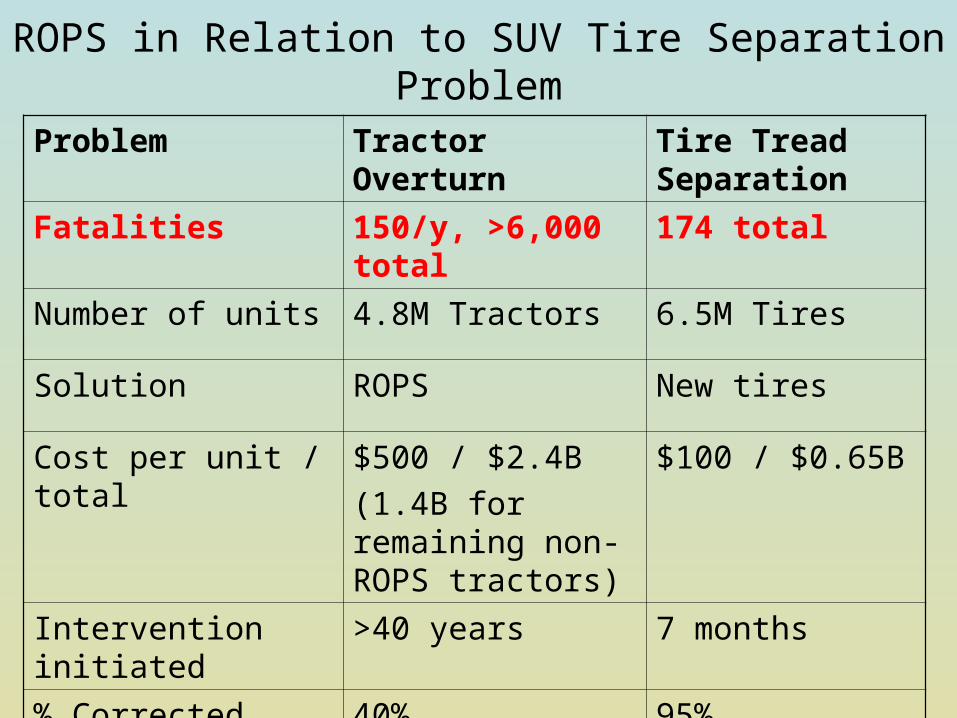
ROPS in Relation to SUV Tire Separation Problem
Problem Tractor Overturn Tire Tread Separation
Fatalities 150/y, >6,000 total 174 total
Number of units 4.8M Tractors 6.5M Tires
Solution ROPS New tires
Cost per unit / total $500 / $2.4B
(1.4B for remaining non-ROPS tractors)
$100 / $0.65B
Intervention initiated >40 years 7 months
% Corrected, Feb 01 40% 95%
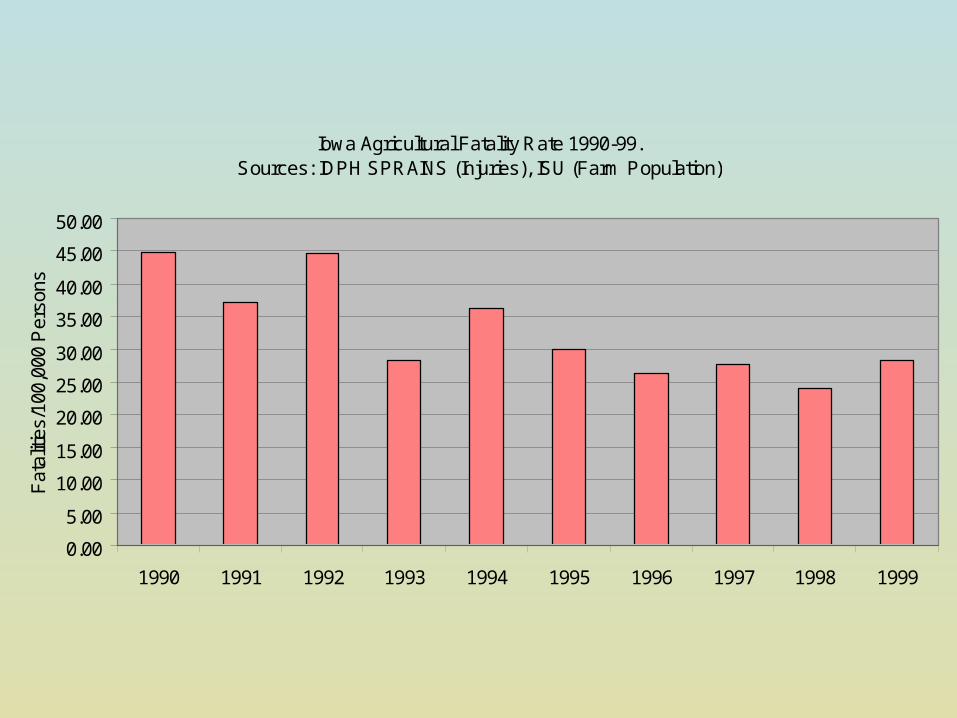
Iowa Agricultural Fatality Rate 1990-99. Sources: IDPH SPRAINS (Injuries), ISU (Farm Population)
0.00
5.00
10.00
15.00
20.00
25.00
30.00
35.00
40.00
45.00
50.00
1990 1991 1992 1993 1994 1995 1996 1997 1998 1999
Fat
aliti
es/1
00,0
00 P
erso
ns
Nonfatal Injuries
Sources
• National Safety Council
• Bureau of Labor Statistics (workers on farms with >10 hired workers)
• California Workers Compensation (hired farm workers)
• Studies and surveys

Incidence of Nonfatal Occupational Injuries.Source: BLS, Survey of Occupational Injuries and Illnesses,
Monthly Labor Review, 122:(8)94
0
2
4
6
8
10
12
14
1985 1990 1995 1996 1997
Inju
ries/
100
FT
Wor
kers
Ag, Foretry, Fishing
Total Private Industry

Rate of Hospitalized Injuries in Iowa 1990-99. Sources: IDPH SPRAINS (Injuries), ISU (Farm Population)
0.00
0.20
0.40
0.60
0.80
1.00
1.20
1.40
1.60
1.80
1990 1991 1992 1993 1994 1995 1996 1997 1998 1999
Inju
ries/
100
Per
sons
Work Related Illness
Definitions:• Occupational disease• Work related illness• Work related symptoms
Sources:• Bureau of Labor Statistics (hired workers)• National Safety Council

Work Related Illnesses
BLS (NSC Injury Facts 2000)
• Workers on farms with >10 employees
• 30.9 illnesses / 10,000 workers
• 56% skin disorders
• 14% repeated trauma
• 13% respiratory disease
• 17% other

Respiratory Disease• Thorne et al: swine confinement workers:
occup. asthma 20%, chronic bronchitis 25%, ODTS 33%
• Reynolds et al: association with work exposure and respiratory symptoms in turkey barn workers
• Wilkins et al: cash grain farmers, chronic caugh 9%, phlegm 11%, dysphnea 16%, wheeze 8%
• NIOSH: fatalities from hypersensitivity pneumonitis
• Causes: organic dust, endotoxin, ammonia

Cancer
Overall cancer rates are typically lower in agriculture compared to general population. PMRs: NIOSH 0.89, Finland 0.82, Sweden 0.80
• Blair et al: overall cancer rate lower but certain cancers elevated: Hodgkin’s disease, multiple myeloma, leukemia, skin melanomas, and cancers of the lip, stomach, and prostate
Hearing Loss
• Becker et al, NY: 72% of farmers had high frequency hearing loss
• Mudipalli et al, IA: 50% of females, 86% of males with farming history had hearing loss, respectively 50% and 80% when no farm history; 47% of young males had hearing loss
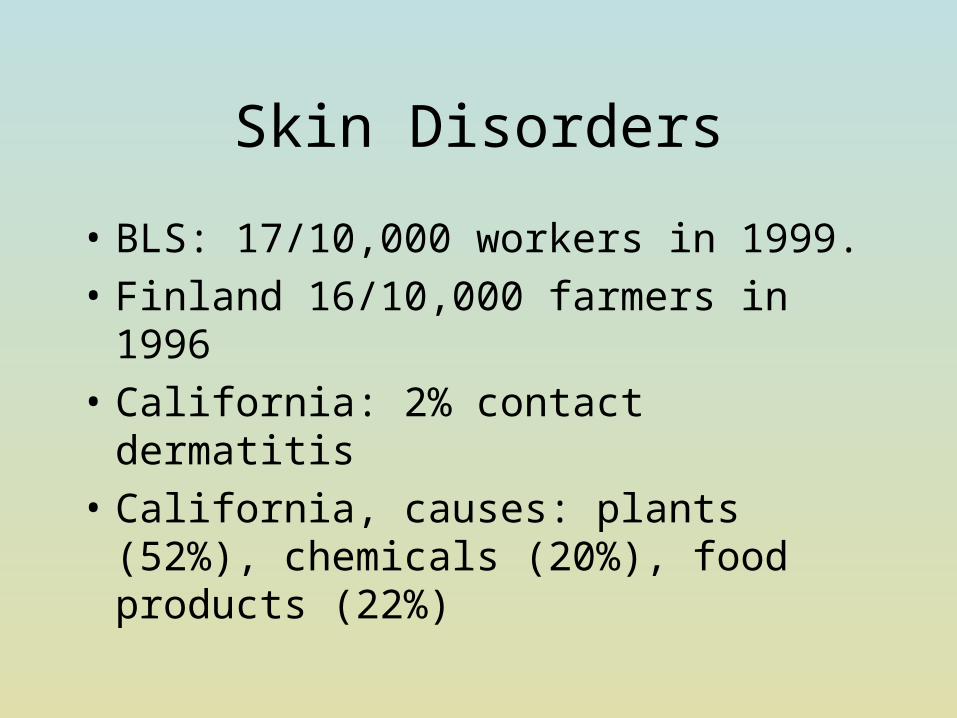
Skin Disorders
• BLS: 17/10,000 workers in 1999.
• Finland 16/10,000 farmers in 1996
• California: 2% contact dermatitis
• California, causes: plants (52%), chemicals (20%), food products (22%)

Zoonoosis
Thomas et al, England. Antibodies found for:• Q-fever (29.2%), toxoplasma (50.2%), • lyme disease (0.2%), leptospira (0.2%),• brucella (0.7%), • hantavirus (seroprevalence 4.7%), • orthopox virus (0.7%), parapox virus (4.5%),
Bartonella spp. (2.0%), • Ehrlichia Chaffeensis (0.2%), • human granulocytic ehrlichiosis agent (2.0%),• Echinococcus Granulosis (1.5%)

Stress
• US, some studies show higher Relative Risk for suicide for farmers (~1.1)
• Canada: lower risk for farmers• Center for Epidemiologic Studies Depression
Scale; Depressive symptoms – Ohio 8%, – Colorado 8% males, 11% females – IA, Keokuk County males 17%, females 25%
• Kidd et al, Thu et al: injury-stress association

Repeated Trauma
• BLS: second most common work related illness in farm workers
• California: back (24%), upper back (19%), wrist problems (18%)
• Musculoskeletal problems in dairy farmers: Sweden (82-86%), Australia (57%), Colorado (43%)
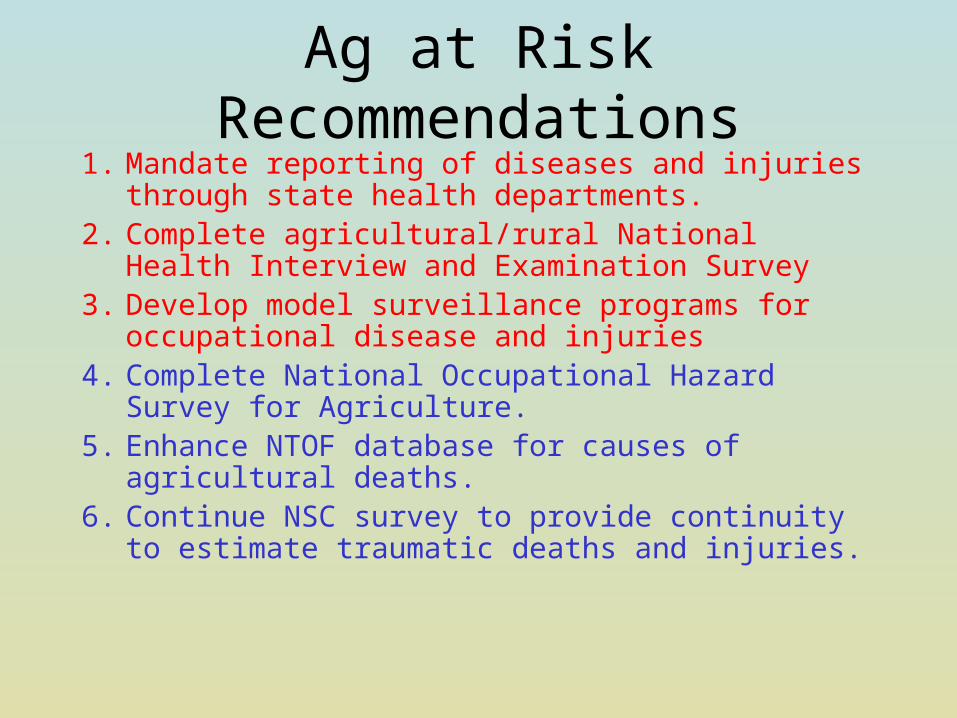
Ag at Risk Recommendations1. Mandate reporting of diseases and injuries
through state health departments. 2. Complete agricultural/rural National Health
Interview and Examination Survey3. Develop model surveillance programs for
occupational disease and injuries4. Complete National Occupational Hazard
Survey for Agriculture. 5. Enhance NTOF database for causes of
agricultural deaths.6. Continue NSC survey to provide continuity to
estimate traumatic deaths and injuries.

Conclusions
• No progress in fatalities• No progress in tractor fatalities• Some progress regionally • Some progress in childhood fatalities• Some progress in non-fatal injuries for
employed workers• No progress in surveillance• Some progress in research based knowledge
of injuries, illnesses, and risk factors

Recommendations
1. Develop a National database for non-fatal injuries and illnesses.
2. Enhance NTOF, CFOI fatality surveillance.3. Expand in-depth FACE fatality investigations to
most states and include agricultural fatalities as priority.
4. Include info on farm family members and farm residents in Census of Ag and labor surveys.
5. Utilize existing knowledge to develop a National Agricultural Injury and Illness Prevention Agenda
