morphometry in malocclusion - dr. claire stagg health · pdf file ·...
TRANSCRIPT

J Dent Res 76(2): 694-703, February, 1997
Morphometry of the Cranial Basein Subjects with Class III MalocclusionG.D. Singhl*, J.A. McNamara, Jr.2, and S. Lozanoff3
'Department of Dental Surgery & Periodontology, Dundee Dental Hospital & School, University of Dundee, Park Place, Dundee DD1 4HR,Scotland, UK; 2Department of Orthodontics & Pediatric Dentistry, School of Dentistry, Center for Human Growth and Development, Universityof Michigan, Ann Arbor, Michigan 48109-1078, USA; and 3Departments of Anatomy and Reproductive Biology and of Surgery, John A. BumsSchool of Medicine, University of Hawaii, Honolulu, Hawaii 96882; *to whom correspondence and reprint requests should be addressed
Abstract. The significance of the cranial base in thedevelopment of Class III malocclusion remains uncertain.The purpose of this study was to determine whether theform of the cranial base differs between prepubertal Class Iand Class III subjects. Lateral cephalographs of 73 childrenof European-American descent aged between 5 and 11 yearswith Class III malocclusion were compared with those oftheir counterparts with a normal, Class I molar occlusion.The cephalographs were traced, checked, and subdividedinto seven age- and sex-matched groups. Averagegeometries, scaled to an equivalent size, were generatedbased on 13 craniofacial landmarks by means of Procrustesanalysis, and these configurations were statistically testedfor equivalence. Bivariate and multivariate analysesutilizing 5 linear and angular measurements wereundertaken to corroborate the Procrustes analysis.Graphical analysis, utilizing thin-plate spline and finiteelement methods, was performed for localization ofdifferences in cranial base morphology. Results indicatedthat cranial base morphology differed statistically for allage-wise comparisons. Graphical analysis revealed that thegreatest differences in morphology occurred in the posteriorcranial base region, which generally consisted of horizontalcompression, vertical expansion, and size contraction. Thesphenoidal region displayed expansion, while the anteriorregions showed shearing and local increases in size. It isconcluded that the shape of the cranial base differs insubjects with Class III malocclusion compared with thenormal Class I configuration, due in part to deficientorthocephalization, or failure of the cranial base to flattenduring development.
Key words: Class III, cranial base, morphometry,orthocephalization.
Received July 24, 1995; Accepted August 14, 1996
Introduction
Class III malocclusions result from morphologicaldisharmony between the maxilla and mandible. This groupof malocclusions is characterized generally by severaldevelopmental and craniofacial features, including an acutemandibular plane angle, obtuse gonial angle, and anoverdeveloped mandible/underdeveloped maxilla(Jacobson et al., 1974; Ellis and McNamara, 1984; Sato, 1994).Although Class III malocclusions occur much lessfrequently than Class II malocclusions (Haynes, 1970; Fosterand Day, 1974), they frequently are associated withcraniofacial syndromes and require orthodonticintervention for the correction of functional deficiencies inmastication, respiration, and/or phonation. Therefore, theetiology and expression of Class III malocclusion must beunderstood before it can be clinically corrected.
Maxillary retrognathia, without mandibularprognathism, has been reported to occur in between 20 and30% of adult patients with Class III malocclusions (Sanborn,1955; Dietrich, 1970; Jacobson et al., 1974; Ellis andMcNamara, 1984). The cranial base is a likely anatomicalcandidate to be involved in Class III malocclusions, since itforms the central core of the cranium, providing a majorsupport structure on which the midface develops. Similarly,the cranial base is abnormally short with a deficient posteriorregion in an experimental midfacially-retrognathic mousemodel (Lozanoff et al., 1994; Ma and Lozanoff, 1996). Whilesome authors report that a short cranial base is a majormorphological feature characteristic of a Class III craniofacialconfiguration (Stapf, 1948; Hopkin et al., 1968; Kerr andAdams, 1988), others suggest that a Class III cranial basemorphology does not differ from that seen in subjects with anormal Class I profile (Anderson and Popovich, 1983). Apossible explanation for these contradictory results may bethat the cranial base is usually represented by a limitednumber of anatomical landmarks which may not besufficient for accurate characterization of its contribution tothe Class III configuration. Also, most studies do not accountfor size differences between individuals which mayconfound results, as noted by Battagel (1993, 1994). Thepurpose of this study was to test the hypothesis that cranial
694

Cranial Base in Class III Subjects
base morphometry differsbetween Class I and ClassIII subjects. If significantdifferences between cranialbase morphologies arefound, anatomical alterationswill be loalized graphically.This studyciaz onnewermorphometric techniqueswhich normalize geometricareas, thus eliminating theondig efects intoducedby size differences betweenindividuals.
Materials andmethods
SampleThe sample used in thisanalysis was derived froma total of 142 children ofEuropean-Americandescent between the agesof 5 and 11 years. The useof archival radiographsconformed to institutionalstandards at the Universityof Michigan (USA), sincehuman subjects hadparticipated after providinginformed consent to aprotocol that had beenreviewed and approved byan appropriate institutionalboard. A total of 73 subjectswith Class III molarocclusion (Guyer et al., 1986)with a normal, Class I mobintervals. The total sample irnumber of male and female incairway problems and no obvicThe chronological age was assiin this study, since carpal lTherefore, the total sample con7, 8, 9, 10, 11 years) and geocclusal type (Class I, Class III)
Lateral cephalographs w
magnification of each filnrenlargement factor. It was pretaken from patients exhibitingcentral x-ray passed along thewere in occlusion. Each late]frosted acetate film (0.03'investigator (GDS). To increasselected, we taped cephalogibrightness in a darkened roorrachieve digitization of landmabase and midface were identif
GlPC Ts S GI
Bo r P NbBa
Bo
B
Pc
D
A
Pc
C ,
1e~
Figure 1. Thirteen craniofacial landmarks (A) used in this study superimposed on a cephalographic tracingof a Class I profile. The geometry used for the Procrustes, thin-plate spline, and FEM analyses (B) as well asthe linear (C) and angular (D) measurements used in the bivariate and multivariate analysis aresuperimposed on tracings of Class III subjects.
was compared with 69 children by means of appropriate software and a digitizing tablear relationship over seven age (Numonics Inc., Montgomeryville, PA). The rationale ofncluded an approximately equal selection was that preference was given to landmarks thatdividuals, with negative history of encompassed cranial developmental sites and were located in:us vertical skeletal discrepancies. the mid-sagittal plane where possible (Varjanne and Koski,amed to match developmental age 1982). These landmarks (Fig. 1, Table 1) showed a discrepancyradiographs were unavailable. of < 1% on duplicate digitization and were deemed to beisisted of seven age-matched (5, 6, reliably identified.!nder-matched groups for each> Statistical analysis
rere used in this analysis. The Procrustes analysis was used for determination of whethert was standardized to an 8% cranial base landmark configurations differed between occlusalsumed that all radiographs were types at each age interval. A routine was written in "C" andleft-right symmetry and that the implemented on an Amiga 3000. An average 13-node geometrytrans-meatal axis while the teeth for each age group was determined by Generalized Orthogonalral cephalograph was traced on Procrustes analysis (Gower, 1975; Rohlf and Slice, 1990)." thick) and checked by one Following this method, every object's coordinates were,e the reliability of the landmarks translated, rotated, and scaled iteratively until the least-squaresraphs to a light box of uniform fit of all configurations was no longer improved. Therefore, alli and used a cross-wires cursor to configurations were scaled to an equivalent size and registeredrks. Thirteen points on the cranial with respect to one another. Each Class I group mean geometryFied and digitized (Fig. 1, Table 1) was compared statistically with the age-matched Class III group
J Dent Res 76(2) 1997 695

J Dent Res 76(2) 1997
Table 1. Definitions of landmarks and variables used in this study
Abbreviations Cranial Landmarks
Ar Articulare (intersection of the condyle and theposterior cranial base)
Ba Basion (lowest point on the anterior border offoramen magnum)
Bo Bolton point (highest point behind the occipitalcondyle)
Fmn Frontonasomaxillary sutureGI Glabella (most prominent point on the frontal bone)Pc Posterior clinoid process (most superior point on the
clinoid process)N Nasion (most anterior point on frontonasal suture)Nb Tip of nasal bonePt Rickett's point (posterosuperior point on outline of
pterygomaxillary fissure)Ptm Pterygo-maxillare (most inferior point on outline of
pterygomaxillary fissure)S Sella (center of sella turcica)Se Sphenoidale (intersection of the greater wings of the
sphenoid and the anterior cranial base)Ts Tuberculum sellae (most anterior point of sella turcica)
Cranial Linear Variables (mm) Cranial Angular Variables (0)
S-N NSBaS-Ba NSArN-Se NSeSS-Se NPcBoPc-Bo GlNNb
average geometry by an analysis of variance (Gower, 1975;Appendix). In each case, the null hypothesis was that the Class Imean was not significantly different from the Class III average.Residuals and corresponding F values were computed,tabulated, and compared.A battery of five linear and five angular cranial base
measurements was delineated and analyzed by bivariate andmultivariate statistical analysis, due to concerns expressed byLele (1993) regarding the robustness of Procrustes analysis.Linear distances (mm) between coordinates were calculated aswell as selected angles (0) for each individual. Each variable wastested for normality within each group by Wilks' statistic (BMDP-3D). Also, the assumption of equivalence of variance was verifiedfor each linear and angular variable between age-matched groupsby Levene's test, and the corresponding means weresubsequently compared for equivalence by a t test (BMDP-3D).Following this bivariate analysis, measurements were comparedby a multivariate Hotelling's t test (BMDP-3D) so that the resultsderived from the Procrustes analysis could be corroborated.
Graphical analysisTo localize differences in cranial base morphologies, weundertook two graphical analyses. The average landmarkconfiguration for each age group generated with the Procrustesanalysis was used for this analysis. Thin-plate spline analysis
Table 2. Residuals, F values, and probability of statistical
equivalence between average cranial base geometries for Class I
and Class III groups between 5 and 11 years of age as determinedwith the Procrustes analysis
Age Residual F value p <
(x 103)
5 3.268 4.512 0.0016 1.749 1.756 0.0107 1.305 1.432 0.1008 2.658 3.353 0.0019 2.222 3.795 0.00110 1.751 1.482 0.050
11 1.605 1.870 0.005
was undertaken following Bookstein (1991) and Rohlf (1996).Graphical displays of the total spline comparison (affine andnon-affine components combined) at each age interval werecalculated. Qualitative analysis was undertaken by theidentification of areas of greatest deformation; these alterationswere then characterized. Similarly, finite element methodology(FEM) was undertaken following Lozanoff and Diewert (1989).In this case, the Class I average was taken as the initialgeometry, and the Class III configuration was the finalgeometry. Size-change variables were calculated as the productof principal extensions (Lozanoff and Diewert, 1986). Thesevalues were calculated for at least 2000 points per geometry andwere used for the generation of a color map with a log-linearscale. Areas of greatest or least change were characterizedqualitatively, with deformation noted, based on the graphicaldisplay. Size-change values were tabulated at the location of theanatomical landmarks. Although statistical comparisons of thin-plate spline and FEM form-change variables are possible, nosuch analysis was undertaken here, since it was consideredbeyond the scope of this study.
ResultsResiduals from the Procrustes analysis at each age weretabulated and compared by means of an F distribution(Table 2). Statistically significant differences between thelandmark configurations occurred at the p < 0.05 level for allage comparisons except the age 7 group. In this case, theprobability of a statistical difference between averagelandmark configurations was marginal, with p < 0.10.
Results of the univariate and multivariate analyses arepresented in Tables 3 and 4. Wilks' test indicated that 94% ofthe cranial variables displayed a w > 0.9, indicative of anormal distribution. A further 3.5% of the variables showeda w > 0.8 level, and only 1% of the variables demonstrated askewed distribution (p < 0.05). Therefore, the vast majorityof linear measures was taken to be normally distributed.Similarly, Levene's test indicated equivalence of variance for99% of the linear and angular variables. Therefore, theassumptions of normality and equivalence of variance wereaccepted for linear and angular measures, enabling furtherbivariate and multivariate analyses to be carried out.
696 Singh et al.

Cranial Base in Class III Subjects
Table 3. Linear and angular measurements for Class I and Class III cranial base morphologies between 5 and 11 years of age with statisticallysignificant differences (p < 0.05) in boldface
Age 5 6 7 8 9 10 11
Variable Class Class Class Class Class Class Class Class Class Class Class Class Class ClassI III I III I III I III I III I III I III
SN (mm) 70.6 69.8 70.0 67.4 71.3 69.8 72.9 68.3 74.1 69.6 72.8 70.1 74.1 72.8(3.4)a (3.2) (2.3) (2.5) (1.2) (3.6) (2.7) (2.9) (2.6) (2.9) (2.2) (3.2) (3.7) (4.1)
NSe (mm) 43.7 41.9 42.3 42.9 44.2 43.8 46.7 42.8 45.9 43.5 44.6 43.8 48.7 45.4
(1.5) (2.6) (2.6) (3.2) (2.0) (3.7) (2.9) (3.3) (3.0) (3.2) (1.6) (3.5) (4.2) (3.6)SSe (mm) 27.0 25.9 27.9 25.0 27.3 26.2 26.6 25.5 28.3 26.2 25.4 26.5 25.5 27.5
(3.4) (2.7) (1.7) (2.2) (1.1) (2.6) (1.4) (2.8) (3.0) (2.1) (8.4) (4.0) (2.9) (2.0)SBa (mm) 42.2 41.1 42.4 40.6 42.4 43.6 45.4 44.3 46.8 43.1 46.8 45.2 47.6 45.6
(2.9) (1.8) (2.4) (2.9) (3.5) (2.9) (2.7) (2.6) (3.5) (3.1) (3.3) (1.7) (3.7) (2.4)PcBo (mm) 55.4 46.7 52.1 44.1 52.9 47.3 58.9 48.1 59.6 48.1 59.6 50.1 59.6 53.6
(3.0) (2.8) (3.8) (4.9) (4.5) (6.2) (4.10) (4.2) (5.2) (5.0) (5.4) (5.3) (5.3) (4.9)GlNNb (0) 135.5 136.0 127.1 141.1 136.9 138.3 137.5 138.1 133.2 139.4 136.2 136.1 131.9 139.8
(5.1) (8.20) (5.7) (5.2) (8.5) (5.2) (6.7) (7.5) (5.8) (4.6) (6.1) (4.9) (6.5) (4.6)NSeS (°) 176.3 175.3 171.9 176.3 174.3 173.3 169.9 173.7 175.2 176.0 175.4 173.1 175.9 174.6
(3.6) (4.0) (5.9) (1.7) (5.0) (2.4) (7.1) (3.3) (3.0) (2.9) (2.5) (4.5) (3.3) (3.6)NSBa (0) 128.3 122.6 127.0 129.9 128.1 128.1 134.3 125.9 131.2 126.9 129.4 126.7 128.4 126.2
(4.8) (6.6) (3.6) (4.3) (3.6) (4.10) (2.0) (2.9) (4.4) (4.6) (5.4) (3.6) (3.0) (5.5)NSAr (°) 120.2 116.9 121.7 121.8 122.3 121.6 126.9 120.3 124.9 121.1 124.7 121.1 123.2 120.4
(6.2) (6.2) (5.4) (1.7) (3.8) (3.5) (4.8) (2.5) (5.5) (5.6) (6.3) (4.1) (5.3) (5.1)NPcBo(0) 136.9 123.8 131.9 132.9 133.0 129.3 138.7 126.7 137.7 129.1 136.2 129.8 135.8 127.5
(4.6) (7.0) (4.7) (4.3) (6.8) (5.50) (4.9) (2.2) (5.2) (5.6) (2.9) (5.9) (4.4) (6.4)
a Standard deviations.
For the anterior cranial base, the length S-N differedstatistically between normal and Class III cases only at ages8 and 9 years. For its subcomponents (S-Se and N-Se), onlyN-Se differed at age 8 years. No differences in anterior baseangulation, depicted by the angle NSeS, were found.However, the frontonasal angle (GlNNb) appeared to bemore obtuse in nearly all Class III groups, although itreached statistical significance in only three of the seven agegroups tested (ages 6, 9, and 11 years).
For the posterior cranial base, even though the length S-Ba did not differ statistically between normal and Class IIIgroups at any age, differences were found for all age groupsfor the length Pc-Bo, which was significantly shorter in allClass III cases. This decreased posterior cranial base lengthwas augmented by a decreased cranial base angle (NPcBo)that was significantly smaller in Class III age groups at 5, 8,9 10, and 11 years. Although the saddle angle (NSBa)appeared to be more acute in Class III groups, it failed toreach statistical significance in most age groups (6, 7, 10, and11 years). The angle NSAr followed the same trend, withmarginal statistical difference occurring at 8 years of age.
Hotelling's tests confirmed that statistically significantdifferences existed between normal and Class III cranial basesfor both linear and angular measures. At ages 5, 8, and 9years, statistically significant differences were found for bothlinear and angular variables. For ages 6, 7, 10, and 11 years,statistically significant differences existed for either linearvariables or for the angular measures. Therefore, all age
groups tested displayed statistically significant differences forcranial base morphology in either the linear or the angularmeasures, if not both, corroborating the results achieved byour Procrustes analysis.
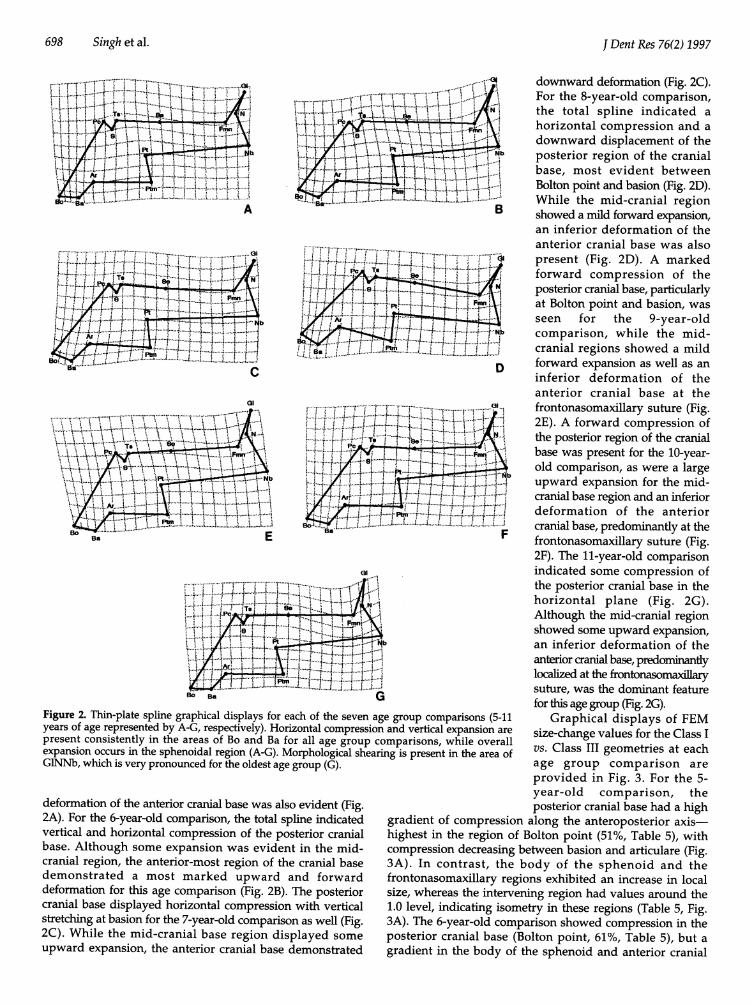
Thin-plate spline analysis provided graphical displayscomparing the Class I configuration with that of the Class IIIfor each of the seven age intervals (Fig. 2). For the 5-year-oldgroup, the total spline indicated compression in the horizontalaxis in the region of the posterior cranial base, affecting Boltonpoint and basion (Fig. 2A). However, some vertical expansion,particularly in the sphenoidal complex, and downward
Table 4. Hotelling's T2 scores and values of statistical significancefor linear and angular measurements of Class I and Class III cranialbase morphologies between 5 and 11 years of age
Linear Measurements Angular Measurements
Age Hotelling's T2 p < Hotelling's T2 p <
5 88.15 0.0001 42.46 0.00316 21.06 0.0939 31.06 0.03737 32.36 0.0148 5.64 0.55588 96.89 0.0001 206.04 0.00019 46.34 0.0001 28.67 0.004910 21.75 0.0374 8.91 0.3000
11 10.71 0.1211 30.09 0.0123
j Dent Res 76(2) 1997 697
698 Singh et al.~~~~~.........r.........I.........
4 ' ..... .......,'.. ..-'.;....
....... ......Mte -.............tIGf t t t .... .... i.t.!.......-- ff
........~.'.,...
, ~~~~~~~~. . i-.L-.---......ss
el
Ba E
XW ~~... W..!..........
Figure 2. Thin-plate splime graphical displays for each of the seven age group comparisons (5-1years of age represented by A-G, respectively). Horizontal compression and vertical expansion arlpresent consistently in the areas of Bo and Ba for all age group comparisons, while overalexpansion occurs mn the sphenoidal region (A-G). Morphological shearing is present in the area oGlNNb, which is very pronounced for the oldest age group (G).
deformation of the anterior cranial base was also evident (Fig.2A). For the 6-year-old comparison, the total spine indicatedvertical and horizontal compression of the posterior cranialbase. Although some expansion was evident in the mid-cranial region, the anterior-most region of the cranial basedemonstrated a most marked upward and forwarddeformation for this age comparison (Fig. 2B). The posteriorcranial base displayed horizontal compression with verticalstretching at basion for the 7-year-old comparison as well (Fig.2C). While the mid-cranial base region displayed someupward expansion, the anterior cranial base demonstrated
.~~~~~~~~~~~~~~~..... ,,-t--*TT.................'j -......o4|- ............... ,.,,,.....s
..... ... ..... ...............,--!"^'(,-...........B downward deformation (Fig. 2C).For the 8-year-old comparison,the total spline indicated ahorizontal compression and adownward displacement of theposterior region of the cranialbase, most evident betweenBolton point and basion (Fig. 2D).While the mid-cranial regionshowed a mild forward expansion,an inferior deformation of theanterior cranial base was alsopresent (Fig. 2D). A markedforward compression of theposterior cranial base, particularlyat Bolton point and basion, wasseen for the 9-year-oldcomparison, while the mid-cranial regions showed a mildforward expansion as well as aninferior deformation of theanterior cranial base at thefrontonasomaxillary suture (Fig.2E). A forward compression ofthe posterior region of the cranialbase was present for the 10-year-old comparison, as were a largeupward expansion for the mid-cranial base region and an inferiordeformation of the anteriorcranial base, predominantly at thefrontonasomaxillary suture (Fig.2F). The 11-year-old comparisonindicated some compression ofthe posterior cranial base in thehorizontal plane (Fig. 2G).Although the mid-cranial regionshowed some upward expansion,an inferior deformation of theanterior cranial base, predominantlylocalized at the frontonasomaillarysuture, was the dominant featurefor this age group (Fig. 2G).
Graphical displays of FEM1e size-change values for the Class I
vs. Class III geometries at eachage group comparison areprovided in Fig. 3. For the 5-year-old comparison, theposterior cranial base had a high
gradient of compression along the anteroposterior axis-highest in the region of Bolton point (51%, Table 5), withcompression decreasing between basion and articulare (Fig.3A). In contrast, the body of the sphenoid and thefrontonasomaxillary regions exhibited an increase in localsize, whereas the intervening region had values around the1.0 level, indicating isometry in these regions (Table 5, Fig.3A). The 6-year-old comparison showed compression in theposterior cranial base (Bolton point, 61%, Table 5), but agradient in the body of the sphenoid and anterior cranial
J Dent Res 76(2) 1997

Crninal Base in Class III Subjects
GI
Nb
0.94
0.49 Bo Ba
2.10
1.35
0 B a0.60 B
Nb
B
G31 1.26
Nb
C
0.91
0.56
a1Pc, Ts
N
BBa
Nb
Ptm
D
Ptm
13I
IN
1.62
1 .e2
.12I
0.62 Bo Ba
1.37
0.97 INb
E 0,56 I(31
i.N
Nb
Bo Ba F
1.24
I0.91
0.57 Bo
N
Pc TsPCA, AN'-
Ptm
Ba
Nb
GFigure 3. FEM graphical displays for each of the seven age group comparisons (5-11 years of age represented by A-G, respectively). Localdecreases in size occur in the areas of Bo and Ba for all comparisons (A-G), with local increases in size in the area of the sphenoid, particularlyat ages 5 (A), 8 (D), 10 (F), and 1 I (G) years. Local increases in size also occur consistently at Fmn (A-G).
base was not evident (Fig. 3B). In contrast, there was aminor, relative increase in the region of the sphenoidal airsinus, but the frontonasal region showed a strong positiveexpansion with its epicenter located at the fronto-nasomaxillary suture (90%, Table 5). In the 7-year-oldcomparison, negative allometry was evident in the posteriorcranial base (Bolton point = 45%, Table 5, Fig. 3C). A relative
increase in the region of the sphenoidal air sinus and theanterior region showed positive allometry (36"/,frontonasomaxillary suture, Table 5), while some localizedsize decrease was evident in the intervening areas. Adecrease in local size was apparent in the posterior cranialbase (40%, Bolton point, Table 5) which quickly diminishedby the dorsum sellae, as seen for the 8-year-old comparison
1.39
A
'N
1.41
PC, TS Se0 98
- Bo
tN
Ba Ptm
j Dent Rcs 76(2) 1997 699

J Dent Res 76(2) 1997
Table 5. Size-change values at each anatomical landmark determined with the FEM analysis of Class I and Class III cranial basemorphologies between 5 and 11 years of age
Age Bo Ba Pc S Ts Se Fmn N Gl Nb Ptm Pt Ar
05 0.492 0.654 1.227 1.247 1.314 1.139 1.260 1.246 1.071 1.057 1.061 1.170 0.94506 0.605 0.884 0.892 1.076 1.075 1.083 1.898 1.492 1.142 1.307 0.977 0.990 0.98507 0.555 0.803 0.959 1.097 1.082 1.011 1.357 1.265 1.019 1.045 0.936 0.961 0.99508 0.592 0.940 1.146 1.230 1.232 1.157 1.092 1.101 1.041 1.027 1.064 1.075 1.07009 0.648 0.749 1.065 1.129 1.136 1.170 1.543 1.395 1.019 1.198 1.010 1.052 0.97810 0.578 0.767 1.117 1.306 1.339 1.122 1.050 1.013 0.737 0.941 1.012 1.127 0.95711 0.606 0.791 1.063 1.170 1.101 1.136 1.254 1.358 1.253 0.991 0.944 1.082 0.907
(Fig. 3D). In contrast, there was an increase in local size inthe body of the sphenoid, but the anterior cranial base wasmore isometric (Fig. 3D). The 9-year-old comparisonshowed local size decrease in the posterior cranial base(35%, Bolton point, Table 5), with an increasing gradientthrough to the body of the sphenoid (Fig. 5E). In contrast toa relative increase in the sphenoid, the anterior cranial baseshowed an even greater size increase, with its epicenterlocated at the frontonasomaxillary suture (54%, Table 5). Adecrease in size occurred in the posterior cranial base for the10-year-old comparison (42%, Bolton point, Table 5), with anincreasing gradient through to the sphenoid (Fig. 3F). Theanterior cranial base was more isometric but also showedsome slight decreases in local size in the region of thefrontonasomaxillary suture (Fig. 3F). Similarly, the posteriorcranial base showed local decreases in size for the posteriorcranial base (40%, Bolton point, Table 5), with an increasinggradient through to the sphenoidal region for the 11-year-old comparison (Table 5, Fig. 3G). In contrast, increased sizeoccurred in the body of the sphenoid, but a relative decreasein size was seen in the area of the frontonasomaxillarysuture (Fig. 3G).
DiscussionAlthough longitudinal samples may be better than cross-sectional samples with the same number of radiographs forestablishing growth patterns, serial cephalographs were notavailable for this study, which depends upon age- and sex-matched groups. Similarly, although Class III malocclusioncan be defined in different ways-for example, on the basisof cephalometric analysis (e.g., Enlow et al., 1969), Class IIIincisor relationship (Battagel, 1994), or Class III molarrelationship (Guyer et al., 1986)-only the latter definitionwas adopted in this particular study. Indeed, functionalcontributions often are an important complicating factor inClass III malocclusion, and such heterogeneity may accountfor some of the difficulties encountered in the investigationof Class III malocclusion (Jacobson et al., 1974). Nevertheless,a random nature of selection is a fundamentally importantassumption in the analysis of variance (Sokal and Rohlf,1981), and we complied with this principle despite thelimited size of our cross-sectional sample.
The importance of cranial base length to the contribution
of midfacial retrognathia and Class III malocclusion remainsunclear due to contradictory results from cephalometricstudies. Various investigators have reported that cranialbase length is smaller in Class III subjects compared withtheir Class I counterparts (Sanborn, 1955; Hopkin et al., 1968;Kerr and Adams, 1988), while others show only minordifferences (Battagel, 1993, 1994) or none at all (Andersonand Popovich, 1983; Williams and Anderson, 1986). Further,Guyer et al. (1986) reported that S-N is larger in length forClass III subjects between ages 5 and 7. Results from thecephalometric analysis in this study indicate only slightdifferences in anterior cranial base length, with the Class Isample showing a greater length between 8 and 9 years ofage. This concurs generally with Battagel's (1993, 1994)findings, where sella-nasion length was marginally greaterin Class I subjects. On the one hand, it would seem thatanterior cranial base length may not play an important rolein the etiology of Class III malocclusion, due to theconflicting nature of the data reported in the literature.However, nasion may be quite variable in its positionduring growth and thus may contribute to the contradictoryfindings (Kerr, 1978; Lestrel et al., 1993).
The posterior cranial base, represented by Pc-Bo lengthin this study, was consistently and significantly shorter inClass III subjects at all ages. However, S-Ba length did notdiffer significantly between occlusal groups. There is ampleevidence that increases in S-Ba length occur due to growthactivity in the spheno-occipital synchondrosis, and that thisdistance increases slowly until early adulthood (Melsen,1972, 1974; Ohtsuki et al., 1982). In fact, resorptiveremodeling of the posterior cranial base probably continuesin the area of the foramen magnum even after fusion of thespheno-occipital synchondrosis, which could contribute toperceived growth changes (Hoyte, 1975, 1991). Therefore,differences in growth remodeling of the clivus and foramenmagnum between Class I and Class III groups probablycontribute to the differences in posterior cranial base lengthseen in this study. Head posture may also play a role inpositioning of the foramen magnum, thus augmenting Pc-Bolength (Solow and Tallgren, 1970; Cole, 1988). Alternately,cranial base angulation is considered to occur through thespheno-occipital synchondrosis (Bjork, 1955). It would seemthat the Pc-Bo length would be more affected by rotation atthis synchondrosis compared with S-Ba length.
700 Singh et al.

Cranial Base in Class III Subjects
Cranial base angle, in addition to the movement of themandible and maxilla with respect to the cranium andremodeling along the facial profile between nasion andmenton, has been hypothesized as a major factordetermining the degree of facial prognathism (Scott, 1958,1967). Although this hypothesis has been supported innumerous studies (Hopkin et al., 1968; Guyer et al., 1986;Ellis and McNamara, 1984; Williams and Andersen, 1986;Kerr and Adams, 1988; Battagel, 1993, 1994; Sato, 1994),others disagree (Anderson and Popovich, 1983). Resultsfrom this study concur with these earlier findings andindicate that the saddle angle (NSBa) as well as the twoother cranial base angles (NSAr and NPcBo) showdifferences between the Class I and Class III configurations,with more acute angles in the Class III morphology.Although Anderson and Popovich (1983) could find nocorrelation between cranial base angle and Class IIIocclusion, it would seem that this configuration is stronglyinfluenced by acute cranial base angles. In addition to themore acute cranial base angles, Class III subjects displayed amore obtuse frontonasal angle (GlNNb), presumablyassociated with a flatter midfacial profile.A confounding problem in cephalometric analyses is that
geometric relationships are not corrected for size (Battagel,1994). Therefore, a larger individual may display a greaterabsolute length compared with a smaller subject, when infact the value may be smaller if it is normalized for size.Procrustes analysis avoids this problem, since geometriesare scaled to equivalent sizes. Results from the Procrustesanalysis indicated that the overall cranial base configurationdiffered between groups at all ages. This finding wascorroborated by the multivariate analysis which indicatedan overall difference between Class I and Class IIIconfigurations at each age interval. These results supportDietrich's (1970) hypothesis that a Class III configuration isdue, in part, to positional, i.e., shape, changes in the cranialbase. Therefore, one would predict differences in regionalmorphology and growth potentials within the cranial baseof Class III individuals compared with Class I subjects.
Results from the graphical analysis indicated that largespatial-scale deformations affected the posterior cranialbase, while localized shearing was more apparent in theregion of sella turcica and the frontonasal suture, asindicated by the thin-plate spline analysis. Similarly,decreases in local sizes occurred in the posterior cranialbase, while large increases in local size were seen in the areaof sella turcica and the frontonasal region. These resultssuggest that the posterior cranial base is displaced anteriorlyrelative to the anterior cranial base in Class III craniofacialconfigurations. This would have the effect of decreasing thetotal length of the cranial base and simultaneously cause anacute cranial base angle, again supporting the hypothesisthat abnormal cranial base shape contributes to the etiologyof a Class III malocclusion.
The shape of the cranial base appears to be establishedduring fetal development (Ford, 1956; Diewert, 1983; Burdiet al., 1988), and it remains relatively stable during postnatalgrowth (Lewis and Roche, 1977; Lestrel and Roche, 1986). Aprominent feature of this early growth is a progressiveflattening of the cranial base during late prenatal develop-
ment (Ford, 1956; Burdi, 1969; Diewert, 1983, 1985).Although some reports indicate that a closing of the cranialbase angle occurs postnatally (George, 1978; Lang, 1983),morphological instability of nasion casts some doubt onthese results (Kerr, 1978). Therefore, the Class III morpho-logy may be established very early in development, possiblyprenatally. As well, the Class III cranial base may arise duenot to an increased cranial base flexion, but rather todeficient orthocephalization, or failure of the cranial base toflatten antero-posteriorly.
Cephalometric analysis remains the foundation for theclinical diagnosis of Class III malocclusion. However, whilesome authors have reported the existence of definitivecephalometric variables which can characterize a Class IIImalocclusion, e.g., cranial base angle (Sato, 1994), othersconclude that no single cephalometric measurement isindicative of a Class III potential (Williams and Andersen, 1986).Indeed, Battagel (1994) considers the search for cephalometricparameters indicative of growth potential in Class IIImalocclusion to be somewhat unproductive. Therefore, thisstudy utilized newer morphometric procedures, includingProcrustes, thin-plate spline, and FEM analyses. As a result ofthese procedures, geometric configurations of anatomicallandmarks can be scaled to equivalent areas, thus avoiding theproblems introduced by differences in cranial base size. As well,the thin-plate spline and FEM graphical analyses avoidregistration on any individual node, thus obviating misleadingconclusions due to relative changes in position for anylandmark used as a register. The relative usefulness ofindividual morphometric procedures is an area of intensivedebate (Rohlf and Marcus, 1993). For example, valid argumentshave been presented indicating that homologous point-basedmethods depend upon the landmarks selected for analysis aswell as on the interpolation function used (Read and Lestrel,1986; Bookstein, 1991; Richtsmeier et al., 1992). However, itwould appear that each technique has relative merits and canprovide useful information. Ultimately, any morphometrictechnique provides simply a description which can be used tohypothesize a mechanism. The biological mechanism suggestedhere, i.e., that Class III malocclusion results from deficientorthocephalization, remains to be tested experimentally.
AcknowledgmentsMr. John Deptuch provided technical assistance. Thisresearch is supported by MRC-10269 (SL) and HSURC (GDS).
ReferencesAnderson D, Popovich F (1983). Relation of cranial base flexure
to cranial form and madibular position. Am J PhysAnthropol 61:181-188.
Battagel JM (1993). The aetiology of Class III malocclusionexamined by tensor analysis. Br J Orthod 20:283-295.
Battagel JM (1994). Predictors of relapse in orthodontically-treated Class III malocclusions. Br J Orthod 21:1-13.
Bjork A (1955). Cranial base development. Am J Orthod 41:198-255.Bookstein FL (1991). Morphometric tools for landmark data:
Geometry and biology. Cambridge: Cambridge University Press.Burdi AR (1969). Cephalometric growth analysis of the human
J Dent Res 76(2) 1997 701

J Dent Res 76(2) 1997
upper face region during the last two trimesters ofgestation. Am J Anat 125:133-142.
Burdi AR, Lawton TJ, Grosslight J (1988). Prenatal patternemergence in early human facial development. Cleft Palate J25:8-15.
Cole SC (1988). Natural head position, posture andprognathism. Br J Orthod 15:227-239.
Dietrich UC (1970). Morphological variability of skeletal ClassIII relationships as revealed by cephalometric analysis.Trans Eur Orthodont Soc 131-143.
Diewert VM (1983). A morphometric analysis of craniofacialgrowth and changes in spatial relations during secondarypalatal development in human embryos and fetuses. Am IAnat 167:495-522.
Diewert VM (1985). Growth movements during prenataldevelopment of human facial morphology. In: Normal andabnormal bone growth, progress in basic and clinicalresearch. Dixon AD, Sarnat BG, editors. New York: Alan R.Liss, 187:57-66.
Ellis E, McNamara JA Jr (1984). Components of adult Class IIImalocclusion. J Oral Maxillofac Surg 42:295-305.
Enlow DH, Moyers RE, Hunter WS, NcNamara JA Jr (1969). Aprocedure for the analysis of intrinsic facial form andgrowth. Am J Orthod 56:6-23.
Ford EHR (1956). The growth of the foetal skull. J Anat 90:63-72.Foster TD, Day AJ (1974). A survey of malocclusion and the
need for orthodontic treatment in a Shropshire schoolpopulation. Br J Orthod 1:73-78.
George SL (1978). A longitudinal and cross-sectional analysis ofgrowth of the postnatal cranial base angle. Am J PhysAnthropol 49:171-178.
Gower JC (1975). Generalized Procrustes analysis. Psychometrika40:33-51.
Guyer EC, Ellis EE 3rd, McNamara JA Jr, Behrents RG (1986).Components of Class III malocclusion in juveniles andadolescents. Angle Orthod 56:7-30.
Haynes S (1970). The prevalence of malocclusion in Englishchildren aged 11-12 years. Trans Eur Orthod Soc 89-98.
Hopkin GB, Houston WJ, James GA (1968). The cranial base as anaetiological factor in malocclusion. Angle Orthod 38:250-255.
Hoyte DA (1975). A critical analysis of the growth in length ofthe cranial base. In: Morphogenesis and malformations ofthe face and brain. Bergsma D, editor. Birth defects: OrigArt Ser 11. New York: Alan R. Liss, pp. 255-282.
Hoyte DA (1991). The cranial base in normal and abnormalskull growth. Neurosurg Clin North Am 2:515-537.
Jacobson A, Evans WG, Preston CB, Sadowsky PL (1974).Mandibular prognathism. Am J Orthod 66:140-171.
Kerr WJS (1978). A method of superimposing serial lateralcephalometric films for the purpose of comparison: Apreliminary report. Br J Orthod 5:51-53.
Kerr WJ, Adams CP (1988). Cranial base and jaw relationship.Am J Phys Anthropol 77:213-220.
Lang J (1983). Clinical anatomy of the head. Berlin: Springer-Verlag.Lele S (1993). Euclidean distance matrix analysis (EDMA):
Estimation of mean form and mean difference. Math Geol25:573-602.
Lestrel P, Roche AF (1986). Cranial base shape variation with
age: A longitudinal study of shape using Fourier analysis.Hum Biol 58:527-540.
Lestrel P, Bodt A, Swindler DR (1993). Longitudinal study ofcranial base shape changes in Macaca nemestrina. Am J PhysAnthropol 91:117-129.
Lewis AB, Roche AF (1977). The saddle angle: Constancy orchange? Angle Orthod 47:46-54.
Lozanoff S, Diewert VM (1986). Measuring histological formchange with finite element methods. Am J Anat 177:187-201.
Lozanoff S, Diewert VM (1989). A computer graphics programfor measuring two and three-dimensional form change indeveloping craniofacial cartilages using finite elements.Comp Biomed Res 22:63-82.
Lozanoff S, Jureczek S, Feng T, Padwal R (1994). Anteriorcranial base morphology in mice with midfacial retrusion.Cleft Palate Craniofac J 31:417-428.
Ma W, Lozanoff S (1996). Morphological deficiency in theprenatal anterior cranial base of midfacially retrognathicmice. J Anat (in press).
Melsen B (1972). Time and mode of closure of the spheno-occipital synchondrosis determined on human autopsymaterial. Acta Anat 83:112-118.
Melsen B (1974). The cranial base. Acta Odontol Scand 32:62-73.Ohtsuki F, Mukherjee D, Lewis AB, Roche AF (1982). A factor
analysis of cranial base and vault dimensions in children.Am I Phys Anthropol 58:271-279.
Read DW, Lestrel PE (1986). Comment on uses of homologous-point measures in systematics: A reply to Bookstein et al.Syst Zool 35:241-253.
Richtsmeier JT, Cheverud JM, Lele S (1992). Advances inanthropological morphometrics. Ann Rev Anthropol21:283-305.
Rohlf FJ (1996). Appendix II: Morphometric resources available onthe Internet. In: Advances in morphometrics. Marcus LF,Corti M, Loy A, Naylor GJP, Slice DE, editors. NATO ASISeries A. New York: Life Sciences 284, pp. 553-560.
Rohlf FH, Marcus LF (1993). A revolution in morphometrics. TREE8:129-132.
Rohlf F, Slice D (1990). Extensions of the Procrustes method forthe optimal superimposition of landmarks. Syst Zool 39:40-59.
Sanborn RT (1955). Differences between the facial skeletalpatterns of Class III malocclusion and normal occlusion.Angle Orthod 25:208-222.
Sato S (1994). Case report: Developmental characterization ofskeletal Class III malocclusion. Angle Orthod 64:105-112.
Scott JH (1958). The cranial base. Am J Phys Anthropol 16:319-348.Scott JH (1967). Dento-facial development and growth. Oxford:
Pergamon Press.Sokal RR, Rohlf FJ (1981). Biometry. New York: W.H. Freeman Co.Solow B, Tallgren A (1976). Head posture and craniofacial
morphology. Am J Phys Anthropol 44:417-435.StapfWC (1948). A cephalometric roentgenographic appraisal of the
facial pattem in Class III malocclusion. Angle Orthod 18:20-23.Varjanne I, Koski K (1982). Cranial base, sagittal jaw
relationship and occlusion. Proc Finn Dent Soc 78:179-183.Williams S, Andersen CE (1986). The morphology of the
potential Class III skeletal pattern in the growing child. AmJ Orthod 89:302-311.
702 Singh et al.

Cranial Base in Class III Subjects
Appendix*
Statistical comparisons of average geometries calculated byGeneralized Orthogonal Procrustes analysis.
(1) The Procrustes sum of squares
Let X1,X2,...Xn be n (K and D) matrices of landmark
coordinates (K = landmarks; D = dimensions). Let X1,X2,...Xnbe translated and rotated matrices. Calculate the sum of
square as:
Gs=tr [ XXT nX T]i=l
n
= 2 trXXT - ntrXXTi=l
(2) Compare geometries.
Let X1,X2,...Xn be a sample from the first population, and letY, Y2,...Yn be a sample from the second population. Let Y,Xbe mean forms of the two populations. Calculate GS(X), or
the Procrustes sum for X, and GS(Y), the Procrustes sum forY. Fit Y to X. Calculatex
jll = Gs Y = tr i(x - Y*)- Y*
where Y* is the fitted Y
= trXXT + yyT - 2trZZT
where Z = Procrustes mean of X,Y.
Under i.i.d. perturbations (Langron and Collins, 1985),
GS(X) ~ 02X2 and Gs(Y) - &y2X2 are independent.
where L1 =(n - 1)(KD-D(D + 1))
L2=(m-1)(KD- D(D+ 1))
Therefore,
Gs(X) + Gs(Y) _ (y2
Under the null hypothesis,
Gs (X,Y)= JI
whereL3=KD - fD(D + 1) and F2=c2(n + )
Thus,
[G Y) ] nmnF = GS(X) + Gs(Y)/(L1 + L2)
~ FL, (Ll + L2)
since GS(X,Y) x n+m X 1) %n +m XCT L
and 2 [Gs (X) + Gs (Y) - X2
they are independent.
(3) Calculate F value.
nm 'I(n+m-2JIIUn+m)t n+m )F= Gs(X)+Gs(Y)
Langron SP, Collins AJ (1985). Perturbation theory for generalizedProcrustes analysis. J R Statist Soc Br 47:277-284.
Based on a personal communication from S. Lele. However,any errors are the responsibility of the authors.
j Dent Res 76(2) 1997 703