morphometric study of different stocks of labeo...
TRANSCRIPT

CHAPTER - 2
Morphometric study of different stocks of Labeo fimbriatus using Truss analysis

2.1. INTRODUCTION
Identifying intraspecific units or stocks of a species with unique morphological
characters enables a better management of these subunits of species and ensures perpetuations of
the resources (Turan, 1999). Fish geneticists are interested to identify different stocks with
regard to performance variation because identification of superior stocks in relation to
performance of economically important characters is of paramount importance in forming base
population for stock improvement programmes (Chetan, 2005). Phenotypically similar stocks
(populations within species) when occur together in an area are less divergent and cannot be
easily distinguished. Hence, it is necessary to identify characters that demarcate the stocks. The
characters involved may be morphological, ecological, behavioral, or physiological; they are
assumed to be genetically based (Pradeep, 2006). There are numerous methods to delineate the
stocks and species based on morphological and genetic levels. The two popular methods of stock
identification are
i. Identification based on morphometries.
ii. Identification based on gene frequencies.
However, the major limitation of morphological characters at the intra-specific level, is
that phenotypic variation is not directly under genetic control but subject to environmental
modification (Clayton, 1981). Environmentally induced phenotypic variation, however, may
have advantages in stock identification, especially when the time is insufficient for significant
genetic differentiation to accumulate among populations. This phenotypic variation can be
assessed by morphometric analysis. Morphometric analysis can thus be a first step in
investigating the stock structure of species with large population sizes.
43

Since many years, morphometric investigations have been based on a set of traditional
measurements which represent size and shape variation in the organisms. These measurements
have been criticized as they are concentrated along the body axis with only sampling from depth
and breadth, and most measurements are in the head. These conventional data sets are biased and
they have got several weaknesses too.
1. They tend to be in one direction only (longitudinal).
2. Some landmarks are used repeatedly (tip of the snout and vertebral column).
3. Many measurements extended much over the body.
4. Amount of distortion (soft bodied animals) due to preservation cannot be easily estimated.
5. Many landmarks are external rather than anatomical and their placement may not be
homologous from form to form.
Thus, these traditional measurements represent a biased coverage of body form and
success in selecting effective characters has been attributed to a matter of chance.
As an alternative, a new system of morphometric measurements called the 'Truss
network system' has been increasingly used for species and especially for stock differentiation.
Truss has largely overcome the disadvantages of conventional morphometric studies. Truss
analysis has been developed by fish taxonomists as a taxonomic tool to discriminate or quantify
the difference between physically similar fish species and stocks (Strauss and Bookstein, 1982).
Morphometric studies of this nature require the systematic measurement of distances (truss lines)
between pairs of land marks across the body, thus forming a sequential series of connected
polygons termed as truss box. The distances between the land marks provide more
comprehensive coverage of form for greater discriminating power. It has been used in fisheries
science for various purposes such as
44

1. Computing average body shapes and characterizing growth trends
2. Intergroup comparison
3. For stocky species identification
4. Estimate biomass of a population and to investigate shape characteristics
5. Quantification of ch anges in fish condition
In the light of above facts, morphometric study of Labeo fimbriatus stocks of different
river basins; the Cauvery, the Tungabhadra and the Vedavathi rivers of peninsular India was
undertaken in the present study. As there is a very little knowledge on the morphometries of this
fish species and study of this nature would be useful to understand the status of this species in
natural water bodies.
45
2.2 REVIEW OF LITERATURE
A popular definition of taxonomic species is: "Species are groups of interbreeding natural
populations that are reproductively isolated from other such groups" (Mayr, 1963). Population of
a species may not be confined to a single place but distributed over large area of different
enviroiunents and such populations show little changes in their genotype or phenotypes leading
the new races or stocks, etc. A fish stock can be defined as 'a local population adapted to a
particular environment, having genetic differences fi'om other stocks as a consequence of this
adaption' (MacLean and Evans, 1981).
Morphological characters have been commonly used in fisheries biology to measure
discreteness and relationships among various taxonomic categories. There are many well
documented morphometric studies which provide evidence for stock discreteness. For example,
morphological variation of European cyprinid, the chub, Leucius cephalus, within and across
Central European drainages was successfully differentiated by morphometries (Jerry and Cairns,
1998). In any management regime, the identification of stock becomes a critical element. For the
identification of these putative stocks at the practical level, the study of the population
parameters and physiological, behavioral, morphometric, meristic, calcareous, biochemical and
cytogenetic characters are usefiil. Of these, the morphometric investigations are based on a set of
measurements of the body form (Hubbs and Lagler, 1947) and are of considerable importance
for both taxonomic and management aspects as well.
Morphometric study can be used to distinguish different stocks of a species. The study on
the life history, morphology and electrophoretic characteristics of five allopathic stocks of lake
white fish, Coregonus clupeaformis showed that morphometry could be used as a potential
technique for discrimination of the stocks (Ihssen et al, 1981).
46
Morphological status of the Mesopotamian spiny eel, Mastacembelus mastacembelus
populations from Karakay Reservoir, Tohma Stream and Tigris River were investigated using
morphometric and meristic traits. Results revealed that there were significant morphometric
differences among the populations.
However, conventional morphometric data sets are biased and they have got several
weaknesses too. To overcome these problems, a new method called the truss network was
developed in which an even area coverage over the entire fish form was possible (Strauss and
Bookstein, 1982; Rohlf, 1990; Bronte et al, 1999). Morphometric studies of this nature require
systematic measurements of distances between pairs of landmarks across the body (truss lines
and often called as 'trusses'), thus forming a sequential series of connected polygons termed as
'trussed' box (Strauss and Bookstein, 1982). Coverage of the trussed box must extend along the
longitudinal, vertical and oblique axes for complete quantification of body shape. This method
can discriminate stocks and species of varied fishes and prawns as well.
Morphometry based on truss network data has been used for stock identification, species
discrimination, ontogeny and functional morphology. Truss network analysis has been
successfully used to discriminate and describe a wide array of morphologically-distinct species
across a range of habitats. Such studies have involved commercially important species (Bronte et
al, 1999), ecologically specialized species (Dynes et al, 1999), endangered species (McElroy
and Douglas, 1995) and descriptions of new species (Rauchenberger, 1988).
Winans (1984) found better results from the truss network study compared to
morphometries while surveying differences among the three natural populations of Chinook
salmon. Truss data provided more scientific information concerning shape changes among these
populations.
47
The land mark based truss network analysis was carried out in six selected species of
Serranid fishes. The results indicated the significant differences among species with respect to
body height and caudal peduncle and these differences were related to differences in habitat and
feeding habits among the species (Cavalcanti, 1999).
The study on truss morphometric characterization of eight strains of Nile tilapia
(Oreochromis niloticus) reported the significant differences between male and female sexes of
the eight strains of Nile tilapia representing Egypt, Ghana, Kenya, Israel, Singapore, Taiwan and
Thailand (Velasco et al, 1996).
Effect of starvation on morphometric changes in the Chinese minnow, Rhyncocypris
oxycephalus was studied by using truss analysis and the results indicated that the truss
dimensions of the head and trunk region as well as the abdomen were increased significantly
(P<0.05) through feeding or starvation. Truss dimensions of caudal region generally decreased
through starvation particularly those dimensions at the hind part of the trunk. For over 30 years,
most morphometric investigations based on the classical dimensions of length, depth and width
of the fish shape, primarily in the head and tails have produced uneven and biased area coverage
of the entire body. Hence truss study is of paramount significance discriminating shape variation
offish (Parke/a/., 2001).
The study on genetic heterozygosity and morphological variability among six species of
freshwater sculpins, genus Cottus (Teleostei: Cottidae) revealed the existence of strong linear
association between heterozygosity and morphological variance (Strauss, 1989). Garavello
(1992) reported the geographical variation in Leporinus friderici (Bloch) from the Parana-
Paraguay and Amazon river basins. The study on morphological variations among the
populations of Leporinus friderici from three South American biogeographic regions: Parana-
48

Paraguay and Amazon river basins of Brazil and Marowizine river basin of Suriname using truss
analysis revealed that the three populations overlap considerably in size for all morphometric
characters, although mean values indicate the Suriname and Parana-Paraguay populations are
similar and somewhat larger than the Amazonian population.
Three stocks of Liza abu (mugilid species inhabiting Asia) from the rivers Orontes,
Euphrates and Tigris were investigated using genetic and morphometric data. AUozyme
electrophoresis for genetic comparison and the truss network system for morphometric
comparison were simultaneously applied to the same sample set. Highly significant
morphological differences were observed between the three stocks of Liza abu (Turan, 2004).
To study the morphological differences between four populations of genus Coilia
(Teleostei: Clupeiforms) and to identify them conveniently, Nine-teen point truss network was
used. Results showed that populations of different Coilia species living in geographic proximity
are more similar than conspecifics living farther apart and it concluded that separation and
adaption are important to morphological difference (Cheng et al, 2005).
The genetic and morphological variation of blue fish, Pomatomus saltatrix were studied
based on morphometric and meristic analysis of samples collected throughout the Black Seas,
Marmara, Aegean and eastern Mediterranean Seas. The study indicated existence of the three
morphologically differentiated groups of Pomatomus saltatrix and the pattern of morphological
differentiation also reflected their geographic isolation (Turan, 2006).
Morphometric variation among sardine {Sardina pilchardus) populations from the
northeastern Atlantic and the western Mediterranean was analyzed by truss analysis (Silva,
2003). The analysis explored the homogeneity of sardine shape within the area studied, as well as
its relation to that of adjacent and distant populations (Azores and northwestern Mediterranean).
49

Principal component analysis on size-corrected truss variables and cluster analysis of mean fish
shape using landmark data indicated that the shape of sardine off southern Iberia and Morocco is
distinct from the shape of sardine in the rest of the area. The two groups of sardine are
significantly separated by discriminant analysis, and their validity was confirmed by large
percentages of correct classifications of test fish (87 and 86% of fish from the test sample were
correctly classified into each group, respectively).
Degree of differentiation among populations of twaite shad, Alosa fallax nilotica, in
Turkish territorial waters was evaluated with the truss morphometric system (Turan, 2001) using
Discriminant Function (DFA) and Principal Component Analysis (PCA). It revealed that the
observed differences were mainly from posterior morphometric measvurements of the fish. The
patterns of morphological differentiation suggested that there is limited exchange of individuals
between areas to homogenize populations phenotypically fi-om the Black and Aegean seas to
Eastern Mediterranean sea.
Morphometric investigation was conducted on five species within the Labeoin group, of
which four representing peninsular Malaysia while the fifth from Cambodia. The twenty seven
characters chosen were measured on the truss network concept. The study showed the potential
of these characters in clarifying less well defined species within this group (Siti Azizah et al,
2005).
The morphometric and genetic analysis of Indian mackerel {Rastrelliger kanagurta) from
peninsular India (Jayashankar et al, 2004) was undertaken in a holistic approach, combining one
phenotypic (truss) and two genotypic methods (Protein polymorphisms and RAPD) to analyze
possible population differences in Indian mackerel (Rastrelliger kanagurta) from selected
50

centers in the East and West coasts of India. The resuhs indicated no significant differences
among the three populations of Rastrelliger kanagurta.
Most of the studies indicated that the results of the morphometric anlaysis of different
populations or species were corroborate with genetic anlaysis using RAPD markers (Jayashankar
et al, 2004). However, cases where morphometric and genetic data indicate different scenarios
of population structuring are also not uncommon (Salini et al, 2004; Levi et al, 2004).
51
2.3 MATERIALS AND METHODS
2.3.1 Materials
2.3.1.1 Source and details of the experimental animal
The three stocks of Labeo fimbriatus representing Cauvery, Tungabhadra and Vedavathi
rivers collected and maintained as described in 1.3.1 were used for the present study. The details
of experimental animal are given below.
Scientific Name : Labeo fimbriatus {QXoch., \191)
Common Name : Fimbriatus, Fringe-lipped carp, 'Rohu' (of south India)
Vernacular names : INDIA: Kemmenu (Kannada); Ven-candee, shall (Tamil);
Ruchu (Telugu); Pudusi (Oriya); Tamthee, Tambra (Marathi)
Synonyms : Cirrhinus fimbriatus; Cyprinus fimbriatus; Labeo fimbriatus
Rohita fimbriatus; Cirrhinus nancar; Cyprinus nancar, etc. Rank : Species
NCBI Taxonomy : 182801
2.3.2 Methods
The three different stocks of Labeo fimbriatus viz., Cauvery, Tungabhadra and Vedavathi
formed the study materials. The fish harvested after the 24 weeks of growth trial period were
sacrificed and kept in a deep fi-eezer at - 40°C before being used for the truss network study. A
total of 90 specimens representing 30 numbers fi"om each stock were used for the truss net work
measurements (Table 2.1). The specimens consisted approximately of same age group of both
the sexes.
52

Table 2.1 Details of flmbriatus stocks used for the morphometric study
SI. No.
L.fimbriatus stocks Number Size range (g)
1
2
3
Cauvery
Tungabhadra
Vedavathi
30
30
30
25.64-105.59
31.05-95.19
37.15-87.03
2.3.2.1 Truss network analysis
Pattern of size and shape variation of three different stocks of Labeo flmbriatus were
evaluated by means of truss network analysis. A total of 90 specimens comprising Cauvery,
Tungabhadra and Vedavathi stocks of flmbriatus (30 specimens from each stock) were used for
the study.
2.3.2.2 Positioning
The fresh specimens that were harvested and frozen after growth trials were used for the
study. The frozen specimens were thawed and cleaned by keeping them under ruiming water.
The water traces present were removed using blotting paper and dried gently. A drawing sheet
was sandwiched between two thermacol sheets. The specimen was laid on thermacol sheet and
body posture and fins were teased into a natural position in order to avoid error in measurements.
2.3.2.3 Pinning
The morphological or anatomical land marks were selected along the outline of the
specimen (Figure 2.1 and Table 2.2). A total often landmarks were identified on the specimens.
Long round head pins were pierced at the 10 preselected landmarks in such a way that the tip of
the pin left an imprint on the drawing sheet sandwiched between the thermacol sheets. The
morphological or anatomical landmarks and position of pinning are shown in Plate 2.1.
53
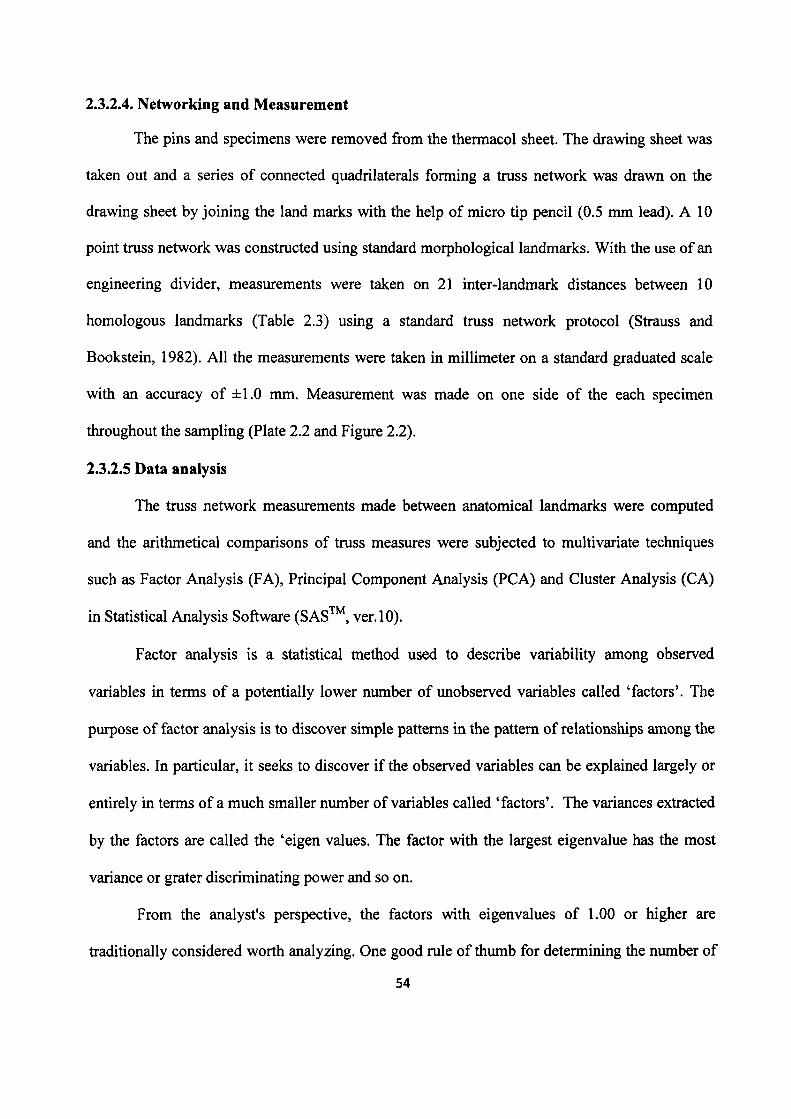
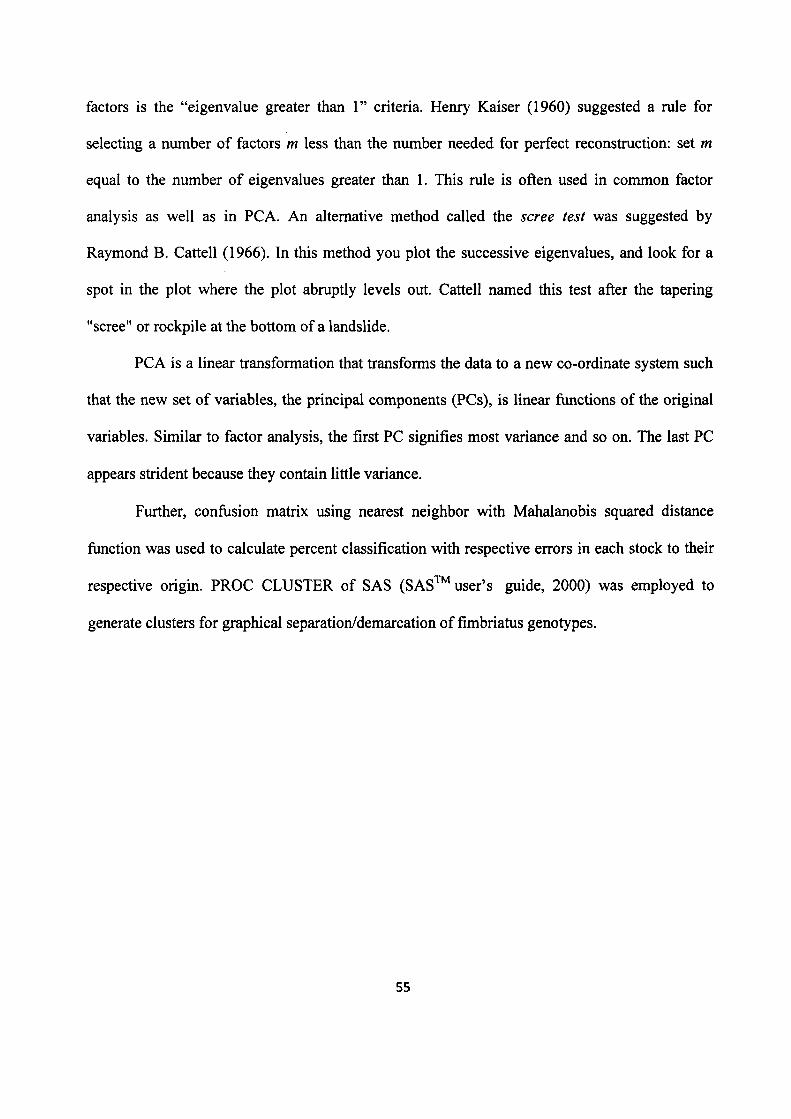
2.3.2.4. Networking and Measurement
The pins and specimens were removed from the thermacol sheet. The drawing sheet was
taken out and a series of connected quadrilaterals forming a truss network was drawn on the
drawing sheet by joining the land marks with the help of micro tip pencil (0.5 mm lead). A 10
point truss network was constructed using standard morphological landmarks. With the use of an
engineering divider, measurements were taken on 21 inter-landmark distances between 10
homologous landmarks (Table 2.3) using a standard truss network protocol (Strauss and
Bookstein, 1982). All the measurements were taken in millimeter on a standard graduated scale
with an accuracy of ±1.0 mm. Measurement was made on one side of the each specimen
throughout the sampling (Plate 2.2 and Figure 2.2).
2.3.2.5 Data analysis
The truss network measurements made between anatomical landmarks were computed
and the arithmetical comparisons of truss measures were subjected to multivariate techniques
such as Factor Analysis (FA), Principal Component Analysis (PCA) and Cluster Analysis (CA)
in Statistical Analysis Software (SAS™, ver.lO).
Factor analysis is a statistical method used to describe variability among observed
variables in terms of a potentially lower number of unobserved variables called 'factors'. The
purpose of factor analysis is to discover simple patterns in the pattern of relationships among the
variables. In particular, it seeks to discover if the observed variables can be explained largely or
entirely in terms of a much smaller number of variables called 'factors'. The variances extracted
by the factors are called the 'eigen values. The factor with the largest eigenvalue has the most
variance or grater discriminating power and so on.
From the analyst's perspective, the factors with eigenvalues of 1.00 or higher are
traditionally considered worth analyzing. One good rule of thumb for determining the number of
54
factors is the "eigenvalue greater than 1" criteria. Henry Kaiser (1960) suggested a rule for
selecting a number of factors m less than the number needed for perfect reconstruction: set m
equal to the number of eigenvalues greater than 1. This rule is often used in common factor
analysis as well as in PCA. An alternative method called the scree test was suggested by
Raymond B. Cattell (1966). In this method you plot the successive eigenvalues, and look for a
spot in the plot where the plot abruptly levels out. Cattell named this test after the tapering
"scree" or rockpile at the bottom of a landslide.
PCA is a linear transformation that transforms the data to a new co-ordinate system such
that the new set of variables, the principal components (PCs), is linear functions of the original
variables. Similar to factor analysis, the first PC signifies most variance and so on. The last PC
appears strident because they contain little variance.
Further, confiision matrix using nearest neighbor with Mahalanobis squared distance
fimction was used to calculate percent classification with respective errors in each stock to their
respective origin. PROC CLUSTER of SAS (SAS' ' user's guide, 2000) was employed to
generate clusters for graphical separation/demarcation of fimbriatus genotypes.
55

Fig. 2.1 Schematic ol Labeo fimbriatus showing the location of the 10 external landmarks for truss network analysis
/
•~-"--:5i
Table 2.2 Anatomical landmarks selected for the study
Land Particulars of mark Land mark
1 Tip of the snout
2 Upper end of the operculum
3 Origin of the dorsal fin base
4 End of the dorsal fin base
5 Upper origin of the caudal fin
6 Lower origin of the caudal fin
7 End of the anal fin base
8 Origin of the anal fin base
9 Origin of the pelvic fin base
10 Lower end of the operculum
56
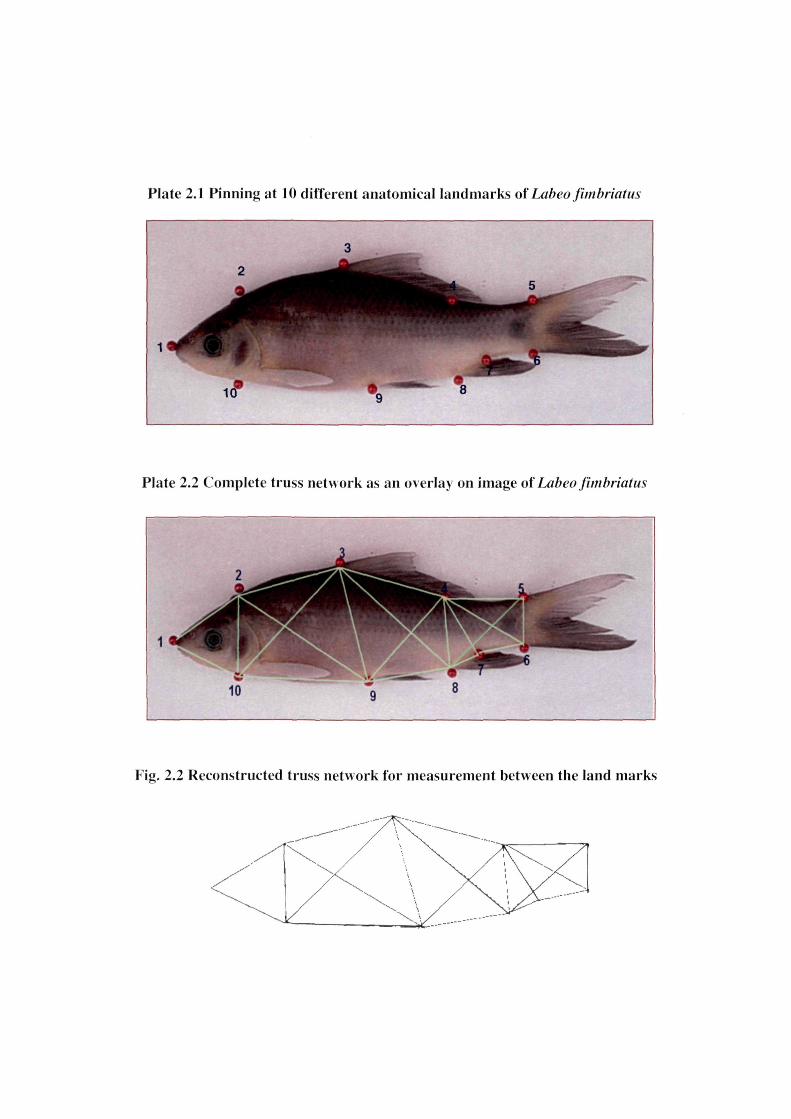
Plate 2.1 Pinning at 10 different anatomical landmarks of Laheofimhriatiis
Plate 2.2 Complete truss network as an overlay on image of Labeo fimbriatus
Fig. 2.2 Reconstructed truss network for measurement between the land marks
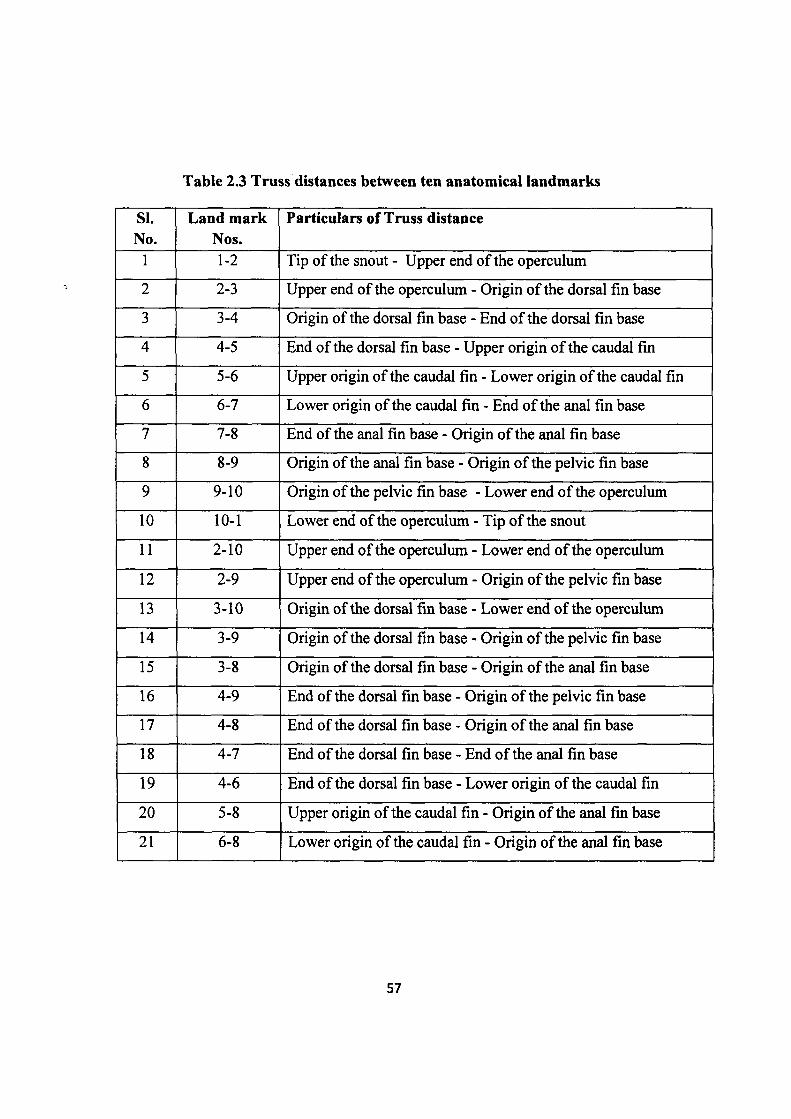
Table 2.3 Truss distances between ten anatomical landmarks
SI. No.
Land mark Nos.
Particulars of Truss distance
1 1-2 Tip of the snout - Upper end of the operculum
2 2-3 Upper end of the operculum - Origin of the dorsal fin base
3 3-4 Origin of the dorsal fin base - End of the dorsal fin base
4 4-5 End of the dorsal fin base - Upper origin of the caudal fin
5 5-6 Upper origin of the caudal fin - Lower origin of the caudal fin
6 6-7 Lower origin of the caudal fin - End of the anal fin base
7 7-8 End of the anal fin base - Origin of the anal fin base
8 8-9 Origin of the anal fin base - Origin of the pelvic fin base
9 9-10 Origin of the pelvic fin base - Lower end of the operculum
10 10-1 Lower end of the operculum - Tip of the snout
11 2-10 Upper end of the operculum - Lower end of the operculum
12 2-9 Upper end of the operculum - Origin of the pelvic fin base
13 3-10 Origin of the dorsal fin base - Lower end of the operculum
14 3-9 Origin of the dorsal fin base - Origin of the pelvic fin base
15 3-8 Origin of the dorsal fin base - Origin of the anal fin base
16 4-9 End of the dorsal fin base - Origin of the pelvic fin base
17 4-8 End of the dorsal fin base - Origin of the anal fin base
18 4-7 End of the dorsal fin base - End of the anal fin base
19 4-6 End of the dorsal fin base - Lower origin of the caudal fin
20 5-8 Upper origin of the caudal fin - Origin of the anal fin base
21 6-8 Lower origin of the caudal fin - Origin of the anal fin base
57

2.4 RESULTS
2.4.1 Truss Network analysis
A total of 90 specimens from all the three stocks (Cauvery Tungabhadra and Vedavathi)
were kept in deep freezer and were used for the truss network analysis. The body weight of
Labeo fimbriatus stocks used for truss analysis ranged from 31.05g to 105.59 g and with an
average weight of 61.31g. (Table 2.1). All the specimens were more or less of the same age
group and were in good condition. The truss network measurements (21) made on three stocks of
Labeo fimbriatus using different land marks (10) are presented in the Table 2.4. The data
obtained from the truss network measurements was tested for normality and outliers were
removed for the analysis viz., Factor analysis, and Principal Component Analysis (PCA) and
Cluster analysis.
The truss data was initially subjected to discriminate analysis by factor method using
maximum multivariate statistical analysis as it was more effective in capturing information about
the shape of an organism. Key characters used for the discrimination of the body form are those
measures that have high eigenvalues. Results of the discriminant analysis indicated that the
eigenvalue for the first factor was 0.00012661 and the second was 0.00004820. The eigenvalues
of both the factors were found considerably low. These two factors combinely explained 52.0 %
of total observed variation in size/shape characteristics in three L. fimbriatus stocks. Of these, the
first factor explained 37%, the second factor 14% of variation (Table 2.5). The remaining factors
contributed not more 10 percent variation to the total variance and the factor patterns revealed
that these factors did not form any meaningfiil biologically explainable morphological groups
(Kaiser, 1960). The proportion of variation explained by each factor (1 to 21) is depicted in the
58

Scree plot (Fig. 2.3). The plot drawn on the basis of factor analysis did not segregate the three
fimbriatus stocks into separate groups which can be seen in Figure 2.4.
The Principal Component Analysis (PCA) was employed for the multivariate description
of morphometric data. In PCA, we had a sample of observations taken on a set of variables and
the objective was to find linear combinations of variables, so that the first linear combination
accounts for maximum possible variation in the data, the second linear combination accounts for
next highest possible variation and so on. PCA combines and sunamarizes the variation
associated with each of a number of measured variables into a smaller number of principal
components (PCs) which are linear combinations of several variables that describe the variation
in the shape in pooled sample. PCs were used to produce graphs to visualize relationships among
the individuals of groups by plotting population centroids of first two principal components.
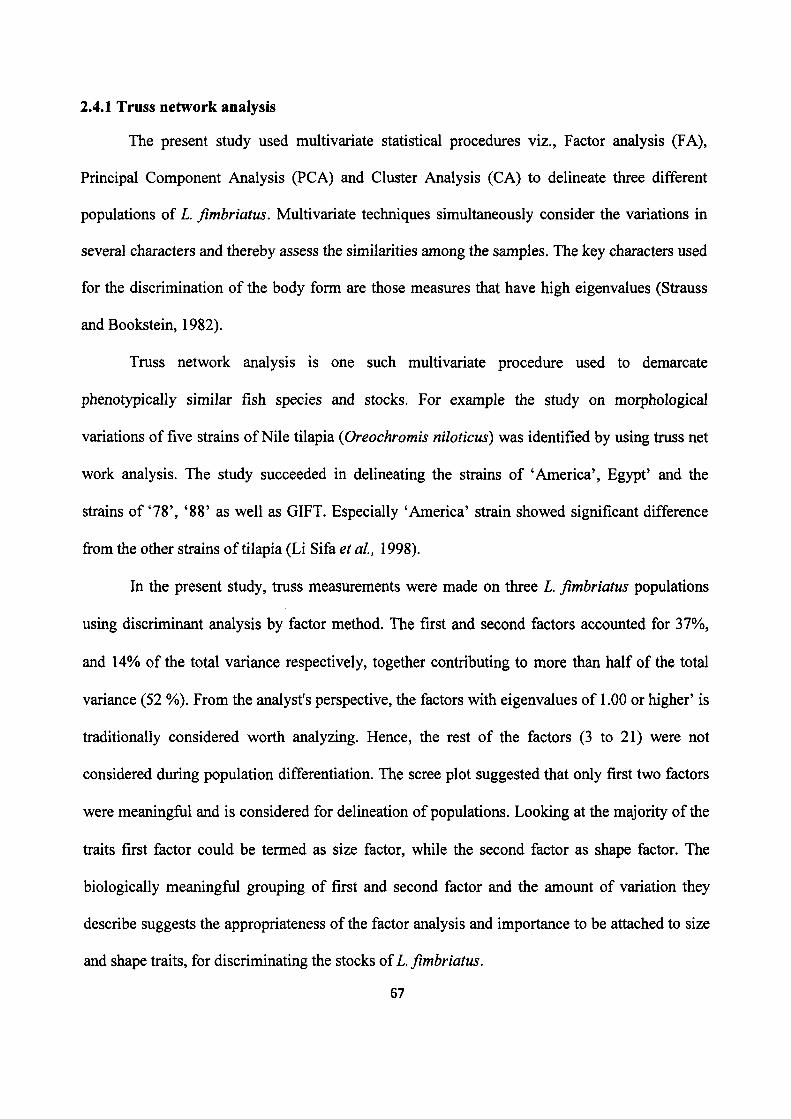
In the present study, morphometric variation among three populations of L. fimbriatus
was visualized via scatter plot of the scores of the first two principal component factors. This
enabled the evaluation of the relation between the three stocks by means of proximity in the
space defined by components. Results showed that the three stocks of fimbriatus did not form
separate groups and is depicted in the Figure 2.5.
Cluster Analysis (CA) involved the search through multivariate data for observations that
are similar enough to each other to be usefully identified as part of common cluster. Cluster
consists of observations that are close together and that the cluster themselves are separated. In
the present study, the truss data was subjected to PROC CLUSTER procedures of SAS " . The
samples of three fimbriatus population did not form any clusters and is depicted in the Figure
2.6. The cluster analysis also supports the un-group structwe highlighted by the Principal
Components Analysis.
59
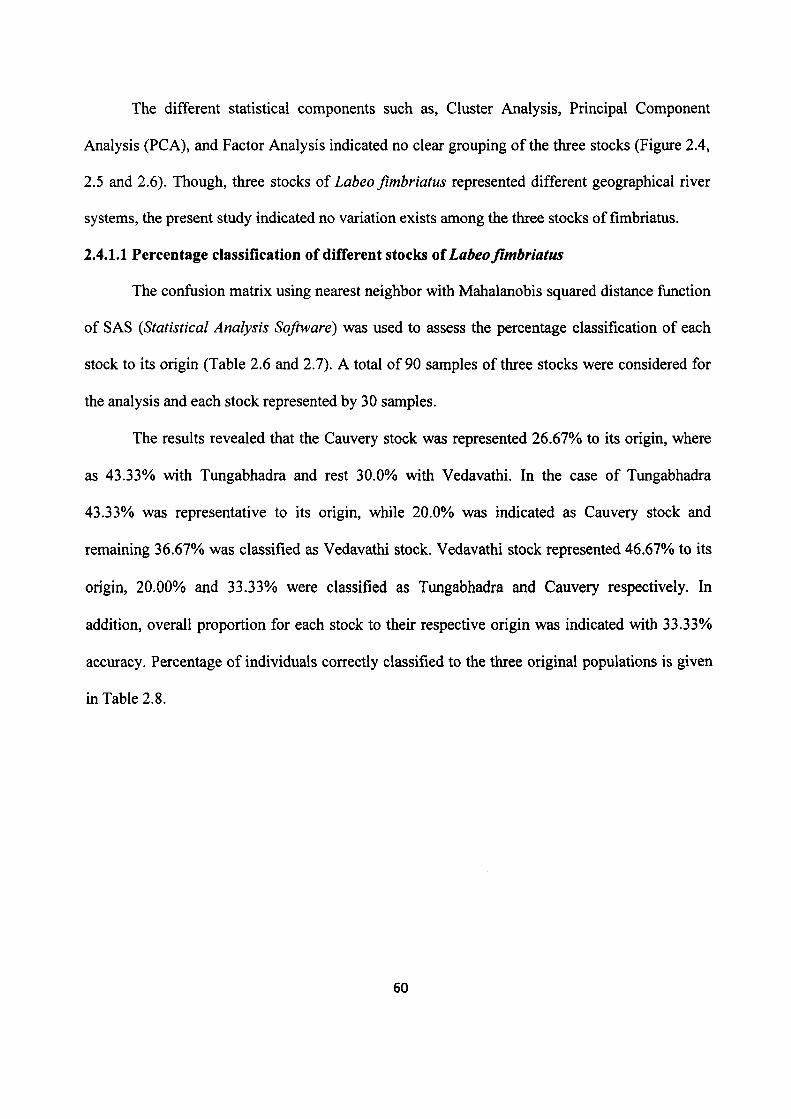
The different statistical components such as, Cluster Analysis, Principal Component
Analysis (PCA), and Factor Analysis indicated no clear grouping of the three stocks (Figure 2.4,
2.5 and 2.6). Though, three stocks of Labeo Jimbriatus represented different geographical river
systems, the present study indicated no variation exists among the three stocks of fimbriatus.
2.4.1.1 Percentage classification of difTerent stocks of Labeofimbriatus
The confusion matrix using nearest neighbor with Mahalanobis squared distance function
of SAS {Statistical Analysis Software) was used to assess the percentage classification of each
stock to its origin (Table 2.6 and 2.7). A total of 90 samples of three stocks were considered for
the analysis and each stock represented by 30 samples.
The results revealed that the Cauvery stock was represented 26.67% to its origin, where
as 43.33% with Tungabhadra and rest 30.0% with Vedavathi. In the case of Tungabhadra
43.33% was representative to its origin, while 20.0% was indicated as Cauvery stock and
remaining 36.67% was classified as Vedavathi stock. Vedavathi stock represented 46.67% to its
origin, 20.00% and 33.33% were classified as Tungabhadra and Cauvery respectively. In
addition, overall proportion for each stock to their respective origin was indicated with 33.33%
accuracy. Percentage of individuals correctly classified to the three original populations is given
in Table 2.8.
60

-C5
o
u V.
Si s o <u
TS cs E B
H
3 « s o
C
3
H
'j-i „ ^
I/-1 ^ r- -* 0 0 uo ^ O^ p Os r^
so o • * od r^ 0 0 H r o -H M -H <N -H
i/n ^ OO i n r l OS 9 0 so 0\ '— p , sq i r i od r n r-' m so • T
m -H m -H r n 4^
0 0 1 / ^ oo o O o <o p so m ^ O ( N
•4 ( N ^ P~ ^ O^ r'i -* M r l 4^ m +1
I ^ r""! O >n O ( N r-- O^ ' ^ "* r- r~ r~ •4 O r n r- ( N t^' ( N
r l -¥. ( N +1 <N 4^
r-~ „ ^ o SO r^ i n 0 0 . ( N Tj- SO <> so T t r j ^ OS r n od ( N
f ^ -H ( N -H ( N -H
o TT <N OS ( N ^ Ov O ; W - ) r o —' (-Nl — -rr t-^ ^ i r i • ^ m ^
^ +1 • -M Tt- +1
(-n „ r' i n r- so _ 0 0 •— r n so so so m
s s
t^ o i V"! od «* so • ^ s s
so +1 i n -H i n M s s ( N r o __ ( N ( N i n
o\ r o OS • — ' oo i n — J r* i r i m ^ ' T ^ • ^ J • * -t ^ -H ^ -H
E E O r>-i -* r"-! _ 0 0 O E O
r^ —; — 0 0 oo so T5 1 K i n -*' m r' ' i n B PO t r i -H i n 4^ m -H _« -w O o r ' l m 1 ^ oo S Ov ' i n r'^ m M ! • • - )
4; f S o ' i n r~-' r~' i n ^'
4; 1/~1 -H i n -H i n -H
•S o r-1 0 0 m so o (^1 •S o o so -* -* C ) oo B 1 r- r o -* r^ i n <N U »
t f S ( N -H ( N -H <N -H U »
t o i n O m o l •n 1 [ ^ • — O ) p ( 1 o
o rvi m r^ so <N r n
B " ( N -H rxi +1 ( N -H
B (U o 0 0 -* i n oo o <M
E O-i OS rsj — r^i O 01 1 m -* ,—'. i n ty- i n b a^ V l -H i n -H ^ -H
s c/3 s c/3 58 ON o OS 0 0 i n r l O at
E ON f - l •—' 0 0 O O ; "-at
E 0 0 od m' ^' so -*' rW
CA 0 0 m +1 r>-i -H r o -H
in S
9 0 uo • * ( N r o ( N i n
H 9 0
( N ( N r~ O ; ( N ( N H r- ' t N r n ^ r j H r- -H ~" -H "" +1
r- r' m m o oo SO r-O^ CT; oo r-; m r-~
so r~- <N so ( N r- ( i so • — -H •~" -H ' ' -H
so lA^ o <M r~- r - so so l O OS — oo rsj i n
od r^ od ^ r- ( N l / i '— -H — +1 • — ' -M
Wt m oo ( N i n 0 0 m Wt Os m t ^ ^ i n -
T t ' J - -*' ^ • r'-i r o T t r o +1 r n -H 1-1 +1
• * r 1 o 0 0 « ( N __
• * SO r r oo OS • — , f ^
CN ' r i ( N O^ r--) f ^
"* -H r r -H r<-) +1
fO U-) • ^ m so oo m fO r n o o , rsi OS
r* l O ^ m o^ r n f s -* -H • * M m +1
r< i r i . . t ^ ( N m 0 0 r< O ( • ' I • * OO — p ' i / ^ r'i ^ ( N i n r*-!
( N -H r j HH <N M
lo :s ^ x : .« >. '5 C k. '5
m "S V I U
'5 ei: u ^ .:« >
'5 BH • a
a I
t2
S
^ c
c s j
I
I rsi
^
kit 530
\a
Kuvempu University Library Jnana Sahyadri Shankaraqhatta
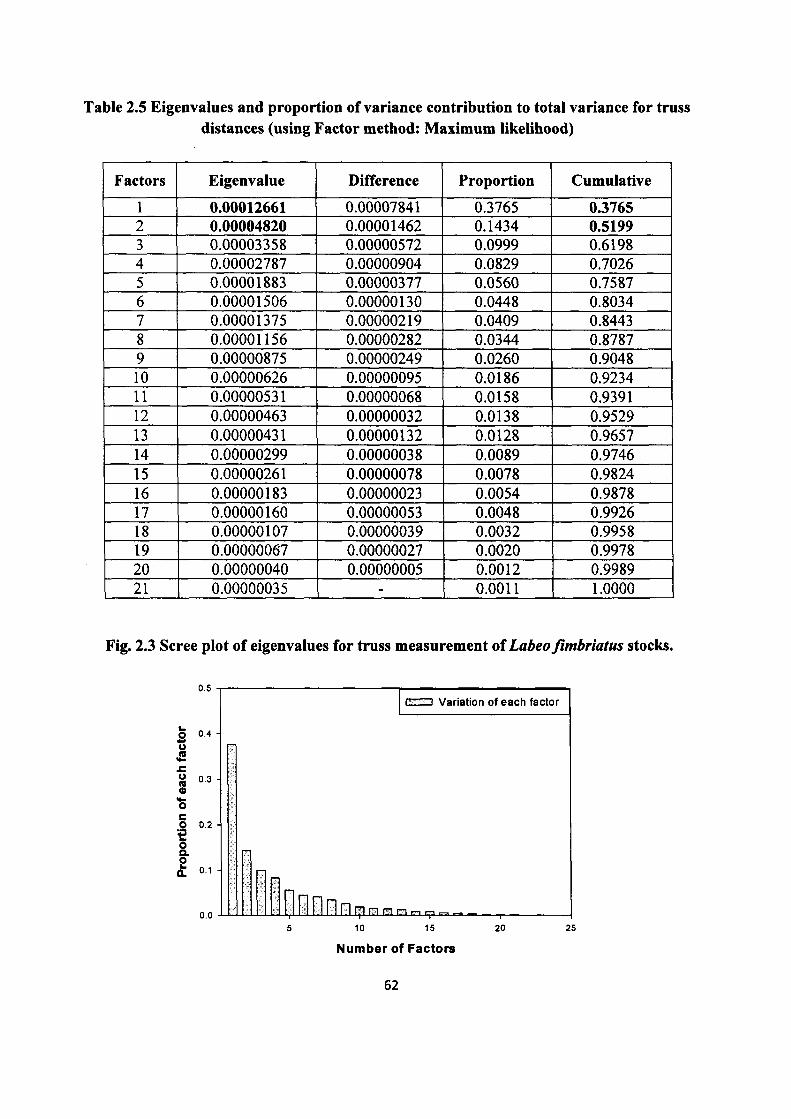
Table 2.5 Eigenvalues and proportion of variance contribution to total variance for truss distances (using Factor method: Maximum likelihood)
Factors Eigenvalue Difference Proportion Cumulative
1 0.00012661 0.00007841 0.3765 0.3765 2 0.00004820 0.00001462 0.1434 0.5199 3 0.00003358 0.00000572 0.0999 0.6198 4 0.00002787 0.00000904 0.0829 0.7026 5 0.00001883 0.00000377 0.0560 0.7587 6 0.00001506 0.00000130 0.0448 0.8034 7 0.00001375 0.00000219 0.0409 0.8443 8 0.00001156 0.00000282 0.0344 0.8787 9 0.00000875 0.00000249 0.0260 0.9048 10 0.00000626 0.00000095 0.0186 0.9234 11 0.00000531 0.00000068 0.0158 0.9391 12 0.00000463 0.00000032 0.0138 0.9529 13 0.00000431 0.00000132 0.0128 0.9657 14 0.00000299 0.00000038 0.0089 0.9746 15 0.00000261 0.00000078 0.0078 0.9824
16 0.00000183 0.00000023 0.0054 0.9878 17 0.00000160 0.00000053 0.0048 0.9926 18 0.00000107 0.00000039 0.0032 0.9958 19 0.00000067 0.00000027 0.0020 0.9978 20 0.00000040 0.00000005 0.0012 0.9989 21 0.00000035 ' 0.0011 1.0000
Fig. 2.3 Scree plot of eigenvalues for truss measurement of Labeoflmbriatus stocks.
0.5
I " O
c O 0.2
••E o Q.
I 0.,
0.0
I''-'" • I Variation of each factor
nnrinnri r l F l r-i r-i ,
10 15
Number of Factors
20 25
62

Table 2.6 The DISCRIM procedure for Nearest Neighbor with Mahalanobis Distances
Observations 90 DF Total 89
Variables 21 DF Within Classes 87
Classes 3 DF Between Classes 2
Table 2.7 Confusion matrix with number of observations and percentage classification of each stock
STOCK Cauvery Tungabhadra Vedavathi Total
Cauvery N
%
8 13 9 30 Cauvery N
% 26.67 43.33 30.00 100.00
Tungabhadra N
%
6 13 11 30 Tungabhadra N
% 20.00 43.33 36.67 100.00
Vedavathi N
%
10 6 14 30 Vedavathi N
% 33.33 20.00 46.67 100.00
Total
%
24 32 34 90 Total
% 26.67 35.56 37.78 100.00
Table 2.8 Class Level Information
STOCK Frequency Weight Proportion Prior Probability
Cauvery 30 30.0000 0.333333 0.333333
Tungabhadra 30 30.0000 0.333333 0.333333
Vedavathi 30 30.0000 0.333333 0.333333
63
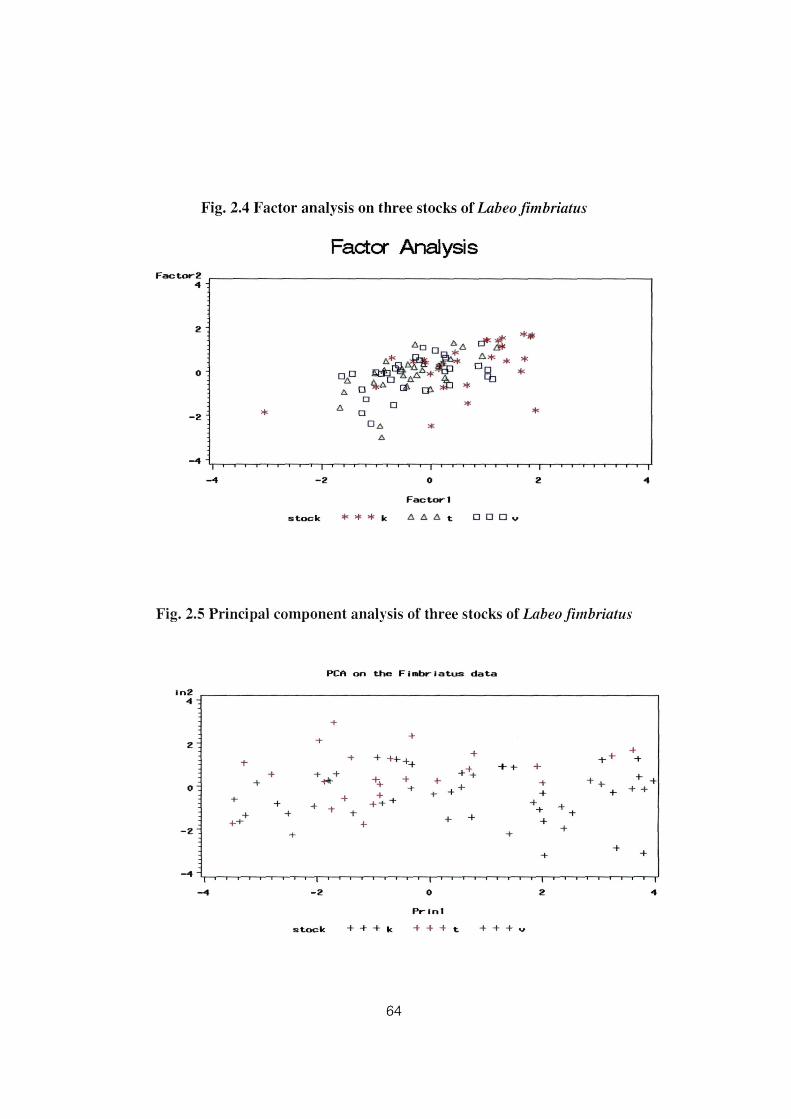
Fig. 2.4 Factor analysis on three stocks oi Labeo fimbriatus
Factor Analysis F a c t o r ?
4
2 :
*
^—1—1—1—1—1—1—1—r
D A * A
—1—1—1—1—1—1—I—1—1—I—1—1—1—1—1—1—1—1—1—1—1—1—1—1—1—I—1—1—1—1—1—r
- 2 O
Factor-1
stock • ^ H ' l c A A A t D D D v
Fig. 2.5 Principal component analysis of three stocks o{ Labeo fimbriatus
PCa on the F imbi^ iatus data
in2
z:
stock
PrinI
+ + + k + + + t + + + V
64

Fig. 2.6 Cluster analysis the three stocks of fimbriatus
Distribution of Truss Observtion^true dusters Scatter* plot of observations
!»fMrln2 4
S:
o:
-i:
HtA
A D
^ — I — I — I — 1 — I — I — I — I — I — [ — I — I — I — I — I — I — I — I — I — I — 1 — I — I — I — I — I — I — I — I — [ —
4 -2 0 2
apr- in I
s t o c k > 4 = * * k A A A t n n D v
' ' ' ' I
4
65

2.5 DISCUSSION
In general, fishes demonstrate greater variance in morphometric traits both within and
between populations than other vertebrates, and are more susceptible to environmentally-induced
morphological variation (Wimberger et al., 1992). The pattern of morphometric distinctness,
detected within the species suggests a direct relationship between the extent of morphometric
divergence and geographic isolation. Geographical isolation can result in the development of
different morphological features between fish populations because of the interactive effects of
environment, selection, and genetics on individual ontogenies produce morphometric differences
within a species (PoUar, 2007). These distinctive species are known as races and referred as
stocks in case offish species.
One of the important considerations in the management of a fishery resource is the
identification of discrete populations or stocks, which are generally defined as self maintaining
groups, temporarily or spatially isolated fi"om one another and considered genetically distinct or
"a stock is an intraspecific group of randomly mating individuals with temporal and spatial
integrity" (Ihssen et al, 1981; Booke, 1981). Failure to recognize or to account for stock
complexity in management imits has led to an erosion of spawning components, resulting into a
loss of genetic diversity and other unknown ecological consequences (Begg et al, 1999). Poor
understanding of fish and fishery management can lead to dramatic changes in the biological
attributes and productivity of a species. Rohlf (1990) has opined that phenotypic variation is
more applicable to study short-term environmentally influenced differences between fish stocks.
In view of the above, the present study was undertaken for the morphological
discrimination of three different stocks of Labeo fimbriatus.
66
2.4.1 Truss network analysis
The present study used multivariate statistical procedures viz., Factor analysis (FA),
Principal Component Analysis (PCA) and Cluster Analysis (CA) to delineate three different
populations of L. fimbriatus. Multivariate techniques simultaneously consider the variations in
several characters and thereby assess the similarities among the samples. The key characters used
for the discrimination of the body form are those measures that have high eigenvalues (Strauss
and Bookstein, 1982).
Truss network analysis is one such multivariate procedure used to demarcate
phenotypically similar fish species and stocks. For example the study on morphological
variations of five strains of Nile tilapia {Oreochromis niloticus) was identified by using truss net
work analysis. The study succeeded in delineating the strains of 'America', Egypt' and the
strains of '78', '88' as well as GIFT. Especially 'America' strain showed significant difference
from the other strains of tilapia (Li Sifa et al, 1998).
In the present study, truss measurements were made on three L fimbriatus populations
using discriminant analysis by factor method. The first and second factors accounted for 37%,
and 14% of the total variance respectively, together contributing to more than half of the total
variance (52 %). From the analyst's perspective, the factors with eigenvalues of 1.00 or higher' is
traditionally considered worth analyzing. Hence, the rest of the factors (3 to 21) were not
considered during population differentiation. The scree plot suggested that only first two factors
were meaningfiil and is considered for delineation of populations. Looking at the majority of the
traits first factor could be termed as size factor, while the second factor as shape factor. The
biologically meaningful grouping of first and second factor and the amount of variation they
describe suggests the appropriateness of the factor analysis and importance to be attached to size
and shape traits, for discriminating the stocks of I. fimbriatus.
67

A careful observation of the first factor suggests that majority of the trait loadings
represent the anterior portion of the fish. However, middle measurement 4-8 was also loaded on
factor 1. Looking at the majority of the traits the factor 1 can be generally termed as anterior
portion (Silva, 2003). On the similar basis as above, the second factor is termed as caudal factor,
in which the parameters that belong to caudal portion are loading. The biologically meaningful
groupings of first and second factors and the amount of variation they are describing suggests the
appropriateness of the factor analysis and importance need to be attached to anterior portion and
caudal portion traits for discriminating the stocks of L. rohita. A large eigenvalues on Factor 1
which is loaded with anterior portion factors indicate that these parameters contribute
substantially to the total variation and need to be incorporated in any stock discrimination
analysis.
The present study did not reveal any significant differences among the stocks. The truss
network analysis clubbed all the three stocks into one group (Fig.6). This indicated that when the
unit free observations were used (as factor analysis does) then there was no variation among the
three populations of Z. fimbriatus.
Similar tests were applied to construct a truss network on M mastacembelus specimens
of Karakaya Reservoir, Tohma Stream and Tigris River. The discriminant function analysis for
morphometric traits clearly separated three M. mastacembelus populations in this study (Cakmak
and Alp, 2010).
PoUar (2007) conducted a study on morphometric variability of Tor tambroides
populations at Simanta, Nan Chong Fa and Wang Muang waterfalls, Khao Nan National Park in
Thailand. The result of the multivariate analysis on 21 truss variables showed differences among
68
all the three waterfalls. From the discriminant analysis, the populations belonging to the three
sampling sites were distinguished.
Mathematical comparisons of truss measures use multivariate techniques such as
Principal Component Analysis. The PCA is one alternative to FA (Factor Analysis), and is
sometimes considered as more conservative and appropriate method for assessing morphological
variation among groups. PCA is a data projection technique for summarizing variability in
complex correlated data sets using a simple algorithm that finds major axes of variation in the
data.
In the present study. Principal Component Analysis (PCA) was used to interpret or
explore the intraspecific variation by plotting the Principal Component scores (PC). The PCs
which revealed significant differences were used for XY plots. Teisser was the first to interpret
the first principal component of morphometric data as a multivariate index of size and secondary
components as shape indices (Cadrin, 1999). A plot of first principal component was scored
against the second principal component and the morphometric variation among three populations
was visualized via PC scores on the scatter plot. The study revealed that the scores on the
scatterplot did not show any clusters for the three populations but were scattered randomly on the
plot. The results indicated that there was homogeneity in morphological structure among the
three populations of Z. fimbriatus.
Bagherian and Rahmani (2009) found the Principal Component Analysis an effective tool
in the morphological discrimination of two populations of shemaya, Chalcalburnus chalcoides
(Actinopterygii, Cyprinidae) in truss network analysis. Results showed that the populatibns and
sexes were clearly separated by PCA.
69
In the present study, Cluster Analysis (CA) revealed that the three populations of L
fimbriatus did not cluster but were spread randomly on the plot indicating no significant
differences in their morphological characters among the three populations.
Similar observation was also reported in few European cyprinids. Though high level of
heterozygosity fits the general trend in European Cyprinids, this conclusion does not hold across
fish families. For example, low levels of morphometric heterozygosity have been reported for the
European perch Percafluvialities L, a common percid in all European waters (Heldstab, 1995).
The study on genetic and morphological variation in a common European cyprinid,
Leuciscus cephalus within and across Central European drainages of the river Rhine, Danube and
Elbe using gel electrophoresis and morphometries indicated low level of divergence m. Leuciscus
cephalus among sites and drainages (Hanfling et al, 1998). The factors suggested for the low
level of divergence of Leuciscus cephalus in European rivers were
1. Recent divergence of populations.
2. Ongoing gene flow across drainages. Possible explanations for ongoing gene flow would
be migration through artificial waterways, stocking by anglers or translocation by
waterfowl.
3. High dispersal capacity also explains the low level of differentiation among the fish
stocks.
In the present study, all the three multivariate analysis (Factor analysis, Principal
Component Analysis and Cluster analysis) provided qualitatively similar results. The three
different population or stocks of L. fimbriatus were not clearly separated by the multivariate
analysis. However, studies on morphology of fimbriatus in peninsular waters are limited and
hence it would be difficult to authenticate the present findings. The study revealed insignificant
70

morphometric heterogeneity among three populations of L. fimbriatus representing Cauvery,
Tungabhadra and Vedavathi rivers.
The reason for homogeneity of these populations however, can be attributed to following
factors
1. Recent divergence of the species.
2. River ranching programmes may have resulted in mixing of different populations.
3. Migration can also be the reason although it could be expected only between
Tungabhadra and Vedavathi both of which are tributaries of River Krishna.
4. Tropical climate and more or less similar mode of habitat
On the other part, environmental factors such as temperature, salinity, food availability or
prolonged swimming may also determine the potential phenotypic discreteness.
Separation and adoption are important for morphological difference between organisms.
The potential capacity of populations to adapt and evolve as independent biological entities in
different environmental conditions is restricted by the exchange of individuals between
populations. A sufficient degree of isolation may result in notable phenotypic and genetic
differentiation among fish populations within a species, which may be recognizable as a basis for
separation and management of distinct populations (Turan, 2004).
However, stock identification based on morphological characters must be confirmed by
genetic evidence to verify that the phenotypic differences reflect some degree of reproductive
isolation rather than simply environmental differences. On the other hand, stock discrimination
by morphologic markers might be appropriate for fisheries management even if this phenotypic
divergence is not reflected by genetic differentiation (Cadrin, 2000).
71

The classification of different stocks oi Labeo flmbriatus using nearest neighbourhood of
Mahalanobis distance function indicated percentage contribution offish samples of each stock to
their respective origin. All the three stocks were not represented to 100% accuracy in their
origins but were represented less than 50% to their origin i.e. Cauvery stock with 26.67%,
Tungabhadra with 43.33% and Vedavathi with 46.67%. However, all three stocks did not also
classify completely (100%) according to their origin making it difficult to interpret and classify
them into separate groups.
The truss network analysis did not reveal any morphological differentiation among the
three L. fimbriatus stocks. However, failure to detect the stock structure does not necessarily
mean that there is no stock differentiation but probably is the failure of the method used for stock
identification (Hay and McCarter, 1997). Such observations were made during the stock
assessment of Herring in Baltic Sea, where previously no differentiation was detected. But later
with the use of microsatellite markers significant structuring of herring was found in seven
locations within Prince William Sound and Bering Sea (O'Connell et.al, 1998).
72

2.6 SUMMARY
1. Morphometric study of three stocks of Labeo fimbriatus was studied using 'Truss net
work analyses', a systematic measurement of distances between pairs of landmarks
across the body forming a sequential series of connected polygons termed as truss boxes.
It covers entire fish body form and hence the complete quantification of body shape. This
method is therefore, used in discriminating morphologically similar fish species and
stocks.
2. The truss measurements (21) between 10 anatomical land marks were carried out on 90
specimens, comprised of Cauvery, Tungabhadra and Vedavathi stocks of L. fimbriatus
(30 specimens per stock) and subjected to multivariate statistical analysis, viz., Factor
Analysis (FA), Principal Component Analysis (PCA) and Cluster Analysis (CA).
3. Results showed that the three stocks of I. fimbriatus did not form separate group/clusters
indicating no morphological variations between the three stocks.
73