morphology and composition of gold in a lateritic pro le ... · pdf filemorphology and...
TRANSCRIPT
Morphology and composition of gold in a lateritic profile,Fazenda Pison ‘‘Garimpo’’, Amazon, Brazil
J.H. Larizzatti a,*, S.M.B. Oliveira b, C.R.M. Butt c
a CPRM/Geological Survey of Brazil, Av. Pasteur, 404, Rio de Janeiro, RJ 22290-240, Brazilb Universidade de Sao Paulo, Rua do Lago, 562, Sao Paulo, SP 05508-900, Brazil
c CRC LEME, CSIRO Exploration and Mining, PO Box 1130, Bentley, WA 6102, Australia
Abstract
This study describes the morphological evolution of gold grains in a lateritic weathering profile in an equatorial rainforest climate.Primary sources of gold are quartz veins associated with shallow granophyric intrusion. Gold grains were found in fresh ore, saprolite,transition zones, ferruginous duricrust, red latosol, and yellow latosol. Irregularly shaped grains predominate, with smaller proportionsof dendritic and prismatic forms. Gold grains are weathered in the uppermost 10 m of the regolith. Mean gold grain size is maximum inthe duricrust (>125 lm) and decreases progressively upward into the yellow latosol (<90 lm). Voids and corrosion pits appear on grainsurfaces, and progressive rounding is observed from the bottom of the profile to the top. Gold grains can be classified as either homo-geneous or zoned with respect to their chemical composition. Homogeneous grains contain 2–15% Ag (mean 8.3%). Zoned grains havemore variable Ag contents; grain cores have means of approximately 10% or 23% Ag, with Ag-poor zones of approximately 3.7% Agalong internal discontinuities and/or outer rims. Formation of Ag-poor rims is due to preferential depletion of silver. Processes responsiblefor duricrust formation may preserve some grains as large aggregates, but subsequent transformation into latosol further modifies them.� 2007 Elsevier Ltd. All rights reserved.
Keywords: Gold grains; Morphology; Composition; Weathering; Laterites; Amazon
1. Introduction
The supergene mobility of gold in weathering profileshas been well documented in different parts of the world(e.g., Boyle, 1979; Mann, 1984; Wilson, 1984; Websterand Mann, 1984; Davy and El-Ansary, 1986; Michel,1987; Freyssinet and Butt, 1988; Colin et al., 1989a,b;Freyssinet et al., 1987; Grimm and Friedrich, 1990; Colinand Vieillard, 1991; de Oliveira and Campos, 1991; San-tosh and Omana, 1991; Vasconcelos and Kyle, 1991; EdouMinko et al., 1992; Bowell, 1992; Freyssinet, 1993; Law-rance and Griffin, 1994; Sergeev et al., 1994; Porto andHale, 1996; de Oliveira and de Oliveira, 2000). Evidenceof gold dissolution includes the decreasing size of goldgrains from the bottom to the top of weathering profiles
and the presence of corrosion features on the surface of pri-mary crystals (Colin et al., 1989a,b; Colin and Vieillard,1991; Porto and Hale, 1996). Gold precipitation is demon-strated by the formation of secondary crystals of high fine-ness and characteristic morphology (Angelica et al., 1995;Freyssinet et al., 1987; Grimm and Friedrich, 1990; Bowell,1992; Lawrance and Griffin, 1994) and gold nuggets enclos-ing neoformed goethite (Machairas, 1963; Wilson, 1984;Vasconcelos and Kyle, 1991; Santosh and Omana, 1991;de Oliveira and Campos, 1991; Zang and Fyfe, 1993). Fur-ther data supporting gold mobility in the supergene envi-ronment include elevated gold concentrations in streamwaters draining auriferous zones (Benedetti and Boulege,1991; Andrade et al., 1991) and grain growth in stream sed-iments (Eyles, 1990; Groen et al., 1990; Craw, 1992;Youngson and Craw, 1995; McCready et al., 2003). Theobjective of this study is to provide some data on themorphology and composition of gold in a well-preserved
0895-9811/$ - see front matter � 2007 Elsevier Ltd. All rights reserved.
doi:10.1016/j.jsames.2007.06.002
* Corresponding author. Tel.: +55 21 2542 0586; fax: +55 21 2295 4292.E-mail address: [email protected] (J.H. Larizzatti).
www.elsevier.com/locate/jsames
Journal of South American Earth Sciences 25 (2008) 359–376

lateritic profile derived from a quartz (+pyrite) vein systemin the Tapajos region.
2. Description of the area
2.1. Climate
The Fazenda Pison ‘‘Garimpo’’ (artisinal mine working)is located in northern Brazil, near the Tapajos River, about600 km SE of Manaus, Amazonas State (Fig. 1). The areahas a warm to hot humid rainforest climate, with meanminimum temperature of 17 �C (February), mean maxi-mum temperature of 38 �C (July), and mean annual rainfallof 2750 mm. The relief is of the ‘‘half-orange’’ type, at ele-vations of 140–200 m above sea level.
2.2. Geology
The Garimpo is located in the Tapajos Province(Almeida et al., 1981), Tapajos Mineral Province (Santoset al., 2001). Felsic volcanic rocks (Iriri Group, Andradeet al., 1978; CPRM, 1999) occur where shallow graniticintrusions (Maloquinha Intrusive Suite; Santos et al.,1997) are emplaced along brittle shear zones.
Primary mineralization at Fazenda Pison follows athird-order brittle shear zone (N20E) hosted by finegranophyric rock. The mineralized veins are dislocated
by late sinistral brittle faults (ENE). A hydrothermalalteration envelope follows the host structure and isexpressed by mineralogical zoning around the mineralizedquartz veins:
Central zone: gold, quartz, white mica, epidote, pyrite,hematite, and magnetite;
Intermediate zone: minor gold, quartz, white mica, epi-dote, fluorite, and magnetite; and
Distal zone: minor gold, quartz, white mica, chlorite,and magnetite.
At the top of the saprolite, a meter-wide stockwork zoneis visible adjacent to the quartz veins. The lode is subverti-cal, with an overall width, including the alteration zone, of20 m. Rounded, decimeter-sized, quartz-rich zones can beobserved within the stockwork zone.
The Amazon region is characterized by a deep lateriticregolith, and at Fazenda Pison, the weathering profile is20–30 m deep. The studied profile is located in a hillslope.Six main units can be recognized in a fully preserved later-itic profile (Fig. 2):
1. Saprolite: >20 m thick, light red, with well-preservedprimary fabrics and structures. Primary white micas canbe recognized, but feldspars, chlorite, fluorite, and sulp-hides cannot (boxwork texture is present). Quartz, white
Fig. 1. Area localization and geological sketch modified from RTDM(1995). Fig. 2. Weathering profile and sampling sites.
360 J.H. Larizzatti et al. / Journal of South American Earth Sciences 25 (2008) 359–376
mica, kaolinite, and hematite (+little goethite) are the mostabundant minerals present. The contact with lower transi-tionzoneisgradationalandcentimetric;saprolitefragmentsdecrease in size and are immersed in a clay-rich matrix.
2. Lower transition zone: <0.5 m thick, red, with numerousweathered lithic fragments that preserve primary rockfabrics immersed in a kaolinite-rich matrix containingiron oxi-hydroxides (hematite/goethite). From saproliteto the lower transition zone, there is an increase inquartz content, decrease in white-mica content, and nochange in iron oxi-hydroxides and kaolinite contents.The transition to the upper transition zone is grada-tional; iron-rich pisoliths are formed and increase in size,forming nodules in the top of the horizon.
3. Upper transition zone: 0.2 m thick, with ferruginouspisoliths and nodules embedded in a ferruginous kaoli-nite matrix. No primary fabric can be observed in thismaterial. From lower to the upper transition zone,quartz and white-mica contents decrease, and an impor-tant increase in iron oxi-hydroxides contents (speciallyhematite) and kaolinite can be noted. The transition toduricrust is gradational; iron-rich nodules become biggerand more numerous and form an indurated duricrust.
4. Duricrust: (discontinuous ferruginous horizon) of vari-able thickness (usually <1 m), with a high concentrationof hematite. From upper transition zone to duricrust, animportant decrease in quartz content and importantincrease in hematite/goethite and kaolinite contentsoccur. Contact with red latosol is sharp, but at the base,it is possible to observe iron-rich pisoliths with yellowcortexes immersed in the clay-rich matrix.
5. Red latosol: clay-rich matrix (minor Fe) with nodulesand pisoliths derived from the duricrust. Thickness var-ies from less than 1 m at the base of slopes to 6 m on hillcrests. From duricrust to red latosol occurs an increasein quartz and kaolinite contents and important decreasein iron oxi-hydroxides (especially hematite). The transi-tion to yellow latosol is gradational; at the top horizon,iron-rich pisoliths are not observed.
6. Yellow latosol: similar to red latosol, with lower con-tents of iron oxi-hydroxides. From red to yellow latosol,minor variations in quartz, kaolinite, and iron oxi-hydroxides contents are observed. At the top of thishorizon rests a centimetric layer of a dark-brownorganic matter-rich material.
3. Methods
A schematic cross-section of the pit at the Fazenda PisonGarimpo and the sampling sites are shown in Fig. 2. Sampleswere collected from the mineralized zone and different hori-zons of the regolith developed above it, as follows: One sam-ple (0.94 kg) of primary ore was collected from a diamonddrill core and jaw-crushed to 5 mm, then ground in a disc millto 1.5 mm. It is not shown in Figs. 2 and 3.
Bulk samples of 50 kg each where taken from the rego-lith as follows: (1) six samples of saprolite, specifically, foursamples from granophyre saprolite, at 10, 8, 7, and 4 m;one sample from the stockwork zone; and one sample froma quartz-rich zone; (2) two samples from the transitionzone, one from the upper and one from the lower; (3)
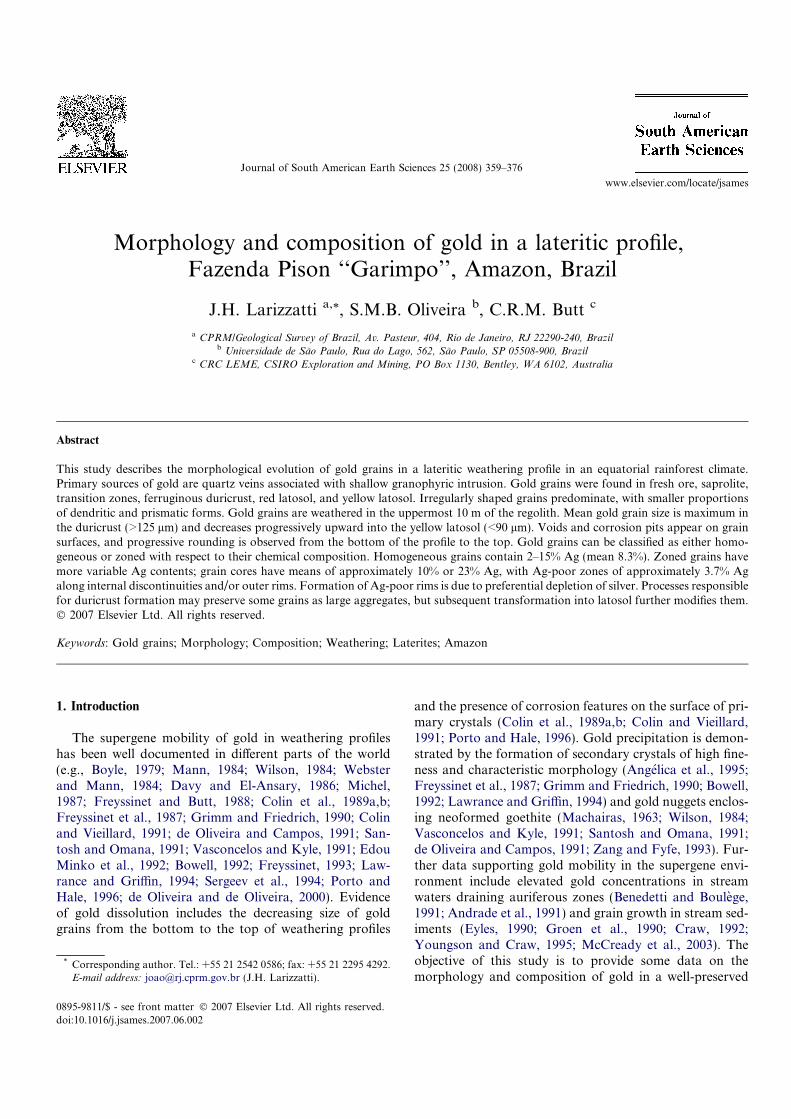
Fig. 3. Characteristics of gold particles according to regolith unit (YL, yellow latosol; RL, red latosol; D, duricrust; TZt, transition zone-top; TZb,transition zone-base; G4, saprolite, granophyre 4 m deep; QZ, saprolite, quartz-rich zone; SZ, saprolite stockwork zone; G7, saprolite; granophyre 7 mdeep; G8, saprolite, granophyre 8 m deep; G10, saprolite, granophyre 10 m deep). (A) Number of particles; (B) particle size (lm); (C) particle shape (%),where Prism, prismatic; Dendr., dendritic; Irreg., irregular; and (D) edge roundness (%), where V. Rounded, very rounded; S. Rounded, sub-rounded.
J.H. Larizzatti et al. / Journal of South American Earth Sciences 25 (2008) 359–376 361
one sample from the duricrust; (4) one sample from the redlatosol; and (5) one sample from the yellow latosol.
Samples were processed as follows:
1. Field: samples collected at the lateritic profile werepanned and dried in the field. Samples from primaryore and duricrust were hand crushed before panning.
2. Laboratory preparation: samples were oven dried at 70 �C.Magnetic minerals were separated using a hand magnetand Frantz magnetic separator. Heavy minerals were sepa-rated using heavy liquid (methylene iodide). Gold grainswere handpicked under a binocular microscope.
3. Optical examination: gold grains were mounted on glassslides with double-sided adhesive tape and examined usinga binocular microscope. Grains were classified accordingto their morphology; some were selected for further study.
4. Scanning electron microscopy (SEM): grain morphologywas examined by SEM, and the Ag content was determinedsemi-quantitatively using an energy dispersive spectrometer.Instruments used were a JEOL JSM-6400 and ElectroscanESEM(S) E-3, Centre of Microscopy and Microanalysis,University of Western Australia (CMM/UWA), operatingat 20–30 kV accelerating voltage, 3 · 10�12 A primary beamcurrent, and 9–20 mm working distance.
5. Polished section: selected grains were examined in pol-ished section by SEM.
6. Electron microprobe (EPMA): fifty-four gold grains(polished sections) were analysed for Au, Ag, As, Bi,Cu, Fe, Hg, Pt, Sb, and Zn using a JEOL 6400 instru-ment at CMM/UWA. Operating conditions and detec-tion limits are given in Table 1.
Approximately 1850 gold grains were examined by opti-cal microscopy, 300 representative gold grains by SEM,and 54 grains by EPMA (Table 2).
The data discussed in this paper refer only to the grainsrecovered and examined by these procedures. A high pro-portion of grains smaller than 10 lm were lost, with mod-erate losses of those between 10 and 20 lm.
4. Results
4.1. Size and morphology of gold grains
4.1.1. ClassificationThe number and morphological characteristics of gold
grains in the different regolith horizons are summarized
in Fig. 3. The grains were classified in terms of locationof regolith material (Fig. 2); size, as (length · width)1/2
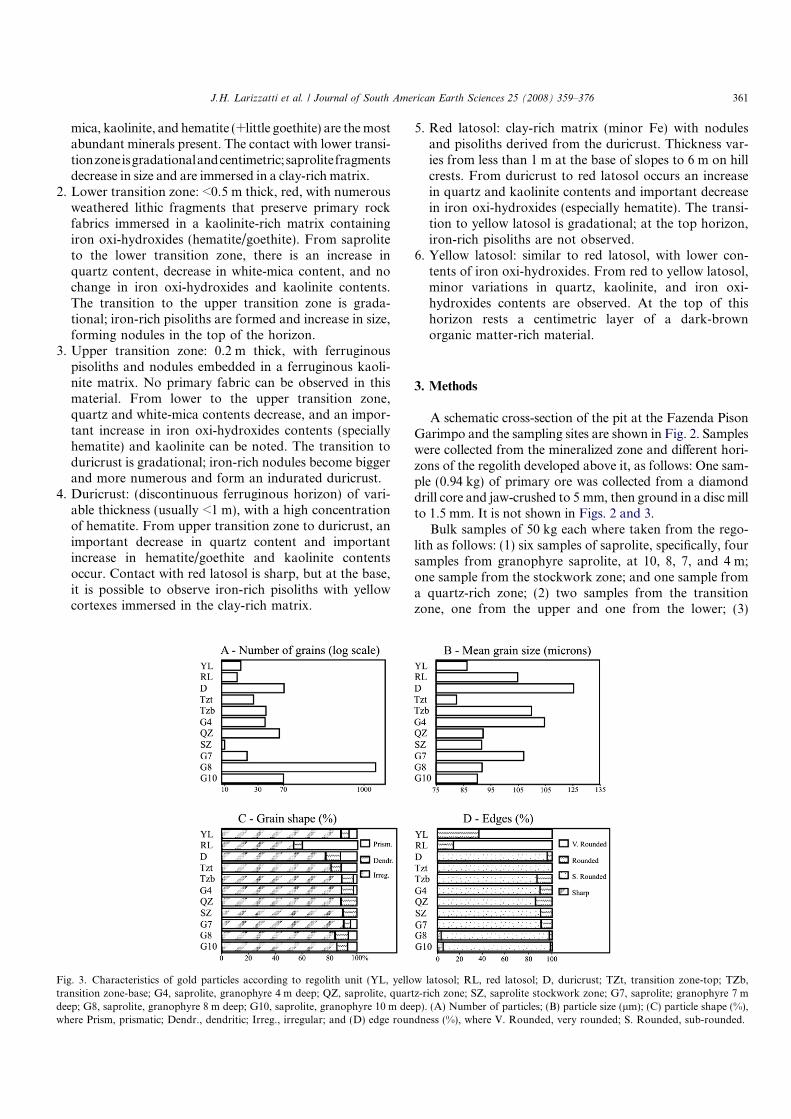
(Fig. 3B); habit, as to prismatic, when gold grains showsimilar length in three dimensions and smooth/nearsmooth faces (e.g., Figs. 4B, 7E, and 8B) or dendritic, whenone dimension is much more developed than the other two(e.g., Figs. 6A, B, and 7F) or irregular, when gold grains donot show smooth faces or one distinctive dimension (e.g.,Figs. 5A, B, E, F, 7A–D, and 8A, E, F); and edges, in termsof whether they are sharp (e.g., Figs. 4A, B, and 5A), sub-
Table 1Operating conditions and detection limits for EMPA
Instrument conditions
Accelerating voltage = 25 kV Primary beamcurrent = 2.8 · 10�12 A
Au Ag As Bi Cu Fe
Detection limit (wt%) 0.131 0.033 0.031 0.092 0.018 0.017
Counting time (s) 25 25 25 25 25 25
Table 2Number of gold grains analysed and number of analyses according tosampling medium (EMPA)
Samplingmedium
Homogeneousgrains
Zoned grains
Numberofgrains
Numberofanalyses
Numberofgrains
Number ofanalyses –core
Number ofanalyses –rim
Yellowlatosol
3 11 7 11 9
Red latosol 4 15 1 1 2Duricrust 6 21 8 38 20Transition
zoneNone None 5 19 4
Stockwork None None 5 10 7Granophyre None None 9 19 14Fresh ore 4 9 2 2 2
Fig. 4. Backscattered electron images (SEM) of primary gold grains.
362 J.H. Larizzatti et al. / Journal of South American Earth Sciences 25 (2008) 359–376

rounded (e.g., Figs. 5C, E, F, and 6A), rounded (e.g., Figs.5B and 6B), or very rounded (e.g., Fig. 8A and F).
4.1.2. Gold in primary mineralization
Primary gold is associated with pyritic quartz veins.Only 12 gold grains were recovered from the fresh ore, witha mean size of 56 lm. All grains are xenomorphic, withvery smooth faces that show the impression of the sur-rounding quartz. There are two habits: irregular(Fig. 4A) and prismatic (Fig. 4B).
4.2. Saprolite
Grains separated from saprolite are shown in Fig. 5. Thegold distribution in the granophyre saprolite is highly var-
iable, as reflected by the number of grains recovered at dif-ferent horizons (Fig. 3). The mean grain size is 92 lm(r = 46). The majority of grains (Fig. 3C) are irregular inshape (83%), with about 10% of the grains dendritic andthe remainder (7%) prismatic. Most grains have slightlyrounded edges (94%), with the remainder strongly roundedor sharp.
More than 90% of the grains recovered from both stock-work zones and quartz-rich zone are irregular (Fig. 5E andF); the remainder are dendritic. Most grains from quartz-rich and stockwork zones show subrounded edges (85%and 92%, respectively), and the rest show rounded edges.Corrosion pits occur on most grains observed in the sapro-lite materials (Fig. 5A–F). Some grains show scratches(tool marks).
Fig. 5. Backscattered electron images (SEM) of gold grains recovered from saprolite. (A–D) Granophyre; (E) stockwork zone; and (F) quartz-rich zone.
J.H. Larizzatti et al. / Journal of South American Earth Sciences 25 (2008) 359–376 363
4.3. Transition zone
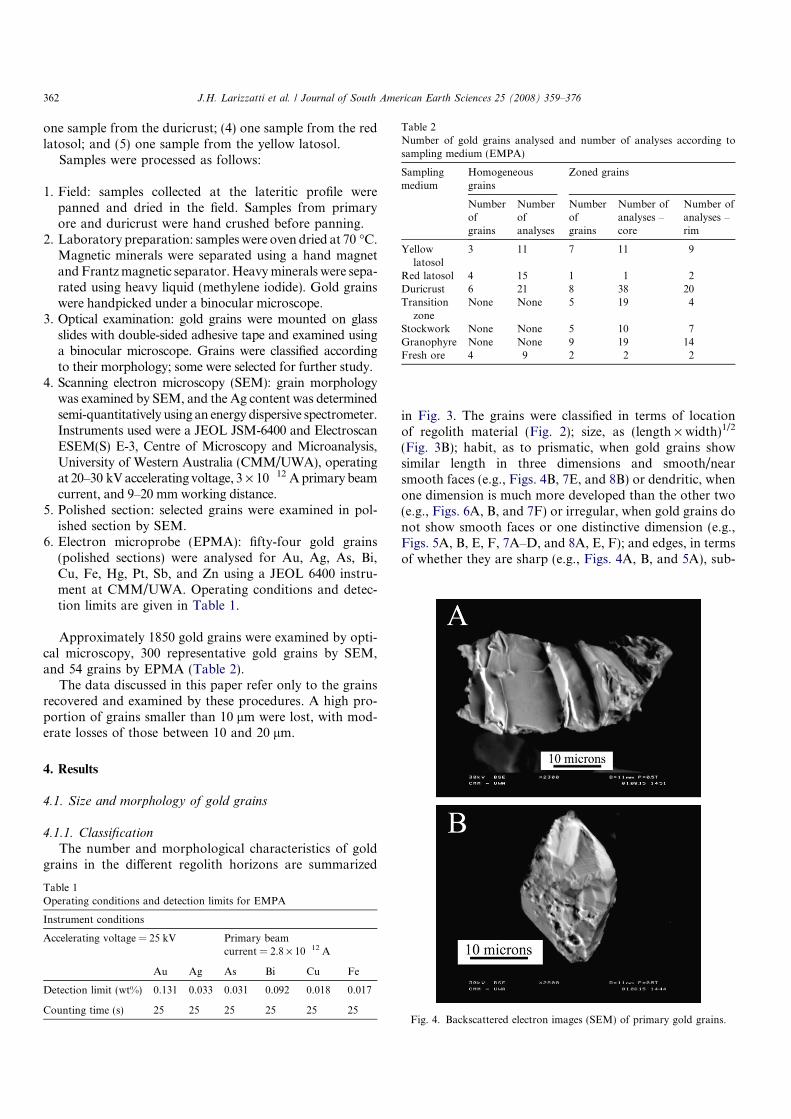
Mean grain size is 108 lm (r = 76) at the base and81 lm (r = 23) at the top of transition zone. Most grainsfrom the transition zone are irregular (86%), and the restare dendritic (8%) or prismatic (6%). There are more pris-matic grains (12%) in the upper part of the zone than allunderlying horizons. Edges and faces of grains are cor-roded and pitted (Fig. 6A and B). Some grains showscratches (tool marks) and folded rims.
4.4. Duricrust
Gold grains in the duricrust have the greatest mean size(124 lm, r = 72; Fig. 3B). Nearly 80% of the grains areirregular (Figs. 3C and 7A–D), with nearly equal propor-tions of prismatic (Figs. 3C and 7E) and dendritic (Figs.3C and 7F). Most grains have slightly rounded edges(96%) and numerous corrosion pits; some grains showscratches.
4.5. Latosol
In the red latosol, only 53% of the grains are irregular inhabit; some 40% are prismatic, a much higher proportionthan all underlying horizons, including the duricrust and
upper transition zone; and the remainder are dendritic(Fig. 3C). Nearly 90% of the grains have very roundededges, all show numerous corrosion pits (Figs. 3D and8A, B), and the mean grain size (105 lm, r = 63; Fig. 3B)is smaller than the underlying duricrust.
In the yellow latosol (Figs. 3C, 8C–F), the proportion ofprismatic grains is approximately 6%, similar to that in thesaprolite; most grains (88%) are irregular, and 6% are den-dritic. The mean grain size is less than in the red latosol(86 lm, r = 28). Most grains (65%) have very roundededges with well-developed corrosion pits; nevertheless, itis possible to recognize the primary habit in many of thegold particles.
The progressive decrease of mean grain size from theduricrust to the yellow latosol, together with the increasingnumber of corrosion pits and degree of rounding, impliesdissolution of gold. Gold is preferably dissolved fromprominent parts of grains, and dissolution seems moreactive on dendritic and irregular grains than prismaticgrains. Some grains recovered from both latosols show toolmarks.
4.6. Chemical composition of gold grains
Chemical analysis of 54 gold particles was performedby EPMA (Tables 1–4). Only Au, Ag, and Cu are presentin detectable amount in most grains; some also containAs, Bi, and Fe. Silver is the only element, other than gold,present in high concentrations. According to the silverdistribution, there are two groups of gold grains: homoge-neous and zoned (Fig. 9). The 17 analysed homogeneousgrains (56 analyses) show a similar grey hue throughoutthe hole-polished section under SEM backscattered mode(Fig. 9A) and have Ag contents of 2.40–17.34% (mean8.28%; Tables 3 and 4). The 37 analysed zoned grains(54 rim and 104 core analyses) show variable silver con-tent throughout the polished section under SEM back-scattered mode (Fig. 9B), lower silver contents in theouter rims, and internal discontinuities (0.02–14.09%,mean 3.64% Ag) compared with the cores (3.84–31.10%,mean 17.30% Ag; Tables 3 and 4). These internal varia-tions are evident using SEM backscatter imaging andcan be quantified by EPMA analysis. Some homogeneousand zoned grains show compositional variation within asingle grain, core, or rim. In zoned grains, the contactbetween grain cores and silver-poor rims is commonlysharp. Zoned gold grains from the fresh ore do not showsilver-poor rims; they show internal variations in Au andAg contents that cannot be characterized as rims or cores,and they were not studied together with regolith zonedgold grains.
4.6.1. Homogeneous grains
Homogeneous gold grains were recovered from primarymineralization (fresh ore), duricrust, and latosols. Thecompositions of homogeneous particles vary between82.25% and 98.20% Au and 2.40% and 17.34% Ag
Fig. 6. Backscattered electron images (SEM) of gold grains recoveredfrom transition zone. (A) Bottom of transition zone showing subroundededges; (B) top of transition zone showing rounded edges.
364 J.H. Larizzatti et al. / Journal of South American Earth Sciences 25 (2008) 359–376

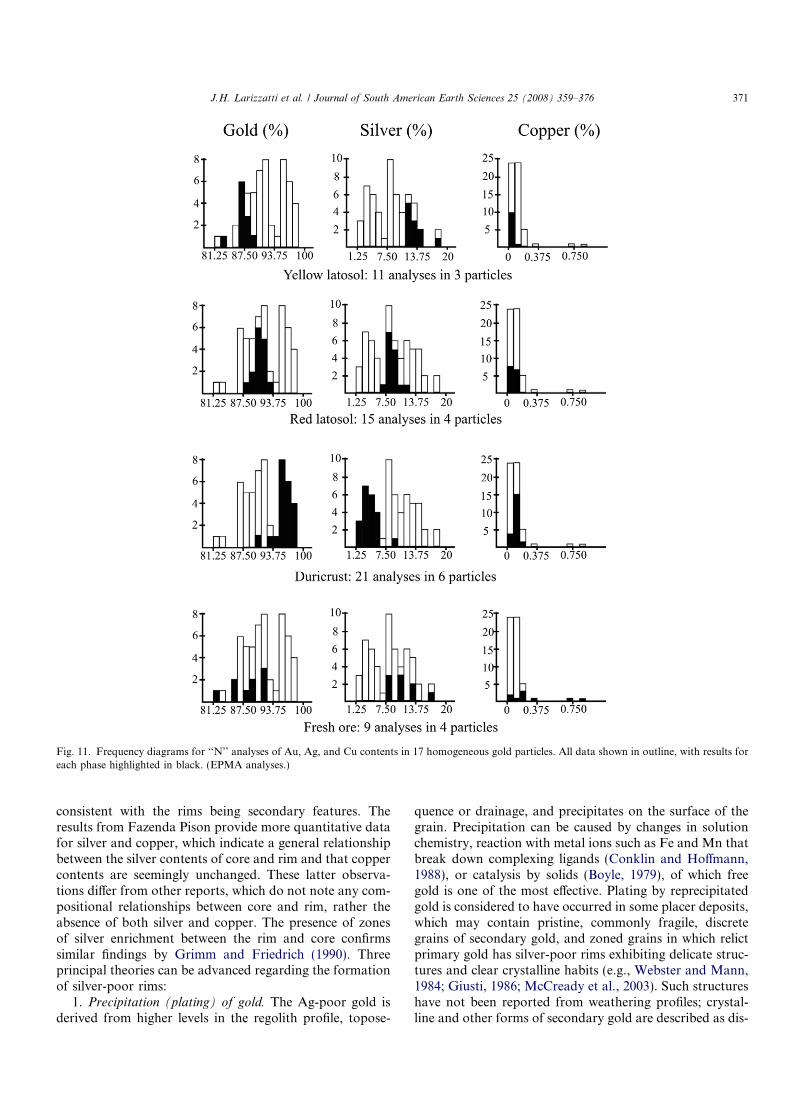
(Fig. 10, Table 4), with minor variation in Au–Ag contentswithin the same grain (exception for one gold grain col-lected in primary ore that shows variation of 6.94% Au).The highest Cu contents were observed in gold grainsrecovered from the fresh ore; high Ag contents are concen-trated in yellow latosol grains; and high gold content isconcentrated in duricrust grains (Fig. 11). These differencesin composition between horizons may be a function of low,non-representative number of samples.
4.6.2. Zoned grains
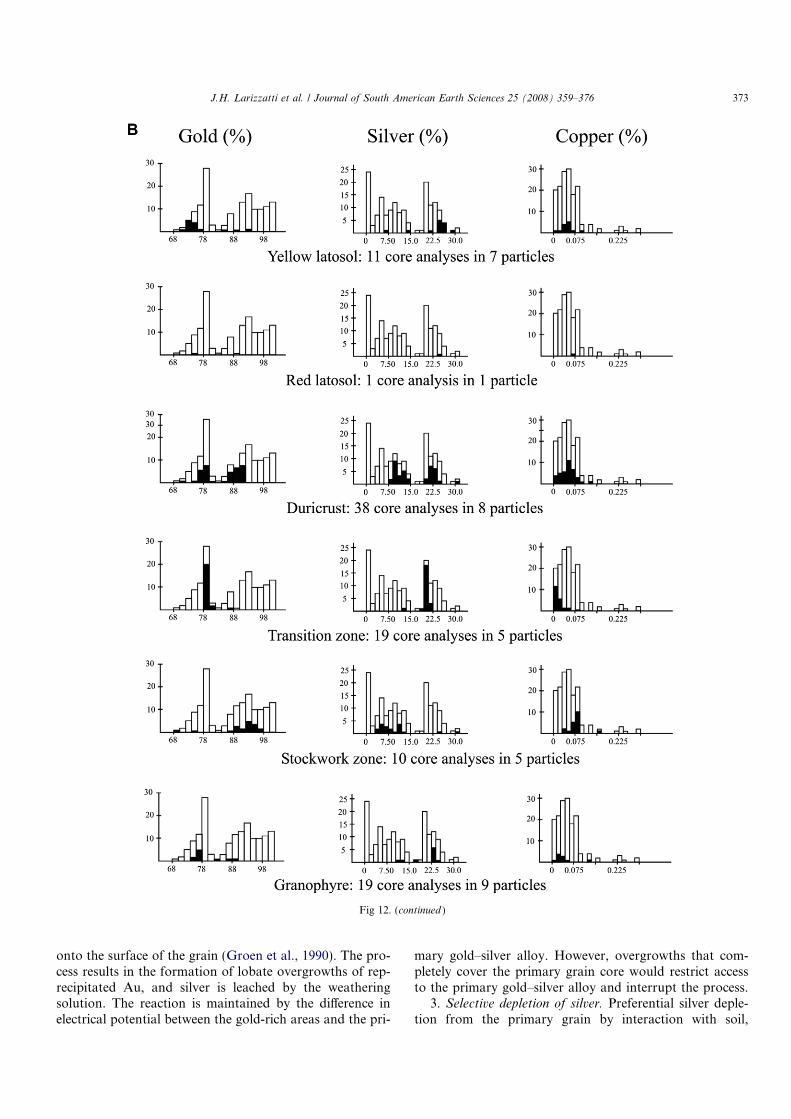
Zoned grains are present throughout the regolith, and37 of them were analysed by EMPA (Tables 2 and 3).Fig. 12A and B show the histograms of EMPA analyses
for all zoned gold grains; the composition of rims andcores can be observed in black. Rims are composed of sil-ver-poor gold (mean 3.64% Ag) and tend to be thinner inthe latosol horizons. Composition of cores is bimodal,with cores containing less silver (mean 9.76% Ag) or moresilver (mean 22.60% Ag). Due to the small number ofgrains analysed, it is not possible to correlate core andrim composition. Copper contents are similar to those inhomogeneous grains. Grain cores contain <0.02–0.1%Cu in most horizons, possibly richer (>0.04–0.09% Cu)in the granophyre saprolite and poorer (<0.04% Cu) inthe transition zone. Rims have a similar range of compo-sitions (<0.02–0.15% Cu) in all horizons, except the stock-work (0.23–0.30% Cu).
Fig. 7. Backscattered electron images (SEM) of gold grains recovered from duricrust. (A–D) Irregular particles; (E) prismatic particle; and (F) dendriticparticle.
J.H. Larizzatti et al. / Journal of South American Earth Sciences 25 (2008) 359–376 365

Some zoned grains show a thin, silver-enriched zonebetween the core and rim and in discontinuities within asingle grain (Fig. 13).
5. Discussion and conclusions
Particulate gold in the Fazenda Pison Garimpo is asso-ciated with quartz veins, situated in voids between quartzgrains, and enclosed by or filling fractures in pyrite. Goldis also heterogeneously disseminated in the granophyre,stockwork zone, and quartz-rich zone. A lateritic profilecomposed of saprolite, transition zone, duricrust, red lato-sol, and yellow latosol results from the weathering evolu-tion of underlying mineralized granophyric rock.
Gold grain sizes range from <20 to >120 lm. Primarygrains are xenomorphic and irregularly distributed in themineralized zone; gold grains are irregular, dendritic orprismatic in shape, and show smooth faces and sharpedges. The effects of weathering are visible from the baseof the saprolite upward, with grains edges becomingrounded and corrosion pits evident on grain surfaces.Rounding increases slightly in the horizons of the base ofthe profile and abruptly from duricrust to latosol. Toolmarks and folded edges likely are products of crushingand panning processes; these features are found only insome of the studied gold grains and not as a general rule.
The degrees of rounding and pitting are not homoge-neous in gold grains, even those collected in the same
Fig. 8. Backscattered electron images (SEM) of gold grains recovered from latosols. (A–B) Particles from the red latosol, very rounded and subrounded,respectively; (C–F) particles from yellow latosol, (D) is a detail from (C).
366 J.H. Larizzatti et al. / Journal of South American Earth Sciences 25 (2008) 359–376
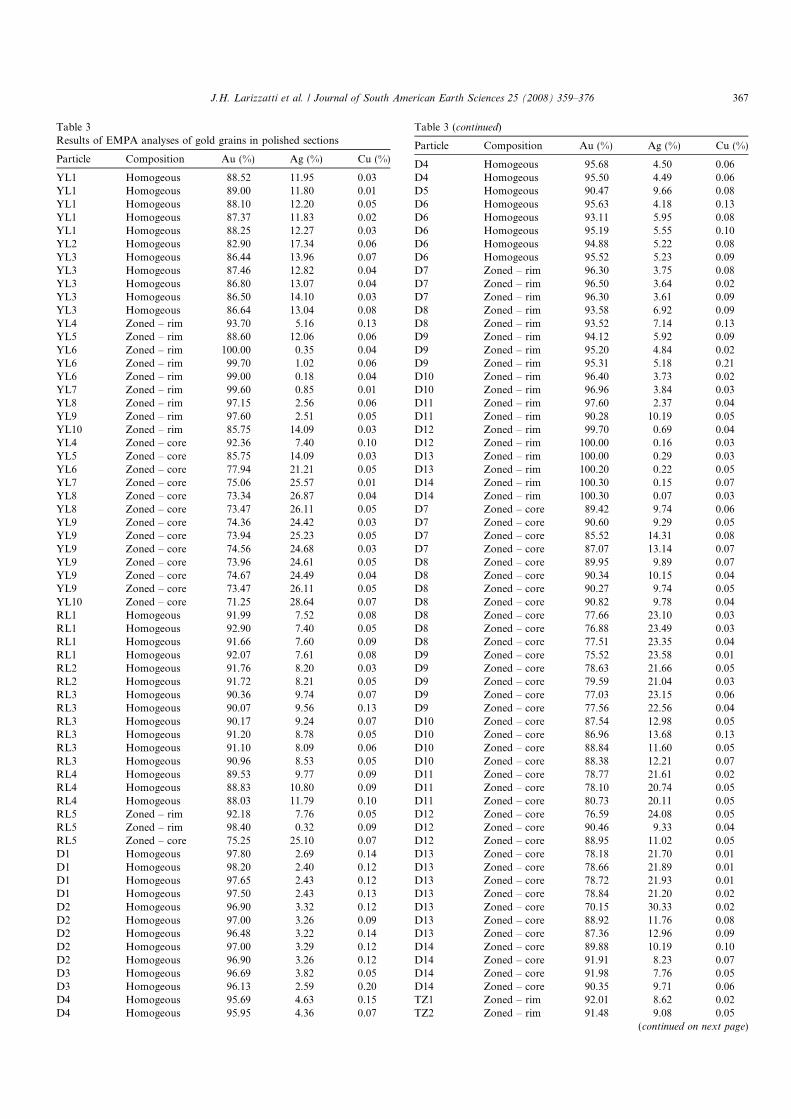
Table 3Results of EMPA analyses of gold grains in polished sections
Particle Composition Au (%) Ag (%) Cu (%)
YL1 Homogeous 88.52 11.95 0.03YL1 Homogeous 89.00 11.80 0.01YL1 Homogeous 88.10 12.20 0.05YL1 Homogeous 87.37 11.83 0.02YL1 Homogeous 88.25 12.27 0.03YL2 Homogeous 82.90 17.34 0.06YL3 Homogeous 86.44 13.96 0.07YL3 Homogeous 87.46 12.82 0.04YL3 Homogeous 86.80 13.07 0.04YL3 Homogeous 86.50 14.10 0.03YL3 Homogeous 86.64 13.04 0.08YL4 Zoned – rim 93.70 5.16 0.13YL5 Zoned – rim 88.60 12.06 0.06YL6 Zoned – rim 100.00 0.35 0.04YL6 Zoned – rim 99.70 1.02 0.06YL6 Zoned – rim 99.00 0.18 0.04YL7 Zoned – rim 99.60 0.85 0.01YL8 Zoned – rim 97.15 2.56 0.06YL9 Zoned – rim 97.60 2.51 0.05YL10 Zoned – rim 85.75 14.09 0.03YL4 Zoned – core 92.36 7.40 0.10YL5 Zoned – core 85.75 14.09 0.03YL6 Zoned – core 77.94 21.21 0.05YL7 Zoned – core 75.06 25.57 0.01YL8 Zoned – core 73.34 26.87 0.04YL8 Zoned – core 73.47 26.11 0.05YL9 Zoned – core 74.36 24.42 0.03YL9 Zoned – core 73.94 25.23 0.05YL9 Zoned – core 74.56 24.68 0.03YL9 Zoned – core 73.96 24.61 0.05YL9 Zoned – core 74.67 24.49 0.04YL9 Zoned – core 73.47 26.11 0.05YL10 Zoned – core 71.25 28.64 0.07RL1 Homogeous 91.99 7.52 0.08RL1 Homogeous 92.90 7.40 0.05RL1 Homogeous 91.66 7.60 0.09RL1 Homogeous 92.07 7.61 0.08RL2 Homogeous 91.76 8.20 0.03RL2 Homogeous 91.72 8.21 0.05RL3 Homogeous 90.36 9.74 0.07RL3 Homogeous 90.07 9.56 0.13RL3 Homogeous 90.17 9.24 0.07RL3 Homogeous 91.20 8.78 0.05RL3 Homogeous 91.10 8.09 0.06RL3 Homogeous 90.96 8.53 0.05RL4 Homogeous 89.53 9.77 0.09RL4 Homogeous 88.83 10.80 0.09RL4 Homogeous 88.03 11.79 0.10RL5 Zoned – rim 92.18 7.76 0.05RL5 Zoned – rim 98.40 0.32 0.09RL5 Zoned – core 75.25 25.10 0.07D1 Homogeous 97.80 2.69 0.14D1 Homogeous 98.20 2.40 0.12D1 Homogeous 97.65 2.43 0.12D1 Homogeous 97.50 2.43 0.13D2 Homogeous 96.90 3.32 0.12D2 Homogeous 97.00 3.26 0.09D2 Homogeous 96.48 3.22 0.14D2 Homogeous 97.00 3.29 0.12D2 Homogeous 96.90 3.26 0.12D3 Homogeous 96.69 3.82 0.05D3 Homogeous 96.13 2.59 0.20D4 Homogeous 95.69 4.63 0.15D4 Homogeous 95.95 4.36 0.07
Table 3 (continued)
Particle Composition Au (%) Ag (%) Cu (%)
D4 Homogeous 95.68 4.50 0.06D4 Homogeous 95.50 4.49 0.06D5 Homogeous 90.47 9.66 0.08D6 Homogeous 95.63 4.18 0.13D6 Homogeous 93.11 5.95 0.08D6 Homogeous 95.19 5.55 0.10D6 Homogeous 94.88 5.22 0.08D6 Homogeous 95.52 5.23 0.09D7 Zoned – rim 96.30 3.75 0.08D7 Zoned – rim 96.50 3.64 0.02D7 Zoned – rim 96.30 3.61 0.09D8 Zoned – rim 93.58 6.92 0.09D8 Zoned – rim 93.52 7.14 0.13D9 Zoned – rim 94.12 5.92 0.09D9 Zoned – rim 95.20 4.84 0.02D9 Zoned – rim 95.31 5.18 0.21D10 Zoned – rim 96.40 3.73 0.02D10 Zoned – rim 96.96 3.84 0.03D11 Zoned – rim 97.60 2.37 0.04D11 Zoned – rim 90.28 10.19 0.05D12 Zoned – rim 99.70 0.69 0.04D12 Zoned – rim 100.00 0.16 0.03D13 Zoned – rim 100.00 0.29 0.03D13 Zoned – rim 100.20 0.22 0.05D14 Zoned – rim 100.30 0.15 0.07D14 Zoned – rim 100.30 0.07 0.03D7 Zoned – core 89.42 9.74 0.06D7 Zoned – core 90.60 9.29 0.05D7 Zoned – core 85.52 14.31 0.08D7 Zoned – core 87.07 13.14 0.07D8 Zoned – core 89.95 9.89 0.07D8 Zoned – core 90.34 10.15 0.04D8 Zoned – core 90.27 9.74 0.05D8 Zoned – core 90.82 9.78 0.04D8 Zoned – core 77.66 23.10 0.03D8 Zoned – core 76.88 23.49 0.03D8 Zoned – core 77.51 23.35 0.04D9 Zoned – core 75.52 23.58 0.01D9 Zoned – core 78.63 21.66 0.05D9 Zoned – core 79.59 21.04 0.03D9 Zoned – core 77.03 23.15 0.06D9 Zoned – core 77.56 22.56 0.04D10 Zoned – core 87.54 12.98 0.05D10 Zoned – core 86.96 13.68 0.13D10 Zoned – core 88.84 11.60 0.05D10 Zoned – core 88.38 12.21 0.07D11 Zoned – core 78.77 21.61 0.02D11 Zoned – core 78.10 20.74 0.05D11 Zoned – core 80.73 20.11 0.05D12 Zoned – core 76.59 24.08 0.05D12 Zoned – core 90.46 9.33 0.04D12 Zoned – core 88.95 11.02 0.05D13 Zoned – core 78.18 21.70 0.01D13 Zoned – core 78.66 21.89 0.01D13 Zoned – core 78.72 21.93 0.01D13 Zoned – core 78.84 21.20 0.02D13 Zoned – core 70.15 30.33 0.02D13 Zoned – core 88.92 11.76 0.08D13 Zoned – core 87.36 12.96 0.09D14 Zoned – core 89.88 10.19 0.10D14 Zoned – core 91.91 8.23 0.07D14 Zoned – core 91.98 7.76 0.05D14 Zoned – core 90.35 9.71 0.06TZ1 Zoned – rim 92.01 8.62 0.02TZ2 Zoned – rim 91.48 9.08 0.05
(continued on next page)
J.H. Larizzatti et al. / Journal of South American Earth Sciences 25 (2008) 359–376 367

regolith material. This difference is caused by differentialexposition to weathering solutions. Whereas some grainswere totally free of surrounding primary minerals, otherswere partially or totally encapsulated by quartz or otherminerals. Therefore, (1) in a single grain, it is possible toobserve smooth surfaces and sharp edges in one area androunded edges and corrosion pits in another; (2) goldgrains show different degrees of weathering in the same reg-olith horizon; and (3) gold grains in upper horizons showless weathering than some of those found below in the lat-eritic profile. It is also possible to observe that, as a generalrule, rounding and pitting increase upward in the profile,and the mean grain size decreases progressively from duri-crust upward as corrosion and dissolution continue.
In the duricrust, the presence of gold particles with coreswith different Ag content indicate that some aggregategrains comprising several smaller particles formed (note
Table 3 (continued)
Particle Composition Au (%) Ag (%) Cu (%)
D14 Zoned – core 87.38 12.61 0.06TZ3 Zoned – rim 92.29 8.36 0.10TZ4 Zoned – rim 91.05 8.78 0.04TZ1 Zoned – core 87.72 13.00 0.01TZ2 Zoned – core 78.60 21.23 0.02TZ2 Zoned – core 79.08 19.90 0.01TZ2 Zoned – core 79.15 20.81 0.04TZ3 Zoned – core 80.07 20.63 0.03TZ3 Zoned – core 80.62 19.24 0.02TZ4 Zoned – core 79.23 20.34 0.01TZ4 Zoned – core 79.15 20.32 0.01TZ4 Zoned – core 79.30 20.69 0.01TZ4 Zoned – core 79.11 20.76 0.03TZ4 Zoned – core 79.19 20.46 0.04TZ4 Zoned – core 79.02 20.64 0.01TZ4 Zoned – core 79.37 20.45 0.03TZ4 Zoned – core 79.46 20.20 0.05TZ4 Zoned – core 79.30 21.00 0.01TZ5 Zoned – core 79.97 20.74 0.01TZ5 Zoned – core 79.68 20.29 0.08TZ5 Zoned – core 79.70 20.84 0.01TZ5 Zoned – core 79.67 20.70 0.01TZ5 Zoned – core 79.02 20.64 0.01TZ5 Zoned – core 79.37 20.45 0.03TZ5 Zoned – core 79.46 20.20 0.05TZ5 Zoned – core 79.30 21.00 0.01SZ1 Zoned – rim 93.43 5.71 0.29SZ1 Zoned – rim 94.22 5.61 0.29SZ2 Zoned – rim 93.94 5.55 0.24SZ2 Zoned – rim 93.71 6.00 0.23SZ3 Zoned – rim 93.12 5.70 0.24SZ4 Zoned – rim 94.92 5.43 0.23SZ5 Zoned – rim 92.40 7.52 0.05SZ1 Zoned – core 74.99 24.12 0.01SZ1 Zoned – core 76.34 23.91 0.02SZ1 Zoned – core 76.26 23.50 0.04SZ2 Zoned – core 76.07 23.97 0.03SZ2 Zoned – core 75.65 23.83 0.03SZ3 Zoned – core 76.78 23.76 0.02SZ3 Zoned – core 77.47 23.16 0.04SZ4 Zoned – core 82.95 16.70 0.12SZ5 Zoned – core 89.39 11.04 0.02SZ5 Zoned – core 87.98 12.00 0.05G1 Zoned – rim 94.85 5.82 0.04G3 Zoned – rim 100.26 0.02 0.04G4 Zoned – rim 100.74 0.02 0.05G4 Zoned – rim 100.48 0.02 0.07G5 Zoned – rim 100.45 0.02 0.08G5 Zoned – rim 100.01 0.82 0.09G6 Zoned – rim 98.96 1.02 0.15G6 Zoned – rim 99.53 0.61 0.07G7 Zoned – rim 99.89 0.16 0.09G7 Zoned – rim 100.02 0.06 0.08G7 Zoned – rim 100.04 0.02 0.04G8 Zoned – rim 98.92 1.30 0.04G8 Zoned – rim 99.04 0.44 0.05G9 Zoned – rim 99.85 0.23 0.01G1 Zoned – core 68.35 31.10 0.07G2 Zoned – core 75.07 24.70 0.09G3 Zoned – core 86.07 13.03 0.15G4 Zoned – core 88.03 11.79 0.07G4 Zoned – core 88.48 10.55 0.09G4 Zoned – core 89.59 10.86 0.08G5 Zoned – core 90.30 9.99 0.08G5 Zoned – core 90.15 10.58 0.09
Table 3 (continued)
Particle Composition Au (%) Ag (%) Cu (%)
G6 Zoned – core 92.54 7.62 0.08G6 Zoned – core 92.19 7.34 0.08G6 Zoned – core 92.21 7.66 0.09G6 Zoned – core 92.56 7.27 0.07G7 Zoned – core 94.76 5.28 0.07G7 Zoned – core 94.98 4.94 0.04G7 Zoned – core 94.70 5.34 0.04G8 Zoned – core 95.68 4.79 0.09G8 Zoned – core 96.28 4.29 0.07G8 Zoned – core 96.08 3.84 0.08G9 Zoned – core 93.68 7.05 0.05FO1 Homogeous 91.80 7.65 0.05FO1 Homogeous 91.27 8.16 0.08FO1 Homogeous 91.44 8.15 0.20FO2 Homogeous 88.29 10.64 0.17FO2 Homogeous 89.19 10.53 0.87FO2 Homogeous 88.88 10.71 0.73FO3 Homogeous 82.25 17.05 0.02FO4 Homogeous 85.68 13.63 0.35FO4 Homogeous 86.00 13.50 0.21FO5 Zoned 96.30 3.49 0.19FO5 Zoned 72.85 26.92 0.07FO6 Zoned 96.69 3.62 0.17FO6 Zoned 75.96 24.16 0.06
Table 4Summary statistics report for EMPA analyses of gold grains
Variable Count Mean StdDev Min Max Range
Homogeneous
Au (%) 56 91.63 4.11 82.25 98.20 15.95Ag (%) 56 8.28 4.00 2.40 17.34 14.94Cu (%) 56 0.12 0.15 0.01 0.87 0.86
Zoned – rim
Au (%) 54 96.48 3.63 85.75 100.74 14.99Ag (%) 54 3.64 3.60 0.02 14.09 14.07Cu (%) 54 0.08 0.07 0.01 0.29 0.28
Zoned – core
Au (%) 104 82.71 7.00 68.35 96.28 27.93Ag (%) 104 17.30 6.91 3.84 31.10 27.26Cu (%) 104 0.05 0.03 0.01 0.15 0.14
368 J.H. Larizzatti et al. / Journal of South American Earth Sciences 25 (2008) 359–376

different tones of grey in the particle shown in Fig. 14). Thecores of these individual small particles have different Au/Ag compositions and were joined by zones of Ag-poor goldbetween them. The largest gold grains (mean 124 lm) werefound in the duricrust; only smaller grains were observed inthe materials present below the duricrust, which suggeststhat a process of gold grain development was active duringiron duricrust formation. Gold nugget formation in later-itic profiles was reported previously, for example, byMachairas (1963), Mann (1984), and Wilson (1984).
These aggregates were not found in the overlying redand yellow latosols, which suggests that the process of duri-crust transformation into latosol was accompanied by golddissolution and particle division. Silver-poor rims are thin-ner in the latosols than in the duricrust, suggesting a pro-gressive upward weathering in the profile. Gold gradesare higher in the latosol than in the duricrust (Larizzatti,2002), despite the smaller size and number of gold particlesrecovered from latosol, which also suggests gold was dis-solved during the transformation of duricrust into latosol.
All gold grains observed in the regolith are interpretedas residual relicts that survived weathering of the primarymineralization. To support this hypothesis, we note (1)the mushroom-type gold anomaly observed just abovemineralized quartz veins (Larizzatti, 2002); (2) that anexploration survey performed in the area (geophysics, geo-chemistry, drilling; RTDM, 1995) was unable to find otherknown mineralization in the vicinities of the studied miner-
alized profile; (3) the presence of relict pisoliths of iron oxi-hydroxides (fragments of duricrust) in the latosol (Larizz-atti, 2002); and (4) the recognition, despite weathering pro-cesses, of gold grain primary habits, similar to thoseobserved in the saprolite, in the latosols.
Grains of weathered primary gold with Ag-poor rimsand Ag-rich zones on internal grain boundaries have alsobeen observed at Gentio do Ouro in the semiarid northeastof Brazil (Grimm and Friedrich, 1990) and have severalfeatures similar to those seen at Fazenda Pison. Silverenrichment always occurs at the contact between the pri-mary core of the grain and the Ag-depleted rim or zone,and there is an abrupt contact between silver-rich zonesand silver-poor rims. However, at Fazenda Pison, the con-tacts between the Ag-rich zones and the core of primarygold grains tend to be gradational, as shown in Fig. 14Aand B. Grimm and Friedrich (1990) suggest Ag-rich zones‘‘result from mobilization, separation, and rapid precipita-tion of electrum by thiosulphate complex formation’’ dur-ing weathering.
Webster and Mann (1984) stress the influence of climate,rock composition, and geomorphological factors in goldmobility. The supergene conditions prevailing in the Ama-zon (one bar atmospheric pressure; temperatures of 20–30 �C; excess free water), the presence of pyrite in the pri-mary ore, the abundance of organic matter in the surfacesoil, and the mushroom-shaped surface dispersion patternof gold at Fazenda Pison (Larizzatti, 2002) suggest themetal could be complexed by a wide range of ligands andis relatively soluble (Goleva, 1970; Roslyakov et al., 1971;Baker, 1978; Plyusnin et al., 1981; Stoffregen, 1986; Web-ster, 1986; Vlassopoulos and Wood, 1990; Bowell, 1993).
Evidence of gold dissolution includes the progressivedecrease in grain size upward in the lateritic profile (exceptin the duricrust, where grains are aggregates of separateindividual small grains) and the presence of corrosion fea-tures on grain surfaces, as observed by other authors (Colinet al., 1989a,b; Colin and Vieillard, 1991; Porto and Hale,1996). Rounding and pitting increase upward in the profile,indicating dissolution of gold due to exposure to weather-ing solutions. There is, however, no unequivocal evidenceof reprecipitation of secondary gold. In most weatheringenvironments, secondary gold is of very high fineness, con-taining less than 1.0% Ag (e.g., Mann, 1984; Butt, 1989;Freyssinet et al., 1987; Santosh and Omana, 1991; Grayet al., 1992). All gold recovered at Fazenda Pison containsilver, either throughout in homogeneous grains or in thecore in zoned grains; even the rims of most zoned grainscontain >1.0% Ag. No grains of pure gold were recovered,though this may be a function of sample preparation, inthat few grains <10 lm were recovered. The secondarygold noted by Freyssinet et al. (1987) in Mali, for example,is very fine grained, mostly <1 lm, and fragile dendrites,readily destroyed by panning. Freyssinet et al. (1987) andSantosh and Omana (1991) also observe fine secondarygrains in cavities in gold grains, but these were not foundat Fazenda Pison.
Fig. 9. Backscattered electron image (SEM) of polished sections of goldparticles. (A) Homogeneous gold grain; (B) zoned gold grain.
J.H. Larizzatti et al. / Journal of South American Earth Sciences 25 (2008) 359–376 369

Silver (0.1–25%) and trace copper (0.02–0.9%) are theonly elements other than gold present in significant abun-dance. Compositions generally vary from grain to grainor even within the same grain, as noted by other authors(e.g., Boyle, 1979; Desborough et al., 1971; Antweiler andCampbell, 1977; Morrison et al., 1991; Knight et al.,1999). The grains are either homogeneous (with minor vari-ations in Au–Ag contents) or zoned, with silver-rich coresand thin, silver-poor rims. Some of these silver-poor rimsare composed of essentially pure gold. Copper contentsshow much less variation, with similar abundances inhomogeneous grains, cores, and rims. Gold from the stock-
work saprolite differs from that in the granophyre sapro-lite, in that both cores and rims in grains from thestockwork appear to be more silver rich, and rims are rel-atively rich in copper.
Silver-poor rims have been observed on the surfaces ofprimary gold grains in lateritic profiles and placer deposits(Desborough, 1970; Mann, 1984; Giusti, 1986; Michel,1987; Freyssinet et al., 1987; Freyssinet and Butt, 1988).The presence of zoned grains in the regolith at FazendaPison, silver-poor zones adjacent to internal fractures andas rims to the grains, sharp internal contact between thecore and these zones, and high fineness of the rims are
Fig. 10. Frequency diagrams for ‘‘N’’ analyses of Au, Ag, and Cu contents in 17 homogeneous gold particles and 37 zoned gold particles. All data shownin outline, with results for each phase highlighted in black. (EPMA analyses.)
370 J.H. Larizzatti et al. / Journal of South American Earth Sciences 25 (2008) 359–376
consistent with the rims being secondary features. Theresults from Fazenda Pison provide more quantitative datafor silver and copper, which indicate a general relationshipbetween the silver contents of core and rim and that coppercontents are seemingly unchanged. These latter observa-tions differ from other reports, which do not note any com-positional relationships between core and rim, rather theabsence of both silver and copper. The presence of zonesof silver enrichment between the rim and core confirmssimilar findings by Grimm and Friedrich (1990). Threeprincipal theories can be advanced regarding the formationof silver-poor rims:
1. Precipitation (plating) of gold. The Ag-poor gold isderived from higher levels in the regolith profile, topose-
quence or drainage, and precipitates on the surface of thegrain. Precipitation can be caused by changes in solutionchemistry, reaction with metal ions such as Fe and Mn thatbreak down complexing ligands (Conklin and Hoffmann,1988), or catalysis by solids (Boyle, 1979), of which freegold is one of the most effective. Plating by reprecipitatedgold is considered to have occurred in some placer deposits,which may contain pristine, commonly fragile, discretegrains of secondary gold, and zoned grains in which relictprimary gold has silver-poor rims exhibiting delicate struc-tures and clear crystalline habits (e.g., Webster and Mann,1984; Giusti, 1986; McCready et al., 2003). Such structureshave not been reported from weathering profiles; crystal-line and other forms of secondary gold are described as dis-
Fig. 11. Frequency diagrams for ‘‘N’’ analyses of Au, Ag, and Cu contents in 17 homogeneous gold particles. All data shown in outline, with results foreach phase highlighted in black. (EPMA analyses.)
J.H. Larizzatti et al. / Journal of South American Earth Sciences 25 (2008) 359–376 371

crete grains, not continuous overgrowths on relict primarygrains. Furthermore, precipitation along internal disconti-nuities is difficult to explain by this mechanism.
2. Self-electrorefining. In this process, an Au–Ag alloydissolves electrochemically at the interface with a weather-ing solution, and gold, the more inert metal, reprecipitates
Fig. 12. Frequency diagrams for ‘‘N’’ analyses of Au, Ag, and Cu contents in (A) rims and (B) cores of 37 zoned particles. All data shown in outline, withresults for each phase highlighted in black. (EPMA.)
372 J.H. Larizzatti et al. / Journal of South American Earth Sciences 25 (2008) 359–376
onto the surface of the grain (Groen et al., 1990). The pro-cess results in the formation of lobate overgrowths of rep-recipitated Au, and silver is leached by the weatheringsolution. The reaction is maintained by the difference inelectrical potential between the gold-rich areas and the pri-
mary gold–silver alloy. However, overgrowths that com-pletely cover the primary grain core would restrict accessto the primary gold–silver alloy and interrupt the process.
3. Selective depletion of silver. Preferential silver deple-tion from the primary grain by interaction with soil,
Fig 12. (continued )
J.H. Larizzatti et al. / Journal of South American Earth Sciences 25 (2008) 359–376 373
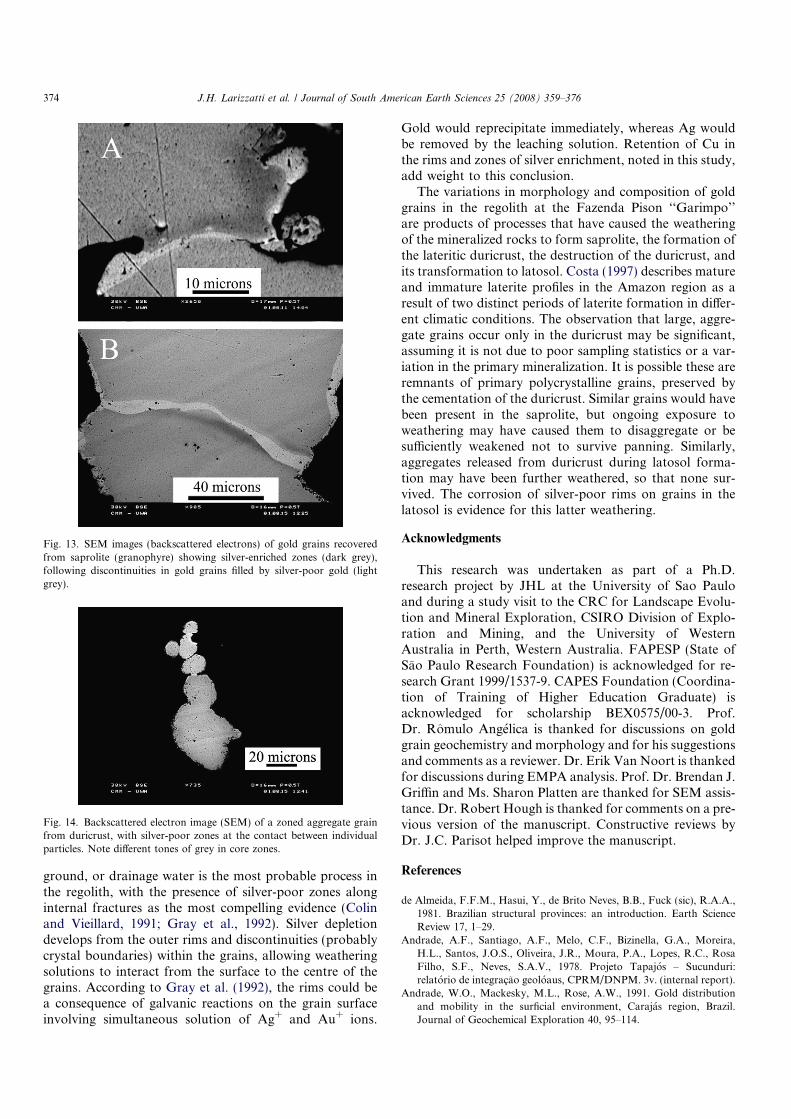
ground, or drainage water is the most probable process inthe regolith, with the presence of silver-poor zones alonginternal fractures as the most compelling evidence (Colinand Vieillard, 1991; Gray et al., 1992). Silver depletiondevelops from the outer rims and discontinuities (probablycrystal boundaries) within the grains, allowing weatheringsolutions to interact from the surface to the centre of thegrains. According to Gray et al. (1992), the rims could bea consequence of galvanic reactions on the grain surfaceinvolving simultaneous solution of Ag+ and Au+ ions.
Gold would reprecipitate immediately, whereas Ag wouldbe removed by the leaching solution. Retention of Cu inthe rims and zones of silver enrichment, noted in this study,add weight to this conclusion.
The variations in morphology and composition of goldgrains in the regolith at the Fazenda Pison ‘‘Garimpo’’are products of processes that have caused the weatheringof the mineralized rocks to form saprolite, the formation ofthe lateritic duricrust, the destruction of the duricrust, andits transformation to latosol. Costa (1997) describes matureand immature laterite profiles in the Amazon region as aresult of two distinct periods of laterite formation in differ-ent climatic conditions. The observation that large, aggre-gate grains occur only in the duricrust may be significant,assuming it is not due to poor sampling statistics or a var-iation in the primary mineralization. It is possible these areremnants of primary polycrystalline grains, preserved bythe cementation of the duricrust. Similar grains would havebeen present in the saprolite, but ongoing exposure toweathering may have caused them to disaggregate or besufficiently weakened not to survive panning. Similarly,aggregates released from duricrust during latosol forma-tion may have been further weathered, so that none sur-vived. The corrosion of silver-poor rims on grains in thelatosol is evidence for this latter weathering.
Acknowledgments
This research was undertaken as part of a Ph.D.research project by JHL at the University of Sao Pauloand during a study visit to the CRC for Landscape Evolu-tion and Mineral Exploration, CSIRO Division of Explo-ration and Mining, and the University of WesternAustralia in Perth, Western Australia. FAPESP (State ofSao Paulo Research Foundation) is acknowledged for re-search Grant 1999/1537-9. CAPES Foundation (Coordina-tion of Training of Higher Education Graduate) isacknowledged for scholarship BEX0575/00-3. Prof.Dr. Romulo Angelica is thanked for discussions on goldgrain geochemistry and morphology and for his suggestionsand comments as a reviewer. Dr. Erik Van Noort is thankedfor discussions during EMPA analysis. Prof. Dr. Brendan J.Griffin and Ms. Sharon Platten are thanked for SEM assis-tance. Dr. Robert Hough is thanked for comments on a pre-vious version of the manuscript. Constructive reviews byDr. J.C. Parisot helped improve the manuscript.
References
de Almeida, F.F.M., Hasui, Y., de Brito Neves, B.B., Fuck (sic), R.A.A.,1981. Brazilian structural provinces: an introduction. Earth ScienceReview 17, 1–29.
Andrade, A.F., Santiago, A.F., Melo, C.F., Bizinella, G.A., Moreira,H.L., Santos, J.O.S., Oliveira, J.R., Moura, P.A., Lopes, R.C., RosaFilho, S.F., Neves, S.A.V., 1978. Projeto Tapajos – Sucunduri:relatorio de integracao geoloaus, CPRM/DNPM. 3v. (internal report).
Andrade, W.O., Mackesky, M.L., Rose, A.W., 1991. Gold distributionand mobility in the surficial environment, Carajas region, Brazil.Journal of Geochemical Exploration 40, 95–114.
Fig. 13. SEM images (backscattered electrons) of gold grains recoveredfrom saprolite (granophyre) showing silver-enriched zones (dark grey),following discontinuities in gold grains filled by silver-poor gold (lightgrey).
Fig. 14. Backscattered electron image (SEM) of a zoned aggregate grainfrom duricrust, with silver-poor zones at the contact between individualparticles. Note different tones of grey in core zones.
374 J.H. Larizzatti et al. / Journal of South American Earth Sciences 25 (2008) 359–376

Angelica, R.S., Costa, M.L., Pollmann, H., 1995. Mineralogia e geoquı-mica das partıculas de ouro nos perfis laterito-gossanicos das areasIgarape Bahia e Aguas Claras, Carajas, Para. In: V Congr. Bras.Geoq., Anais, Niteroi, RJ.
Antweiler, J.C., Campbell, W.L., 1977. Application of gold compositionalanalyses to mineral exploration in the United States. Journal ofGeochemical Exploration 8, 17–29.
Baker, W.E., 1978. The role of humic acid in the transport of gold.Geochimica et Cosmochimica Acta 42, 645–649.
Bowell, R.J., 1992. Supergene gold mineralogy at Ashanti, Ghana:implications for the supergene behavior of gold. MineralogicalMagazine 56, 545–560.
Bowell, R.J., 1993. The role of fulvic acid in the supergene migration ofgold in tropical rain forest soils. Geochimica et Cosmochimica Acta57, 4179–4190.
Boyle, R.W., 1979. The geochemistry of gold and its deposits. GeologicalSurvey of Canada Bulletin 280, 564p.
Benedetti, M., Boulege, J., 1991. Mechanism of gold transfer anddeposition in a supergene environment. Geochimica et CosmochimicaActa 55, 1539–1547.
Butt, C.R.M., 1989. Genesis of supergene gold deposits in the lateriticregolith of the yilgarn block, Western Australia. In: Keays, R.R.,Ramsay W.R.H., Groves, D.I. (Eds.), The Geology of Gold Deposits:The Perspective in 1988. Economic Geology Monograph 8. Proceed-ings of Bicentennial Gold 88, 460–470.
Colin, F., Edou-Minko, A., Nahon, D., 1989a. Lor particulaire dans leprofils lateritiques: alterations geochimiques et disprsion superficiellesem cditions equatorialles. Comptes Rendues de lAcademie desSciences, Paris 309 (serie II), 553–560.
Colin, F., Lecomte, P., Boulange, B., 1989b. Dissolution features of goldgrains in a lateritic profile at Dondo Mobi, Gabon. Geoderma 45, 241–250.
Colin, F., Vieillard, P., 1991. Behavior of gold in the lateritic equatorialenvironment: weathering and surface dispersion of residual goldgrains, at Dondo Mobi, Gabon. Applied Geochemistry 6, 279–290.
Conklin, M.H., Hoffmann, M.R., 1988. Metal ion–sulfur (IV) chemistry.3. Thermodynamics and kinetics of transient iron (III)–sulfur (IV)complexes. Environmental Science & Technology 22, 899–907.
Costa, M.L., 1997. Lateritization as a major process of ore depositformation in the Amazon region. Exploration and Mining Geology 6,79–104.
CPRM, 1999. Geology and Mineral Resources of Vila Mamae Ana Sheet(SB.21-V-D). 1:250.000 scale. CPRM, Manaus, 60p, unpublished (inPortuguese).
Craw, D., 1992. Growth of alluvial gold grains by chemical accretion andreprecipitation, Waimumu, New Zealand. New Zealand Journal ofGeology and Geophysics 35, 157–164.
Davy, R., El-Ansary, M., 1986. Geochemical patterns in the laterite profileat Boddington gold deposit, Western Australia. Journal of Geochem-ical Exploration 26, 119–144.
Desborough, G.A., 1970. Silver depletion indicated by microanalysis ofgold from placer occurrence, Western United States. EconomicGeology 65, 304–311.
Desborough, G.A., Heidel, R.H., Raymond, W.H., Tripp, J., 1971. Primarydistribution of silver and copper in native gold from six deposits in theWestern United States. Mineralium Deposita 6, 321–334.
Edou Minko, A., Colin, F., Trescases, J.J., Lecomte, P., 1992. Alterationlateritique du gıte aurifere d’Ovala (Gabon), et formation d’uneanomalie superficielle de dispersion. Mineralium Deposita 27, 90–100.
Eyles, N., 1990. Post-depositional gold nugget accretion in Late Cenozoicglacial placer deposits of Western Canada. Sediments 1990 – 13thInternational. Sedimentological Congress, pp. 74–75.
Freyssinet, P., Butt, C.R.M., 1988. Morphology and geochemistry of goldin a lateritic profile, Reedy mine, Western Australia. CSIRO AustraliaDivision of Exploration Geoscience Restricted Report MG 58R. 15pp.
Freyssinet, P., Zeegers, H., Tardy, Y., 1987. Neoformation d’or dans lescuirrasses lateritiques, dissolution, migration, precipitation. ComptesRendues de l’ Academie des Sciences, Paris 305 (serie II), 867–874.
Freyssinet, P., 1993. Gold dispersion related to ferricrete pedogenesis inSouth Mali: application to geochemical exploration. Chronique de.Recherche des Mines 510, 25–40.
Giusti, L., 1986. The morphology, mineralogy, and behaviour of ‘‘finegrained’’ gold from placer deposits of Alberta: sampling and implica-tions for mineral exploration. Canadian Journal of Earth Sciences 23,1662–1672.
Goleva, G.A., 1970. Geochemical trends in the occurrence and migrationforms of gold in natural waters. Geochemistry International 7, 518–529.
Gray, D.J., Butt, C.R.M., Lawrance, L.M., 1992. The geochemistry ofgold in lateritic terrains. In: Butt, C.R.M., Zeegers, H. (Eds.), RegolithExploration Geochemistry in Tropical and Subtropical Terrains.Handbook of Exploration Geochemistry, 4. Elsevier, Amsterdam,pp. 461–482.
Grimm, B., Friedrich, G., 1990. Weathering effects on supergene gold insoils of a semiarid environment, Gentio do Ouro, Brazil. In: Noack,Y., Nahon, D. (Eds.), Geochemistry of the Earth’s Surface and ofMineral Formation. Chemical Geology, 84, 70–73.
Groen, J.C., Craig, J.R., Rimstidt, J.D., 1990. Gold-rich rim formation onelectrum grains in placers. Canadian Mineralogist 28, 207–228.
Knight, J.B., Mortensen, J.K., Morison, S.R., 1999. Lode and placer goldcomposition in the Klondike district, Yukon Territory Canada:implications for the nature and genesis of Klondike placer and lodegold deposits. Economic Geology 94, 649–664.
Lawrance, L.M., Griffin, B.J., 1994. Crystal features of supergene gold atHannan South, Western Australia. Mineralium Deposita 29, 391–398.
Larizzatti, J.H., 2002. Gold and pathfinder elements in the regolith ofFazenda Pison garimpo – dispersion processes and implications forexploration. Unpublished PhD. thesis. University of Sao Paulo, 204p.(in Portuguese).
Machairas, G., 1963. Etude des phenomenes de migration chimique del’or. Cas de la Guyane Francaise et d’Ity en Cote-d’Ivoire. Bull. Soc.Franc. Miner. Crist. 86, 78–80.
Mann, A.W., 1984. Mobility of gold and silver in lateritic weatheringprofiles, some observations from Western Australia. Economic Geol-ogy 79, 38–49.
Michel, D., 1987. Concentration of gold in situ laterite from Mato Grosso.Mineralium Deposita 22, 185–189.
McCready, A.J., Parnell, J., Castro, L., 2003. Crystalline placer gold fromthe Rio Neuquen, Argentina: implications for the gold budget in placergold formation. Economic Geology 98, 623–633.
Morrison, G.W., Rose, W.J., Jaireth, S., 1991. Geological and geochem-ical controls on the silver content (fineness) of gold in gold–silverdeposits. Ore Geology Reviews 6, 333–364.
de Oliveira, S.M.B., Campos, E.G., 1991. Gold-bearing iron duricrust inCentral Brazil. Journal of Geochemical Exploration 41, 233–244.
de Oliveira, S.M.B., de Oliveira, N.M., 2000. The morphology of goldgrains associated with oxidation of sulphide-bearing quartz veins atSao Bartolomeu, central Brazil. Journal of South American EarthSciences 13, 217–224.
Plyusnin, A.M., Pogrelniak, Y.F., Mironov, A.G., Zhmodik, S.M., 1981.The behavior of gold in the oxidation of gold bearing sulphides.Geochemistry International 18, 116–123.
Porto, C.G., Hale, M., 1996. Mineralogy, morphology and chemistry ofgold in stone line lateritic profile of the Posse deposit, Central Brazil.Journal of Geochemical Exploration 57, 115–125.
RTDM, 1995. Relatorio de avaliacao do potencial aurıfero da areaFazenda Pison (AM). Rio Tinto Denvolvimentos Minerais. Confiden-tial report, 29pp. (in Portuguese).
Roslyakov, N.A., Peshevitsky, B.I., Nepeyna, L.A., Timbalist, V.G., 1971.Geochemistry of gold in processes of weathering crust formation.International Geological Congress, Moscow, Abstracts of reports. II,179–180.
Santos, J.O.S., Hartman, L.A., Gaudetti, H.E., 1997. Reconnaissance U–Pb in zircon, Pb–Pb in sulphides and review of Rb–Sr geochronologyin the Tapajos Gold Province, Para/Amazonas States, Brazil. South
J.H. Larizzatti et al. / Journal of South American Earth Sciences 25 (2008) 359–376 375

American Symposium on Isotope Geology – Brazil (SSAGI), Camposdo jordao, SP. Proceedings. 280–282.
Santos, J.O.S., Groves, D.I., Hartmann, L.A., Moura, M.A., McNaugh-ton, N.J., 2001. Alta Floresta Domains, Tapajos-Parima orogenic belt,Amazon Craton, Brazil. Mineralium Deposita 36, 278–299.
Santosh, M., Omana, P.K., 1991. Very high purity gold from lateriticweathering profiles of Nilambur, southern India. Geology 19, 746–749.
Sergeev, N.B., Zaikov, V.V., Laputina, L.P., Trofimov, O.V., 1994. Goldand silver in the supergene zone of the pyritic lode off the Gai deposit,the southern Urals. Geology of Ore Deposits 36, 152–164.
Stoffregen, R., 1986. Observations on the behavior of gold duringsupergene oxidation at Summitville, Colorado, U.S.A., and implica-tions for electrum stability in the weathering environment. AppliedGeochemistry 1, 549–558.
Vasconcelos, P.M., Kyle, J.R., 1991. Supergene geochemistry andcrystal morphology of gold in a semiarid weathering environment,application to gold exploration. Journal of Geochemical Exploration40, 115–132.
Vlassopoulos, D., Wood, S.A., 1990. Gold speciation in natural waters. I.Solubility and hydrolisis reactions of gold in aqueous solution.Geochimica et Cosmochimica Acta 54, 3–12.
Webster, J.G., Mann, A.W., 1984. The influence of climate, geomorphol-ogy and primary geology on the supergene migration of gold andsilver. Journal of Geochemical Exploration 22, 21–42.
Webster, J.G., 1986. The solubility of gold and silver in the system Au–Ag–S–O2–H2 at 25 �C and 1 atm. Geochimica et Cosmochimica Acta50, 1837–1846.
Wilson, A.F., 1984. Origin of quartz-free gold nuggets and supergene goldfound in laterites and soils – a review and some new observations.Australian Journal of Earth Sciences 31, 303–316.
Youngson, J.H., Craw, D., 1995. Evolution of placer gold deposits duringregional uplift, Central Ontago, New Zealand. Economic Geology 90,731–745.
Zang, W., Fyfe, W.S., 1993. A three-stage genetic model for the IgarapeBahia lateritic gold deposit, Carajas, Brazil. Economic Geology 88,1768–1779.
376 J.H. Larizzatti et al. / Journal of South American Earth Sciences 25 (2008) 359–376