morphological and molecular characterization of dietary...
TRANSCRIPT

Morphological and Molecular Characterization ofDietary-Induced Pseudo-Albinism during Post-EmbryonicDevelopment of Solea senegalensis (Kaup, 1858)Maria J. Darias1*, Karl B. Andree1, Anaıs Boglino1, Josep Rotllant2, Jose Miguel Cerda-Reverter3,
Alicia Estevez1, Enric Gisbert1
1Cultius Experimentals, Institut de Recerca i Tecnologia Agroalimentaries, Sant Carles de la Rapita, Catalunya, Spain, 2 Patobiologıa Molecular Acuatica, Instituto de
Investigaciones Marinas, Consejo Superior de Investigaciones Cientıficas, Vigo, Galicia, Spain, 3 Fisiologıa de la Reproduccion de peces, Instituto de Acuicultura Torre de la
Sal, Consejo Superior de Investigaciones Cientıficas, Castellon, Valencia, Spain
Abstract
The appearance of the pseudo-albino phenotype was investigated in developing Senegalese sole (Solea senegalensis, Kaup1858) larvae at morphological and molecular levels. In order to induce the development of pseudo-albinos, Senegalese solelarvae were fed Artemia enriched with high levels of arachidonic acid (ARA). The development of their skin pigmentationwas compared to that of a control group fed Artemia enriched with a reference commercial product. The relative amount ofskin melanophores, xanthophores and iridophores revealed that larval pigmentation developed similarly in both groups.However, results from different relative proportions, allocation patterns, shapes and sizes of skin chromatophores revealedchanges in the pigmentation pattern between ARA and control groups from 33 days post hatching onwards. The newpopulations of chromatophores that should appear at post-metamorphosis were not formed in the ARA group. Further,spatial patterns of distribution between the already present larval xanthophores and melanophores were suggestive ofshort-range interaction that seemed to be implicated in the degradation of these chromatophores, leading to theappearance of the pseudo-albino phenotype. The expression profile of several key pigmentation-related genes revealedthat melanophore development was promoted in pseudo-albinos without a sufficient degree of terminal differentiation,thus preventing melanogenesis. Present results suggest the potential roles of asip1 and slc24a5 genes on the down-regulation of trp1 expression, leading to defects in melanin production. Moreover, gene expression data supports theinvolvement of pax3, mitf and asip1 genes in the developmental disruption of the new post-metamorphic populations ofmelanophores, xanthophores and iridophores.
Citation: Darias MJ, Andree KB, Boglino A, Rotllant J, Cerda-Reverter JM, et al. (2013) Morphological and Molecular Characterization of Dietary-Induced Pseudo-Albinism during Post-Embryonic Development of Solea senegalensis (Kaup, 1858). PLoS ONE 8(7): e68844. doi:10.1371/journal.pone.0068844
Editor: Renping Zhou, Rutgers University, United States of America
Received February 10, 2013; Accepted June 1, 2013; Published July 16, 2013
Copyright: � 2013 Darias et al. This is an open-access article distributed under the terms of the Creative Commons Attribution License, which permitsunrestricted use, distribution, and reproduction in any medium, provided the original author and source are credited.
Funding: This work was funded by the Ministry of Science and Innovation (MICIIN) of the Spanish Government (project AGL2008-03897-C04-01/ACU). MD wassupported by a Juan de la Cierva post-doctoral contract (MICIIN, Spain). The funders had no role in study design, data collection and analysis, decision to publish,or preparation of the manuscript.
Competing Interests: The authors have declared that no competing interests exist.
* E-mail: [email protected]
¤ Current address: Conservation et Domestication, Institut de Sciences de l’Evolution de Montpellier, Institut de Recherche pour le Developpement, Montpellier,Herault, France
Introduction
Although more than 378 loci (171 cloned and 207 uncloned
genes) have been identified as being involved in vertebrate
pigmentation [1], the underlying bases of pigment pattern
development are far from being completely understood. Never-
theless, some pigmentation-related mechanisms have been de-
scribed in mammals, which represent a relatively straightforward
example of genetic color determination among vertebrates [2].
While mammals have only one class of pigment cell, the
melanocytes (which produce variations of black, brown, red or
yellow pigment), fishes constitute one of the most colorful
vertebrates, where color can be determined by up to six different
types of chromatophores: melanophores (black), xanthophores
(yellow), erythrophores (red), iridophores (iridescent, blue, silver or
gold), leucophores (dull, whitish) and cyanophores (blue) [3].
Together, these cells can produce almost any spectacular color
combination that can be seen, for instance, in the community of
fish from a coral reef. In spite of these added complexities, many of
the same genes and control networks found in mammals are
conserved in fish [4,5]; and considering their small size and easy
manipulation, fish are suitable models for a better understanding
of vertebrate pigmentation. Indeed, fish have been used as models
for melanoma research because it has been shown tissues within
fish share molecular signatures and histopathological features with
human cancers [6]. The genetics of pigmentation have been
explored in several model teleost fish including zebrafish [7,8],
medaka [9], fugu [10], goldfish [11,12] and, recently, in flatfish
[13,14,15]. Flatfish are particularly useful to analyze the origin of
pigmentation disorders during the ontogeny because altered
pigmentation can be induced under intensive rearing conditions
[16,17,18,19]. Senegalese sole is a flatfish species known to
develop pseudo-albinism when fed high levels of dietary
PLOS ONE | www.plosone.org 1 July 2013 | Volume 8 | Issue 7 | e68844

arachidonic acid (ARA) during their development [17]. However,
to our knowledge, there is no information about the possible
mechanism that underlies this process. The process of pigmenta-
tion development can be seen as a cooperative relationship among
three different processes: tissue remodeling (involving apoptosis),
cellular differentiation of chromatophores, and pigment produc-
tion. As a previous step, we have recently studied in the ocular side
of this species the morphological and molecular ontogeny of skin
pigmentation [15], which are essential to elucidate the mecha-
nisms of formation of the adult pigmentation pattern and to
understand when and how the albino phenotype appears. Gene
markers for the above mentioned processes were seen to alter in a
progression that was in synchrony with metamorphosis. The above
cited study revealed different stages of skin pigmentation and
development in Senegalese sole that coincided with the progress of
metamorphosis and patterns of gene expression: i) pre-metamor-
phosis period (2–11 dph), low expression of a marker of apoptosis
(casp3) and genes related to melanogenesis and high expression of
melanophore differentiating genes; ii) pro-metamorphosis period
(11–19 dph), high expression of casp3 (apoptosis and tissue
remodeling) and melanophore differentiating and melanogenic
genes; iii) post-metamorphosis (19–47 dph), low expression of all
analyzed genes, especially those associated to melanophore
differentiation. Major molecular changes in the pigment pattern
occurred during pro-metamorphosis and morphological changes
in the population of melanophores, xanthophores and iridophores
were evidenced at post-metamorphosis to enable the juveniles to
conform to the adult pattern of pigmentation [15].
In this report we investigated the morphological development of
pseudo-albinism in Senegalese sole and the quantitative expression
of eleven pigmentation-related genes to find out if any transcrip-
tional modulation could explain the deviation from normal
patterns of pigmentation. In order to obtain the pseudo-albino
phenotype, fish larvae were fed during their development with live
prey enriched with high levels of ARA, a powerful inhibitor of
pigmentation [17]. The pseudo-albino phenotype in Senegalese
sole was the result of a disruption of the signaling for the dorsal-
ventral patterning during metamorphosis and was characterized
by the presence of the pigment cells that differentiated during
embryogenesis [20] and the very early stages of larval development
(genetically programmed chromatoblast differentiation) and by the
absence of pigment cells that should be formed after metamor-
phosis for development of the adult pigmentation pattern
(environmentally modifiable chromatoblast differentiation). Gene
expression results provided evidence that pax3, mitf and asip were
involved in the developmental disruption of the new post-
metamorphic populations of melanophores, xanthophores and
iridophores and that melanogenesis was disrupted through the
negative regulatory action of asip1 and slc24a5 on trp1 gene
expression.
Results
Growth, Survival, Metamorphosis and PigmentationSuccessNo differences in growth and survival rates were found at the
stage of post-embryonic development for both groups in
Senegalese sole larvae (control and ARA) (Table 1). The eye
migration index, which is used to follow the progress of
metamorphosis in flatfish [21], was similar in both dietary
treatments. However, at the end of the experiment, the control
group was composed of 99% pigmented larvae, whereas 80% of
the larvae from the ARA group became pseudo-albinos (Table 1).
Morphological Development of Pseudo-albinoPhenotypeIn brief and in terms of skin pigmentation, the progress of
metamorphosis of Senegalese sole larvae occurred within the
following periods: pre-metamorphosis (until 11 dph), pro-meta-
morphosis (from 11 to 19 dph) and post-metamorphosis (from 19
to 47 dph). During pre- and pro- metamorphosis, larvae from both
dietary groups underwent a normal development of skin pigmen-
tation. At 22 dph, when larvae already had flat symmetry, the
pigmentation pattern of individuals from both dietary groups was
similar, showing a very dense net of melanophores, xanthophores
and leucophores that covered the head, the digestive cavity and
the intermediate region of the trunk. They also presented two
patches of chromatophores on the dorsal fin and another one on
the anal fin (Figs. 1A–A’). At 27 dph, although the relative
amounts of melanophores, xanthophores and iridophores were
similar in both groups (Figs. 1B–B’, 2A–C), the skin of larvae from
the ARA group appeared less pigmented than that of the larvae
from the control group due to the progressive disappearance of
leucophores that conferred the greenish aspect to the skin
(Fig. 1B’). Differences in the amount and shape of melanophores
and xanthophores between larvae from both experimental groups
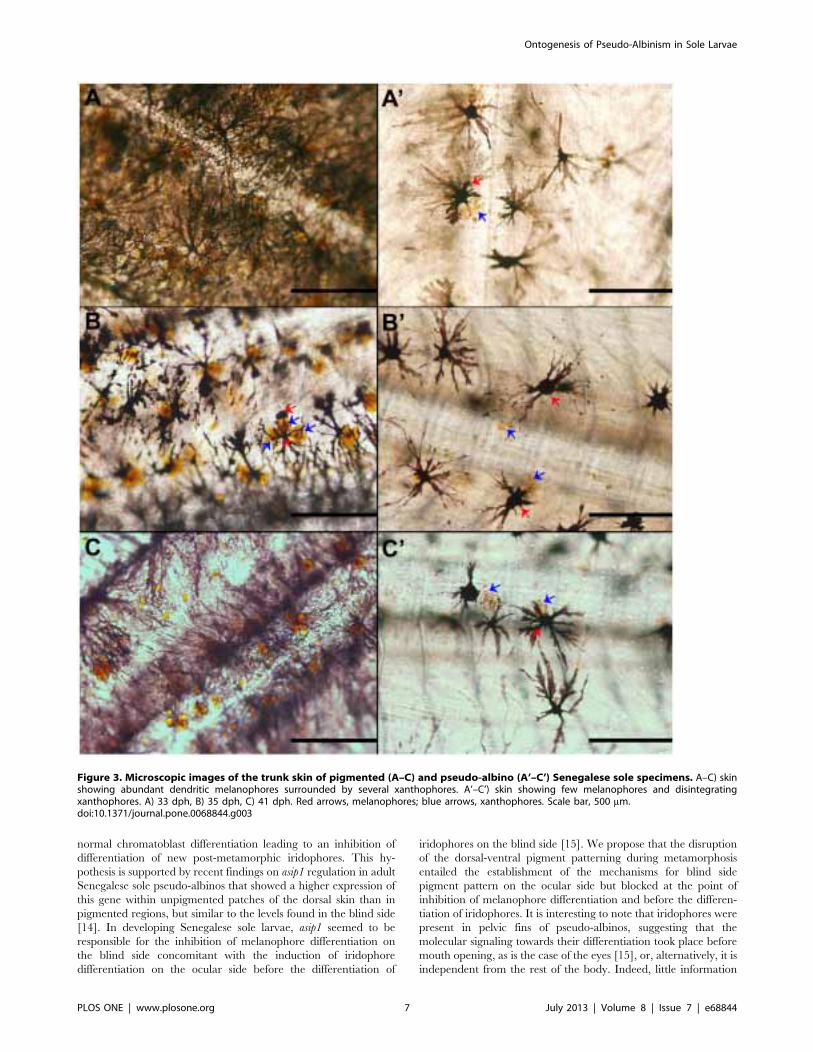
were in evidence from 33 dph (Figs. 1C–C’, 2A, 3A). The skin of
the trunk presented abundant melanophores that were closely
associated to 2 to 5 xanthophores in pigmented larvae (Fig. 3A–C,
Table 2), whereas fewer xanthophores were related to one
melanophores in pseudo-albinos (Table 2), most of them showing
signs of disintegration (Fig. 3A’–C’; Table 3). Moreover, there
were differences in the distance among xanthophores and
melanophores between both groups. Generally, xanthophores
were in direct contact with melanophores in pseudo-albinos,
whereas they were closely associated, but not in contact, in
pigmented specimens (Fig. 4A, B). Patches composed of melano-
phores, xanthophores and leucophores observed in pigmented
individuals were not found in future pseudo-albinos (Fig. 1C’).
However, iridophores were present in the pelvic fins of specimens
Table 1. Larval size in dry weight (DW, mg), standard length(SL, mm), specific growth rate (SGR, % day21), survival rate(%), pigmentation (%) and eye migration index (IEM) ofSenegalese sole fed the two different dietary treatments.
AGE CONTROL ARA
DW 15 dph 0.0960.01 0.0960.01
30 dph 0.7760.07 0.8960.06
50 dph 1.9260.24 1.7160.32
SL 15 dph 4.1860.05 4.3560.05
30 dph 6.40160.07 6.7560.07
50 dph 8.7560.22 8.7160.17
SGR 2–50 dph 0.0860.00 0.0860.00
Survival 50 dph 97.360.25 98.460.24
Pigmentation 50 dph 99.160.50a 18.6612.9b
Metamorphosis 15 dph 2.9760.06 3.0460.10
30 dph 5.9460.39 5.8660.24
50 dph 5.9460.03 5.9660.03
Initial (2 dph) DW and SL of larvae were 3.0760.02 mm and 36.761.6 mg,respectively. Values are expressed as mean 6 SEM (N= 4). Superscript lettersindicate significant differences among dietary treatments (One-way ANOVA,P,0.05).doi:10.1371/journal.pone.0068844.t001
Ontogenesis of Pseudo-Albinism in Sole Larvae
PLOS ONE | www.plosone.org 2 July 2013 | Volume 8 | Issue 7 | e68844

from both groups (Figs. 1C–C’). At the level of the fins, future
pseudo-albinos showed leucophores that appeared pale pink by
reflected light, few iridescent iridophores, and round-shaped
melanophores and xanthophores that were often associated in
pairs and showed signs of degradation later in development
(Figs. 3A’–C’, 4D, E). These chromatophores were progressively
disappearing with age and, at 60 dph, the skin of the fin contained
only a few leucophores located in the most apical region of the fins
(Fig. 4F). At 35 dph the pseudo-albino phenotype was already
established (Fig. 1D’). The differences in the amounts of
xanthophores and iridophores between pigmented and pseudo-
albino specimens became more evident (Figs. 1D–D’, 2B–C) and
the grouping of iridophores in the fins of pigmented individuals
was not found in pseudo-albinos (Fig. 1D’). From 35 to 47 dph, the
amount of chromatophores in pseudo-albinos remained invariable
(Figs. 1E’–F’, 2A–C). However, because there was an increase in
the amount of melanophores and xanthophores in pigmented
individuals from 41 to 47 dph, there was a significant difference in
the amount of all chromatophores between pigmented larvae and
pseudo-albinos at 47 dph (Fig. 2A–C). At the level of the trunk,
melanophores were dendritic in pigmented individuals while the
ability to disperse melanosomes seemed to be reduced in most
pseudo-albinos (Figs. 4A, B, 6). In the skin of the fins,
xanthophores and melanophores differed in shape between both
groups: xanthophores were round in pigmented individuals
whereas quite deformed in pseudo-albinos; melanophores were
dendritic in pigmented individuals while round-shaped in pseudo-
albinos (Fig. 4C, D).
Skin ChromatophoresFigure 2 shows the relative amount of chromatophores in larvae
from control and ARA treatments during post-metamorphosis
(from 27 to 47 dph). Specimens from the control group showed
19.7561.13% of melanophores from 27 to 41 dph. Then, the
relative amount of melanophores increased up to 51% from 41 to
47 dph (Fig. 2A). Larvae from the ARA group presented
13.2662.15% of melanophores during the whole post-metamor-
phosis period (Fig. 2A). The relative amount of melanophores was
significantly lower in larvae from the ARA group compared to
those from the control at 33, 35 and 47 dph (Fig. 2A). The relative
amount of xanthophores in control specimens remained constant
from 27 to 35 dph (22.2863.62%). From 35 to 41 dph, the relative
amount of xanthophores decreased to 9% and increased again up
to 22% at 47 dph (Fig. 2B). Among larval chromatophores from
the ARA group from 27 to 33 dph, 15.2260.82% were
xanthophores. From 33 to 35 dph, the amount of these pigment
cells decreased by a half and remained invariable until 47 dph
(Fig. 2B). The amount of xanthophores in pseudo-albinos was
significantly lower than in pigmented individuals at 33, 35 and 47
dph (Fig. 2B). The amount of iridophores in pigmented individuals
was low from 27 to 33 dph and then it increased 8 times from 33 to
35 dph and remained invariable from that day onwards
(85.5466.14%) (Fig. 2C). In pseudo-albinos, the amount of
iridophores was low and stable during the entire period analyzed
(2.6361.64%) (Fig. 2C). The amount of iridophores was
significantly lower in pseudo-albinos than in pigmented individuals
from 35 dph onwards (Fig. 2C).
Figure 5 shows the relative percentage of skin chromatophores
in specimens from control (Fig. 5A) and ARA (Fig. 5B) groups at
each sampling day. At 27 dph, larvae from both populations
presented similar relative amounts of skin melanophores and
xanthophores, and a lower amount of iridophores. At 33 dph,
xanthophores were the most abundant pigment cell in ARA
group, followed by melanophores and, finally, iridophores. At 35
dph, the amount of iridophores was higher than that of
melanophores and xanthophores in pigmented specimes, whereas
melanophores were more abundant than xanthophores and
iridophores in pseudo-albinos. At 41 dph, iridophores were more
abundant than melanophores, followed by xanthophores in
pigmented individuals, while melanophores were more abundant
than xanthophores, followed by iridophores in pseudo-albinos.
These profiles of chromatophore proportions were maintained at
47 dph.
The number of xanthophores associated to one melanophore in
each group of larvae during post-metamorphosis of Senegalese
sole is shown in Table 2. Larvae from the control group showed a
X/M (xanthophore/melanophore) ratio close to 1 at 27 dph. The
number of xanthophores related to one melanophore increased at
33 dph, and decreased until 2 from 33 to 35 dph. At 41 dph, the
X/M ratio increased again displaying an average of 4. The X/M
ratio in the skin of larvae from the ARA group was close to 1 at 27
dph and it subsequently decreased to almost 0 until the end of the
analyzed period.
The size of skin chromatophores in pseudo-albinos and
pigmented specimens at post-metamorphosis is shown in
Figure 6. The size of melanophores was around 50 mm in
pseudo-albinos and pigmented specimens. However, their capacity
to disperse melanine was significantly reduced in pseudo-albinos
(Figs. 4A, 4B, 6). The size of xanthophores was higher in pseudo-
albinos than in pigmented specimens (90 versus 22 mm in average).
Iridophores were the smallest pigment cells and their size was
similar in both larval groups (17 mm in average, Fig. 6).
From individuals in the control group 25% showed disintegrat-
ing xanthophores from 27 to 35 dph, whereas no evidences for
xanthophores disintegration were observed at 41 dph (Table 3).
From the ARA group 25% of larvae presented disintegrating
xanthophores at 27 dph, a 100% at 33 dph, and around a 50% at
35 and 41 dph (Table 3).
Modulation of Gene Expression in Pseudo-albinoSpecimensPartial coding sequences from 10 pigmentation-associated genes
from Senegalese sole (Table 4) were obtained using consensus
primers: melanocyte-stimulating hormone 1 receptor (mc1r), agouti
signaling protein (asip), paired box protein 3 (pax3), microphtalmia-
associated transcription factor (mitf), tyrosinase (tyr), tyrosinase-
related protein 1 (trp1), mast/stem cell growth factor receptor Kit
(cKit), sodium/potassium/calcium exchanger 5 (slc24a5), enzyme
caspase 3 (casp3) and heat shock 70 kDa protein (hsp70). Fragments
ranged in size from 272 to 1138 base pairs. Additionally,
somatolactin (sl) was downloaded from GenBank.
The average efficiency of amplification for all assays was 99%,
the slopes of the standard curves being 3.3, 3.1, 3.5, 3.2, 3.2, 3.5,
3.3, 3.5, 3.5, 3.4 and 3.3 for pax3, tyr, mitf, mcr1, asip, hsp70, sl,
casp3, trp1, slc25a5 and cKit, respectively. Results of gene expression
in 60 day-old pseudo-albino specimens showed a positive and
statistically significant up-regulation of pax3, tyr, mitf, mcr1, asip,
hsp70 and sl (9, 5, 4, 1.7, 2.6, 1.5 and 1.8 fold changes, respectively)
and a down-regulation of casp3, trp1, slc24a5 and cKit (1.2, 1.3, 4.4
and 1.4 fold changes, respectively) compared to the pigmented
individuals (Fig. 7).
Discussion
Morphological Development of Pseudo-albinosMorphological data revealed that ARA did not affect larval
pigmentation at the pre-metamorphic stage, but prevented
chromatophore terminal differentiation at metamorphosis, leading
Ontogenesis of Pseudo-Albinism in Sole Larvae
PLOS ONE | www.plosone.org 3 July 2013 | Volume 8 | Issue 7 | e68844

Ontogenesis of Pseudo-Albinism in Sole Larvae
PLOS ONE | www.plosone.org 4 July 2013 | Volume 8 | Issue 7 | e68844

to the appearance of pseudo-albinism. The amount of melano-
phores and iridophores in pseudo-albinos remained invariable
during the entire studied period. However, normally pigmented
specimens showed an increase in the population of melanophores
and iridophores at post-metamorphosis (47 and 35 dph, respec-
tively). This indicates that the new population of chromatophores
that should appear after metamorphosis was not formed (or cells
were not pigmented) in pseudo-albinos. While molecular signaling
towards the differentiation of new populations of melanophores,
xanthophores and iridophores occurs during pro-metamorphosis
(11–19 dph), morphological changes occur later at post-metamor-
phosis [15]. Considering that the amount and proportions of these
chromatophores were similar in pigmented and pseudo-albino
specimens until 27 dph, and that their number remained
invariable from that day onwards, it seemed that pigment cell
precursors were likely influenced by the asymmetric signaling
during pro-metamorphosis rather than in mature larval chro-
matophores [13]. The decrease in xanthophores from 33 to 35
dph observed in pseudo-albinos was likely the result of the
degradation of already existent xanthophores. Interestingly, and
contrary to pigmented specimens, round-shaped melanophores
and xanthophores were often coupled in pseudo-albinos and their
closer association, together with the increased size of xantho-
phores, suggested some type of mechanism may be in operation
that leads to the collapse of these chromatophores. The different
allocation, shape, size and distance between melanophores and
xanthophores observed in pseudo-albinos suggested the possible
existence of an altered communication between these pigment
cells. Interactions between these pigment cells have already been
reported and it is believed that xanthophores regulate melano-
phore pattern [22]. In fact, this relationship is required to form the
Turing pattern of zebrafish [23] and has also been suggested for
the pigmentation patterning of Senegalese sole [15]. Moreover, it
has been shown that when melanophores and xanthophores are
adjacent, these cells exclude each other [23]. These interactions
seem to be necessary for the normal development of pigmentation
[15], as 25% of the population of pigmented individuals showed
disintegrating xanthophores in their skin from 27 to 35 dph.
However, at 41 dph, disintegrating xanthophores were not
observed in pigmented specimens, probably indicating the end
of the action of melanophores over xanthophores for the
establishment of the adult pigment pattern. In a previous study
we observed that the normal pattern of interaction between
xanthophores and melanophores towards the achievement of the
adult pigmentation showed a fluctuating X/M ratio from 27 to 47
dph [15]. Present results suggest that the X/M ratio and cell
proximity play a key role in the correct dorsal-ventral pigment
patterning. Although the amount was not significant compared to
that of xanthophores, disintegrating melanophores were observed
from 41 to 60 dph (Fig. 4D). In line with this, xanthophores of
zebrafish were able to reduce the surrounding melanophores
within a short-range, whereas xanthophores that were distally
located from melanophores were able to enhance the development
and survival of the latter cells [23]. This seemed to also be the case
for pigmented Senegalese sole specimens in which small
xanthophores could be seen surrounding the well-developed
melanophores (Fig. 4C). Altogether these results show that
chromatophores develop and interact in a very delicate equilib-
rium where xanthophores play a central role in pigment
patterning, the relative proportion and behavior (allocation, size,
shape) of this pigment cell being critical for the correct ontogeny of
pigmentation.
Pseudo-albinos had lost most of their leucophores, with those
few remaining being located almost exclusively in the distal part of
the fins. Moreover, when analyzing different specimens displaying
different degrees of pseudo-albinism, it was noticed that, as the fins
grew, tissue lacking pigmented chromatophores appeared basally.
This could be an indication of new tissue devoid of chromato-
phores (or cells devoid of pigment) being produced basally and that
the early leucophores located basally disappeared (Fig. 4F) [13].
Modulation of Gene Expression in Pseudo-albinoSpecimensThe morphological changes in skin pigmentation observed in
pseudo-albinos were reflected in their molecular signaling response
as seen via analysis of the eleven pigmentation-related genes in
which different expression patterns were evident in pseudo-albinos
as compared to pigmented specimens. These differences likely
prevented the development of post-metamorphic melanophores,
xanthophores and iridophores.
Regarding melanophores, two mechanisms (probably related)
accounted for the absence of melanin. The first one is that initial
but not terminal differentiation of melanophores was promoted
and the second one is that melanin synthesis was disrupted at the
last step of this process (Figs. 7, 8). It has been recently shown that
the gene sl enhances the differentiation of melanophores in
medaka, although the specific molecular action is not yet known
[24]. The up-regulation of sl expression in Senegalese sole pseudo-
albinos pointed to melanophore differentiation being stimulated.
This is further supported by the significant up-regulation of pax3,
which is one of the first genes expressed in melanoblast/
melanophore precursors [25,26] and plays a key role in controlling
the development of melanocytes [27]. In this capacity, pax3
maintains the equilibrium between melanocyte differentiation and
melanin synthesis. During stem cell differentiation into melano-
cytes, pax3 simultaneously induces a melanogenic cascade, through
the activation of trp1 expression, while acting downstream to
Figure 1. Morphological comparison of the ontogeny of skin pigmentation in Senegalese sole larvae from the control (A–F) andARA (A’–F’) groups. A–A’) 22 dph, B–B’) 27 dph, C–C’) 33 dph, D–D’) 35 dph, E–E’) 41 dph, F–F’) 47 dph. At 22 dph, the pigmentation pattern oflarvae from both dietary groups is similar, showing a very dense net of melanophores, xanthophores and leucophores that covers the head, thedigestive cavity and the intermediate region of the trunk. They have also two patches of chromatophores in the dorsal fin and another one in the analfin. At 27 dph, although the relative amounts of melanophores, xanthophores and iridophores was similar in both groups (Fig. 2), the skin of larvaefrom the ARA group appeared less pigmented than that of the larvae from the control group due to the progressive disappearance of leucophoresthat confers the greenish aspect to the skin. At 33 dph, the amount of melanophores in control larvae was higher than in those fed with ARA. Redarrows indicates the allocation of patches of melanophores, xanthophores and leucophores in pigmented individuals (C) and their absence in futurepseudo-albino individuals (C’). Green arrows show the presence of iridophores in the pelvic fins of specimens from both groups. At 35 dph thepseudo-albino phenotype is already established. The differences in the amounts of xanthophores and iridophores between pigmented (D) andpseudo-albino (D’) specimens became more evident (Fig. X). Green arrows show aggrupation of iridophores in the dorsal fin in pigmented individuals(D) and their absence in future pseudo-albino individulas (D’). From 35 to 47 dph, the amount of chromatophores in pseudo-albinos remainedinvariable. However, because there was an increase in the amount of melanophores and xanthophores in pigmented individuales from 41 to 47 dphthere was a significant difference in the amount of all chromatophores between pigmented and pseudo-albino individuals at 47 dph. Scale bar,600 mm.doi:10.1371/journal.pone.0068844.g001
Ontogenesis of Pseudo-Albinism in Sole Larvae
PLOS ONE | www.plosone.org 5 July 2013 | Volume 8 | Issue 7 | e68844

prevent terminal differentiation [28]. Such a mechanism guaran-
tees cellular proliferation, thus sustaining this cell population [27].
Pax3 is able to inhibit the expression of trp2, responsible for the
conversion of L-dopachrome into 5,6-dihydroxyindole-2-carbox-
ylate. This ensures high levels of mitf expression to induce
melanocyte differentiation [29,30] but at the same time prevents
terminal differentiation. In the presence of b-catenin, the action of
pax3 to block trp2 transcription is missing [31] and then trp2
contributes to melanocyte differentiation (Fig. 8). In Senegalese
sole pseudo-albinos, pax3 seemed to promote melanophore
differentiation through the up-regulation of mitf while preventing
its terminal differentiation through the down-regulation of trp1
expression (Fig. 8). As occurs with mitf, pax3 also promotes and
inhibits melanogenesis through transcriptional regulation of cKit
[30]. CKit plays a critical role in melanocyte physiology by
influencing melanogenesis, migration and survival of these cells
[32] and it is primarily expressed in the melanized melanophores
[13]. In Senegalese sole developing larvae, the profile of cKit/pax3
and mitf/pax3 ratios reflected the pattern of melanophore ontogeny
[15]. Larvae underwent a process of melanogenesis during pre-
metamorphosis and a stabilization of melanophore differentiation
and melanogenesis processes during pro-metamorphosis. Once
metamorphosis was finished, these ratios increased again indicat-
ing the prevalence of melanogenesis over melanophore differen-
tiation. The gene expression profile of pax3, mitf and cKit in
metamorphosed pseudo-albinos compared to pigmented individ-
uals indicated that melanophore differentiation prevailed over
melanin synthesis, which is surprisingly opposite to what was
expected to occur at that period. This suggests that the switch of
the molecular events that should take place from pro- to post-
metamorphosis to develop the adult pigmentation pattern was
disrupted in pseudo-albinos.
Mitf is also a master regulator of melanogenesis due to its ability
to activate many melanocyte-specific genes, such as tyr, trp1 and
trp2 [33,34], and mc1r [35]. The melanocyte-stimulating hormone
alpha (a-MSH) induces the proliferation of melanophores through
binding to its receptor, MC1R [3], and activates melanogenesis
through the positive regulation of tyr activity (Fig. 8). The end of
pigmentation metamorphosis in pigmented Senegalese sole
specimens was marked by a decrease in mc1r expression [15].
However, pseudo-albinos at post-metamorphosis showed an up-
regulation of mc1r providing more evidence for altered molecular
signatures preventing terminal development of skin pigmentation.
The elevated amount of mitf transcripts in pseudo-albinos could be
responsible for the up-regulation of mc1r. As a consequence of this,
and as happens in pigmented individuals, an up-regulation of tyr
induced by mc1r could be expected [36]. It has been shown that tyr
gene transcription is also induced by the transient activation of the
cKIT receptor by its ligand, stem cell factor, in differentiated
melanocytes [37]. Down-regulation of cKit observed in pseudo-
albinos compared to pigmented specimens likely indicated that cKit
was not the primary cause for the induction of tyr expression. The
lower levels of expression of cKit observed in pseudo-albinos could
reflect the lower amount of differentiated melanophores compared
to the pigmented individuals. But it also corroborates that cKit was
not expressed in what seem to be unmelanized melanophores.
Further, tyr expression could also be directly induced by pax3. The
significant up-regulation of pax3 expression in pseudo-albinos,
together with mitf and tyr, illustrates the above-mentioned role of
pax3 in controlling melanophore differentiation. However, the
pseudo-albino phenotype was characterized by the presence of few
melanized melanophores. This is in line with the thought that pax3
in mammals is expressed in early development, but inhibited in
adult melanocytes [31]. Therefore, although molecular signaling
suggests that melanophore differentiation was favored, melano-
genesis was not.
Asip1 is thought to be involved in the establishment of the
dorsal-ventral pigment pattern by directing chromatophore
differentiation, causing production of iridophores and inhibiting
the production of melanophores [12]. However, the development
of iridophores, which typically occurs at post-metamorphosis [15],
was distorted in Senegalese sole pseudo-albinos. Our results
suggest that ARA affected normal gene expression in a way which
blocked the pigment patterning that should have been established
on the ocular side of the fish at metamorphosis via asip1 gene
expression; then, the excessive asip1 expression levels could alter
Figure 2. Relative percentage of skin melanophores (A),xanthophores (B) and iridophores (C) during post-metamor-phosis of pigmented (control) and pseudo-albino (ARA)individuals of Senegalese sole. Values are expressed as mean 6SD (N=4). Superscript letters denote significant differences in therelative amount of chromatophores with age for a given larval groupand asterisks indicate significant differences in the amount ofchromatophores between pigmented and pseudo-albino specimensfor a given larval age (Two-way ANOVA, P,0.05; diet x age interactionP,0.006).doi:10.1371/journal.pone.0068844.g002
Ontogenesis of Pseudo-Albinism in Sole Larvae
PLOS ONE | www.plosone.org 6 July 2013 | Volume 8 | Issue 7 | e68844
normal chromatoblast differentiation leading to an inhibition of
differentiation of new post-metamorphic iridophores. This hy-
pothesis is supported by recent findings on asip1 regulation in adult
Senegalese sole pseudo-albinos that showed a higher expression of
this gene within unpigmented patches of the dorsal skin than in
pigmented regions, but similar to the levels found in the blind side
[14]. In developing Senegalese sole larvae, asip1 seemed to be
responsible for the inhibition of melanophore differentiation on
the blind side concomitant with the induction of iridophore
differentiation on the ocular side before the differentiation of
iridophores on the blind side [15]. We propose that the disruption
of the dorsal-ventral pigment patterning during metamorphosis
entailed the establishment of the mechanisms for blind side
pigment pattern on the ocular side but blocked at the point of
inhibition of melanophore differentiation and before the differen-
tiation of iridophores. It is interesting to note that iridophores were
present in pelvic fins of pseudo-albinos, suggesting that the
molecular signaling towards their differentiation took place before
mouth opening, as is the case of the eyes [15], or, alternatively, it is
independent from the rest of the body. Indeed, little information
Figure 3. Microscopic images of the trunk skin of pigmented (A–C) and pseudo-albino (A’–C’) Senegalese sole specimens. A–C) skinshowing abundant dendritic melanophores surrounded by several xanthophores. A’–C’) skin showing few melanophores and disintegratingxanthophores. A) 33 dph, B) 35 dph, C) 41 dph. Red arrows, melanophores; blue arrows, xanthophores. Scale bar, 500 mm.doi:10.1371/journal.pone.0068844.g003
Ontogenesis of Pseudo-Albinism in Sole Larvae
PLOS ONE | www.plosone.org 7 July 2013 | Volume 8 | Issue 7 | e68844

Ontogenesis of Pseudo-Albinism in Sole Larvae
PLOS ONE | www.plosone.org 8 July 2013 | Volume 8 | Issue 7 | e68844
exists on the molecular mechanisms driving iridophore develop-
ment. It has been recently demonstrated that mitf, the key
regulator of melanophore development and melanogenesis
[25,38], also regulates cell fate plasticity in zebrafish, including
the formation of iridophores [33]. Minchin and Hughes [26]
demonstrated that mitf inhibits the iridophore fate in zebrafish. In
Senegalese sole pigmented individuals, the expression of mitf
decreased during development to promote the bi-potent pigment
cells precursors to differentiate into iridophores instead of
melanophores [15]. However, this gene was up-regulated in
pseudo-albinos, giving more evidence for the disruption of the
normal development of iridophores in these specimens. Consid-
ering this, it is tempting to speculate that the overexpression of mitf
in Senegalese sole pseudo-albinos could be blocking the differen-
tiation of precursor cells into iridophores, as melanophore and
iridophores have a common precursor and both cell types were not
developed in pseudo-albinos. This is suggestive that an excess of
asip1 and mitf expression is preventing the development of
melanophores and iridophores by exerting their inhibitory
function at the level of their cellular precursors. Whether asip1 is
able to modulate the expression of mitf and/or vice versa needs to
be explored. These findings are in line with the evolvement of
chromatophore development in Senegalese sole peudo-albinos at
post-metamorphosis, where the amount of melanophores was
invariable, the amount of xanthophores was reduced and
iridophores were not differentiated. The putative implication of
mitf in xanthophore disintegration deserves to be investigated.
Taking into account these findings, Senegalese sole pseudo-albinos
seemed to face a problem of post-metamorphic iridophore and
xanthophore development and terminal differentiation of mela-
nophores. Whether the above described molecular signaling
contributing to melanophore differentiation is due to signals from
the surrounding immature melanophores needs to be further
investigated.
Although tyr expression was highly induced in pseudo-albinos,
the completion of this process was inhibited at the last step of
melanin production through the down-regulation of trp1. More-
over, the low expression level of trp1 would be induced by the
down-regulation of slc24a5 (Fig. 8). In fact, it has been
demonstrated that the knockdown of slc24a5 provoked dramatic
effects on pigmentation in re-differentiating human epidermal
melanocytes causing hypomelanosis [39]. Slc24a5 is a putative
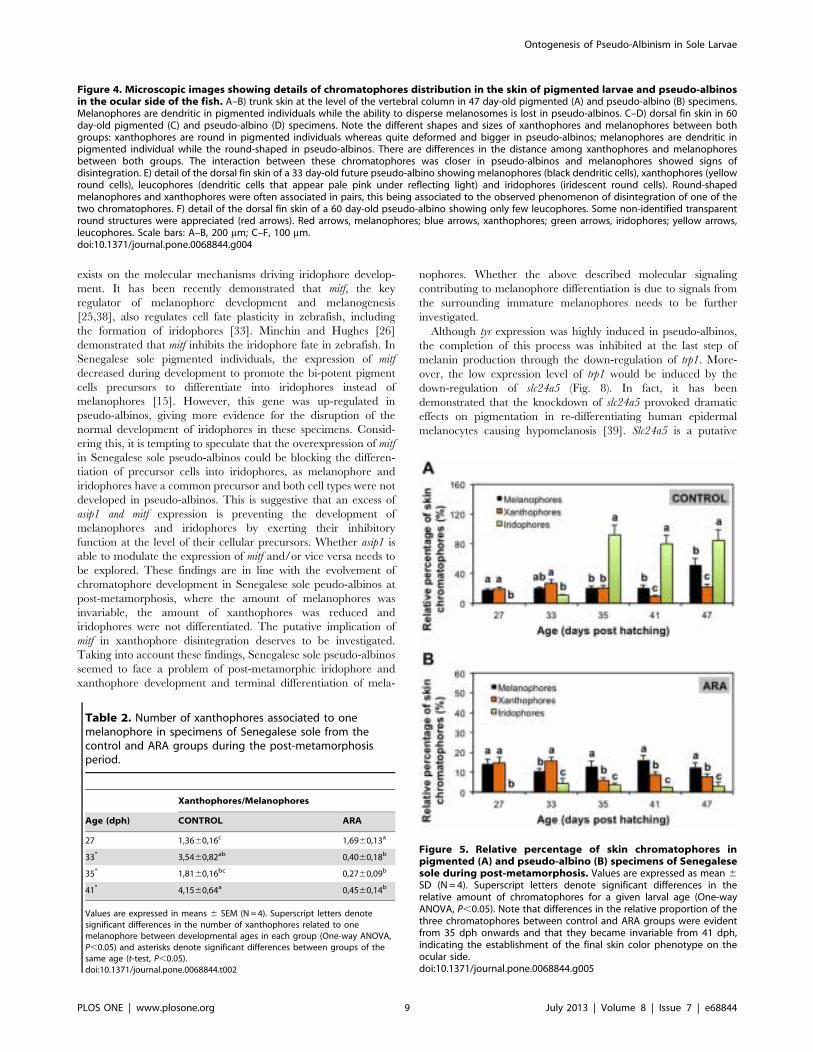
Figure 4. Microscopic images showing details of chromatophores distribution in the skin of pigmented larvae and pseudo-albinosin the ocular side of the fish. A–B) trunk skin at the level of the vertebral column in 47 day-old pigmented (A) and pseudo-albino (B) specimens.Melanophores are dendritic in pigmented individuals while the ability to disperse melanosomes is lost in pseudo-albinos. C–D) dorsal fin skin in 60day-old pigmented (C) and pseudo-albino (D) specimens. Note the different shapes and sizes of xanthophores and melanophores between bothgroups: xanthophores are round in pigmented individuals whereas quite deformed and bigger in pseudo-albinos; melanophores are dendritic inpigmented individual while the round-shaped in pseudo-albinos. There are differences in the distance among xanthophores and melanophoresbetween both groups. The interaction between these chromatophores was closer in pseudo-albinos and melanophores showed signs ofdisintegration. E) detail of the dorsal fin skin of a 33 day-old future pseudo-albino showing melanophores (black dendritic cells), xanthophores (yellowround cells), leucophores (dendritic cells that appear pale pink under reflecting light) and iridophores (iridescent round cells). Round-shapedmelanophores and xanthophores were often associated in pairs, this being associated to the observed phenomenon of disintegration of one of thetwo chromatophores. F) detail of the dorsal fin skin of a 60 day-old pseudo-albino showing only few leucophores. Some non-identified transparentround structures were appreciated (red arrows). Red arrows, melanophores; blue arrows, xanthophores; green arrows, iridophores; yellow arrows,leucophores. Scale bars: A–B, 200 mm; C–F, 100 mm.doi:10.1371/journal.pone.0068844.g004
Table 2. Number of xanthophores associated to onemelanophore in specimens of Senegalese sole from thecontrol and ARA groups during the post-metamorphosisperiod.
Xanthophores/Melanophores
Age (dph) CONTROL ARA
27 1,3660,16c 1,6960,13a
33* 3,5460,82ab 0,4060,18b
35* 1,8160,16bc 0,2760,09b
41* 4,1560,64a 0,4560,14b
Values are expressed in means 6 SEM (N= 4). Superscript letters denotesignificant differences in the number of xanthophores related to onemelanophore between developmental ages in each group (One-way ANOVA,P,0.05) and asterisks denote significant differences between groups of thesame age (t-test, P,0.05).doi:10.1371/journal.pone.0068844.t002
Figure 5. Relative percentage of skin chromatophores inpigmented (A) and pseudo-albino (B) specimens of Senegalesesole during post-metamorphosis. Values are expressed as mean 6SD (N= 4). Superscript letters denote significant differences in therelative amount of chromatophores for a given larval age (One-wayANOVA, P,0.05). Note that differences in the relative proportion of thethree chromatophores between control and ARA groups were evidentfrom 35 dph onwards and that they became invariable from 41 dph,indicating the establishment of the final skin color phenotype on theocular side.doi:10.1371/journal.pone.0068844.g005
Ontogenesis of Pseudo-Albinism in Sole Larvae
PLOS ONE | www.plosone.org 9 July 2013 | Volume 8 | Issue 7 | e68844

cation exchanger known to increase uptake and accumulation of
calcium in melanocytes, necessary for melanin synthesis [40,41]
where calcium plays an important role as a second messenger in
the initiation of melanogenesis by stimulating the synthesis of L-
tyrosine [42]. The significant down-regulation of slc24a5 expres-
sion in pseudo-albinos suggests that tyrosine production may be
altered in these specimens. Interestingly, expression of slc24a5 has
been found to be negatively regulated by asip1 [43] (Fig. 8). The
reason why and how this gene is down-regulated by ARA to
generate pseudo-albinos needs further investigation. Therefore, in
addition to the known role of the gene asip1 in iridophore
differentiation in fish [12], our results show that asip1 also regulates
melanophore differentiation and melanogenesis [44]. This has
been already demonstrated in mammals, where asip1 regulates the
relative proportions of eumelanin (black-brown pigment) and
phaeomelanin (yellow-red pigment) by antagonizing the action of
a-MSH on its receptor MC1R [45]; additionally, asip1 negatively
regulates the expression of mc1r [46] and slc24a5 [43]. Fish only
produce eumelanin, and mc1r expression was up-regulated in
pseudo-albinos, therefore the regulation of melanogenesis is likely
blocked at some step downstream from mc1r. We propose that
melanin synthesis is inhibited in newly differentiated melano-
phores by negatively regulating the expression of slc24a5, which is
necessary for melanogenesis. Although low, trp1 expression still
existed in these specimens, likely reflecting melanogenesis within
the few melanophores remaining in the skin. The primary function
of mc1r in fish is to mediate distribution of melanin granules in
melanophores, allowing the organism to adapt to the background
[47]. The expression of this gene was up-regulated in pseudo-
albinos, though the ability to disperse melanin within melano-
phores was reduced.
Gene expression data suggest that ARA changed the pigment
pattern that should have been established in the ocular side of the
fish at metamorphosis through its effects on asip1, pax3 and/or mitf;
thereafter, the excessive expression levels of these genes could alter
their normal action on chromatoblast differentiation leading to an
inhibition of terminal differentiation of new post-metamorphic
melanophores, xanthophores and iridophores. Abnormal spatial
distribution between xanthophores and melanophores was ob-
served in pseudo-albinos. An excessive disintegration of xantho-
phores seemed to prevent the normal patterning of melanophores,
suggesting that normal pigmentation at metamorphosis depends
on some type of communication established between these
pigment cells and their proportions. We propose that the
unexpected behavior of these pigment cells in the skin of the
ocular side of the fish is typically taking place in the blind side
during metamorphosis for the development of the asymmetrical
dorsal-ventral pigment patterning characteristic of flatfish. The
molecular mechanisms underlying these processes need to be
further explored. Taking into account the well-known role of asip1
in the establishment of the dorsal-ventral pigment patterning in
this and other species [12,14], and the results obtained in this
study, the role of asip1 in xanthophore physiology deserves
investigation. These findings show that the genetically determined
pigmentation in larvae can be modulated by environmental factors
(i.e., nutrition) and thereby affect changes in the normal molecular
signatures occurring during the process of metamorphosis.
We conclude that differentiation of melanophores was promot-
ed in pseudo-albinos through pax3, mitf, mc1r and tyr signaling with
a simultaneous deficiency of terminal differentiation. Asip1 and mitf
seemed to play a key role in the prevention of differentiation of
pigment cell precursors into melanophores and iridophores.
Slc24a5 seems to play a key role in the disruption of melanogenesis
at the end of this process by decreasing trp1 expression. We
propose that the down-regulation of slc24a5 could be induced by
up-regulation of asip1, reaffirming the involvement of this gene in
melanogenesis. The expression level of pax3 appeared to be critical
for the development of the new populations of melanophores,
xanthophores and iridophores at post-metamorphosis. Among
these chromatophores, xanthophores seemed to play a central role
in pigment patterning, where interaction between pigment cells
occurred in a delicate equilibrium. Our results demonstrated that
the relative proportions between xanthophores and melanophores,
cell proximity, size and shape are critical for the correct ontogeny
of pigmentation. Further molecular research on chromatophore
interactions would definitely shed light to the mechanisms
governing cellular communication leading to the establishment
of the pseudo-albino phenotype. Additional insights may also be
gained by separation of blind side from ocular side skin for a more
detailed look at chromatophore development.
Methods
Ethics StatementThis study was carried out in accordance with the recommen-
dations in [48]. Animal experimental procedures were conducted
Figure 6. Size of skin melanophores, xanthophores andiridophores, and melanin dispersion distance in 60 day-oldpigmented (control) and pseudo-albino (ARA) specimens ofSenegalese sole. Values are expressed as mean 6 SD (N= 4).Superscript letters denote significant differences in size betweenchromatophores of a given larval group (One-way ANOVA, P,0.05)and asterisks indicate significant differences in size of chromatophoresand melanin dispersion distance between pigmented and pseudo-albino specimens (Student’s t-test, N = 4, P,0.001).doi:10.1371/journal.pone.0068844.g006
Table 3. Percentage of disintegrating xanthophores inSenegalese sole specimens from the control and ARA groupsduring the post-metamorphosis period (N = 4).
% Disintegrating xanthophores
Age (dph) CONTROL ARA
27 25 25
33 25 100
35 25 50
41 0 57
doi:10.1371/journal.pone.0068844.t003
Ontogenesis of Pseudo-Albinism in Sole Larvae
PLOS ONE | www.plosone.org 10 July 2013 | Volume 8 | Issue 7 | e68844

in compliance with the experimental research protocol (reference
number 4978-T9900002) approved by the Committee of Ethic
and Animal Experimentation of the IRTA and the Departament
de Medi Ambient i Habitatge (DMAH, Generalitat de Catalunya,
Spain) in accordance with EU regulation (EC Directive 86/609/
EEC).
Animal Rearing and Sampling ProceduresTwo-day-old Senegalese sole larvae were obtained from Stolt
Sea Farm SA (Carnota, A Coruna, Spain), acclimated at IRTA-
SCR facilities and reared at 16.760.4uC and 35 of salinity in 8,
60 l cylindrical white bottomed tanks (initial density: 110 larvae
l21) connected to a IRTAmarTM recirculation unit. Water was
daily renewed (50%) with gentle aeration in each tank, pH and
dissolved oxygen being 8.060.2 and 7.561.3 ppm, respectively.
Photoperiod was 16L: 8D, and light intensity was 500 lx at the
water surface. Larvae were fed twice a day, from 2 days post
hatching (dph) to 10 dph, with enriched rotifers (Brachionus
plicatilis), at a density of 10 rotifers ml21 from 2 to 8 dph and of
5 rotifers ml21 from 9 to 10 dph. Enriched Artemia metanauplii
were supplied to larvae from 8 to 60 dph twice a day, at increasing
density from 0.5 to 12 metanauplii ml21 according to the increase
of weight of the larvae and to the daily food ration [49]. From 20
dph onwards, when larvae were settled at the bottom of the tank,
enriched Artemia metanauplii were supplied frozen [18].
In order to induce pseudo-albinism [17], larvae from four tanks
were fed with rotifers and Artemia nauplii enriched with an
experimental emulsion containing high levels of arachidonic acid
Table 4. Accession numbers, amplicon size, primers and hydrolysis probes used in qPCR analyses.
Gene name GenBank accession no. Amplicon size Hydrolysis probes 59 to 39 sequence
Ubq AB291588 86 Forward GCCCAGAAATATAACTGCGACAAG
Reverse TGACAGCACGTGGATGCA
FAM probe ACTTGCGGCATATCAT
Tyr JF693907 73 Forward CGTACGCACAGATGGAAAACG
Reverse CACGTAGTAATGCATCCACACAAAA
FAM probe ACATCGGCGAATATC
Trp1 GU329041 63 Forward CGTGTGCAACAATACAGAAACAAGT
Reverse ATGGGTCGTGCCACGTT
FAM probe CCTGCCGGGTTCCTT
Mitf GU329042 75 Forward CGATGACATCATAAGTCTTGAATCCAGTTT
Reverse CGTGCTGGGCAACTGAAGA
FAM probe CCGGAGTCAATCAACG
cKit HM100237 69 Forward GTGAAGAGAGTGAGATGTTTGACGA
Reverse CACTTTGGTAGGAGAAGCTCAGAA
FAM probe CTCGTCACCGAAGATC
Mc1r GU329043 76 Forward CGCCGTCGCCATCATC
Reverse GCGTTGTCCGTGTGGTAGA
FAM probe ACCTCCAGCATCCTCT
Scl24a5 GU329046 66 Forward GACGCAGCCTCTGATCGA
Reverse CCGTCCTGGAGCGAACC
FAM probe CCAGTCTGCGAAACAT
Casp3 GU329040 77 Forward CGACAGTGTAGATGACCAAACGT
Reverse GGAGCAGTGGAATAAGCATAAAGGA
FAM probe CCTCCACAGGAATCC
Pax3 HM100238 68 Forward GCATCATGCGCTCCAAGTTC
Reverse CCCTCTTCACCATTTCATCATCCT
FAM probe CATCGTCACCAACTCC
Sl U06753 75 Forward TTCCCACTGCGGCTTCA
Reverse GGTAAGGCCTTGGTGATGCA
FAM probe CCGACCGTGTTTCTC
Asip HE598753 81 Forward GCTGTGACATCTGTGCCTTCT
Reverse CCATTCGACAGAAACACACAGTTC
FAM probe CCAGTGTCGCCTCTTC
Hsp70 GU329044 73 Forward TGGAGTCGTATGCTTTCAACATGA
Reverse TGCTTGTCGTCGTCACTGAT
FAM probe CTTGCCAGCCAGTTTC
doi:10.1371/journal.pone.0068844.t004
Ontogenesis of Pseudo-Albinism in Sole Larvae
PLOS ONE | www.plosone.org 11 July 2013 | Volume 8 | Issue 7 | e68844

(ARA). Briefly, the experimental emulsion was prepared from
commercially available oils rich in DHA and ARA obtained
respectively, from liver of Gadus morhua (Fluka�, Sigma-Aldrich,
Chemie GmBH, Steinheim, Norway) and from fungus Mortierella
alpina (VevodarH, DSM Food Specialties, Netherlands). Olive oil
was added to the oil mixture to dilute and adjust n23 PUFA
concentration in enriched live prey and a-tocopherol for
preservation of the emulsion. The oil mixture was emulsified with
soy lecithine and distilled water by homogenizing with an Ultra-
turrax T25 at high speed for 60 s. Larvae from the other four
tanks were fed rotifers and Artemia nauplii enriched with a
commercial enrichment (AGM, Algamac 3050TM, Aquafauna,
Biomarine Inc., USA) and used as a control group to monitor the
normal pigmentation development. The ingredients used in the
formulation ARA emulsion and the fatty acid composition of
AGM (control) and ARA enrichments are shown in Table 5.
Rotifers were enriched in 20 l containers at 500 rotifers ml21 at
26uC with 0.6 g l21 of each emulsion. Half of the rotifers were
supplied to the larvae after 2 h of enrichment and the other half
after 6 h of enrichment. One-day-old Artemia nauplii (EG strain,
INVE) were enriched in 20 l containers at 300 nauplii ml21 for
16h at 28uC with 0.6 g l21 of each emulsion. Enriched Artemia
were kept at 4uC in UV-treated, filtered seawater with aeration
until administered to larvae twice a day. In order to reduce the
bacterial load after enrichment and remove emulsion residues,
rotifers and Artemia were washed with UV-treated filtered seawater
and treated with H2O2 (40 ppm for 15 min for rotifers and
8000 ppm for 5 min for Artemia, according to [50]) and then rinsed
with filtered seawater. The biochemical analysis of lipids and fatty
acid (FA) composition [51] of enriched rotifer and Artemia, as well
as in Senegalese sole larvae at 2, 15 and 50 dph are shown in
Table 5.
For gene expression analyses, 200 mg wet weight pigmented
juveniles and pseudo-albinos were sampled at 60 dph, sacrificed
with an overdose of anesthetic (Tricaine methanesulfonate, MS-
222, Sigma), rinsed in distilled water and preserved in RNAlater�(Ambion) at 280uC for further analyses.
MetamorphosisEye migration was used as a measure of the progress of the
metamorphosis process and consisted of evaluating the eye
migration index (IEM) in 30 individuals per tank at 15, 30 and
50 dph according to [17]. Data were presented as the relative
amount of larvae in each stage of development at the same age.
The eye migration index (IEM=S (%fish in each stage*stage)/100)
was calculated according to [52].
PhotographyLarvae (at 22, 27, 33, 35 and 41 dph) and juveniles (at 60 dph)
were photographed using a stereomicroscope (Nikon SMZ800,
Soft Imaging Systems, GmbH) equipped with a Color View-XS
camera. Skins of juveniles were photographed using a DP70
(Olympus) camera attached to DMLB (Leica) microscope. Images
were taken under transmitted or incident light and compiled and
processed using AnalysisH3.1 (Soft Imaging Systems, GmbH,
Germany). The amount of melanophores, xanthophores and
iridophores in post-metamorphosed larvae was quantified in the
ocular side of the trunk skin, excluding the abdominal area, using
Figure 7. Fold change relative gene expression of pigmentation-related genes in 60 day-old pseudo-albino (ARA) specimens ofSenegalese sole compared to pigmented specimens. Melanocyte-stimulating hormone 1 receptor (mc1r), agouti signaling protein (asip1),paired box protein 3 (pax3), microphtalmia-associated transcription factor (mitf), tyrosinase (tyr), tyrosinase-related protein 1 (trp1), mast/stem cellgrowth factor receptor Kit (cKit), sodium/potassium/calcium exchanger 5 (slc24a5), enzyme caspase 3 (casp3), heat shock 70 kDa protein (hsp70) andsomatolactin (sl). Student’s t-test, N = 4, P-values shown in figure.doi:10.1371/journal.pone.0068844.g007
Ontogenesis of Pseudo-Albinism in Sole Larvae
PLOS ONE | www.plosone.org 12 July 2013 | Volume 8 | Issue 7 | e68844

Ontogenesis of Pseudo-Albinism in Sole Larvae
PLOS ONE | www.plosone.org 13 July 2013 | Volume 8 | Issue 7 | e68844
ImageJ64 software. Results were represented as the relative
proportion, expressed in percentage, of each chromatophore in
the analyzed skin area. The same software was used to measure, in
mm, the size of chromatophores and the extension of dispersed
melanin within melanophores in post-metamorphosed larvae.
Partial cDNA Sequences IsolationSeveral genes involved in the process of pigmentation were
selected as markers for melanophore differentiation and melanin
synthesis in Senegalese sole (Table 4). Very few Senegalese sole-
specific gene sequences were available from public data bases,
therefore multiple sequence homologs for the chosen target genes
from extant species were downloaded from GenBank to construct
alignments for use in designing primers homologous to conserved
regions. Sequences were aligned using the CLUSTAL algorithm
embedded in BioEdit ver 7.0.5.2 (T. Hall 1997–2005). Amplifi-
cation was performed using a gradient thermal cycler (Eppendorf
Mastercycler) to optimize specific amplification of target regions.
The amplification products were separated and isolated by agarose
gel electrophoresis for sequencing in direct sequencing reactions
Figure 8. Schematic picture showing the known action of the analyzed genes in melanocyte differentiation and melanogenesis invertebrate melanocytes (A) and the suggested pathways of melanophore differentiation and melanogenesis that were altered inpseudo-albinos of Senegalese sole (B). The explanation of the figure is given in the main text.doi:10.1371/journal.pone.0068844.g008
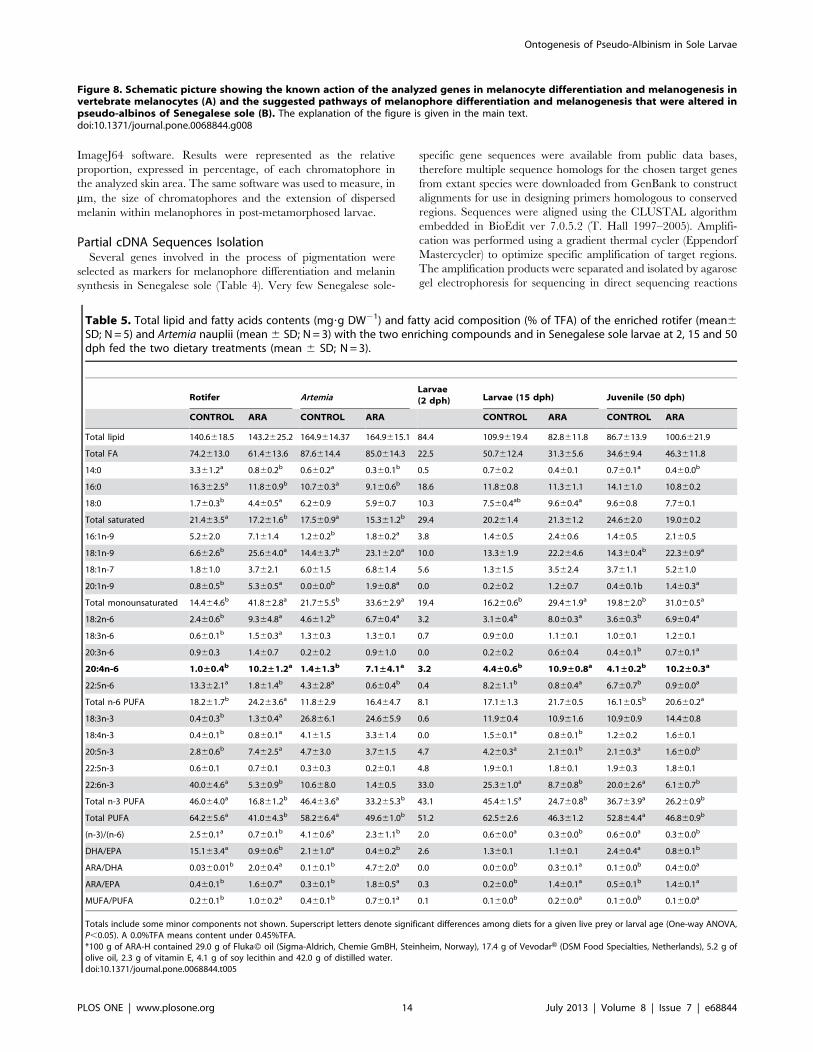
Table 5. Total lipid and fatty acids contents (mg?g DW21) and fatty acid composition (% of TFA) of the enriched rotifer (mean6SD; N= 5) and Artemia nauplii (mean 6 SD; N= 3) with the two enriching compounds and in Senegalese sole larvae at 2, 15 and 50dph fed the two dietary treatments (mean 6 SD; N= 3).
Rotifer ArtemiaLarvae(2 dph) Larvae (15 dph) Juvenile (50 dph)
CONTROL ARA CONTROL ARA CONTROL ARA CONTROL ARA
Total lipid 140.6618.5 143.2625.2 164.9614.37 164.9615.1 84.4 109.9619.4 82.8611.8 86.7613.9 100.6621.9
Total FA 74.2613.0 61.4613.6 87.6614.4 85.0614.3 22.5 50.7612.4 31.365.6 34.669.4 46.3611.8
14:0 3.361.2a 0.860.2b 0.660.2a 0.360.1b 0.5 0.760.2 0.460.1 0.760.1a 0.460.0b
16:0 16.362.5a 11.860.9b 10.760.3a 9.160.6b 18.6 11.860.8 11.361.1 14.161.0 10.860.2
18:0 1.760.3b 4.460.5a 6.260.9 5.960.7 10.3 7.560.4ab 9.660.4a 9.660.8 7.760.1
Total saturated 21.463.5a 17.261.6b 17.560.9a 15.361.2b 29.4 20.261.4 21.361.2 24.662.0 19.060.2
16:1n-9 5.262.0 7.161.4 1.260.2b 1.860.2a 3.8 1.460.5 2.460.6 1.460.5 2.160.5
18:1n-9 6.662.6b 25.664.0a 14.463.7b 23.162.0a 10.0 13.361.9 22.264.6 14.360.4b 22.360.9a
18:1n-7 1.861.0 3.762.1 6.061.5 6.861.4 5.6 1.361.5 3.562.4 3.761.1 5.261.0
20:1n-9 0.860.5b 5.360.5a 0.060.0b 1.960.8a 0.0 0.260.2 1.260.7 0.460.1b 1.460.3a
Total monounsaturated 14.464.6b 41.862.8a 21.765.5b 33.662.9a 19.4 16.260.6b 29.461.9a 19.862.0b 31.060.5a
18:2n-6 2.460.6b 9.364.8a 4.661.2b 6.760.4a 3.2 3.160.4b 8.060.3a 3.660.3b 6.960.4a
18:3n-6 0.660.1b 1.560.3a 1.360.3 1.360.1 0.7 0.960.0 1.160.1 1.060.1 1.260.1
20:3n-6 0.960.3 1.460.7 0.260.2 0.961.0 0.0 0.260.2 0.660.4 0.460.1b 0.760.1a
20:4n-6 1.0±0.4b 10.2±1.2a 1.4±1.3b 7.1±4.1a 3.2 4.4±0.6b 10.9±0.8a 4.1±0.2b 10.2±0.3a
22:5n-6 13.362.1a 1.861.4b 4.362.8a 0.660.4b 0.4 8.261.1b 0.860.4a 6.760.7b 0.960.0a
Total n-6 PUFA 18.261.7b 24.263.6a 11.862.9 16.464.7 8.1 17.161.3 21.760.5 16.160.5b 20.660.2a
18:3n-3 0.460.3b 1.360.4a 26.866.1 24.665.9 0.6 11.960.4 10.961.6 10.960.9 14.460.8
18:4n-3 0.460.1b 0.860.1a 4.161.5 3.361.4 0.0 1.560.1a 0.860.1b 1.260.2 1.660.1
20:5n-3 2.860.6b 7.462.5a 4.763.0 3.761.5 4.7 4.260.3a 2.160.1b 2.160.3a 1.660.0b
22:5n-3 0.660.1 0.760.1 0.360.3 0.260.1 4.8 1.960.1 1.860.1 1.960.3 1.860.1
22:6n-3 40.064.6a 5.360.9b 10.668.0 1.460.5 33.0 25.361.0a 8.760.8b 20.062.6a 6.160.7b
Total n-3 PUFA 46.064.0a 16.861.2b 46.463.6a 33.265.3b 43.1 45.461.5a 24.760.8b 36.763.9a 26.260.9b
Total PUFA 64.265.6a 41.064.3b 58.266.4a 49.661.0b 51.2 62.562.6 46.361.2 52.864.4a 46.860.9b
(n-3)/(n-6) 2.560.1a 0.760.1b 4.160.6a 2.361.1b 2.0 0.660.0a 0.360.0b 0.660.0a 0.360.0b
DHA/EPA 15.163.4a 0.960.6b 2.161.0a 0.460.2b 2.6 1.360.1 1.160.1 2.460.4a 0.860.1b
ARA/DHA 0.0360.01b 2.060.4a 0.160.1b 4.762.0a 0.0 0.060.0b 0.360.1a 0.160.0b 0.460.0a
ARA/EPA 0.460.1b 1.660.7a 0.360.1b 1.860.5a 0.3 0.260.0b 1.460.1a 0.560.1b 1.460.1a
MUFA/PUFA 0.260.1b 1.060.2a 0.460.1b 0.760.1a 0.1 0.160.0b 0.260.0a 0.160.0b 0.160.0a
Totals include some minor components not shown. Superscript letters denote significant differences among diets for a given live prey or larval age (One-way ANOVA,P,0.05). A 0.0%TFA means content under 0.45%TFA.*100 g of ARA-H contained 29.0 g of Fluka� oil (Sigma-Aldrich, Chemie GmBH, Steinheim, Norway), 17.4 g of VevodarH (DSM Food Specialties, Netherlands), 5.2 g ofolive oil, 2.3 g of vitamin E, 4.1 g of soy lecithin and 42.0 g of distilled water.doi:10.1371/journal.pone.0068844.t005
Ontogenesis of Pseudo-Albinism in Sole Larvae
PLOS ONE | www.plosone.org 14 July 2013 | Volume 8 | Issue 7 | e68844

using both forward and reverse primers from the original
amplification. The sequences obtained from amplification prod-
ucts were analyzed using BLAST to verify similitude to the
intended target sequence. Genes used for expression studies in this
work and their GenBank accession numbers are given (Table 4).
Real Time PCR AssaysGene expression in pigmented and pseudo-albino specimens
was analyzed using the skin of 60 day-old juveniles (54612.6 mg
wet weight). Total RNA of a pool (5 individuals) of pigmented and
a pool (5 individuals) of pseudo-albino specimens per each tank
was extracted in separate using TRIzolTM (InvitrogenH, San
Diego, CA, USA). The quantity of RNA isolated was determined
using a Gene-Quant spectrophotometer (Amersham Biosciences).
The quality of the RNA was examined using 1.2% agarose gel
electrophoresis. Total RNA (1 mg) from each sample were reverse-
transcribed using QuantiTect Reverse Transcription Kit (Qia-
genH, GmbH, Germany). Genomic DNA was removed using
genomic DNA wipe-out buffer included in the QuantiTect
Reverse Transcription Kit. Selected samples were also run as
non-RT negative controls to confirm the efficacy of the DNAse
treatment. Real-time PCR analysis was performed using an ABI
PRISM 7300 (Applied Biosystems). For each gene, a species-
specific Taqman assay was designed (Applied Biosystems)
(Table 4). Amplification reactions were performed in triplicate in
a total volume of 20 ml containing 1 ml of cDNA, 1 ml of Taqman
probe, 10 ml of Taqman mix and 8 ml of sterile water. The gene
ubq (ubiquitin) was chosen as a reference gene since it did not
exhibit any significant variation in expression among the samples
[53]. The amplification conditions were 10 min at 95uC and 40
cycles of 15 s at 95uC and 1 min at 60uC.Real-time PCR efficiencies were determined for each gene from
the slopes obtained with Applied Biosystems software, applying the
equation E= 10[21/slope], where E is PCR efficiency. To
determine the relative quantity of target gene-specific transcripts
present in the different samples, expression ratios (R) were
calculated according to the following formula: R= (Etarget gene)DCT target gene (mean sample - mean ref sample)/(Eubq)
DCT ubq (mean sample -
mean ref sample), where ubq is the reference gene and mean sample
corresponds to quadruplicate average. Pigmented individuals were
chosen as ref samples.
StatisticsData are presented as mean 6 SD (N=4). Statistical analyses
were conducted using SigmaStat 3.0 (Systat Software Inc.,
Richmond, USA). All data were checked for normality (Kolmo-
gorov-Smirnov test) and homogeneity of variance (Bartlett’s test).
A two-way ANOVA was performed to analyze the amount of
chromatophores during development in both groups and a one-
way ANOVA to analyze the amount of chromatophores of each
group at each developmental date. When significant differences
were found (P,0.05), the post-hoc Holm-Sidak method was used
to perform all pairwise multiple comparisons. For the rest of the
analyses, statistical significance was calculated using Student’s t-
test (P,0.05).
Acknowledgments
Authors thank Solt Sea Farm for their generosity in supplying fish and S.
Molas and M. Matasfor their excellent technical assistance with live prey
rearing.
Author Contributions
Conceived and designed the experiments: MD AE EG. Performed the
experiments: MD KA AB JMC-R JR. Analyzed the data: MD KA AB.
Contributed reagents/materials/analysis tools: AE EG. Wrote the paper:
MD.
References
1. Montoliu L, Oetting WS, Bennett DC (2011) Color Genes. European Society for
Pigment Cell Research. Available: http://www.espcr.org/micemut Accessed
2013 Jun 10.
2. Hofreiter M, Schoneberg T (2010) The genetic and evolutionary basis of colour
variation in vertebrates. Cell Mol Life Sci 67: 2591–603.
3. Fujii R (2000) The Regulation of Motile Activity in Fish Chromatophores.
Pigment Cell Res 13: 300–319.
4. Lister JA (2002) Development of pigment cells in the zebrafish embryo. Micros
Res Tech 58: 435–441.
5. Mellgrem EM, Johnson SL (2002) The evolution of morphological complexity in
zebrafish stripes. Trends Genet 18: 128–134.
6. Patton EE, Mitchell DL, Nairn RS (2010) Genetic and environmental
melanoma models in fish. Pigment Cell Melanoma Res 23: 314–337.
7. Kelsh RN, Brand M, Jiang YJ, Heisenberg CP, Lin S et al. (1996) Zebrafish
pigmentation mutations and the processes of neural crest development.
Development 123: 369–389.
8. Parichy DM, Johnson SL (2001) Zebrafish hybrids suggest genetic mechanisms
for pigment pattern diversification in Danio. Dev Genes Evol 211: 319–328.
9. Fukamachi S, Sugimoto M, Mitani H, Shima A (2004) Somatolactin selectively
regulates proliferation and morphogenesis of neural-crest derived pigment cells
in medaka. Proc Natl Acad Sci U S A 101: 10661–10666.
10. Klovins J, Haitina T, Fridmanis D, Kilianova Z, Kapa I et al. (2004) The
melanocortin system in Fugu: determination of POMC/AGRP/MCR gene
repertoire and synteny, as well as pharmacology and anatomical distribution of
the MCRs. Mol Biol Evol 21: 563–579.
11. Cerda-Reverter JM, Ringholm A, Schioth HB, Peter RE (2003) Molecular
cloning, pharmacological characterization and brain mapping of the melano-
cortin 4 receptor in the goldfish: involvement in the control of food intake.
Endocrinology 144: 2336–2349.
12. Cerda-Reverter JM, Haitina T, Schioth HB, Peter RE (2005) Gene structure of
the goldfish agouti-signaling protein: a putative role in the dorsal-ventral
pigment pattern of fish. Endocrinol 146: 1597–610.
13. Yamada T, Okauchi M, Araki K (2010) Origin of adult-type pigment cells
forming the asymmetric pigment pattern, in Japanese flounder (Paralichthys
olivaceus). Dev Dyn 239: 3147–62.
14. Guillot R, Ceinos RM, Cal R, Rotllant J, Cerda-Reverter JM (2012) Transient
ectopic overexpression of agouti-signalling protein 1 (asip1) induces pigment
anomalies in flatfish. PLoS ONE 7(12): e48526.
15. Darias MJ, Andree KB, Boglino A, Fernandez I, Estevez A et al. (2013)
Coordinated regulation of chromatophore differentiation and melanogenesis 1
during the ontogeny of skin pigmentation of Solea senegalensis (Kaup, 1858). PLoS
ONE 8(5): e63005.
16. Seikai T, Matsumoto J (1994) Mechanism of pseudoalbinism in flatfish: an
association between pigment cell and skin differentiation. J World Aquac Soc 25:
78–85.
17. Villalta M, Estevez A, Bransden MP (2005) Arachidonic acid enriched live prey
induces albinism in Senegal sole (Solea senegalensis) larvae. Aquaculture 245: 193–
209.
18. Villalta M, Estevez A, Bransden MP, Bell JG (2008) Arachidonic acid,
arachidonic/eicosapentaenoic acid ratio, stearidonic acid and eicosanoids are
involved in dietary-induced albinism in Senegal sole (Solea senegalensis). Aquac
Nutr 14: 120–128.
19. Lund I, Steenfeldt SJ, Hansen BW (2010) Influence of dietary arachidonic acid
combined with light intensity and tank color on pigmentation of common sole
(Solea solea L.) larvae. Aquaculture 308: 159–165.
20. Kelsh RN (2004) Genetics and evolution of pigment patterns in fish. Pigment
Cell Res. 17: 326–36.
21. Fernandez-Dıaz C, Yufera M, Canavate JP, Moyano FJ, Alarcon FJ et al. (2001)
Growth and physiological changes during metamorphosis of Senegal sole reared
in the laboratory. J Fish Biol 58: 1086–1097.
22. Parichy DM, Turner JM (2003) Temporal and cellular requirements for Fms
signaling during zebrafish adult pigment pattern development. Development
130: 817–833.
23. Nakamasu A, Takahashi G, Kanbe A, Kondo S (2009) Interactions between
zebrafish pigment cells responsible for the generation of Turing patterns. Proc
Natl Acad Sci U S A 106: 8429–34.
24. Fukamachi S, Yada T, Meyer A, Kinoshita M (2009) Effects of constitutive
expression of somatolactin alpha on skin pigmentation in medaka. Gene 442:
81–7.
Ontogenesis of Pseudo-Albinism in Sole Larvae
PLOS ONE | www.plosone.org 15 July 2013 | Volume 8 | Issue 7 | e68844

25. Lister JA, Robertson CP, Lepage T, Johnson SL, Raible DW (1999) Nacre
encodes a zebrafish microphthalmia-related protein that regulates neural-crest-
derived pigment cell fate. Development 126: 3757–67.
26. Minchin JE, Hughes SM (2008) Sequential actions of Pax3 and Pax7 drive
xanthophore development in zebrafish neural crest. Dev Biol 317: 508–522.
27. Kubic JD, Young KP, Plummer RS, Ludvik AE, Lang D (2008) Pigmentation
PAX-ways, the role of Pax3 in melanogenesis, melanocyte stem cell
maintenance, and disease. Pig Cell Mel Res 21: 627–45.
28. Galibert MD, Yavuzer U, Dexter TJ, Goding CR (1999) Pax3 and regulation of
the melanocyte-specific tyrosinase-related protein-1 promoter. J Biol Chem 274:
26894–26900.
29. Bondurand N, Pingault V, Goerich DE, Lemort N, Sock E et al. (2000)
Interaction among SOX10, PAX3 and MITF, three genes altered in Waarden-
burg sındrome. Hum Mol Genet 9: 1907–1917.
30. Guo XL, Ruan HB, Li Y, Gao X, Li W (2010) Identification of a novel nonsense
mutation on the Pax3 gene in ENU-derived white belly spotting mice and its
genetic interaction with c-Kit. Pig Cell Mel Res 23: 252–62.
31. Hathaway JD, Haque A (2011) Insights into the Role of PAX-3 in the
Development of Melanocytes and Melanoma. Open Cancer J 4: 1–6.
32. Alexeev V, Yoon K (2006) Distinctive role of the cKit receptor tyrosine kinase
signaling in mammalian melanocytes. J Invest Dermatol 126: 1102–10.
33. Curran K, Lister JA, Kunkel GR, Prendergast A, Parichy DM et al. (2010)
Interplay between Foxd3 and Mitf regulates cell fate plasticity in the zebrafish
neural crest. Dev Biol 344: 107–18.
34. Levy C, Fisher DE (2011) Dual roles of lineage restricted transcription factors:
The case of MITF in melanocytes. Transcription 2: 19–22.
35. Aoki H, Moro O (2002) Involvement of microphthalmiaassociated transcription
factor (MITF) in expression of human melanocortin-1 receptor (MC1R). Life Sci
71: 2171–2179.
36. Chen AS, Marsh DJ, Trumbauer ME, Frazier EG, Guan XM (2000)
Inactivation of the mouse melanocortin-3 receptor results in increased fat mass
and reduced lean body mass. Nat Genet 26: 97–102.
37. Luo D, Chen H, Searles G, Jimbow K (1995) Coordinated mRNA expression of
c-Kit with tyrosinase and TRP-1 in melanin pigmentation of normal and
malignant human melanocytes and transient activation of tyrosinase by Kit/
SCF-R. Melanoma Res 5: 303–9.
38. Steingrimsson E, Copeland NG, Jenkins NA (2004) Melanocytes and the
microphthalmia transcription factor network. Annu Rev Genet 38: 365–411.
39. Ginger RS, Askew SE, Ogborne RM, Wilson S, Ferdinando D et al. (2008)
SLC24A5 encodes a trans-Golgi network protein with potassium-dependent
sodium-calcium exchange activity that regulates human epidermal melanogen-
esis. J Biol Chem 283: 5486–95.
40. Lamason RL, Mohideen MA, Mest JR, Wong AC, Norton HL, et al. (2005)
SLC24A5, a putative cation exchanger, affects pigmentation in zebrafish andhumans. Science 310: 1782–6.
41. Vogel P, Read RW, Vance RB, Platt KA, Troughton K et al. (2008) Ocular
albinism and hypopigmentation defects in Slc24a52/2 mice. Vet Pathol 45:264–79.
42. Schallreuter KU, Kothari S, Chavan B, Spencer JD (2008) Regulation ofmelanogenesis–controversies and new concepts. Exp Dermatol 17: 395–404.
43. Nadeau NJ, Minvielle, Ito S, Inoue-Murayama M, Gourichon D et al. (2008)
Characterization of Japanese quail yellow as a genomic deletion upstream of theavian homolog of the mammalian ASIP (agouti) gene. Genetics 178: 777–86.
44. Sviderskaya EV, Hill SP, Balachandar D, Barsh GS, Bennett DC (2001) Agoutisignaling protein and other factors modulating differentiation and proliferation
of immortal melanoblasts. Dev Dyn 221: 373–9.45. Hunt G, Kyne S, Wakamatsu K, Ito S, Thody AJ (1995) Nle4DPhe7/-
melanocyte stimulating hormone increases the eumelanin: Pheomelanin ratio in
cultured human melanocytes. J Invest Dermatol 104: 83–85.46. Uong A, Zon LI (2010) Melanocytes in development and cancer. Cell Physiol.
222: 38–41.47. Logan DW, Bryson-Richardson RJ, Pagan KE, Taylor MS, Currie PD et al.
(2003) The structure and evolution of the melanocortin and MCH receptors in
fish and mammals. Genomics 81: 184–191.48. Kilkenny C, Browne WJ, Cuthill IC, Emerson M, Altman DG (2010) Improving
Bioscience Research Reporting: The ARRIVE Guidelines for Reporting AnimalResearch. PLoS Biol 8(6): e1000412.
49. Canavate JP, Zerolo R, Fernandez-Dıaz C (2006) Feeding and development ofSenegal sole (Solea senegalensis) larvae reared in different photoperiods.
Aquaculture 258: 368–377.
50. Gimenez G, Padro F, Roque A, Estevez A, Furones D (2006) Bacterial loadreduction of live prey for fish larval feeding using Ox-Aquaculture. Aquac Res
37: 1130–1139.51. Boglino A, Darias MJ, Ortiz-Delgado JB, Ozcan F, Estevez A et al. (2012)
Commercial products for Artemia enrichment affect growth performance,
digestive system maturation, ossification and incidence of skeletal deformities inSenegalese sole (Solea senegalensis) larvae. Aquaculture 324–325: 290–302.
52. Solbakken JS, Norberg B, Watanabe K, Pittman K (1999) Thyroxine as amediator of metamorphosis of Atlantic halibut, Hippoglossus hippoglossus. Environ
Biol Fish 56: 53–65.53. Manchado M, Infante C, Asensio E, Canavate JP, Douglas SE (2007)
Comparative sequence analysis of the complete set of 40S ribosomal proteins
in the Senegalese sole (Solea senegalensis Kaup) and Atlantic halibut (Hippoglossushippoglossus L.) (Teleostei: Pleuronectiformes): phylogeny and tissue-and devel-
opment-specific expression. BMC Evol Biol 7: 107.
Ontogenesis of Pseudo-Albinism in Sole Larvae
PLOS ONE | www.plosone.org 16 July 2013 | Volume 8 | Issue 7 | e68844