morin marra supplement r3 - media.nature.com · cell suspensions. constitutional dna was obtained...
TRANSCRIPT

Methods
Sample acquisition
Lymphoma samples were classified by an expert haematopathologist (R.D.G)
according to the World Health Organization criteria of 2008. Benign specimens
included reactive pediatric tonsils or purified CD77-positive centroblasts sorted
from reactive tonsils using Miltenyi magnetic beads (Miltenyi Biotec, CA). The
tumour specimens were collected as part of a research project approved by the
University of British Columbia-British Columbia Cancer Agency Research Ethics
Board (BCCA REB) and are in accordance with the Declaration of Helsinki.
Informed consent was obtained from all individuals whose samples were profiled
using RNA-seq or genome/exome sequencing. Our protocols stipulate that these
data will not be released into the public domain but can be made available via a
tiered-access mechanism to named investigators of institutions agreeing by a
materials transfer agreement that they will honour the same ethical and privacy
principles required by the BCCA REB.
For all DLBCL samples profiled by RNA-seq, genome or exome sequencing in
this study, tumour content was greater than 50% as assessed by: a)
immunophenotyping using flow cytometry to detect the level of coexpression of
CD19 and light chain restriction; or b) a pathologist review of an H&E-stained
frozen section taken adjacent to the tissue that was cut and used for nucleic acid
extraction. All other specimens used in this study were obtained at the time of
diagnosis and were derived from archived fresh-frozen tissue or frozen tumour
SUPPLEMENTARY INFORMATIONdoi:10.1038/nature10351
WWW.NATURE.COM/NATURE | 1
cell suspensions. Constitutional DNA was obtained from peripheral blood or from
B cell-negative sorted tumour cell suspensions (fraction eluted from cells
captured by B Cell Isolation Kit II or CD19 MicroBeads (Miltenyi Biotec, CA)).
Cell lines
DB51, DOHH-252, Karpas42253, NU-DHL-154, NU-DUL-155, SU-DHL-6 and WSU-
DLCL256 are cell lines obtained from DSMZ. Pfeiffer and Toledo were obtained
from ATCC and all OCI-Ly57 lines (1, 3, 7, 10 and 19) were obtained from Louis
Staudt (US National Institutes of Health). The cell lines MD903, SU-DHL-9 and
RIVA were obtained from Martin Dyer (University of Leicester, UK).
Preparation and sequencing of RNA-seq, genome and exon capture
Illumina libraries
Genomic DNA for construction of genome and exome libraries was prepared
from biopsy materials using the Qiagen AllPrep DNA/RNA Mini Kit (Qiagen).
DNA quality was assessed by spectrophotometry (260 nm/280 nm and 260
nm/230 nm absorption ratios) and gel electrophoresis before library construction.
DNA was sheared for 10 minutes using a Sonic Dismembrator 550 with a power
setting of “7” in pulses of 30 seconds interspersed with 30 seconds of cooling
(Cup Horn, Fisher Scientific) and then analysed on 8% PAGE gels. The 200 to
300bp DNA size fraction was excised and eluted from the gel slice overnight at 4
°C in 300 μL of elution buffer (5:1 (vol/vol) LoTE buffer (3 mM Tris-HCl, pH 7.5,
SUPPLEMENTARY INFORMATIONRESEARCHdoi:10.1038/nature10351
WWW.NATURE.COM/NATURE | 2

0.2 mM EDTA)/7.5 M ammonium acetate) and was purified using a Spin-X Filter
Tube (Fisher Scientific) and ethanol precipitation. Genome libraries were
prepared using a modified paired-end protocol supplied by Illumina Inc. This
involved DNA end-repair and formation of 3′ adenosine overhangs using the
Klenow fragment of DNA polymerase I (3′–5′ exonuclease minus) and ligation to
Illumina PE adapters (with 5′ overhangs). Adapter-ligated products were purified
on QIAquick spin columns (Qiagen) and PCR-amplified using Phusion DNA
polymerase (NEB) and ten cycles with the PE primer 1.0 and 2.0 (Illumina). PCR
products of the desired size range were purified from adapter ligation artifacts
using 8% PAGE gels. DNA quality was assessed and quantified using an Agilent
DNA 1000 series II assay (Agilent) and Nanodrop 7500 spectrophotometer
(Nanodrop), and DNA was subsequently diluted to 10 nM. The final concentration
was confirmed using a Quant-iT dsDNA HS assay kit and Qubit fluorometer
(Invitrogen).
For genomic DNA sequencing, clusters were generated on the Illumina cluster
stations using v1 cluster reagents. Paired-end reads were generated using v3
sequencing reagents on the Illumina GAiix platform following the manufacturer's
instructions. Image analysis, base-calling and error calibration were performed
using v1.0 of Illumina's Genome analysis pipeline. The DLBCL genomes were
sequenced with 100 nucleotide paired-end reads using the HiSeq2000 platform.
For RNA-seq analysis, we used a modified method similar to the protocol we
have previously described13. Briefly, RNA was extracted from 15 x 20 µm
sections cut from fresh-frozen lymph node biopsies using the MACS mRNA
SUPPLEMENTARY INFORMATIONRESEARCHdoi:10.1038/nature10351
WWW.NATURE.COM/NATURE | 3

isolation kit (Miltenyi Biotec), from 5–10 μg of DNase I–treated total RNA as per
the manufacturer's instructions. Double-stranded cDNA was synthesized from the
purified poly(A)+ RNA using the Superscript Double-Stranded cDNA Synthesis kit
(Invitrogen) and random hexamer primers (Invitrogen) at a concentration of 5 μM.
The cDNA was fragmented by sonication and a paired-end sequencing library
prepared following the Illumina paired-end library preparation protocol (Illumina).
For exome sequencing, genomic DNA was extracted following the protocol
supplied in the Qiagen AllPrep DNA/RNA Mini Kit (Cat#80204), and quantified
using a Quant-iT dsDNA HS assay kit and a Qubit fluorometer (Invitrogen).
Approximately 500ng DNA was sheared for 75 seconds at duty cycle “20%” and
intensity of “5” using a Covaris E210, and run on an 8% PAGE gel. A 200 to
250bp DNA size fraction was excised and eluted from the gel slice, and was
ligated to Illumina paired-end adapters following a standard protocol as
previously described13. The adapter ligated DNA was amplified for 10 cycles
using the PE primer set (Illumina) and purified as a pre-exome capture library.
The DNA was assessed using an Agilent DNA 1000 Series II assay, and 500ng
DNA was hybridized to the 38Mb Human exon probe using the All Exon Kit
(Cat#G3362) following the Agilent SureSelect Paired-End Target Enrichment
System Protocol (Version 1.0, September 2009). The captured DNA was purified
using a Qiagen MinElute column, and amplified for 12 cycles using PE primer
set. The PCR products were run on an 8% PAGE gel, the desired size range
(320 to 370bp) was excised and purified, and was then assessed using an
Agilent DNA 1000 series II assay and diluted to 10nM. The final library DNA
SUPPLEMENTARY INFORMATIONRESEARCHdoi:10.1038/nature10351
WWW.NATURE.COM/NATURE | 4

concentration was confirmed using a Quant-iT dsDNA HS assay kit and Qubit
fluorometer. Clusters were generated on the Illumina cluster station and paired-
end reads generated using an Illumina Genome Analyzer (GAIIx) following the
manufacturer’s instructions.
Alignment-based analysis of tumour DNA and RNA sequence for somatic
point mutations
All reads were aligned to the human reference genome (hg18) or (for RNA-seq)
to a genome file that was augmented with a set of all exon-exon junction
sequences using BWA version 0.5.446. RNA-seq libraries were aligned with an in-
house modified version of BWA that is aware of exon junction reads and
considers them when determining pairing distance in the “sampe” (read pairing)
phase of alignment. Candidate single-nucleotide variants (SNVs) were identified
in the aligned genomic sequence reads and the transcriptome (RNA-seq) reads
using an approach similar to one we previously described13. One key difference
in our variant calling in this study was the application of a Bayesian SNV
identification algorithm ('SNVmix')47. This approach is able to identify SNVs with a
minimum coverage of two high-quality (Q20) bases. SNVs were retained if they
had a SNVmix probability of at least 0.99 and had support from reads mapping to
both genomic strands. Any SNV near gapped alignments or exactly overlapping
sites assessed as being polymorphisms (SNPs) were disregarded, including
variants matching a position in dbSNP or the sequenced personal genomes of
Venter58, Watson59 or the anonymous Asian60 and Yoruban61 individuals. For
SUPPLEMENTARY INFORMATIONRESEARCHdoi:10.1038/nature10351
WWW.NATURE.COM/NATURE | 5

paired samples with matched constitutional DNA sequence, all variants with
evidence (a SNVmix probability of at least 0.99 and 2 or more high quality base
calls matching the SNV) in the constitutional DNA were considered germline
variants and were no longer considered cSNVs. Mutations were annotated on
genes using the Ensembl transcripts (version 54), except in the cases of MEF2B
and MLL2, for which the Ensembl annotations were deemed inferior to the
Refseq. Because we observed situations where exons were represented in
Ensembl transcripts that were not also represented in a Refseq, we only report
candidate mutations in exons shared by both annotations (e.g. in Supplementary
Table S4). Candidate mutations were subsequently reviewed visually in the
integrative genomics viewer (IGV)62 and those appearing to be artefacts or with
some evidence (2 or more reads) visible in the constitutional DNA sequence
were removed.
Validation of candidate somatic mutations using Illumina sequencing
Validation was accomplished by designing primers to amplify a 200 to 300 bp
region around the targeted variant with one primer within reach of a single read
(i.e. maintaining the sum of the primer length and distance to variant less than
100bp, depending on read length used). Amplicons were generated for both
tumour and normal DNA. Two pools of amplicons were generated, one for
tumour and one for normal DNA, with equal volumes from each PCR reaction (or
increased volume for amplicons that resulted in faint bands in an agarose gel)
and an Illumina paired-end sequencing library was constructed from the pool.
SUPPLEMENTARY INFORMATIONRESEARCHdoi:10.1038/nature10351
WWW.NATURE.COM/NATURE | 6
For variants common to more than one patient, a 6nt index, which was added to
the 5’ end of each primer, was assigned for each patient. These index
sequences were trimmed from sequence reads prior to alignment and
subsequently used to associate the data with individual patients. Reads were
aligned using BWA and variants were visually confirmed for validity and somatic
status in IGV63(absence from constitutional DNA). Variants with primer design or
PCR failures were scored as ‘unvalidated’.
Validation of cSNVs by Sanger sequencing
The majority of candidate cSNVs were validated by Sanger sequencing of the
region surrounding each mutation. These included all cSNVs identified in the two
DLBCL exomes and the FL genome/exome (i.e. DLBCL-PatientA, DLBCL-
PatientB and FL-PatientA). For the additional DLBCL genomes, cSNVs were
selected for validation only if there were three or more cSNVs in that gene in the
entire cohort. To do so, primers were designed to amplify 350-1200bp regions
by PCR (most amplicons were ~400bp). All primers used for mutation
confirmation can be found in Supplementary Table S14. Forward and reverse
primers were tailed with T7 and M13Reverse 5’ priming sites, respectively. PCR
conditions used were 94ºC for 2 minutes, 30 cycles of 94ºC for 30 seconds, 60ºC
for 30 seconds and 72ºC for 1 minute, and a final extension at 72ºC for 8
minutes. To determine the somatic or germ line origin of the mutations, mutations
were re-sequenced in both tumour and constitutional DNA, the latter obtained
from peripheral blood or negative-sort cells (see section entitled Sample
SUPPLEMENTARY INFORMATIONRESEARCHdoi:10.1038/nature10351
WWW.NATURE.COM/NATURE | 7
Acquisition). The sequencing reactions consisted of 50 cycles of 96ºC for 10
seconds, 43ºC (for M13Reverse) or 48ºC (T7) for 5 seconds and 60ºC for 4
minutes and were analysed using an AB 3730XL. All capillary traces were
analysed using the Staden Package64 and all somatic variants were visually
inspected to confirm their presence in tumour and absence from germ line traces.
Some regions that failed to amplify in the first attempt were re-addressed with the
addition of 5% DMSO and 5% betaine to the sequencing reactions, but otherwise
maintaining the PCR conditions. SNVs in certain genes, such as BCL7A and
HDAC7, repeatedly failed to amplify and for these, it was not possible to address
whether the mutations in these genes were somatically acquired or were present
in the germ line. Validation was not performed for variants in BCL2 or CD79B as
their somatic mutation status in DLBCL is well established.
Detection of enrichment of functional gene classes within frequently
mutated genes
Significant functional classes represented in the cSNV list were identified using
the DAVID Functional Annotation tool (http://david.abcc.ncifcrf.gov/). Reported P
values were corrected for multiple testing using the Benjamini method.
Detection of mutations with imbalanced/skewed expression
The analysis of imbalanced expression was restricted to (1) confirmed somatic
nonsynonymous point mutations along with (2) previously published hot spot
mutations. In total, there were 381 such mutations in 99 of the 109 genes
SUPPLEMENTARY INFORMATIONRESEARCHdoi:10.1038/nature10351
WWW.NATURE.COM/NATURE | 8

represented in the RNA-seq data. For each mutated gene, the number of
aligned reads supporting the reference and mutant allele was determined. For
genes with multiple mutations in the same patient (e.g. BCL2), the sum of all
reads supporting each of the non-reference alleles in that patient was used
instead (assuming that all mutations were restricted to the same allele).
Significant imbalance/skew was computed using the binomial exact test and P
values were corrected using the Bonferroni method. Genes with corrected P
values less than 0.05 and skew in favour of the mutant allele are reported in
Supplementary Table S7.
Calculation of selective pressure
To determine if mutational patterns were indicative of selective pressure, we
considered both synonymous and non-synonymous cSNVs across our patient
cohort (excluding those found to be present in the germ line or false positives
after validation). Selection can be inferred when the type of mutations in a gene
differs from those expected by chance given a specific mutation profile. To
analyse the significance of this deviation we applied the methods described by
Greenman and colleagues20 to identify genes with signatures of selection. We
performed this analysis on the 101 (of 109 total) genes that had, in addition to 2
or more confirmed somatic mutations, more than 2 cSNVs in total. The coding
sequence of each gene (using the longest Refseq annotation for that gene) was
scanned for all possible silent and non-silent mutations (missense and
truncating) matching six types of sequence changes (C>A, C>G, C>T, T>A, T>C,
SUPPLEMENTARY INFORMATIONRESEARCHdoi:10.1038/nature10351
WWW.NATURE.COM/NATURE | 9

T>G). The separation of mutations into different strata allows the model to
consider the overall effect that cancer specific mutation mechanisms may have
on the mutation profile. A null-selection mutation profile is estimated via the
synonymous mutations, under the assumption that they do not confer an
advantage to the tumour. A score statistic describing the selective pressure was
then calculated by comparing the expected mutations of each type to the
observed ones. Statistical significance was then determined by constructing an
empirical distribution of scores from 100,000 Monte Carlo simulations under the
null hypothesis of no selection. The number of Monte Carlo iterations was
increased to a maximum of 14,600,000 for genes that did not obtain a p-value at
the default 100,000 simulations. Using the models described by Greenman et
al20 we also estimated the type and strength of the selective pressure the genes
were under. This is represented by a quantitative value of less than, equal to, or
larger than 1 for negative, null, or positive selection respectively (Table1,
Supplementary Table S8).
Several genes in our list have previously been identified as targets of somatic
hypermutation (SHM), which is mediated by the enzyme AICDA (also known as
AID) and targets a limited number of genes in DLBCL65,66. In an attempt to avoid
biasing the selective pressure model with the distinct mutational signature
caused by somatic hypermutation, we split the genes into two sets. The
hypermutation set contained genes previously reported to be targets of SHM
(BCL217, BCL6, IRF4, PIM1, and CIITA) and the non-hypermutation set contained
the remaining 95 genes. The effect of the different mutational profiles of both sets
SUPPLEMENTARY INFORMATIONRESEARCHdoi:10.1038/nature10351
WWW.NATURE.COM/NATURE | 10
can be appreciated by considering the BCL2 case. When inserted into the model
with the rest of the genes BCL2 presented the highest selective pressure of all
genes (65.65); however, when the selective pressure model was applied to the
hypermutated genes separately, BCL2 selective pressure was estimated at 3.78.
Identifying genes with mutation hot spots
Hot spots were identified by searching for clustered mutations in the cSNVs
identified by RNA-seq. Owing to the lack of constitutional DNA sequence from
some patient samples, we could not necessarily discern if the variants detected
only by RNA-seq were present in the germ line. We specifically sought cases in
which codons were recurrently mutated. To find hot spots in the RNA-seq data,
we searched for sets of distinct variants producing non-synonymous changes
affecting the same codon in different tumours. The genes that met this criterion
(Supplementary Table S6) included known targets of recurrent mutation (EZH2,
CARD1118 and CD79B9) and three hot spots in MEF2B. Also among these
genes were known targets of aberrant somatic hypermutation in DLBCL,
including BCL2, IRF465, PIM166, BCL667, and BCL7A65.
Analysis of aligned genomic DNA sequence for copy number alterations
and LOH
For the identification of copy number variations (CNVs), sequence quality filtering
was used to remove all reads of low mapping quality (Q ≤ 10). Due to the varying
numbers of sequence reads from each sample, aligned reference reads were
SUPPLEMENTARY INFORMATIONRESEARCHdoi:10.1038/nature10351
WWW.NATURE.COM/NATURE | 11

first used to define genomic bins of equal reference coverage to which depths of
alignments of sequence from each of the tumour samples were compared. This
resulted in a measurement of the relative number of aligned reads from the
tumours and reference in bins of variable length along the genome, where bin
width is inversely proportional to the number of mapped reference reads. After an
estimate of differential GC bias was used to reduce noise, an HMM was used to
classify and segment continuous regions of copy number loss, neutrality, or gain
using methodology outlined previously68.
Loss of heterozygosity was determined for each sample using the lists of
genomic SNPs that were identified through the BWA / SNVMix pipeline. This
analysis allows for classification of each SNP as either heterozygous or
homozygous based on the reported SNP probabilities. For each sample,
genomic bins of consistent SNP coverage were used by an HMM to identify
genomic regions of consistent rates of heterozygosity. The HMM partitioned each
tumour genome into three states: normal heterozygosity, increased
homozygosity (low), and total homozygosity (high). We infer that a region of low
homozygosity either represents a state where only a portion of the cellular
population had lost a copy of a chromosomal region or the signal was
convoluted due to contaminating normal cells in the tumour. Both states of
reduced homozygosity are displayed in blue in Figure 1, generated by Circos69.
Assembly-based analysis of tumour DNA and RNA sequence
SUPPLEMENTARY INFORMATIONRESEARCHdoi:10.1038/nature10351
WWW.NATURE.COM/NATURE | 12
Reads from the individual RNA-seq libraries were assembled using ABySS as
previously described70 using multiple values of k. Iterative pairwise alignments of
the contigs from the individual kmer assemblies resulted in a merged contig set
that was aligned against the reference Human genome (hg18) using BLAT as
described48. Putative fusions were identified from contigs that had alignments to
two distinct genomic locations. The putative events were filtered using evidence
from alignment of reads to contigs using Bowtie and alignments of reads to the
genome using BWA. Those events with at least four read pairs from the reads-to-
genome alignment and two supporting reads from the reads-to-contig alignment
(i.e. across the fusion breakpoint) were manually curated to produce a final list of
putative fusions. The genomic breakpoints for the transcriptome predicted events
were identified manually from the alignments of the reads to the genome using
IGV. The genomic breakpoints were later confirmed by assembly using ABySS
and these results are summarized in Supplementary Table S3.
Putative indels were identified from alignment of the contigs to hg18 using BLAT
when contiguous unmatched base(s) were found in either the contig (insertion) or
reference (deletion) sequences. The events were filtered for read support with
events requiring three or more reads to be considered in the filtered set. The
filtered set was then screened against dbSNP130 to find putative novel events.
The resulting set was manually inspected using read alignments (against both
the genome and contigs) to visually confirm candidates. This approach revealed
the deletion in GNA13 shown in Supplementary Figure S4.
SUPPLEMENTARY INFORMATIONRESEARCHdoi:10.1038/nature10351
WWW.NATURE.COM/NATURE | 13

The splicing alterations in MLL2 (Figure 3B and C) and GNA13 (Supplementary
Figure S4) were identified from pairwise alignments of the contigs to hg18 using
BLAT. The contig alignments were then matched against the four known gene
models to identify novel splice junctions. The putative novel splice junctions were
filtered where two or more reads were required across the novel junction for the
event to be considered. Manual inspection using read alignments (against both
the genome and contigs) was performed to visually confirm candidates.
Cell of origin subtype assignment using RNA-seq expression values
Global gene expression signatures measured with microarrays are the standard
method for classifying DLBCL samples into the two molecular subtypes (GCB
and ABC). We adapted the Bayesian method described by Wright et al50 to allow
classification to be accomplished with the expression values obtained from RNA-
seq data. To accomplish this, expression values for each Ensembl gene model
(version 54) were computed as FPKM (fragments per kilobase gene model per
million, rather than RPKM to account for the use of paired-end reads) and log-
transformed. The current standard approach for routinely classifying samples
using Affymetrix U133 arrays employs 186 probesets (George Wright, personal
communication). The 165 Ensembl genes that correspond to these probesets
were used for classification by RNA-seq. The classifier was trained using the 43
cases previously classified as GCB and 21 classified as ABC using Affymetrix
data. The FPKM values for these genes were compared between the samples
SUPPLEMENTARY INFORMATIONRESEARCHdoi:10.1038/nature10351
WWW.NATURE.COM/NATURE | 14
with known subtypes using the T test and those producing a P value < 0.01 were
used for the classifier. The robustness of this approach was tested using leave-
one-out cross-validation, which resulted in no mis-classifications. Similarly, no
samples were mis-classified when all cases with known COO (based on
Affymetrix data) were used to produce the classifier however there were some
cases that were defined as unclassifiable (U) by one method and given a subtype
assignment by the other method. In such cases, the subtype assignment (rather
than U) was used and the discrepancies are noted in Supplementary Table S2.
Targeted MEF2B resequencing using Biotinylated RNA capture probes
The following strategy was used to sequence the entire MEF2B locus in multiple
patient samples in multiplex. Four exonic regions of the MEF2B gene were
amplified from a template consisting of a pool of DNAs from three bacterial
artificial chromosomes (BACs) containing the MEF2B locus (M. Nefedov , P. J.
de Jong and U Surtiby, unpublished) using PCR (Supplementary Table S14).
PCR reactions consisting of 0.5 Units Phusion DNA Polymerase (New England
Biolabs, Pickering, Ont.), 0.25 mM dNTPs, 3% DMSO, 0.4 µM of the forward and
reverse primer and 5 pmol template were cycled on a MJR Pelletier
Thermocycler (model PTC-225) for 30 seconds at 980C; 25 X {10 seconds at
980C, 30 seconds at 650C, 30 seconds at 720C}; 5 minutes at 720C. The
resulting PCR amplicons, ranging in size from 342 to 474bp, were size selected
on an 8% Novex-TBE gel (Invitrogen Canada Inc., Burlington, Ont.), excised and
eluted into 300 µL of elution buffer containing 5:1 (vol/vol) LoTe (3mM Tris-HCl,
SUPPLEMENTARY INFORMATIONRESEARCHdoi:10.1038/nature10351
WWW.NATURE.COM/NATURE | 15

pH7.5, 0.2nM EDTA)/7.5 M ammonium acetate. The eluates were purified from
gel slurries by centrifugation through Spin-X centrifuge tube filters (Fisher
Scientific Ltd., Nepean, Ont.), and EtOH precipitated. Purified amplicon DNAs
were quantified using an Agilent DNA 1000 Series II assay (Agilent Technologies
Canada Inc., Mississauga, Ont.). Individual amplicons were pooled (equimolar)
and sheared using the Covaris S2 focused ultra-sonicator (Covaris Inc., Woburn,
Mass.) with the following settings; 10% Duty cycle, 5% Intensity, and 200 Cycles
per burst for 180 seconds. The resulting products were size fractioned on an 8%
Novex TBE gel (Invitrogen Canada Inc.) and the 75 to 125 bp fraction isolated,
purified and quantified as above. 30 ng of resulting DNA was end-repaired, 3-
prime modified with Adenosine overhangs, and ligated to custom adapters
(Supplemental Table S14) containing T7 and T3 promoter sequences as
described71. Adapter-ligated products were enriched by PCR as above using T3
and T7 sense strand-specific primers and the following cycling conditions; 1 min.
at 980C; 8X {10 seconds at 980C, 30 seconds at 600C, 30 seconds at 720C}; 5
minutes at 720C. The amplified products were separated from excess adapter on
an 8% Novex TBE gel (Invitrogen Canada Inc.), purified, and quantified using the
Qubit Quant-iTTM assay and Qubit Fluorometer (Invitrogen Canada Inc.). An in
vitro transcription reaction was carried out using 100 ng of purified adapter-
ligated DNA as per the manufacturer’s specifications (AmpliscribeTM T7-FlashTM
Biotin-RNA Transcription Kit; Intersciences Inc., Markham, Ont.). The reaction
mixture was incubated at 37OC for 60 minutes, DNase-I treated for 15 minutes at
37OC, and then incubated at 70 OC for 5 minutes to inactivate DNaseI.
SUPPLEMENTARY INFORMATIONRESEARCHdoi:10.1038/nature10351
WWW.NATURE.COM/NATURE | 16

Transcription products were precipitated with 1 volume of 5M NH4Ac, and size
fractioned on a 10% Novex TBE-Urea gel (Invitrogen Canada Inc.). The 100 to
150 bp fraction was isolated from the gel, eluted into 0.3M NaCl, and EtOH-
precipitated after extraction of the eluate from the gel slurry by centrifugation
through a Spin-X Filter centrifuge tube filter (Fisher Scientific Ltd.). The
biotinylated RNA was resuspended in 20 µl nuclease-free water and quantified
using an Agilent RNA Nano assay (Agilent Technologies Canada Inc.).
Indexed libraries of patient genomic DNA were pooled from 96 well plates in
groups ranging from 36 to 47 libraries per pool72. A 250 to 350bp size fraction
from each pool was size-selected by gel purification from an 8% Novex TBE gel
as above (Invitrogen Canada Inc.). The protocol described by Gnirke and
colleagues73 was followed for the hybridization reaction and subsequent washes,
with an additional oligonucleotide block consisting of standard Illumina PCR
primers PE1 and PE2 included in the hybridization reaction mixture to prevent
cross-hybridization between library fragments (Supplementary Table S14). The
incubation of the library fragments with the RNA probe pool was carried out for
24 hours at 650C, followed by binding to M-280 Streptavidin Dynabeads
(Invitrogen Canada Inc.), washes, and elution of the captured library fragments.
The eluted fragments were amplified by PCR using primers that anneal upstream
of the adapter index sites (Supplemental Table S14) and subjected to cluster
generation and sequencing as described above.
Targeted MLL2 resequencing using long-range PCR and sample indexing.
SUPPLEMENTARY INFORMATIONRESEARCHdoi:10.1038/nature10351
WWW.NATURE.COM/NATURE | 17
Due to the presence of inactivating mutations in different positions within the
MLL2 gene, we sequenced the entire MLL2 locus (chr12:47,699,025-47,735,374;
hg18) in a cohort of 35 FL and 37 DLBCL primary tumours, in 17 DLBCL derived
cell lines and, as a control, in 8 centroblast samples. Genomic DNA from
individual samples was normalized to 5 ng/μl, and 12.5 ng of each sample was
PCR amplified using LA Taq DNA polymerase (TaKaRa). Twelve long amplicons,
of sizes ranging from 6600bp to 7800bp, were obtained under the following PCR
conditions: 94ºC for 5 minutes, 35 cycles of 98ºC for 10 seconds and 68ºC for 8
minutes, and a final extension at 72ºC for 10 minutes. The primer sets used are
displayed in Supplementary Table S14. Amplicons were cleaned using AMPure
beads (Beckman Coulter) and eluted with 20-μL of TE. All 12 amplicons per
sample were normalized and pooled together.
An individual indexed library was constructed from each sample (comprising the
pool of the 12 long amplicons from MLL2). Approximately 500 ng of each pooled
DNA sample was sheared for 10 min using a Sonic Dismembrator 550 with a
power setting of “7” in pulses of 30 seconds interspersed with 30 seconds of
cooling (Cup Horn, Fisher Scientific) and then analysed on 8% PAGE gels. The
200 to 300bp DNA fraction was excised and eluted from the gel slice overnight at
4°C in 300 μL of elution buffer (5:1 (vol/vol) LoTE buffer (3 mM Tris-HCl, pH 7.5,
0.2 mM EDTA)/7.5 M ammonium acetate) and was purified using a Spin-X Filter
Tube (Fisher Scientific) and by ethanol precipitation. Indexed libraries were
prepared using a modified paired-end protocol. This involved DNA end-repair
reactions at room temperature 20–25 °C for 30 minutes (5 U T4 DNA
SUPPLEMENTARY INFORMATIONRESEARCHdoi:10.1038/nature10351
WWW.NATURE.COM/NATURE | 18

polymerase, 1 U Klenow DNA polymerase (exonuclease minus), 100 U T4
polynucleotide kinase and 0.4 mM dNTP mix (Invitrogen). End-repair reactions
were purified using AMPure beads, and dATP was added to the 3′ ends using 5
U Klenow DNA polymerase (exonuclease minus) and 0.2 mM dATP in 1× Klenow
Buffer (Invitrogen) with 30-minute incubation at 37 °C in a Tetrad thermal cycler
(MJ Research). DNA was again purified on AMPure beads using a Biomek FX.
Adapter ligation (10:1 ratio) was completed with 0.03 μM adapter (multiplexing
adapters 1 and 2), 100 ng DNA, 5 U T4 DNA ligase, 0.2 mM ATP and 1× T4 DNA
Ligase Buffer (Invitrogen) for 30 minutes at room temperature. Adapter-ligated
DNA was again purified using AMPure beads on a Biomek FX. A selection of
DNA samples were quantified on a Qubit (Invitrogen). 15-cycle indexing
enrichment PCR was performed using Phusion DNA polymerase and Primers 1.0
and 2.0 (IDT) and 96 custom indexing primers. PCR cycles were: 98°C for 60
seconds, followed by 15 cycles of 98°C for 10 seconds, 65°C for 15 seconds and
72°C for 30 seconds. The PCR products were purified using AMPure beads and
eluted in 40 μL elution buffer EB (Qiagen). Product quality was assessed by
quality-control gels with 1.75% SeaKem LE agarose in 1× TAE (0.2 μL of every
amplicon) and on a 2100 Bioanalyzer (Agilent Technologies).
Indexed libraries were pooled together and sequenced on two lanes of a flowcell
using an Illumina GAII platform. Individual indexes allowed the deconvolution of
reads deriving from individual samples in multiplexed libraries such that many
cases were concurrently sequenced in the same flow cell lane. The reads were
matched to patient samples using the index read and were aligned with BWA to
SUPPLEMENTARY INFORMATIONRESEARCHdoi:10.1038/nature10351
WWW.NATURE.COM/NATURE | 19
the human reference genome (hg18). Point mutations were identified using
SNVMix with stringent post-filtration including a requirement for dual-strand
coverage and requiring at least 10% of the aligned reads at a candidate variant
to be non-reference. Insertions and deletions were identified using the SAMtools
indel calling algorithm with similar filters. Only insertions and deletions supported
by at least 2 reads on each strand were considered valid. The reported average
coverage for each sample was calculated as the average depth of aligned reads
across each of the coding (CDS) positions in the MLL2 locus.
Re-confirmation of MLL2 mutations in patient samples and DLBCL cell
lines
MLL2 mutations found by targeted sequencing of MLL2 in lymphoma samples
were validated by Sanger sequencing of the region surrounding each mutation,
except in 15 cases. To do so, primers were designed to amplify 400-600 bp
regions by PCR. All primers used for mutation confirmation can be found in
Supplementary Table S14. Validating forward and reverse primers carried T7
and M13Reverse 5’ tails, respectively. PCR conditions used were 94ºC for 2
minutes, 30 cycles of 94ºC for 30 seconds, 60ºC for 30 seconds and 72ºC for 1
minute, and a final extension at 72ºC for 8 minutes. To determine the somatic or
germline origin of the mutations, mutations were re-sequenced in both tumour
and constitutional DNA, the latter obtained from peripheral blood or negative sort
cells. The sequencing reactions consisted of 50 cycles of 96ºC for 10 sec, 43ºC
SUPPLEMENTARY INFORMATIONRESEARCHdoi:10.1038/nature10351
WWW.NATURE.COM/NATURE | 20
(for M13Reverse) or 48ºC (T7) for 5 seconds and 60ºC for 4 minutes and were
analysed using an AB 3730XL. Variants were visually inspected to confirm their
presence in tumour and absence from germline traces. In 8 of the patient
samples that carried 2 mutations in MLL2, to establish whether one allele
contained both mutations or each allele contained one, we sequenced both
candidate mutations using DNA from BAC clones from FL patient libraries. The
primers and PCR conditions were the same as those used for the validation of
each of those mutations.
Targeted resequencing of MEF2B coding exons 1 and 2.
Coding exons 1 and 2 of MEF2B were PCR amplified using MEF2B_1F/R and
MEF2B_2F/R primers (see Supplementary Table S14 for primer sequences)
using the same conditions for MLL2 (previous paragraph). Priming sites for T7
and M13Reverse were added to their 5′ ends to allow direct Sanger sequencing
of amplicons. Amplicons were produced from whole genome amplified tumour
genomic DNA from lymphoma patients and DLBCL cell lines. Whole genome
amplification was performed using Repli-g Screening kit reagents (Qiagen),
following the manufacturer instructions. All capillary traces were visually
inspected.
Identification of structural aberrations involving BCL2 and BCL6
SUPPLEMENTARY INFORMATIONRESEARCHdoi:10.1038/nature10351
WWW.NATURE.COM/NATURE | 21

The presence of translocations involving MYC, BCL2 and BCL6 was determined
for 49 of the DLBCL cases (Supplementary Table S2; Figure 2) using commercial
dual color “break-apart” probes from Abbott Molecular (Abbott Park, IL) on
formalin fixed paraffin embedded tissue in tissue microarrays using the described
method74. Additional fusion transcripts involving BCL2 or BCL6 were detected in
these and the remaining libraries directly from the RNA-seq data using both
Trans-ABySS48 and deFuse (http://compbio.bccrc.ca/?page_id=275).
Analysis of impact of COO and mutation status on outcome in DLBCL
The analysis included only patients treated with curative intent who
received at least one cycle of R-CHOP. Overall survival (OS) was calculated as
the time from date of diagnosis until death from any cause. Patients were
censored at the time they were last known to be alive. OS was assessed using
the Kaplan-Meier method and the log rank test was used for comparison
between groups. Data were analysed using SPSS software (SPSS version 14.0
for Windows; SPSS Inc, Chicago, IL).
SUPPLEMENTARY INFORMATIONRESEARCHdoi:10.1038/nature10351
WWW.NATURE.COM/NATURE | 22

References
51. Beckwith, M., Longo, D.L., O'Connell, C.D., Moratz, C.M. & Urba, W.J. Phorbol ester-induced, cell-cycle-specific, growth inhibition of human B-lymphoma cell lines. J. Natl. Cancer Inst. 82, 501-509 (1990).
52. Kluin-Nelemans, H.C., Limpens, J., Meerabux, J., Beverstock, G.C., Jansen, J.H., et al. A new non-Hodgkin's B-cell line (DoHH2) with a chromosomal translocation t(14;18)(q32;q21). Leukemia 5, 221-224 (1991).
53. Dyer, M.J., Fischer, P., Nacheva, E., Labastide, W. & Karpas, A. A new human B-cell non-Hodgkin's lymphoma cell line (Karpas 422) exhibiting both t (14;18) and t(4;11) chromosomal translocations. Blood 75, 709-714 (1990).
54. Winter, J.N., Variakojis, D. & Epstein, A.L. Phenotypic analysis of established diffuse histiocytic lymphoma cell lines utilizing monoclonal antibodies and cytochemical techniques. Blood 63, 140-146 (1984).
55. Epstein, A., Variakojis, D., Berger, C. & Hecht, B. Use of novel chemical supplements in the establishment of three human malignant lymphoma cell lines (NU-DHL-1, NUDUL-1, and NU-AMB-1) with chromosome 14 translocations. International Journal of Cancer 35, 619-627 (1985).
56. Al-Katib, A.M., Smith, M.R., Kamanda, W.S., Pettit, G.R., Hamdan, M., et al. Bryostatin 1 down-regulates mdr1 and potentiates vincristine cytotoxicity in diffuse large cell lymphoma xenografts. Clin Cancer Res 4, 1305-1314 (1998).
57. Mehra, S., Messner, H., Minden, M. & Chaganti, R.S.K. Molecular cytogenetic characterization of non-Hodgkin lymphoma cell lines. Genes Chromosom. Cancer 33, 225-234 (2002).
58. Levy, S., Sutton, G., Ng, P., Feuk, L., Halpern, A., et al. The diploid genome sequence of an individual human. PLoS Biol 5, e254-e254 (2007).
59. Wheeler, D.A., Srinivasan, M., Egholm, M., Shen, Y., Chen, L., et al. The complete genome of an individual by massively parallel DNA sequencing. Nature 452, 872-876 (2008).
60. Wang, J., Wang, W., Li, R., Li, Y., Tian, G., et al. The diploid genome sequence of an Asian individual. Nature 456, 60-65 (2008).
61. Bentley, D.R., Balasubramanian, S., Swerdlow, H.P., Smith, G.P., Milton, J., et al. Accurate whole human genome sequencing using reversible terminator chemistry. Nature 456, 53-59 (2008).
62. Robinson, J.T., Thorvaldsdóttir, H., Winckler, W., Guttman, M., Lander, E.S., et al. Integrative genomics viewer. Nat Biotechnol 29, 24-26 (2011).
63. Robinson, M.D. & Oshlack, A. A scaling normalization method for differential expression analysis of RNA-seq data. 1-9 (2010).
64. Staden, R. The Staden sequence analysis package. Mol. Biotechnol. 5, 233-241 (1996).
65. Pasqualucci, L., Guglielmino, R., Malek, S.N., Novak, U., Compagno, M., et al. Aberrant Somatic Hypermutation Targets an Extensive Set of Genes in Diffuse Large B-Cell Lymphoma. ASH Annual Meeting Abstracts 104,
SUPPLEMENTARY INFORMATIONRESEARCHdoi:10.1038/nature10351
WWW.NATURE.COM/NATURE | 23

1528-1528 (2004). 66. Pasqualucci, L., Neumeister, P., Goossens, T., Nanjangud, G., Chaganti,
R., et al. Hypermutation of multiple proto-oncogenes in B-cell diffuse large-cell lymphomas. Nature 412, 341-346 (2001).
67. Pasqualucci, L., Migliazza, A., Basso, K., Houldsworth, J., Chaganti, R.S.K., et al. Mutations of the BCL6 proto-oncogene disrupt its negative autoregulation in diffuse large B-cell lymphoma. Blood 101, 2914-2923 (2003).
68. Jones, S.J., Laskin, J., Li, Y.Y., Griffith, O.L., An, J., et al. Evolution of an adenocarcinoma in response to selection by targeted kinase inhibitors. Genome Biol 11, R82-R82 (2010).
69. Krzywinski, M., Schein, J., Birol, I., Connors, J., Gascoyne, R., et al. Circos: an information aesthetic for comparative genomics. Genome Res 19, 1639-1645 (2009).
70. Birol, I., Jackman, S., Nielsen, C., Qian, J., Varhol, R., et al. De novo Transcriptome Assembly with ABySS. Bioinformatics (2009).doi:btp367 [pii] 10.1093/bioinformatics/btp367
71. Robertson, G., Hirst, M., Bainbridge, M., Bilenky, M., Zhao, Y., et al. Genome-wide profiles of STAT1 DNA association using chromatin immunoprecipitation and massively parallel sequencing. Nat Meth 4, 651-657 (2007).
72. Wiegand, K.C., Shah, S.P., Al-Agha, O.M., Zhao, Y., Tse, K., et al. ARID1A mutations in endometriosis-associated ovarian carcinomas. N Engl J Med 363, 1532-1543 (2010).
73. Gnirke, A., Melnikov, A., Maguire, J., Rogov, P., LeProust, E., et al. Solution hybrid selection with ultra-long oligonucleotides for massively parallel targeted sequencing. Nat Biotechnol 27, 182-189 (2009).
74. Chin, S., Daigo, Y., Huang, H., Iyer, N.G., Callagy, G., et al. A simple and reliable pretreatment protocol facilitates fluorescent in situ hybridisation on tissue microarrays of paraffin wax embedded tumour samples. MP, Mol. Pathol. 56, 275-279 (2003).
SUPPLEMENTARY INFORMATIONRESEARCHdoi:10.1038/nature10351
WWW.NATURE.COM/NATURE | 24

Figure S1: Overview of strategy. The samples analysed, experiments performed and an overview of the results. 717 nonsynonymous candidate somatic mutations in 651 genes were identified from the genomes/exomes of 14 NHL patient samples with matched constitutional DNA. Ten genes with hot spots were identified directly from the RNA-seq and nine of these genes were not among the 651 (661 total genes). We determined that 230 of these genes contained 3 or more cSNVs when genome and RNA-seq data were combined. We also attempted validation of all cSNVs identified in the FL genome and two DLBCL exomes. We validated at least one somatic cSNV in 317 genes (Table S5) and identified two or more somatic mutations in 109 genes using PCR amplification and Sanger sequencing in tumour and normal DNA. Of the successfully re-sequenced cSNVs predicted from the genomes, 171 (94.5%) were confirmed somatic, 7 were false calls and 3 were present in the germ line (Table S5). The entire MLL2 locus was screened for additional mutations in 37 DLBCL and 35 FL samples. MEF2B was similarly sequenced in an extension cohort of 292 DLBCLs and 261 FLs.
SUPPLEMENTARY INFORMATIONRESEARCHdoi:10.1038/nature10351
WWW.NATURE.COM/NATURE | 25

Figure S2: N-terminal truncation of FOXO1 protein with mutation affecting initial codon. (A) The RNA-seq data of cell lines and patient samples revealed mutations in 3 samples affecting the initial codon of FOXO1. To determine the effect of such mutations on FOXO1 protein, we assayed FOXO1 by Western blot in DLBCL cell lines using an antibody raised against full-length FOXO1 (2H8.2). In the cell line containing a mutation at the initiator methionine (OCI-Ly1), we observed a FOXO1 band of reduced molecular weight, compared to FOXO1 wild-type cell lines (size indicated in Kilodaltons on the left). The reduced size is consistent with the use of a second methionine codon in the FOXO1 gene, producing a protein shortened at the amino terminus by 70 amino acids. The same blot was also probed with an antibody that recognizes an N-terminal epitope (L27) and lack of a band in OCI-Ly1 cells is consistent with the notion that the lower band in this cell line corresponds to FOXO1 protein lacking its N-
SUPPLEMENTARY INFORMATIONRESEARCHdoi:10.1038/nature10351
WWW.NATURE.COM/NATURE | 26

terminus. We also noted absence of the protein in the DB cell line, which showed significantly reduced mRNA levels as measured by RNA-seq (upper bar chart; RPKM = Reads Per Kilobase of gene model per Million mapped reads).
SUPPLEMENTARY INFORMATIONRESEARCHdoi:10.1038/nature10351
WWW.NATURE.COM/NATURE | 27
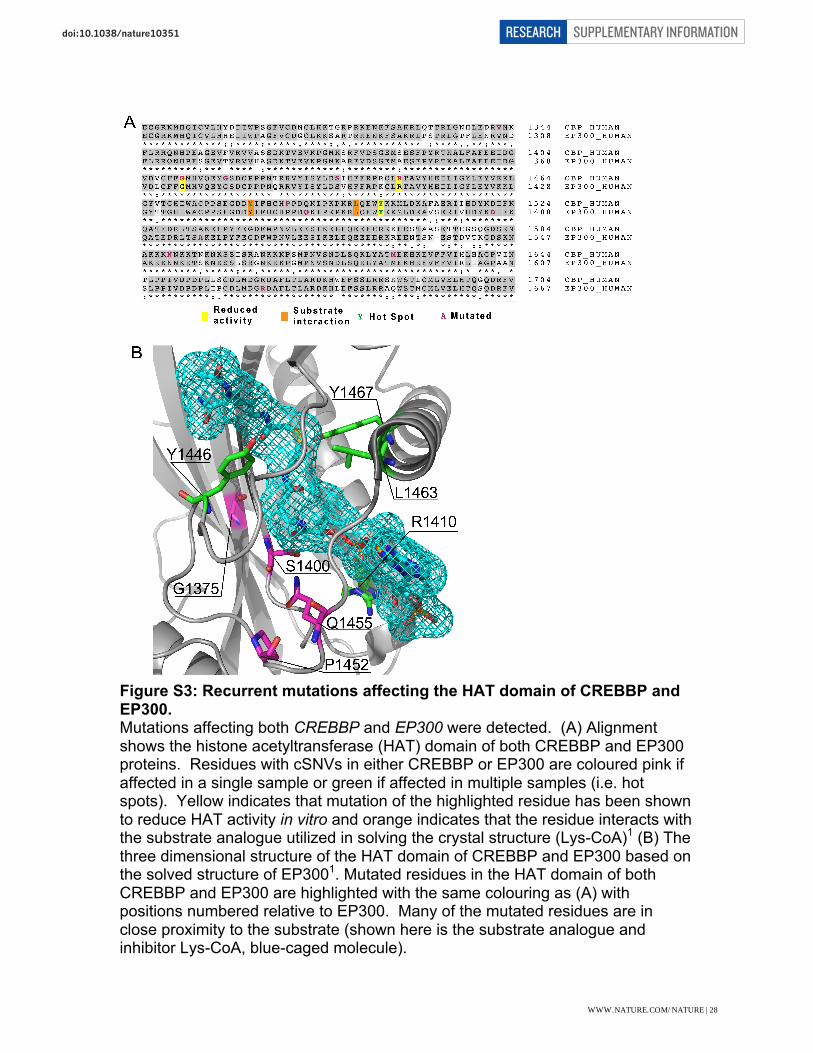
Figure S3: Recurrent mutations affecting the HAT domain of CREBBP and EP300. Mutations affecting both CREBBP and EP300 were detected. (A) Alignment shows the histone acetyltransferase (HAT) domain of both CREBBP and EP300 proteins. Residues with cSNVs in either CREBBP or EP300 are coloured pink if affected in a single sample or green if affected in multiple samples (i.e. hot spots). Yellow indicates that mutation of the highlighted residue has been shown to reduce HAT activity in vitro and orange indicates that the residue interacts with the substrate analogue utilized in solving the crystal structure (Lys-CoA)1 (B) The three dimensional structure of the HAT domain of CREBBP and EP300 based on the solved structure of EP3001. Mutated residues in the HAT domain of both CREBBP and EP300 are highlighted with the same colouring as (A) with positions numbered relative to EP300. Many of the mutated residues are in close proximity to the substrate (shown here is the substrate analogue and inhibitor Lys-CoA, blue-caged molecule).
SUPPLEMENTARY INFORMATIONRESEARCHdoi:10.1038/nature10351
WWW.NATURE.COM/NATURE | 28
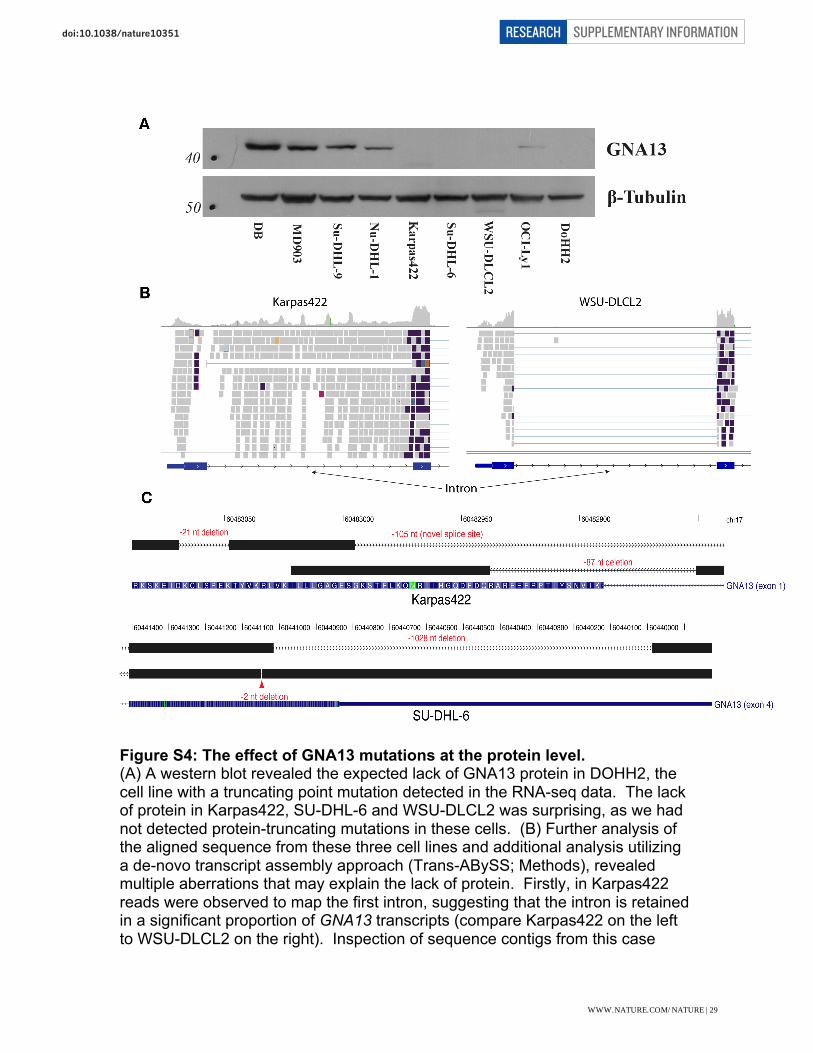
Figure S4: The effect of GNA13 mutations at the protein level. (A) A western blot revealed the expected lack of GNA13 protein in DOHH2, the cell line with a truncating point mutation detected in the RNA-seq data. The lack of protein in Karpas422, SU-DHL-6 and WSU-DLCL2 was surprising, as we had not detected protein-truncating mutations in these cells. (B) Further analysis of the aligned sequence from these three cell lines and additional analysis utilizing a de-novo transcript assembly approach (Trans-ABySS; Methods), revealed multiple aberrations that may explain the lack of protein. Firstly, in Karpas422 reads were observed to map the first intron, suggesting that the intron is retained in a significant proportion of GNA13 transcripts (compare Karpas422 on the left to WSU-DLCL2 on the right). Inspection of sequence contigs from this case
SUPPLEMENTARY INFORMATIONRESEARCHdoi:10.1038/nature10351
WWW.NATURE.COM/NATURE | 29

revealed the likely cause of intron reads to be a deletion of 87 nt that removes the canonical splicing donor from this exon (Panel C, top). Splicing still appears to occur to a lesser extent using a non-GT donor. Assembled reads from SU-DHL-6 revealed a 2 nt deletion and a large 1028 nt deletion. The former would affect the reading frame and the latter removes the terminal stop codon. Finally, in WSU-DLCL2, the splicing donor after the third exon was apparently mutated, converting the GT donor to a GC sequence (not shown). As in the Karpas422 case, there was clear evidence for retention of this intron in GNA13 transcripts in WSU-DLCL2. Intron retention has previously been linked to nonsense-mediated transcript degradation2 and if that is the case here, could explain the lack of GNA13 protein in these cells.
SUPPLEMENTARY INFORMATIONRESEARCHdoi:10.1038/nature10351
WWW.NATURE.COM/NATURE | 30
SUPPLEMENTARY INFORMATIONRESEARCHdoi:10.1038/nature10351
WWW.NATURE.COM/NATURE | 31

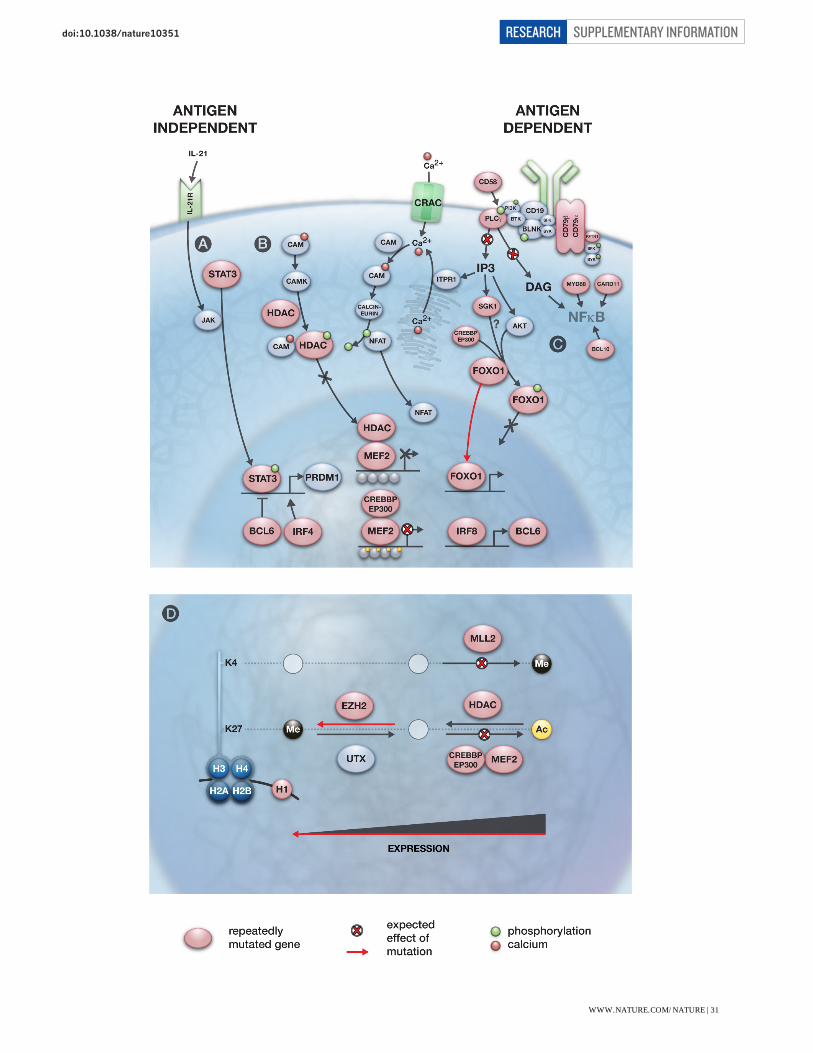
Figure S5: Potential impact of recurrently mutated genes on BCR signalling and downstream messengers. (A) Autocrine and paracrine stimulation of IL-21R induces the dimerization and activation of STAT3, a positive regulator of PRDM1 expression3. Mutations affecting the DNA binding domain of STAT3 are known to act as dominant negatives, which would predict the inability to induce PRDM1 expression following IL-21 stimulation. (B) Multiple mutations predicted to directly alter BCR signalling or alter the normal events subsequent to BCR-induced influx of the secondary messenger Ca2+. Cross-linking of CD58 has been shown to result in the phosphorylation of BLNK, Syk and PLC-gamma and lead to Akt activation4. Various mutations are expected to alter the ability of B cells to induce the expression of MEF2 target genes in response to the Ca2+ influx. The role of MEF2 gene family members in mediating epigenetic alterations downstream of the BCR has been inferred from a knockout study in which MEF2C was shown to be required for mediating calcium-dependent response to BCR signalling5 and the involvement of CREBBP/EP300 in this process has been inferred from MEF2-mediated transcriptional regulation in other cell types including T cells6. This model predicts that influx of Ca2+ after BCR stimulation would result in the displacement of HATs by activated Calmodulin-dependent protein kinase (CAMK), allowing HDAC activity via CREBBP/EP300 thus enabling transcription at MEF2 target loci. In this model, mutation of any of these three genes and potentially the S155F mutation in HDAC7 would diminish this effect and suppress the induction of MEF2 target loci after BCR stimulation. (C) Multiple mutations may affect the regulation of the activity of FOXO proteins following BCR stimulation. FOXO1 is a downstream target of the kinase AKT, which is activated during BCR signalling. SGK, a related kinase (commonly mutated in this study), is known to phosphorylate FOXO3a in a similar way7 and we predict it may also phosphorylate FOXO1. Thus, mutations affecting the FOXO1 phosphorylation site or SGK1 could affect the regulation of FOXO1 nuclear localization and hence, its transactivation activity. The shortened FOXO1 protein produced by mutation of the initial codon (Figure S2) would not contain this phosphorylation site and hence those mutations may also result in altered subcellular localization. Various mutations affecting NF-kB activity, which have been previously described, were also observed here8,9,10,11. (D) Many of the recurrently mutated genes in B-NHL are involved in histone modification or themselves encode histone proteins (i.e. HIST1H1C, one of multiple genes that encode histone protein H1). CREBBP/EP300 and MLL2 each produce activating chromatin marks (H3K27Ac and H3K4me3, respectively). HDAC (e.g. HDAC7) and EZH2 produce inactivating marks by removing acetyl groups and trimethylating H3K27, respectively. As heterozygous EZH2 Y641 mutations are known to effectively enhance PRC2 activity12, then each of the individual mutations may result in suppression of gene expression. Importantly, it is not known whether EZH2 and MLL2 regulate the expression of the same genes as MEF2B/CREBBP/EP300.
SUPPLEMENTARY INFORMATIONRESEARCHdoi:10.1038/nature10351
WWW.NATURE.COM/NATURE | 32

SUPPLEMENTARY INFORMATIONRESEARCHdoi:10.1038/nature10351
WWW.NATURE.COM/NATURE | 33

Figure S6: No detectable prognostic impact of EZH2 or MEF2B mutations in DLBCL. The presence of MEF2B mutations (in exon 1 or 2) and EZH2 hot spot (Y641) mutations was determined in a cohort of 199 DLBCL patients, the subset of the 259 DLBCL cases that were uniformly treated with R-CHOP. (A) The overall survival times (OS) were compared between the uniformly treated patients in this cohort for the cases with known COO subtype, as defined by gene expression profiling (GEP)13(Methods). The GCB cases (green, n=49) showed superior OS when compared to the ABC cases (blue, n=41)(P=0.012, Log-rank test). (B) Cases found to have mutations in MEF2B (green) were compared to those lacking mutations (blue) and no significant difference in OS was found (p = 0.399, Log-rank test). (C) Analysis of DLBCL patients with (green) and without (blue) mutations affecting Y641 in EZH2 also showed no significant difference (p = 0.279, Log-rank test). Hence, although these mutations appear to be strongly enriched in GCB cases, they do not appear enriched among cases with particularly good (or poor) outcomes.
SUPPLEMENTARY INFORMATIONRESEARCHdoi:10.1038/nature10351
WWW.NATURE.COM/NATURE | 34

Figure S7: Confirmation of alternative splicing events resulting from MLL2 splice site mutations. Shown are two examples of the effect of somatic splice site mutations in the MLL2 gene (reverse strand) determined from RNA-seq data and verified by Sanger sequencing (Supplementary Table S10; 05-25439).(A) Point mutation affecting a splice donor site (GT>GA) at chr12:47,714,115 (yellow star). RT-PCR primers for exons 38 and 39 (blue rectangles) are indicated by black arrows. Sequence from the upper gel band represents the reference allele or, from the lower band, the alternative transcript which uses an alternative donor site within exon 38. (B) Point mutation that disrupts a splice acceptor site (AG>CG) at chr12:47,733,692 (yellow star). Intron retention is inferred due to enrichment of intronic sequence reads (top, grey bars). Black arrows depict PCR primers. Primers for exons 5 and 6 (lane 2 of gel on right) produced an amplicon of 267bp and an amplicon of 602bp. The difference in these sizes is the size of the intron (335bp). Primers for exon 5 and the intron (lane 1) produced a single amplicon of 318bp. Amplicon sequencing confirmed the present of the reference splicing pattern and the intron retention event.
SUPPLEMENTARY INFORMATIONRESEARCHdoi:10.1038/nature10351
WWW.NATURE.COM/NATURE | 35

Figure S8: Visualization of MEF2B mutations in the solved crystal structure. The crystal structure of MEF2B bound to one of its co-repressors (Cabin1) is shown with the mutated residues indicated14. Some of the mutations affect regions of the protein that interact with co-activators and co-repressors (e.g. Y69, L67) and regions that are likely to interact with DNA (e.g. K4). The crystal structure of MEF2A bound to EP300 has also recently been solved and supports that L67 and Y69 are also important in that interaction15.
SUPPLEMENTARY INFORMATIONRESEARCHdoi:10.1038/nature10351
WWW.NATURE.COM/NATURE | 36

Supplementary Tables Table S3: Gene fusions identified using RNA-seq and genome sequencing
Patient Gene
fusion(s) Observed in* Origin Breakpoint 1 Breakpoint 2 DLBCL-Patient
C KIAA1532/ POLR2E
Transcriptome only Unknown chr19:2254040 chr19:1040471
DLBCL-Patient
D
BCL2/ IGH Both Somatic chr18:58944471 chr14:105401497
C15orf57/ CBX3 Both Germ line** chr15:38641486 chr7:26219496
DLBCL-Patient
E None NA NA NA NA DLBCL-Patient
F None NA NA NA NA DLBCL-Patient
G BCL2/ IGH Both Somatic chr18:58945022 chr14:105453733
DLBCL-Patient
H
MAPKBP1/MGA Both Germ line chr15:39837967 chr15:39903511
SMEK1/ CCDC88C Both Germ line chr14:90867139 chr14:91005988
DLBCL-PatientI None NA NA NA NA DLBCL-Patient
J IGH/
DUSP22 Both Somatic chr14:105396245 chr6:295806
DLBCL-Patient
K
C15orf57/ CBX3 Both Germ line** chr15:38641486 chr7:26219496 GIT1/
SHMT1 Both Somatic chr17:18177820 chr17:24935050 YES1/
ENOSF1 Transcriptome
only Unknown chr18:714633 chr18:696468 DLBCL-Patient
L BCL2/ IGH Both Somatic chr18:58915791 chr14:105400505
DLBCL-Patient
M
BCL6/ FBX018 Both Somatic chr3:188945185 chr10:6018457
C15orf57/ CBX3 Both Germ line** chr15:38641486 chr7:26219496
C4orf18/ TMEM144 Both Germ line chr4:159303043 chr4:159380815
*Events observed only in the transcriptome are potential false positive events or the result of trans-splicing;**Genome sequencing reveals that this germ line derived event is not the result of a genomic translocation but rather the approximately 7 Kb insertion of chr7 sequence (harbouring CBX3) into the chr15 region containing C15orf57.
SUPPLEMENTARY INFORMATIONRESEARCHdoi:10.1038/nature10351
WWW.NATURE.COM/NATURE | 37

Table S6: Mutation hotspots in genes identified using RNA-seq.
Codon Number of Samples
Distinct mutations Gene Name
602;646 30 4 EZH2 83§ 9 2 MEF2B 69§ 4 2 MEF2B 81§ 2 2 MEF2B 1482§ 3 2 CREBBP 1499§ 2 2 CREBBP 1467§ 2 2 EP300 287§ 2 1 HLA-C 1 8 5 BCL7A‡ 206§ 4 1 MYD88‡ 230§ 2 1 MYD88‡ 252§ 6 1 MYD88‡ 59 7 3 BCL2* 92;196;197 5 4 CD79B‡ 73;160§ 4 2 IKZF3‡ 164;255§ 3 2 PIM1‡ 97;188 3 2 PIM1‡ 18§ 3 2 IRF4‡ 587§ 3 2 BCL6 45§ 3 2 BTG2‡ 141;234 3 2 TP53‡ 24§ 2 2 FOXO1‡ 1§ 3 3 FOXO1‡ 12§ 2 1 TNFRSF14 226§ 2 2 CCND3‡ 233§ 2 2 CCND3‡ 1§ 3 3 B2M‡
§This mutation was proven to be somatic in at least one case; that is, present in tumour DNA but absent in matched constitutional DNA. ‡Not mutated in any of the fourteen genomes or exomes sequenced. *Additional hot spots in BCL2 were excluded to simplify the table. Genes indicated in bold are previously described targets of somatic mutation in lymphoma. Although known to be mutated, hot spots have not, to our knowledge, been described in BCL7A. Note that Tyr641 as previously described16 is based on the Uniprot sequence Q15910, whereas this site corresponds to residue 602 and 646 in the Refseq annotations.
SUPPLEMENTARY INFORMATIONRESEARCHdoi:10.1038/nature10351
WWW.NATURE.COM/NATURE | 38

Table S9: Mutations affecting CREBBP or EP300 detected using RNA-seq data.
Library Disease Gene Annotation EP300 position HS0841 DLBCL line CREBBP E1238*;E1268* E1202 HS0842 DLBCL line CREBBP A436V A420 HS0842 DLBCL line CREBBP Q170*;Q238* not conserved HS0806 FL CREBBP Y71H;Y1482H;Y1512H§ Y1446 HS1185 FL CREBBP G1411E;G1441E G1375 HS1200 FL CREBBP Y92F;Y1503F;Y1533F Y1467 HS1360 FL CREBBP R35C;R1446C;R1476C R1410 HS1361 FL CREBBP S25N;S1436N;S1466N§ S1400 HS0637 DLBCL CREBBP Q1104*;Q1134* Q1068 HS0641 DLBCL CREBBP L88Q;L1499Q;L1529Q§ L1463 HS0649 DLBCL CREBBP P77R;P1488R;P1518R§ P1452 HS0649 DLBCL CREBBP A687V;A717V not conserved HS0749 DLBCL CREBBP N1589K;N1619K N1552 HS0933 DLBCL CREBBP R370*;R438* R354 HS0939 DLBCL CREBBP M1625V;M1655V§ M1588 HS1135 DLBCL CREBBP V1342E;V1372E V1306 HS1460 DLBCL CREBBP L88P;L1499P;L1529P§ L1463 HS1977 DLBCL CREBBP C1283R;C1313R C1247 HS1979 DLBCL CREBBP N513S;N1978S;N2008S not conserved HS2059 DLBCL CREBBP Y71N;Y1482N;Y1512N§ Y1446 HS2249 DLBCL CREBBP A442T;A1907T;A1937T not conserved HS2249 DLBCL CREBBP Y92H;Y1503H;Y1533H§ Y1467 HS2606 DLBCL CREBBP R35C;R1446C;R1476C§ R1410 HS0653 DLBCL EP300 Q1904* - HS0939 DLBCL EP300 A1498T§ - HS1133 DLBCL EP300 L415P - HS1462 DLBCL EP300 Y1467H§ - HS2049 DLBCL EP300 P925T‡ - HS2607 DLBCL EP300 P925T‡ - HS1199 FL EP300 D1485V - HS1201 FL EP300 Q1455L - HS1202 FL EP300 Y1467N§ - HS0841 DLBCL line EP300 Q160* - HS0900 DLBCL line EP300 R1627W -
§mutation was proven to be somatic (absent in matched constitutional DNA); ‡was also found in the matched constitutional DNA (inherited variant); bold indicates mutation hot spots.
SUPPLEMENTARY INFORMATIONRESEARCHdoi:10.1038/nature10351
WWW.NATURE.COM/NATURE | 39

Table S11: All MEF2B mutations detected.
Case (res_id)
Position (chromosome)
Change (DNA)
Change (protein)
Diagnosis and subtype (subtyping method)
03-31934 chr19:19122543 T > A M1K FL 02-17440 chr19:19122535 A > G K4E GCB DLBCL (GEP) 98-17403 chr19:19122535 A > G K4E DLBCL 06-20044 chr19:19122535§ A > G K4E FL 06-23741 chr19:19122535§ A > G K4E FL 07-14540 chr19:19122535 A > G K4E FL 98-14740 chr19:19122535 A > G K4E FL 05-15463 chr19:19122532 A > G K5E FL 03-28045 chr19:19122523 A > G I8V DLBCL 92-59893 chr19:19122502 A > G R15G DLBCL 02-28712 chr19:19122492 C > T Q18* DLBCL 05-22052 chr19:19121225 A > G K23R DLBCL 07-10201 chr19:19121222 G > A R24Q FL SPEC1187 chr19:19121217 T > G F26V GCB DLBCL (GEP) 06-20952 chr19:19121195 A > C Y33S FL 03-18669 chr19:19121153 T > C I47T DLBCL 03-33888 chr19:19121135 G > A R53H DLBCL 01-16433 chr19:19121093§ T > G L67R FL 00-15694 chr19:19121088§ A > G Y69H GCB DLBCL (GEP) 05-11328 chr19:19121088 A > G Y69H GCB DLBCL (GEP) 06-12968 chr19:19121087§ T > C Y69C FL 06-18193 chr19:19121087 T > C Y69C FL 08-10448 chr19:19121087 T > C Y69C FL 99-30068 chr19:19121087 T > C Y69C FL
05-11369 chr19:19121066 -GGGGCT E74-P75-H76 > D FL
06-23851 chr19:19121066 A > G H76R FL 07-21828 chr19:19121064 G > A E77K DLBCL 07-30109 chr19:19121063 A > G E77G Composite FL 06-30145 chr19:19121052§ A > T N81Y GCB DLBCL (GEP) 05-23110 chr19:19121050§ C > A N81K GCB DLBCL (GEP) 00-13940 chr19:19121045 T > G D83A GCB DLBCL (IHC) 06-15922 chr19:19121045§ T > G D83A GCB DLBCL (GEP) 07-23804 chr19:19121045 T > G D83A GCB DLBCL (GEP) 00-22287 chr19:19121045 T > A D83V GCB DLBCL (IHC) 01-18672 chr19:19121045 T > A D83V GCB DLBCL (IHC) 02-30647 chr19:19121045§ T > A D83V GCB DLBCL (GEP) 03-11110 chr19:19121045 T > A D83V DLBCL 03-26817 chr19:19121045 T > A D83V GCB DLBCL (GEP) 03-30438 chr19:19121045 T > A D83V GCB DLBCL (GEP) 05-24666 chr19:19121045 T > A D83V GCB DLBCL (GEP) 06-30025 chr19:19121045§ T > A D83V GCB DLBCL (GEP)
SUPPLEMENTARY INFORMATIONRESEARCHdoi:10.1038/nature10351
WWW.NATURE.COM/NATURE | 40
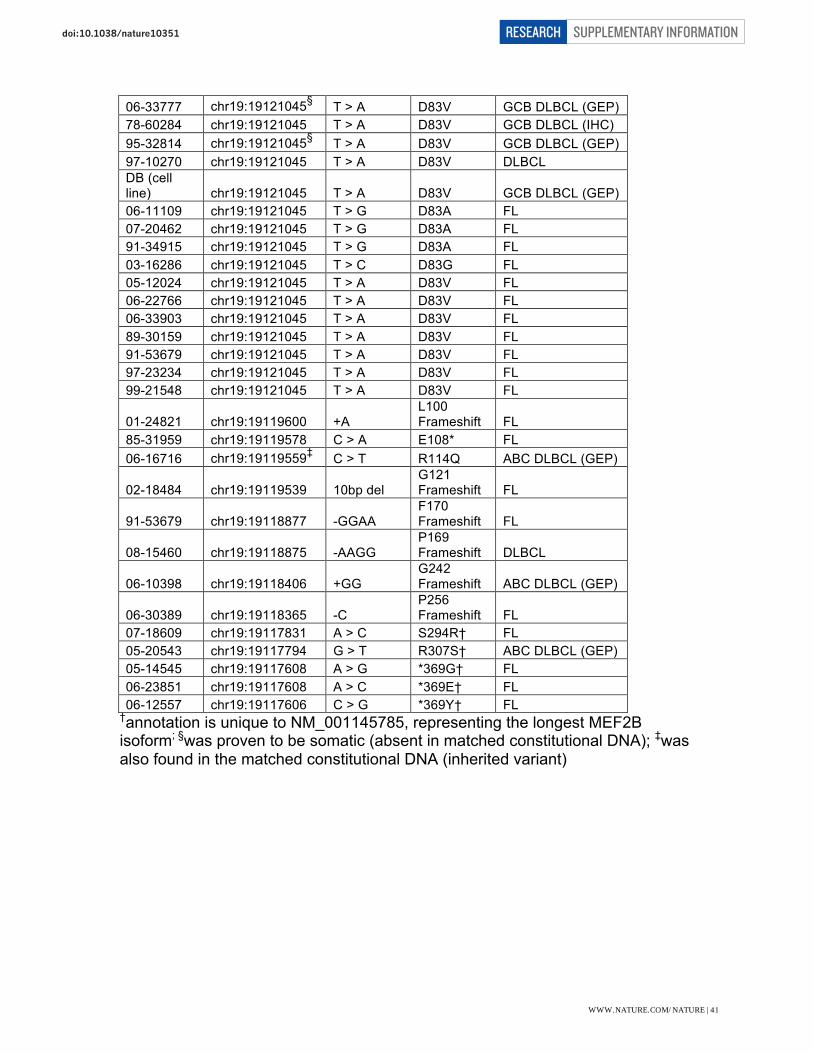
06-33777 chr19:19121045§ T > A D83V GCB DLBCL (GEP) 78-60284 chr19:19121045 T > A D83V GCB DLBCL (IHC) 95-32814 chr19:19121045§ T > A D83V GCB DLBCL (GEP) 97-10270 chr19:19121045 T > A D83V DLBCL DB (cell line) chr19:19121045 T > A D83V GCB DLBCL (GEP) 06-11109 chr19:19121045 T > G D83A FL 07-20462 chr19:19121045 T > G D83A FL 91-34915 chr19:19121045 T > G D83A FL 03-16286 chr19:19121045 T > C D83G FL 05-12024 chr19:19121045 T > A D83V FL 06-22766 chr19:19121045 T > A D83V FL 06-33903 chr19:19121045 T > A D83V FL 89-30159 chr19:19121045 T > A D83V FL 91-53679 chr19:19121045 T > A D83V FL 97-23234 chr19:19121045 T > A D83V FL 99-21548 chr19:19121045 T > A D83V FL
01-24821 chr19:19119600 +A L100 Frameshift FL
85-31959 chr19:19119578 C > A E108* FL 06-16716 chr19:19119559‡ C > T R114Q ABC DLBCL (GEP)
02-18484 chr19:19119539 10bp del G121 Frameshift FL
91-53679 chr19:19118877 -GGAA F170 Frameshift FL
08-15460 chr19:19118875 -AAGG P169 Frameshift DLBCL
06-10398 chr19:19118406 +GG G242 Frameshift ABC DLBCL (GEP)
06-30389 chr19:19118365 -C P256 Frameshift FL
07-18609 chr19:19117831 A > C S294R† FL 05-20543 chr19:19117794 G > T R307S† ABC DLBCL (GEP) 05-14545 chr19:19117608 A > G *369G† FL 06-23851 chr19:19117608 A > C *369E† FL 06-12557 chr19:19117606 C > G *369Y† FL
†annotation is unique to NM_001145785, representing the longest MEF2B isoform; §was proven to be somatic (absent in matched constitutional DNA); ‡was also found in the matched constitutional DNA (inherited variant)
SUPPLEMENTARY INFORMATIONRESEARCHdoi:10.1038/nature10351
WWW.NATURE.COM/NATURE | 41

Table S12: Catalogue of MEF2B cSNVs in FL and DLBCL. Amino Acid Change FL DLBCL Total % variants
M1K 1 0 1 1.4 K4E§ 4 2 6 8.7 K5E 1 0 1 1.4 I8V 0 1 1 1.4
R15G 0 1 1 1.4 K23R 0 1 1 1.4 R24Q 1 0 1 1.4 F26V 0 1 1 1.4 Y33S 1 0 1 1.4 I47T 0 1 1 1.4
R53H 0 1 1 1.4 L67R 1 0 1 1.4
Y69C/H§ 4 2 6 8.7 E74-P75-H76 > D 1 0 1 1.4
H76R 1 0 1 1.4 E77K 0 1 1 1.4
N81K/Y§ 0 2 2 2.9 D83A/G/V§ 11 16 27 39.1
R114Q 0 1 1 1.4 S294Y 1 0 1 1.4 R307S 0 1 1 1.4
*369Y/E/G 3 0 3 4.3 Truncation 5 3 8 11.6
Any mutation 35 34 69 100.0 Total cases sequenced 261 292
Prevalence 13.41% 11.64%
§at least one representative mutation at this position has been confirmed as a somatic mutation.
SUPPLEMENTARY INFORMATIONRESEARCHdoi:10.1038/nature10351
WWW.NATURE.COM/NATURE | 42

Supplementary Discussion
It is thought that GCB and ABC DLBCLs arise due to distinct genetic
events17 and it is widely accepted that the aggressive nature of the latter results
from the acquisition of mutations that mimic stimulation of the B cell receptor by
antigen or those that more directly induce constitutive activation of NF-kB18.
Here we report other important modulators or components of BCR signalling and
regulators of B cell differentiation or survival as targets of repeated and recurrent
mutation, including MEF2B/C5, SGK17, IRF419, STAT33, STAT620, RFTN121,
CCND322, PLCG2, FOXO123, CARD118, CD79B9 and MYD8810 and IKZF324.
There were notable differences in mutation patterns among these genes. For
example, MEF2B/C and STAT3, each of which function as dimers, showed
strong evidence for selectively acquiring nonsynonymous (rather than truncating)
mutations, whereas SGK1 and CCND3 appeared to be preferentially truncated in
NHL. The previously characterized CARD118, CD79B9 and MYD8810 all act
upstream of NF-kB, leading to its deregulation, typically in ABC DLBCLs. In our
data, only CD79B and MYD88 (in addition to structural rearrangements involving
BCL6) showed a significant enrichment for mutations in ABC cases (Figure 2)
and the point mutations we observed largely corresponded to the known hot
spots in these two genes9,10(Table S6).
The remaining genes listed above encode proteins that are either activated
or inhibited as a result of BCR stimulation, but not directly involved in regulating
NF-kB. PRDM1 has been termed the plasma cell master differentiation gene as it
orchestrates terminal differentiation of germinal centre B cells into plasma cells25.
SUPPLEMENTARY INFORMATIONRESEARCHdoi:10.1038/nature10351
WWW.NATURE.COM/NATURE | 43

Importantly STAT33, found here to be commonly mutated in DLBCL, regulates
the activity or expression of PRDM1 in response to IL-21 stimulation. Of interest,
inherited mutations in STAT3 are the primary cause of an immune disorder
known as hyper IgE syndrome and it has been shown that in these cases mutant
STAT3 acts in a dominant negative manner26. Strikingly, some of the somatic
mutations we report here affect the same residues found mutated in the
constitutional DNA of hyper IgE patients. This leads us to predict that mutant
cells may be unable to induce PRDM1 transcription following IL-21 stimulation
(Figure S5A). In particular, as many of these mutations were found in both GCB
DLBCL and FL, our data suggest that malignant transformation of germinal
centre B cells relies on components of BCR signalling separate from those
utilized in ABC DLBCL (i.e. NF-kB) but also that altered regulation of PRDM1,
previously thought to be a feature unique to ABC DLBCL, may be of general
importance in NHL.
Mutations affecting CREBBP and EP300 were recently reported in
DLBCL27, and ALL28. Similar to the observations reported in these studies, our
data show a preference for accumulation of truncating SNVs (n=4, 16.7% of
mutated cases) but also include non-synonymous SNVs in many cases (20
cases with cSNVs, Table S9). EP300 also contained multiple cSNVs (8 cases
total). We confirmed that 3 EP300 cSNVs and 9 CREBBP cSNVs were somatic
mutations. Cases with multiple cSNVs in either gene were rarely observed (one
cell line and three patients) consistent with the commonly held notion that both
genes are haploinsufficient29. The cSNVs that were not predicted to result in
protein truncation were mainly found within the HAT domain of these two
SUPPLEMENTARY INFORMATIONRESEARCHdoi:10.1038/nature10351
WWW.NATURE.COM/NATURE | 44

proteins. These included four codons that are apparent mutation hot spots
(Tables S6 and S9). Of these, three correspond to residues that have been
reported to be homologous between the two proteins1 (Figure S3; Table S9).
Representative cSNVs corresponding to three of these hot spots in CREBBP and
one in EP300 were confirmed as somatic. Three of the EP300 somatic non-
synonymous mutations we observed affected residues previously shown to
reduce acetyltransferase activity in an in vitro acetyltransferase assay (Figure
S3)1. We also confirmed that CREBBP (but not EP300) has a significant
signature of selective pressure to acquire both truncating and missense
mutations (Table 1), but the lack of significance for the latter may owe to limited
statistical power due to its reduced mutation prevalence relative to CREBBP.
Taken together, these data suggest that reduction or loss of either CREBBP or
EP300 may promote lymphomagenesis. Of note, in contrast to a recent report27,
we did not observe a significant difference in CREBBP or EP300 mutation
frequency in the two subtypes (P = 0.5656 for CREBBP and 0.6607 for EP300;
Fisher exact test).
MEF2 proteins can act as transcriptional co-activators or co-repressors by
recruiting two classes of enzymes that alter the acetylation state of histone tails,
namely HATs and HDACs. MEF2 dimers are known to associate with the two
HATs CREBBP and EP30030 and it has been suggested that HDACs and
CREBBP/EP300 compete for the same binding site on MEF231. Under normal
levels of intracellular Ca2+, MEF2 is bound by one of several type IIa HDACs,
which maintain the tails of histone proteins in a deacetylated repressive
chromatin state32. Increased cytoplasmic Ca2+ levels induce the nuclear export
of the bound HDAC, thus enabling MEF2 dimers to recruit a HAT enzyme such
SUPPLEMENTARY INFORMATIONRESEARCHdoi:10.1038/nature10351
WWW.NATURE.COM/NATURE | 45

as CREBBP/EP300, which facilitate transcription at MEF2 target genes by
catalysing the addition of acetyl groups to the tails of core histone proteins
including lysine 27 on histone H3 (H3K27)30,31(Figure S5D).
Ca2+-mediated induction of MEF2 target genes is utilised in diverse
developmental processes including muscle and neuronal cell differentiation33 as
well as the maturation of B and T cells6. For example, during negative selection,
upon T-cell-receptor (TCR) stimulation, the resulting Ca2+ influx results in MEF2-
mediated induction of the pro-apoptosis NR4A1 (NUR77), which, in turn drives
apoptosis of self-reactive T cells6. It has also been shown in T cells that MEF2D
interacts directly with nuclear NFAT, another Ca2+/CaM-regulated protein, and
recruits EP300 to MEF2 target genes34. In murine B cells, it was recently
demonstrated that MEF2C is required to mediate gene expression events
following BCR stimulation, but this study did not discuss a possible overlapping
role of MEF2B in this process nor was there a conclusive identification of the
MEF2C-regulated genes important to this process5. That we also observed
mutations in MEF2C at a lower frequency in NHL samples supports the
interpretation that these proteins share a related function in this cellular context.
The MEF2B dimer has previously been co-crystallized with three of its interacting
partners, namely Cabin114, HDAC931 and EP30015 and, informed by these
structures, we predict that many of the recurrent mutations would negatively
impact the function of MEF2B. For example, at least three of the mutated
residues (K5, K23 and R24) are required for mediating the binding of MEF2 to
DNA35. Because MEF2 proteins can heterodimerize36, mutations that impact the
SUPPLEMENTARY INFORMATIONRESEARCHdoi:10.1038/nature10351
WWW.NATURE.COM/NATURE | 46

function of MEF2 are known to produce a dominant effect on the overall function
of any MEF2-family protein by occupying a significant proportion of MEF2-
containing complexes37. In fact one of the residues found mutated in this study
(K24) was previously demonstrated to act as a dominant negative when
ectopically expressed37. Further, we also note that the mutation hot spot Y69
was recently shown to be involved in multiple interactions in a solved crystal
structure of MEF2B bound to EP30015, suggesting the possibility that this
mutation may impact the ability of these two proteins to interact. Although the
impact of the individual MEF2B mutations on MEF2 function requires further
study, the recurrence of these mutations among a limited set of residues
suggests the action of positive selection for these mutations during cancer
progression.
When one considers the high frequency of mutations we detected that
affect genes encoding MEF2 proteins, it is striking but perhaps not surprising that
inactivating mutations affecting both CREBBP and EP300 are common in NHL,
as these are both known effectors of the induction of MEF2-regulated genes.
Notably, with one exception, all of the truncation-inducing mutations identified in
CREBBP and EP300 are predicted to remove the histone acetyltransferase
(HAT) domain of the protein14. Moreover, comparison of the positions mutated in
CREBBP to those mutated in EP300 reveals that some homologous residues
within the HAT domains are affected in both proteins (Figure S3). Based on the
crystal structure of EP300, five of these recurrently mutated residues were
previously identified as important for mediating substrate interaction1. In that
SUPPLEMENTARY INFORMATIONRESEARCHdoi:10.1038/nature10351
WWW.NATURE.COM/NATURE | 47

study, three of these residues were mutated and showed loss (or reduction) of
HAT activity in vitro, suggesting that many of the cSNVs we observed in these
two proteins also negatively impact their function in vivo. Further,
CREBBP/EP300 are both known to regulate the function of FOXO138, another
gene found recurrently mutated in this study. Thus it is also possible that the
mutation of these genes in addition their potential effect on MEF2-mediated
transactivation, could impact the normal AKT-mediated nuclear exclusion of
FOXO1 (Figure S5C).
Our data are consistent with a model wherein the induction of MEF2 target
genes in response to BCR stimulation is inhibited by mutations that reduce the
function of MEF2 complexes, potentially in a dominant negative fashion, or
mutations that inactivate either of their transcriptional co-activators CREBBP or
EP300 (Figure S5D). Another mutation identified in this study in a single case is
also consistent with our model, namely the mutation of S155 to phenylalanine in
HDAC7. This serine residue is known to be phosphorylated by CAMK following
TCR stimulation, facilitating nuclear export of HDAC7 in response to Ca2+ influx39.
In the cited study, mutation of this residue resulted in impaired export of HDAC7
following TCR stimulation thereby inhibiting MEF2-mediated induction of NUR77
expression and hence, inhibiting NUR77-mediated apoptosis. Thus, this mutant
could potentially produce a nuclear-restricted protein that leads to constitutive
suppression of MEF2 target genes regardless of intracellular Ca2+ levels. This
would be a similar effect that would be expected for loss-of-function mutations of
MEF2B, CREBBP or EP300. Though an increase in cytoplasmic Ca2+ is one
SUPPLEMENTARY INFORMATIONRESEARCHdoi:10.1038/nature10351
WWW.NATURE.COM/NATURE | 48

downstream signal following BCR stimulation, the NFAT transcription factors, key
downstream mediators of this signal that promote survival, were not mutated and
thus are expected to function normally. Also, pathways such as NF-kB and
events modulated by AKT do not rely on the Ca2+ messenger and should
therefore be unaffected by these mutations. Interestingly, a recent report
suggests that SGK1 (found here to be commonly inactivated in DLBCL) may also
play a role in modulating Ca2+ levels by regulating the turnover of the Ca2+
channel protein Orai40. Thus, this model predicts that mutations directly affecting
MEF2 function (i.e. those in MEF2B, MEF2C, HDAC7, CREBBP or EP300) or
other genes involved in regulating cytoplasmic calcium levels would diminish the
cell’s ability to induce MEF2 target genes in response to BCR stimulation while
leaving other downstream signals intact.
SUPPLEMENTARY INFORMATIONRESEARCHdoi:10.1038/nature10351
WWW.NATURE.COM/NATURE | 49

References
1. Liu, X. et al. The structural basis of protein acetylation by the p300/CBP transcriptional coactivator. Nature 451, 846–850 (2008).
2. Lewis, B.P., Green, R.E. & Brenner, S.E. Evidence for the widespread coupling of alternative splicing and nonsense-mediated mRNA decay in humans. Proc Natl Acad Sci USA 100, 189–192 (2003).
3. Diehl, S. et al. STAT3-mediated up-regulation of BLIMP1 Is coordinated with BCL6 down-regulation to control human plasma cell differentiation. J Immunol 180, 4805–4815 (2008).
4. Ariel, O., Levi, Y. & Hollander, N. Signal transduction by CD58: The transmembrane isoform transmits signals outside lipid rafts independently of the GPI-anchored isoform. Cell Signal 21, 1100–1108 (2009).
5. Wilker, P. et al. Transcription factor Mef2c is required for B cell proliferation and survival after antigen receptor stimulation. Nat Immunol 9, 603–612 (2008).
6. Youn, H., Sun, L., Prywes, R. & Liu, J. Apoptosis of T cells mediated by Ca2+-induced release of the transcription factor MEF2. Science 286, 790–793 (1999).
7. Brunet, A. et al. Protein Kinase SGK Mediates Survival Signals by Phosphorylating the Forkhead Transcription Factor FKHRL1 (FOXO3a). Mol Cell Biol 21, 952–965 (2001).
8. Lenz, G. et al. Oncogenic CARD11 mutations in human diffuse large B cell lymphoma. Science 319, 1676–1679 (2008).
9. Davis, R.E. et al. Chronic active B-cell-receptor signalling in diffuse large B-cell lymphoma. Nature 463, 88–92 (2010).
10. Ngo, V.N. et al. Oncogenically active MYD88 mutations in human lymphoma. Nature 470, 115–119 (2011).
11. Du, M.Q. et al. BCL10 gene mutation in lymphoma. Blood 95, 3885–3890 (2000).
12. Yap, D.B. et al. Somatic mutations at EZH2 Y641 act dominantly through a mechanism of selectively altered PRC2 catalytic activity, to increase H3K27 trimethylation. Blood 117, 2451–2459 (2011).
13. Wright, G. et al. A gene expression-based method to diagnose clinically distinct subgroups of diffuse large B cell lymphoma. Proc Natl Acad Sci USA 100, 9991–9996 (2003).
14. Han, A. et al. Sequence-specific recruitment of transcriptional co-repressor Cabin1 by myocyte enhancer factor-2. Nature 422, 730–734 (2003).
15. He, J. et al. Structure of p300 bound to MEF2 on DNA reveals a mechanism of enhanceosome assembly. Nucleic Acids Res (2011).doi:10.1093/nar/gkr030
16. Morin, R.D. et al. Somatic mutations altering EZH2 (Tyr641) in follicular and diffuse large B-cell lymphomas of germinal-center origin. Nat Genet 42, 181–185 (2010).
17. Lenz, G. et al. Molecular subtypes of diffuse large B-cell lymphoma arise
SUPPLEMENTARY INFORMATIONRESEARCHdoi:10.1038/nature10351
WWW.NATURE.COM/NATURE | 50

by distinct genetic pathways. Proc Natl Acad Sci USA 105, 13520–13525 (2008).
18. Lenz, G. & Staudt, L.M. Aggressive lymphomas. N Engl J Med 362, 1417–1429 (2010).
19. Hunt, K.E., Hall, B. & Reichard, K.K. Translocations involving MUM1 are rare in diffuse large B-cell lymphoma. Appl Immunohistochem Mol Morphol 18, 109–112 (2010).
20. Linehan, L.A., Warren, W.D., Thompson, P.A., Grusby, M.J. & Berton, M.T. STAT6 is required for IL-4-induced germline Ig gene transcription and switch recombination. J Immunol 161, 302–310 (1998).
21. Saeki, K., Miura, Y., Aki, D., Kurosaki, T. & Yoshimura, A. The B cell-specific major raft protein, Raftlin, is necessary for the integrity of lipid raft and BCR signal transduction. EMBO J 22, 3015–3026 (2003).
22. Peled, J.U. et al. Requirement for cyclin D3 in germinal center formation and function. Cell Res 20, 631–646 (2010).
23. Srinivasan, L. et al. PI3 kinase signals BCR-dependent mature B cell survival. Cell 139, 573–586 (2009).
24. Cortés, M. & Georgopoulos, K. Aiolos is required for the generation of high affinity bone marrow plasma cells responsible for long-term immunity. J Exp Med 199, 209–219 (2004).
25. Shaffer, A.L. et al. Blimp-1 orchestrates plasma cell differentiation by extinguishing the mature B cell gene expression program. Immunity 17, 51–62 (2002).
26. Minegishi, Y. et al. Dominant-negative mutations in the DNA-binding domain of STAT3 cause hyper-IgE syndrome. Nature 448, 1058–1062 (2007).
27. Pasqualucci, L. et al. Inactivating mutations of acetyltransferase genes in B-cell lymphoma. Nature 471, 189–195 (2011).
28. Mullighan, C.G. et al. CREBBP mutations in relapsed acute lymphoblastic leukaemia. Nature 471, 235–239 (2011).
29. Janknecht, R. The versatile functions of the transcriptional coactivators p300 and CBP and their roles in disease. Histol. Histopathol 17, 657–668 (2002).
30. Giordano, A. & Avantaggiati, M. p300 and CBP: partners for life and death. J Cell Physiol 181, 218–230 (1999).
31. Han, A., He, J., Wu, Y., Liu, J.O. & Chen, L. Mechanism of recruitment of class II histone deacetylases by myocyte enhancer factor-2. J Mol Biol 345, 91–102 (2005).
32. Youn, H. & Liu, J. Cabin1 represses MEF2-dependent Nur77 expression and T cell apoptosis by controlling association of histone deacetylases and acetylases with MEF2. Immunity 13, 85–94 (2000).
33. Potthoff, M. & Olson, E. MEF2: a central regulator of diverse developmental programs. Development 134, 4131–4140 (2007).
34. Youn, H.D., Chatila, T.A. & Liu, J.O. Integration of calcineurin and MEF2 signals by the coactivator p300 during T-cell apoptosis. EMBO J 19, 4323–4331 (2000).
SUPPLEMENTARY INFORMATIONRESEARCHdoi:10.1038/nature10351
WWW.NATURE.COM/NATURE | 51
35. Wu, W. et al. Conservation and evolution in and among SRF- and MEF2-type MADS domains and their binding sites. Molecular biology and evolution (2010).doi:10.1093/molbev/msq214
36. Martin, J. et al. A Mef2 gene that generates a muscle-specific isoform via alternative mRNA splicing. Mol Cell Biol 14, 1647–1656 (1994).
37. Molkentin, J.D., Black, B.L., Martin, J.F. & Olson, E.N. Mutational analysis of the DNA binding, dimerization, and transcriptional activation domains of MEF2C. Mol Cell Biol 16, 2627–2636 (1996).
38. van der Heide, L.P. & Smidt, M.P. Regulation of FoxO activity by CBP/p300-mediated acetylation. Trends Biochem. Sci. 30, 81–86 (2005).
39. Dequiedt, F. et al. HDAC7, a thymus-specific class II histone deacetylase, regulates Nur77 transcription and TCR-mediated apoptosis. Immunity 18, 687–698 (2003).
40. Eylenstein, A. et al. Stimulation of Ca2+-channel Orai1/STIM1 by serum- and glucocorticoid-inducible kinase 1 (SGK1). FASEB J 25, 2012–2021 (2011).
SUPPLEMENTARY INFORMATIONRESEARCHdoi:10.1038/nature10351
WWW.NATURE.COM/NATURE | 52