morgantown, wv – august 8, 2011 timothy r carr department of geology & geography west virginia...
TRANSCRIPT
Morgantown, WV – August 8, 2011
Timothy R Carr
Department of Geology & Geography
West Virginia University
Gas Shale in the Appalachian Basin Technical and Societal Challenges and
Opportunities

Morgantown, WV – August 8, 2011
Out on the Edge - My Observations
Disclaim
ers
Worked in Energy IndustryPro
-Energ
y
Energy is
the
Basis of A
LL Civiliz
ation
Students Employed inEnergy Industry
Pro-BonoNo Support
orGuidance
FromAnyone!

Morgantown, WV – August 8, 2011
Shale-Gas in the Appalachian Basin Extremely Large Resource
1.6 TCF in 2002 500-1,300 Tcf, today Large Area – 16-32 Million Acres in the Core Area Adjacent to the Market
Challenges Terrain Infrastructure Public Perception-Tension / Regulations
History 1821, Fredonia, New York 2003 Well - Range Resources Approximately 6,933 Wells
Pennsylvania - 4,168West Virginia – 2,744New York – 21 Wells
Located in downtown Fredonia, the boulder proudly displays the site of the first commercial gas well in the US, dedicated in 1925 on the 100th anniversary by the Daughters of the American Revolution.
Picture source - http://www.fredonia.edu/shaleinstitute/facts.asp
Morgantown, WV – August 8, 2011
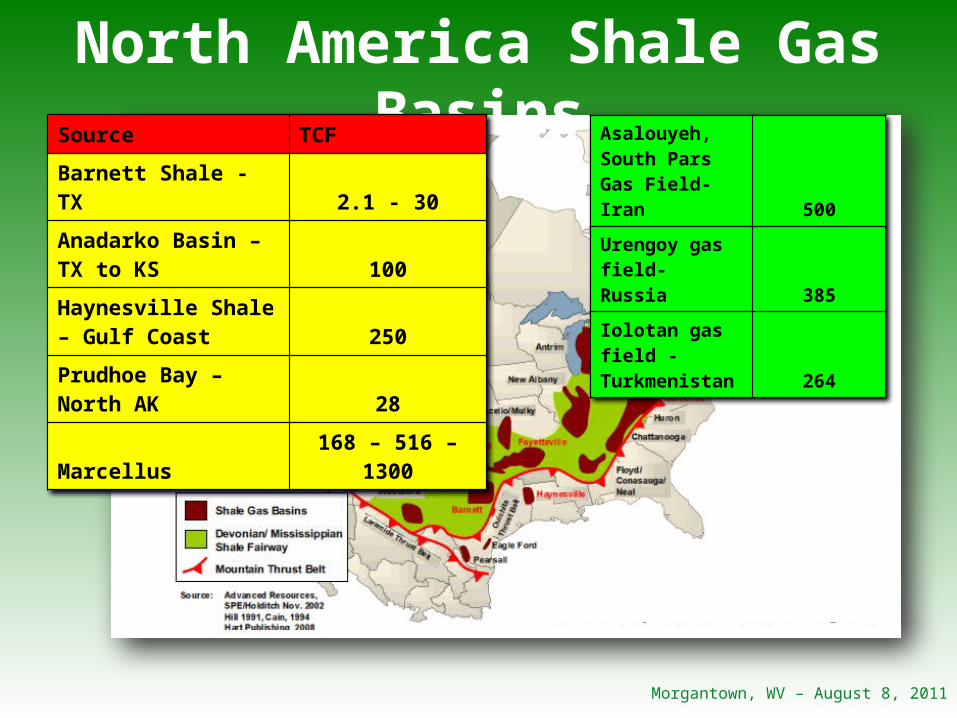
North America Shale Gas BasinsAsalouyeh, South Pars Gas Field- Iran 500
Urengoy gas field- Russia 385
Iolotan gas field - Turkmenistan 264
Source TCF
Barnett Shale - TX 2.1 - 30
Anadarko Basin – TX to KS 100
Haynesville Shale – Gulf Coast 250
Prudhoe Bay – North AK 28
Marcellus 168 – 516 – 1300

Morgantown, WV – August 8, 2011
Marcellus Wells Through 2005
100 Wells & Locations
Range Resources

Morgantown, WV – August 8, 2011
Marcellus Wells Through 2006
465 Wells & Locations

Morgantown, WV – August 8, 2011
Marcellus Wells Through 2007
1,105 Wells & Locations

Morgantown, WV – August 8, 2011
Marcellus Wells Through 2008
1,947 Wells & Locations
Morgantown, WV – August 8, 2011
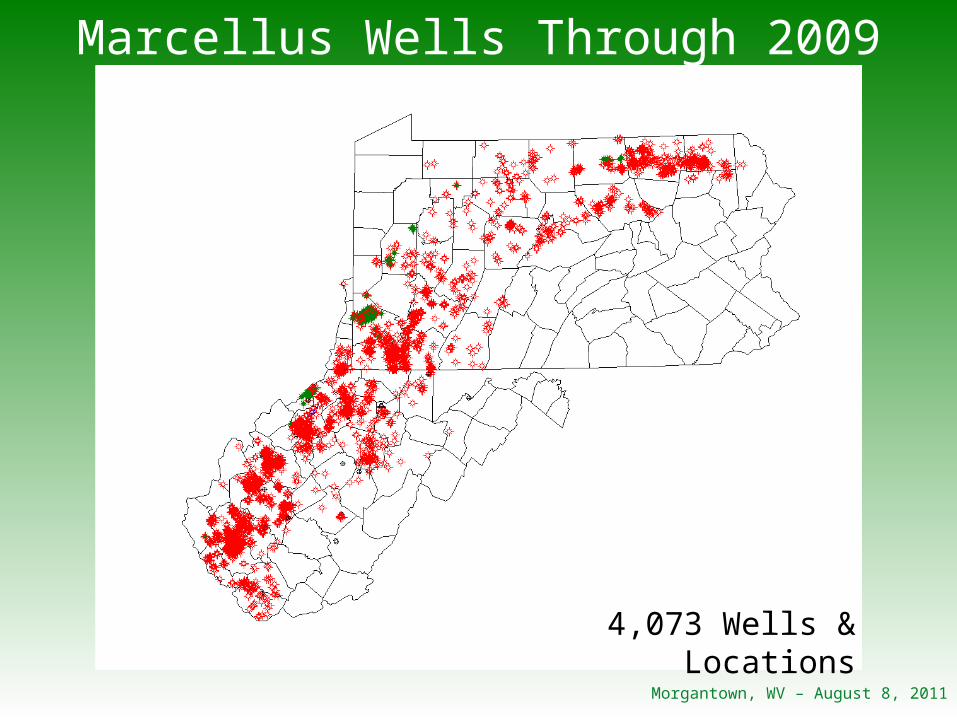
Marcellus Wells Through 2009
4,073 Wells & Locations
Morgantown, WV – August 8, 2011
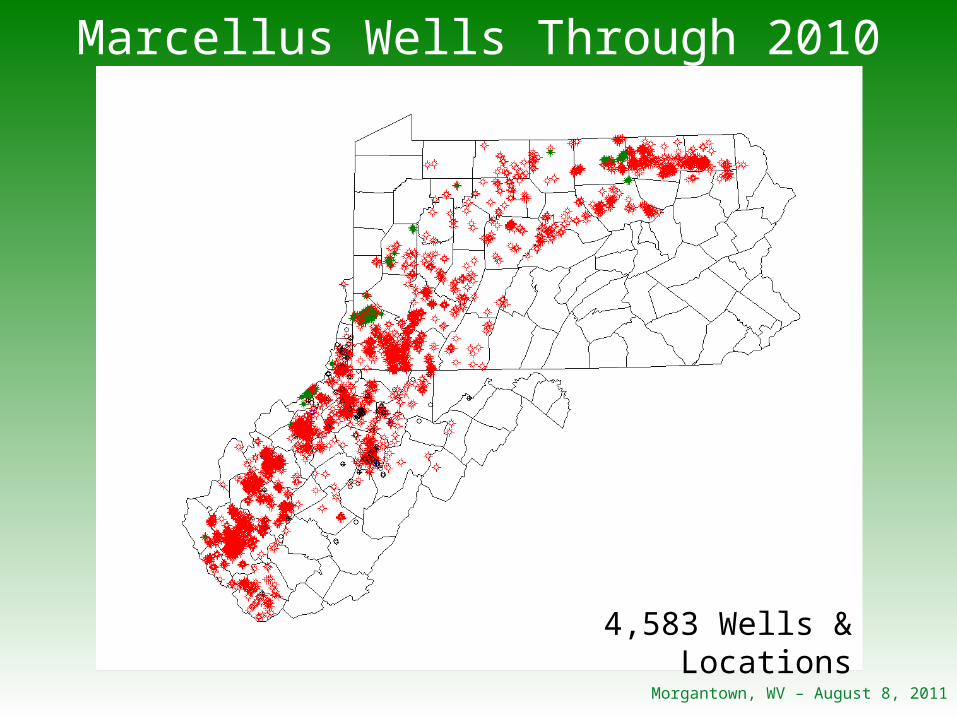
Marcellus Wells Through 2010
4,583 Wells & Locations
Morgantown, WV – August 8, 2011
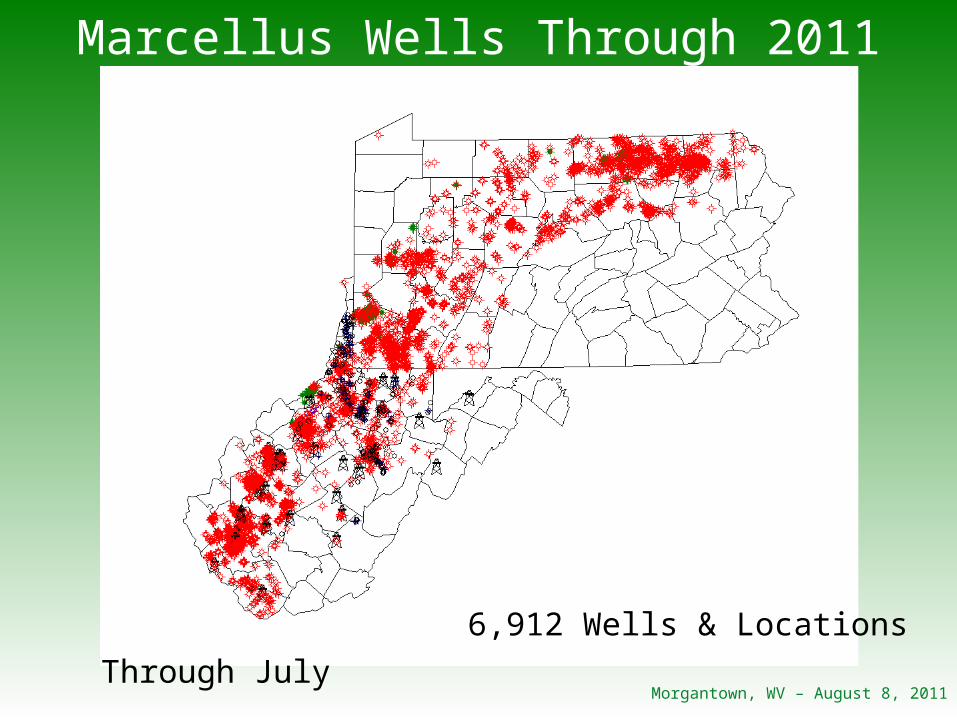
Marcellus Wells Through 2011
6,912 Wells & Locations
Through July

Morgantown, WV – August 8, 2011
West Virginia – Marcellus Permits
West Virginia Division Environmental Protection - February 9, 2011
Horizontal WellAverage Length – 5,313Longest Length – 12,959
Fracture StagesAverage – 6-7Maximum – 22
Morgantown, WV – August 8, 2011
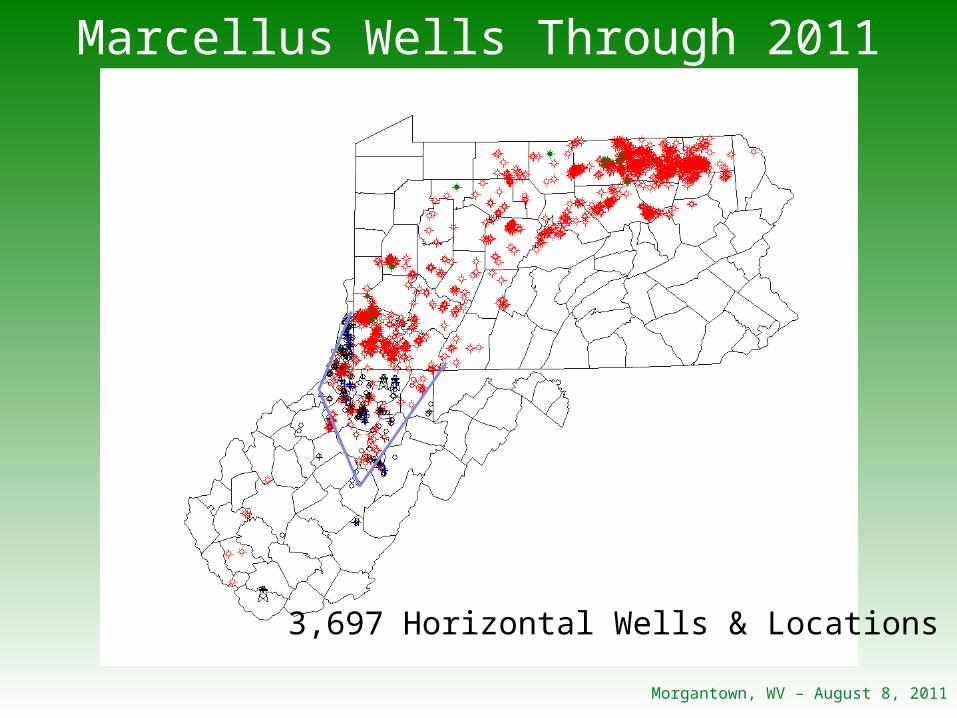
Marcellus Wells Through 2011
3,697 Horizontal Wells & Locations

Morgantown, WV – August 8, 2011
Organic-Rich Marcellus Deposited at Edge of Onondaga Shelf
Low detrital inputHigh ProductivityLow
Removal/Degradation
Relatively Shallow Depths
The areas of high organic content are identified by their relation to the underlying structure at the time of deposition and not by the gross unit thickness of the shale
Local thick areas located in Onondaga thins
Marcellus Shale
(Boyce, 2010; Yanni, 2010)

Morgantown, WV – August 8, 2011
Pennsylvania Marcellus Production
2005 2006 2007 2008 2009 2010 (6mos)
0
50
100
150
200
250
300
$0
$200,000,000
$400,000,000
$600,000,000
$800,000,000
$1,000,000,000
$1,200,000,000
0.10.7500000000000
01 1.9 9
78
272
BC
F P
er Y
ear
Wel
lhea
d V
alue
Mil
lion
s D
olla
rs
Source – Pennsylvania Department of Environmental Protection

Morgantown, WV – August 8, 2011
Marcellus Production Rates
1.0
10.0
100.01 10 100 1,000 10,000 100,000
Prob
abili
ty
Average Daily Production (Mcf)
Pennsylvanian Marcellus Horizontal Wells
P50
January-June 2010

Morgantown, WV – August 8, 2011
Impact on West VirginiaDirect Industrial Sector Employment
2001200220032004200520062007200820092010
0
1,000
2,000
3,000
4,000
5,000
6,000
7,000
8,000
9,000
Pipeline Operation
Pipeline Construction
Oil and Gas Support Operations
Oil and Gas Extraction
Source: Workforce West Virginia, http://www.workforcewv.org/LMI/cntyform2.cfm?SelectCnty=West%20Virginia
Industrial SectorAverage Wage $1,296/week
Avg. WV $725/wkLast Five Years - 2,000+ Jobs
WV 6,686 Decrease

Morgantown, WV – August 8, 2011
Impact on West VirginiaSeverance Tax
2006 2007 2008 2009 2010$0
$10,000,000
$20,000,000
$30,000,000
$40,000,000
$50,000,000
$60,000,000
$70,000,000
$80,000,000
$90,000,000

Morgantown, WV – August 8, 2011
Paradox of the General Public
Demand Abundant & Inexpensive Energy
Welcome Economic Benefits
Distrusts the Intrusion of the Industry
Fearful of Issues Perceived to Accompany Development

Morgantown, WV – August 8, 2011
Meeting Societal ChallengesNatural Gas Development
Societal Well-Being
Economic Well-Being
Individual Well-Being
Environmental Well-Being
Transparent Communication with All Stakeholders
Informational & EducationalPrograms
Engage in Partnerships

Morgantown, WV – August 8, 2011
Shale-Gas in West Virginia Increased Production – Increased Consumption
500 Bcf/year to 5,000 Bcf/yearApproximately 20% of US Consumption
Heavy Drilling Activity Will Persist for a Decade Infrastructure Demands
Roads, Housing, Pipelines, Downstream Activities Tension with the Public Will Decrease
Economic Activity Will Increase Tax Revenue Will Accelerate
Severance $60 million in 2010 to $240 million in 2020Property Taxes – Wells, Transportation, Processing
Example - Johnson Co., Texas $0 in 1998 to ~$64.5 million in 2008$16.5 Million County, $12.4 Million Cities, $35.6 Million Schools
Induced Taxes Will Accelerate Wells Will Persist for 50+ years, but will Production will
Decrease.

Morgantown, WV – August 8, 2011
• Timothy R Carr• Department of Geology & Geography• 304.293.9660• [email protected]
Questions