morgan stanley tmt conference - capgemini · 1 morgan stanley tmt conference – nov 06 agenda...
TRANSCRIPT

Morgan Stanley TMT Conference Barcelona, November 17, 2006
Paul Hermelin, CEO
1
Morgan Stanley TMT Conference – Nov 06
Agenda
Business Momentum end of 06
Outsourcing margin recovery plan
Investing for the future (I3)
Kanbay acquisition

2
Morgan Stanley TMT Conference – Nov 06
Business Momentum end of 06

3
Morgan Stanley TMT Conference – Nov 06
We finish the year with a strong momentum
9.0%
8.7%
3 784
H1 2006
13.5%
12.4%
- 1.9%
- 1.8%
1 881
Q3 2006
11.0%
8.6%
3.3%
2.5%
1 915
Q2 2006
1 8696 9543 4821 8081 6743 4721 7641 708Amount in M€ (Published)
10.0%
9.4%
4.3%
3.3%
Q1 2006FY 2005
0.3%
H2 2005
7.4%
8.0%
Q4 2005
- 4.0%
- 5,1%
Q3 2005Q1 2005
2.3%
3.3%
Q2 2005 H1 2005
Year-on-Year Organic Growth
Year-on-Year Current Growth
Sequential Organic Growth
Sequential Current Growth
Revenue quarterly evolution in M€
1708
1764
1674
1808
18691915 1881
1400
1600
1800
2000
Q1 05 Q2 05 Q3 05 Q4 05 Q1 06 Q2 06 Q3 06
At constant rates and perimeter
4
Morgan Stanley TMT Conference – Nov 06
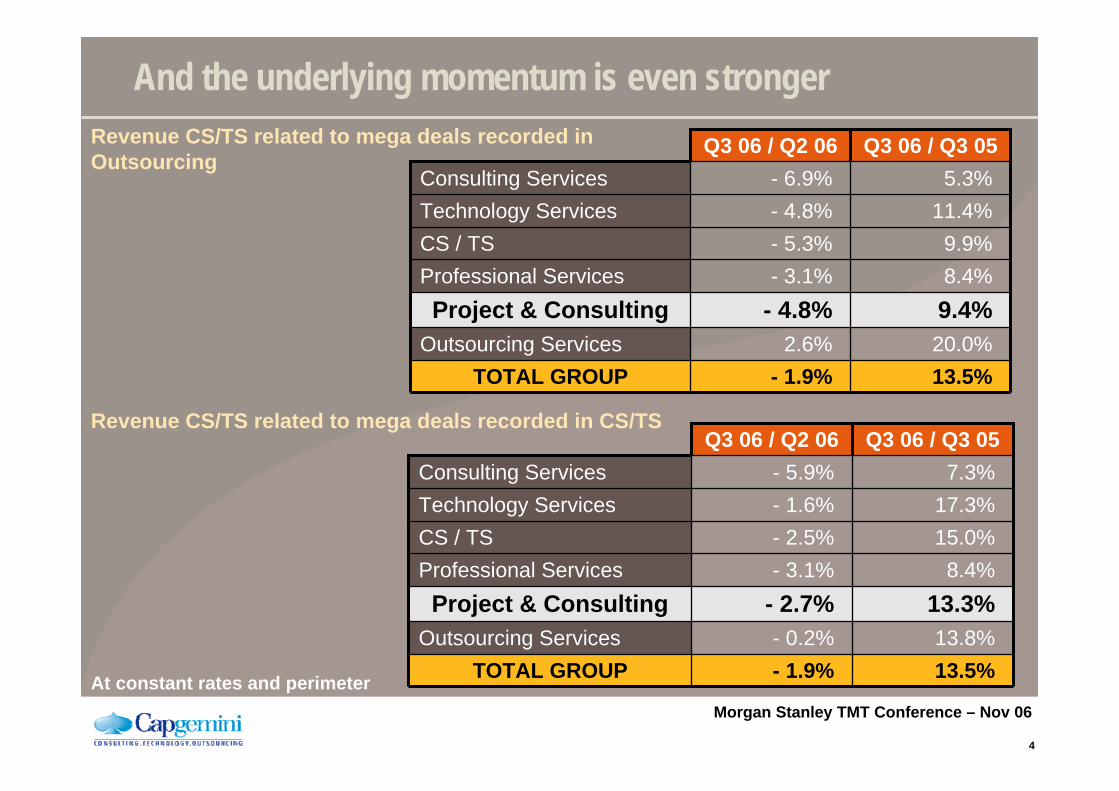
9.9%- 5.3%CS / TS
- 1.9%2.6%
- 4.8%- 3.1%
- 4.8%- 6.9%
Q3 06 / Q2 06
13.5%TOTAL GROUP20.0%Outsourcing Services9.4%Project & Consulting8.4%Professional Services
11.4%Technology Services5.3%Consulting Services
Q3 06 / Q3 05Revenue CS/TS related to mega deals recorded in Outsourcing
And the underlying momentum is even stronger
15.0%- 2.5%CS / TS
- 1.9%- 0.2%
- 2.7%- 3.1%
- 1.6%- 5.9%
Q3 06 / Q2 06
13.5%TOTAL GROUP13.8%Outsourcing Services
13.3%Project & Consulting8.4%Professional Services
17.3%Technology Services7.3%Consulting Services
Q3 06 / Q3 05
At constant rates and perimeter
Revenue CS/TS related to mega deals recorded in CS/TS

5
Morgan Stanley TMT Conference – Nov 06
Utilisation has not peaked yet but is already quite good
50
60
70
80
90
62
67 6665
66
69
66
Q1 Q2 Q3 Q4 Q1 Q2 Q3
807978 79 7979
80
Q1 Q2 Q3 Q4 Q1 Q2 Q3
86 86 85 8685
8685
Q1 Q2 Q3 Q4 Q1 Q2 Q3
Consulting Services Technology Services Professional Services
2005 2006
At constant rates and perimeter – with India
2005 2006 2005 2006
6
Morgan Stanley TMT Conference – Nov 06
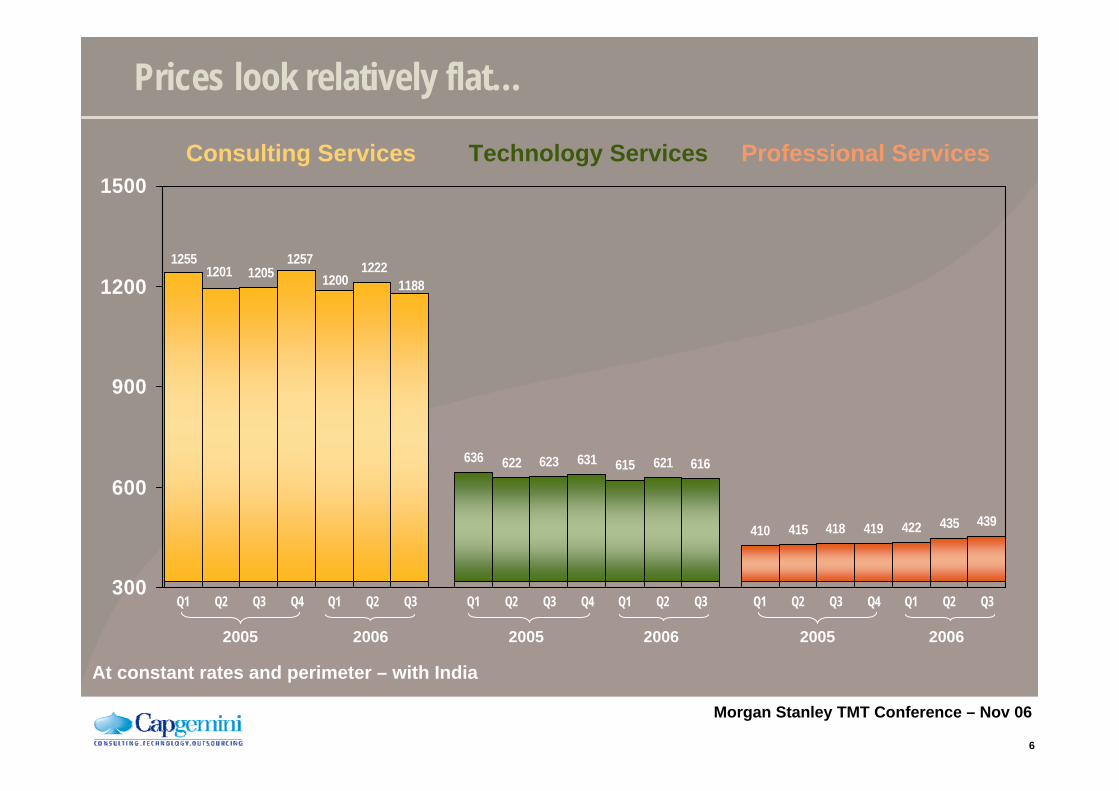
Prices look relatively flat…
300
600
900
1200
1500
1200 118812221257
1201 12051255
Q1 Q2 Q3 Q4 Q1 Q2 Q3
636 622 623 631 615 621 616
Q1 Q2 Q3 Q4 Q1 Q2 Q3
410 415 418 419 422 435 439
Q1 Q2 Q3 Q4 Q1 Q2 Q3
Consulting Services Technology Services Professional Services
At constant rates and perimeter – with India
2005 2006 2005 2006 2005 2006

7
Morgan Stanley TMT Conference – Nov 06
661
652
662
673
663
677
682
640
660
680
700
Q1 Q2 Q3 Q4 Q1 Q2 Q3
Technology Services Excluding India
2005 2006
410
415418 419
422
435439
400
420
440
460
Q1 Q2 Q3 Q4 Q1 Q2 Q3
Professional Services
2005 2006
But onshore prices are up in Technology Services, and scale effects hide the strong Local Professional Svces progress!
At constant rates and perimeter

8
Morgan Stanley TMT Conference – Nov 06
Sustained bookings hint on future growth
0
500
1 000
1 500
2 000
2 500
3 000
3 500
4 000
4 500
Q1 04 Q2 04 Q3 04 Q4 04 Q1 05 Q2 05 Q3 05 Q4 05 Q1 06 Q2 06 Q3 06
OutsourcingProject & Consulting
M€
484
2 860
284
1 943
277490
320
1 1171 760
1 078 1 178 929 1 255 1 119 1 226 953 1 274 1 230
329
1 376
At constant rates and perimeter
406
1 117
1 562
4 038
1 213
3 198
1 3961 716
1 273
2 391
2 990
1 7051 523
9
Morgan Stanley TMT Conference – Nov 06
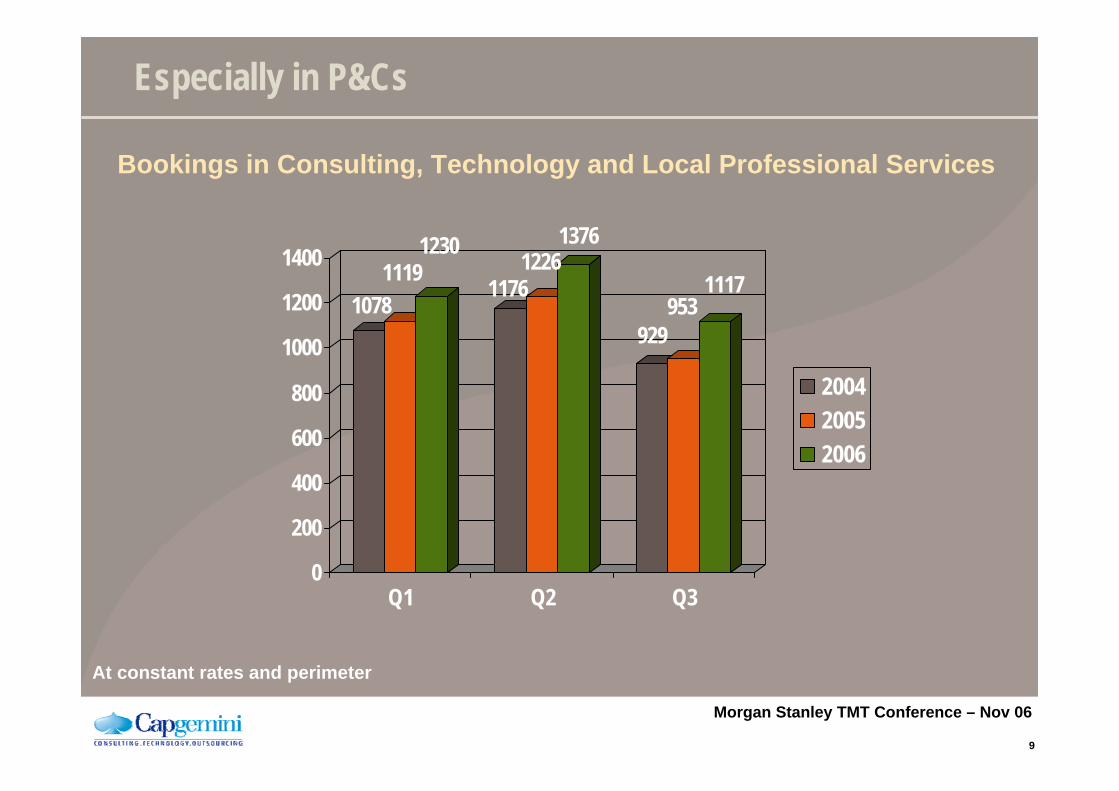
Especially in P&Cs
10781119
1230
11761226
1376
929953
1117
0
200
400
600
800
1000
1200
1400
Q1 Q2 Q3
200420052006
At constant rates and perimeter
Bookings in Consulting, Technology and Local Professional Services

10
Morgan Stanley TMT Conference – Nov 06
Outsourcing margin recovery plan

11
Morgan Stanley TMT Conference – Nov 06
The Margin Acceleration Plan was a key challenge for the year: we are on track
Creation of IM remote management center in Poland with 264 seats900 additional positions created in India since beginning ‘06
Mainframe and hardware rationalization in multiple regionsSoftware renegotiation within France and UKContractor price reductions in various countries and large accounts
Successful renegotiation of four service contractsEnding or already exited five service contractsBusiness extension or expansion within to improve overall account margin19/20 of 2005 bottom quartile accounts improved; nine fully profitable
Migration of internal F&A in UK to Rightshore™ location
People restructuring in select countriesClosure of sites in UK and Benelux regions
Objective: 8% Divisional MarginObjective: 8% Divisional Margin
Support FunctionSupport Function 1 – 1.5%1 – 1.5%
Rightshore™Rightshore™ 1.5 – 2%1.5 – 2%
IndustrializationIndustrialization 1 – 1.5%1 – 1.5%
ProcurementProcurement 1 – 1.5%1 – 1.5%
RenegotiationRenegotiation 0.5%0.5%
Business MixBusiness Mix TBDTBD
On TrackOn
Track
Achieved2006
Achieved2006
Achieved2006
Achieved2006
Visibility2007
Visibility2007
Visibility2007
Visibility2007
Acquisition of majority stake in Indigo, Unilever’s F&A platform in IndiaNIS outsourced to BTSold French Break/Fix business
LeversLeversMid-termDivisional
Margin Impact
Mid-termDivisional
Margin Impact

12
Morgan Stanley TMT Conference – Nov 06
Even though the Schneider contract was even more difficult thanexpected earlier in the year, we will meet our objectives
-0.2%
0.6%
H1 05
2.7%
5.6%
H2 05
3.3%
6.0%
H1 06
≃ 4.0%Including Schneider
≤ 7.0%Excluding Schneider
FY 06
Strong margin improvement excluding Schneider
Schneider still a significant drag on profitability
(at divisional margin level)

13
Morgan Stanley TMT Conference – Nov 06
Outsourcing will continue to be a key driver for our margin expansion
Objectives> 7.5% full year Divisional Margin (approximately 5.5% Operating Margin) excluding Schneider5 - 5.5% full year Divisional Margin including Schneider
Restructuring
€ 35 m
90%-95% Cash
20 month payback
14
Morgan Stanley TMT Conference – Nov 06
Investing for the future (I3)
15
Morgan Stanley TMT Conference – Nov 06
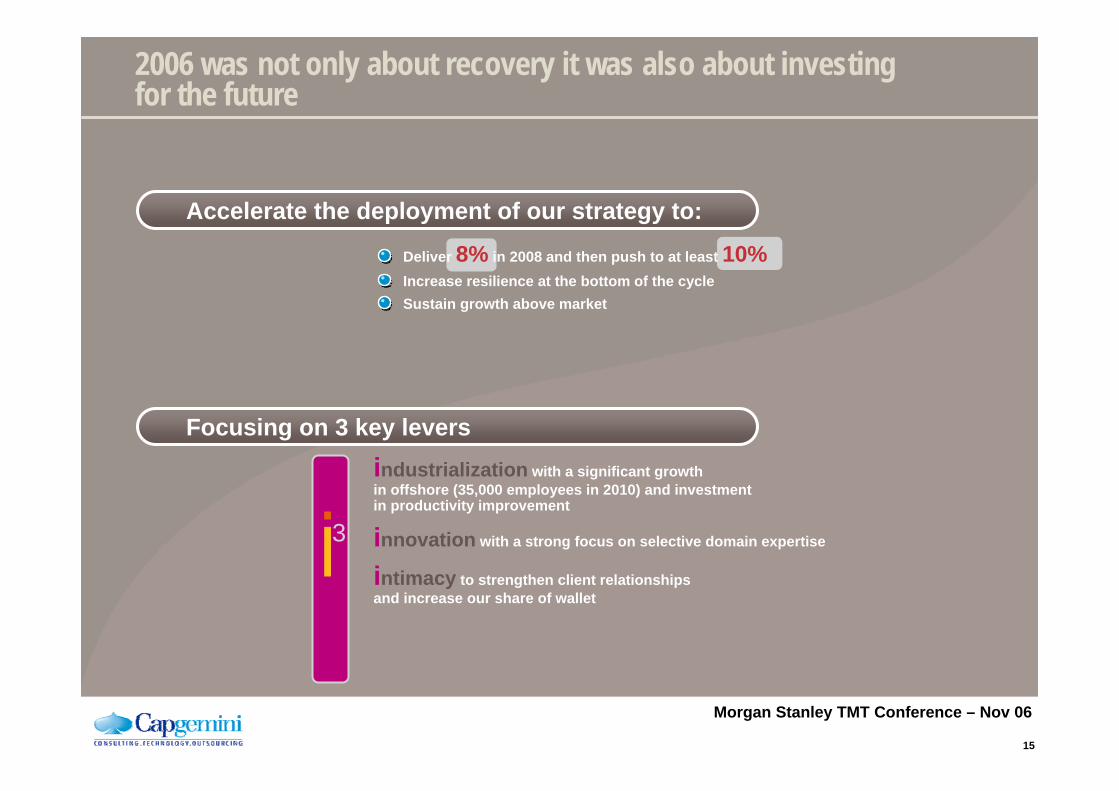
2006 was not only about recovery it was also about investingfor the future
3
Deliver 8% in 2008 and then push to at least 10%Increase resilience at the bottom of the cycleSustain growth above market
industrialization with a significant growth in offshore (35,000 employees in 2010) and investmentin productivity improvement
innovation with a strong focus on selective domain expertise
intimacy to strengthen client relationships and increase our share of wallet
Accelerate the deployment of our strategy to:
Focusing on 3 key levers
16
Morgan Stanley TMT Conference – Nov 06
Kanbay acquisition
17
Morgan Stanley TMT Conference – Nov 06
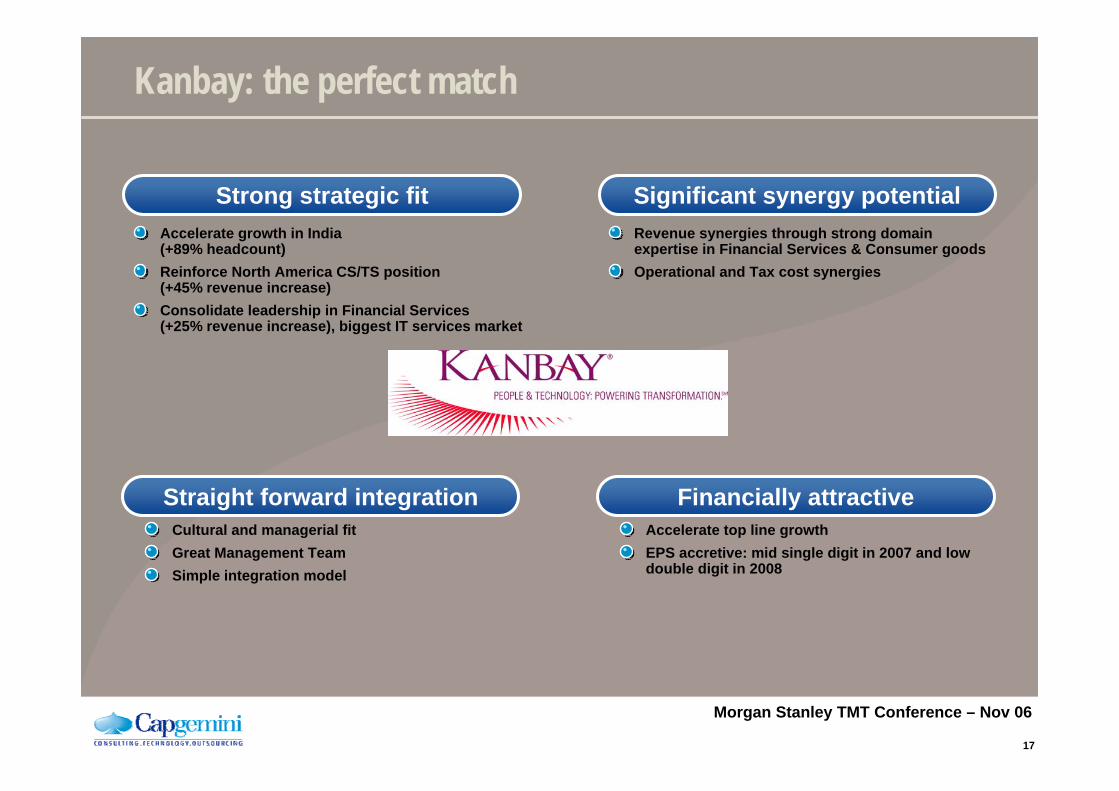
Kanbay: the perfect match
Revenue synergies through strong domain expertise in Financial Services & Consumer goodsOperational and Tax cost synergies
Cultural and managerial fitGreat Management TeamSimple integration model
Accelerate top line growthEPS accretive: mid single digit in 2007 and low double digit in 2008
Accelerate growth in India (+89% headcount)Reinforce North America CS/TS position(+45% revenue increase)Consolidate leadership in Financial Services (+25% revenue increase), biggest IT services market
Strong strategic fit Significant synergy potential
Straight forward integration Financially attractive

18
Morgan Stanley TMT Conference – Nov 06
Kanbay is not only about growing staff in India, it is also another way to use offshore
Strategic alignment with client businessIntegration of industry and technology expertise for innovativebusiness focused solutionsValue-based delivery modelSelf-enriching knowledge base
Value-BasedGlobal Delivery Model
Integrated Global Delivery Model
Basic Global Delivery ModelEasy to establish, low upfront planning needed
Requires high involvement from customer management “Over-the-wall” delivery process – “blame games” followHard concerns like rate, technology, skills are the primary drivers
Core project teams retained across projectsIntegrated usage of Kanbay near-shore, onsite, offshore and clientteams to maximize leverage – over 1:4Multi-layered relationship alignment between Kanbayand customers including goal-sharing
Next-Gen value based global delivery model
Engagement-based delivery leveraginghuman assets
Transactional project based onsite-offshoredelivery model

19
Morgan Stanley TMT Conference – Nov 06
As in any integration there are risks but everything is made to limit them
Preserve and leverage Kanbay deep domain expertise and growth momentum
Speed up integration by creating a Financial Services BU covering NA + UK + FS IndiaLed by Raymond Spencer reporting directly to Capgemini CEOFinancial Services India Platform to be leveraged by Capgemini European clients
Integrate Consumer Products business in Capgemini NACreate a Consumer Products BU led by Rodney Rogers reporting to Salil Parekh (CEO NA CS/TS)Kanbay to leverage Capgemini’s strong Indian platform
Financial services (5,500 FTE): Integrated with new Financial Services BUNon Financial Services (primarily current Capgemini India, 6,500 FTE)
Financial Services
North America Non Financial Services
Capgemini India*
*Estimated end 2006 headcount

20
Morgan Stanley TMT Conference – Nov 06
We are exiting 2006 with a strong business momentum
Outsourcing well on track to normality
The launch of marks the end of our turnaround story
Kanbay is a key investment for our future
Summary
3

Morgan Stanley TMT Conference Barcelona, November 17, 2006
Paul Hermelin, CEO