morgan stanley investor conference - anz personal … · 1 peter marriott. chief financial officer....
TRANSCRIPT

1
Peter MarriottChief Financial Officer
Morgan Stanley Investor ConferenceAustralia and New Zealand Banking Group Limited
November 2007
2
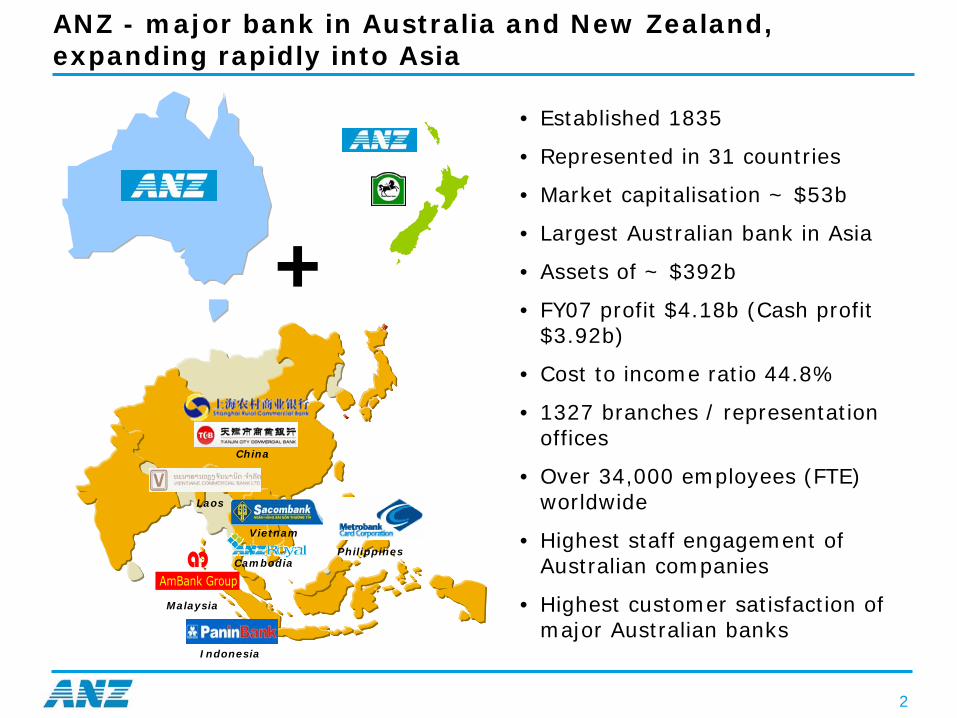
ANZ - major bank in Australia and New Zealand, expanding rapidly into Asia
• Established 1835
• Represented in 31 countries
• Market capitalisation ~ $53b
• Largest Australian bank in Asia
• Assets of ~ $392b
• FY07 profit $4.18b (Cash profit $3.92b)
• Cost to income ratio 44.8%
• 1327 branches / representation offices
• Over 34,000 employees (FTE) worldwide
• Highest staff engagement of Australian companies
• Highest customer satisfaction of major Australian banks
China
Vietnam
Cambodia
Malaysia
Philippines
Indonesia
Laos
+

3
Our 2007 Annual Result
Headline profit - $4,180m 13.3%
Cash* profit - $3,924m 9.4%
Revenue Growth 12.1% (10.1%*)
Cash* Profit Before Provisions (PBP) 11.5%
Cash* EPS 8.1%
Dividend 8.8%
Highest growth in revenue and PBP for many years
$1b DRP underwrite reinstates capital ratios for recent acquisitions and enhances flexibility at low cost
*adjusts headline numbers significant items & inc integration costs & fair value hedge gains/losses, acquisitions & disposals and FX translation movements
Sep 07 v Sep 06

4
Most businesses delivered excellent results…
Australia New Zealand Asia/Pac Other
Retail
Institutional /Business
Wealth / Asia Partnerships
15%
6%
45%
12% 7% 26% 15%PBP
Growth
% of Group PBP
PBP Growth
15%
11%
33%
13%
-13%
20%
37%
27%
4%
14%
4%
<1%
3%
17%
15%
210%
-27%
1%
3%
1%
Note: excludes Corporate Centre and non-continuing businesses
Insto
Institutional
Corp & Comm 4%
13%
5
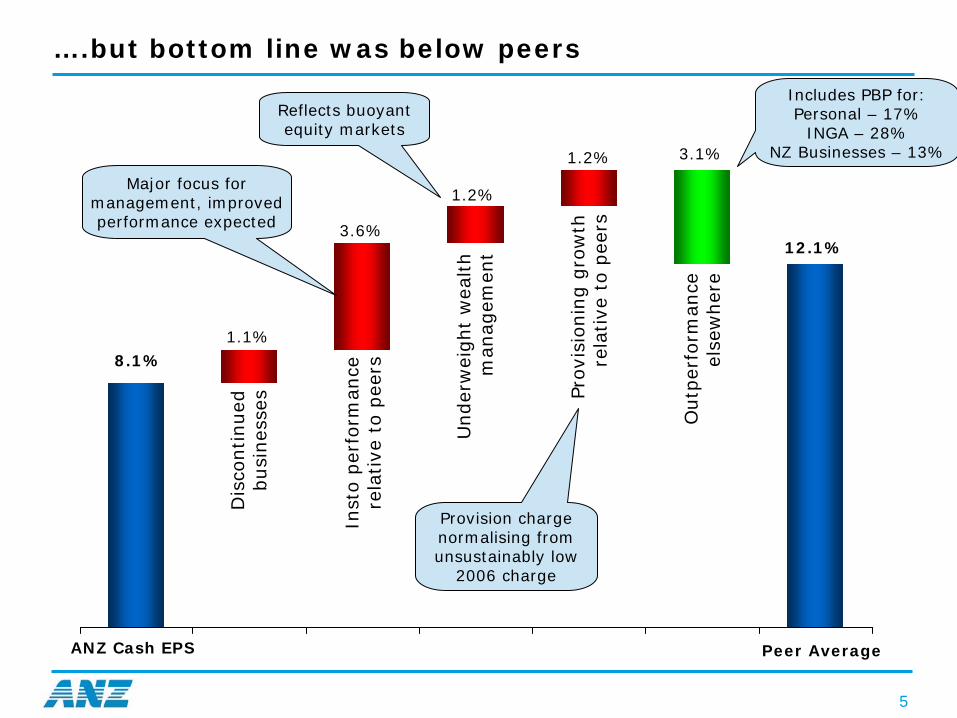
….but bottom line was below peers
8.1%
12.1%
1.1%
Pro
visi
onin
g g
row
th
rela
tive
to p
eers
Inst
o p
erfo
rman
ce
rela
tive
to p
eers
3.6%D
isco
ntinued
busi
nes
ses
Under
wei
ght
wea
lth
man
agem
ent
1.2%
1.2% 3.1%
Outp
erfo
rman
ce
else
wher
e
ANZ Cash EPS Peer Average
Major focus for management, improved performance expected
Reflects buoyant equity markets
Provision charge normalising from unsustainably low
2006 charge
Includes PBP for: Personal – 17%
INGA – 28%NZ Businesses – 13%

6
Personal – continues to provide superior performance
*Source: Roy Morgan Research – Aust MFI Pop’n aged 14+, % Satisfied (Very or Fairly Satisfied), 6 mth moving average
55
60
65
70
75
80
Aug-00
Aug-01
Aug-02
Aug-03
Aug-04
Aug-05
Aug-06
Aug-07
%
ANZ Peer 1 Peer 2 Peer 3
A leader in customer satisfaction(Main Financial Institution: 6 months rolling*)
15%
22%
17%17%
14%15%
16%16%
FY04 FY05 FY06 FY07
Profit Before Provisions NPAT
And a track record of strong financial performance
NPAT benefiting from lower
provisioning charge
7
42
46
50
54
58
62
66
70
74
78
82
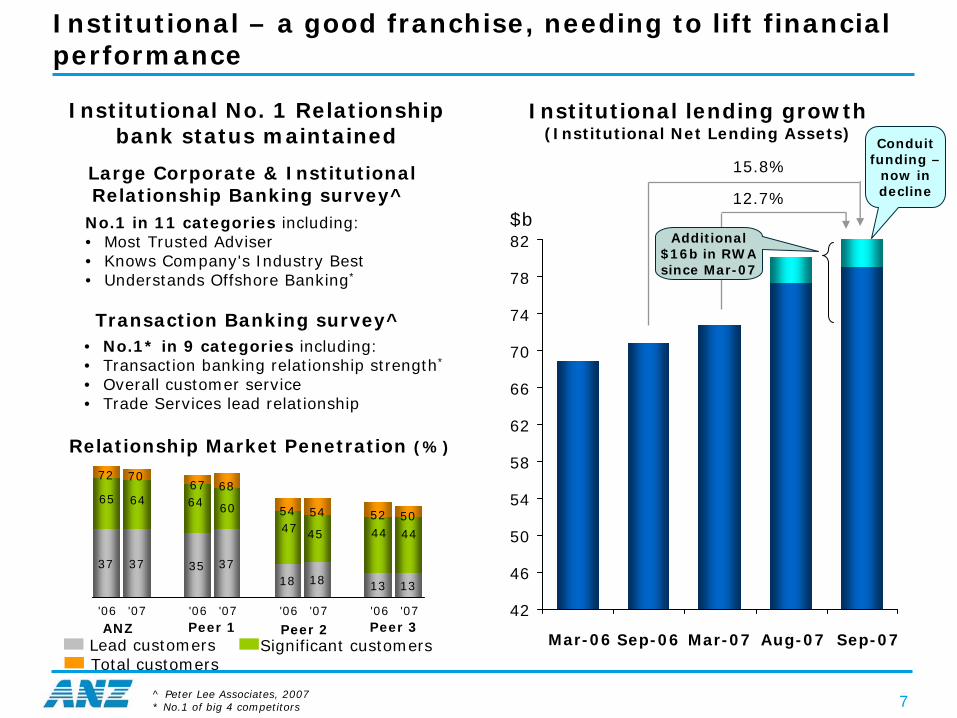
Institutional – a good franchise, needing to lift financial performance
Institutional lending growth(Institutional Net Lending Assets)
$b
Conduit funding –
now in decline
15.8%
12.7%
Additional $16b in RWA since Mar-07
Sep-06 Mar-07 Aug-07 Sep-07
37 3518 13
54
68
52
6772
54 50
70
44
65 64
47
6460
45 44
37 3718 13
'06 '07 '06 '07 '06 '07 '06 '07
No.1 in 11 categories including:• Most Trusted Adviser • Knows Company's Industry Best • Understands Offshore Banking*
Large Corporate & Institutional Relationship Banking survey^
Transaction Banking survey^
Total customersSignificant customersLead customers
ANZ Peer 1 Peer 3Peer 2
Relationship Market Penetration (%)
• No.1* in 9 categories including:• Transaction banking relationship strength*
• Overall customer service• Trade Services lead relationship
Institutional No. 1 Relationship bank status maintained
^ Peter Lee Associates, 2007 * No.1 of big 4 competitors
Mar-06

8
0%
10%
20%
30%
40%
Dec-04 Jun-05 Dec-05 Jun-06 Dec-06 Jun-07
ANZN Peer 1 Peer 2
Peer 3 Peer 4
New Zealand – very strong market position
Continuing to generate revenue at almost twice that of major peers
(Share of Revenue*)
*Source: Bank General Disclosure Statements to June 2007. Net Operating income normalised for one offs and IFRS-related changes in hedge valuations
Mortgage market share now growing
(Mortgages market share**)
5%
10%
15%
20%
25%
30%
Dec-04 Jun-05 Dec-05 Jun-06 Dec-06 Jun-07
NBNZ Share of growth NBNZ Market Share
ANZ Share of growth ANZ Market Share
**3 month rolling average
9
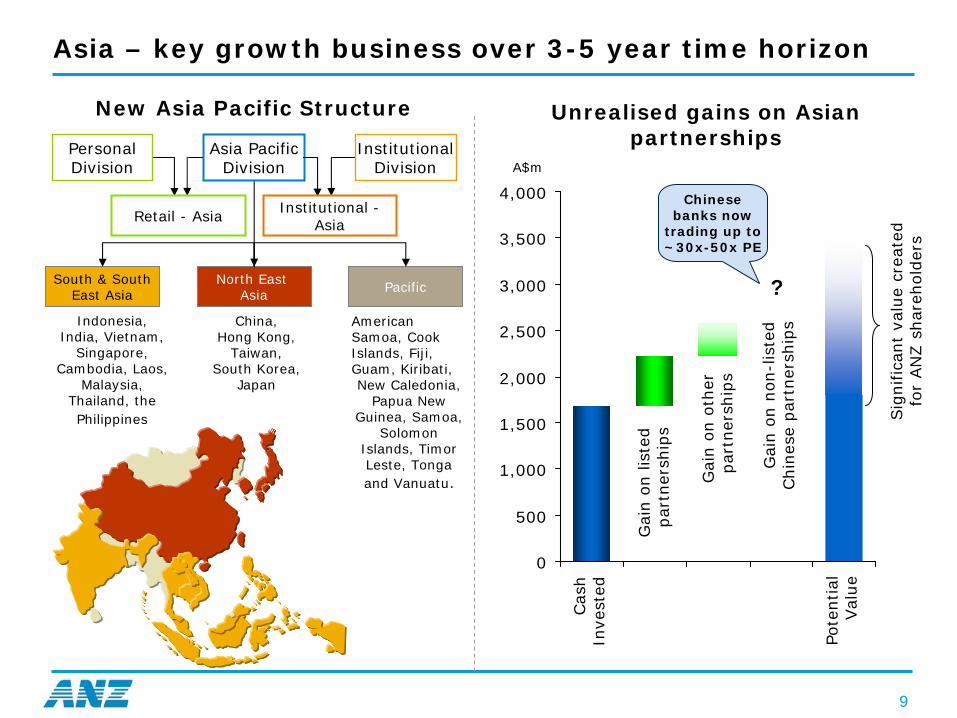
Asia – key growth business over 3-5 year time horizon
Unrealised gains on Asian partnerships
0
500
1,000
1,500
2,000
2,500
3,000
3,500
4,000
A$m
Gai
n o
n lis
ted
par
tner
ship
s
Gai
n o
n n
on-l
iste
dChin
ese
par
tner
ship
s
Gai
n o
n o
ther
par
tner
ship
s
Sig
nific
ant
valu
e cr
eate
d
for
AN
Z s
har
ehold
ers
Chinese banks now
trading up to ~30x-50x PE
Cas
hIn
vest
ed
Pote
ntial
Val
ue
?China,
Hong Kong, Taiwan,
South Korea, Japan
PacificNorth East Asia
South & South East Asia
Asia Pacific Division
Indonesia, India, Vietnam,
Singapore, Cambodia, Laos,
Malaysia, Thailand, the Philippines
American Samoa, Cook Islands, Fiji, Guam, Kiribati,New Caledonia,
Papua New Guinea, Samoa,
Solomon Islands, Timor Leste, Tonga and Vanuatu.
New Asia Pacific Structure
Retail - Asia Institutional - Asia
Institutional Division
Personal Division
10
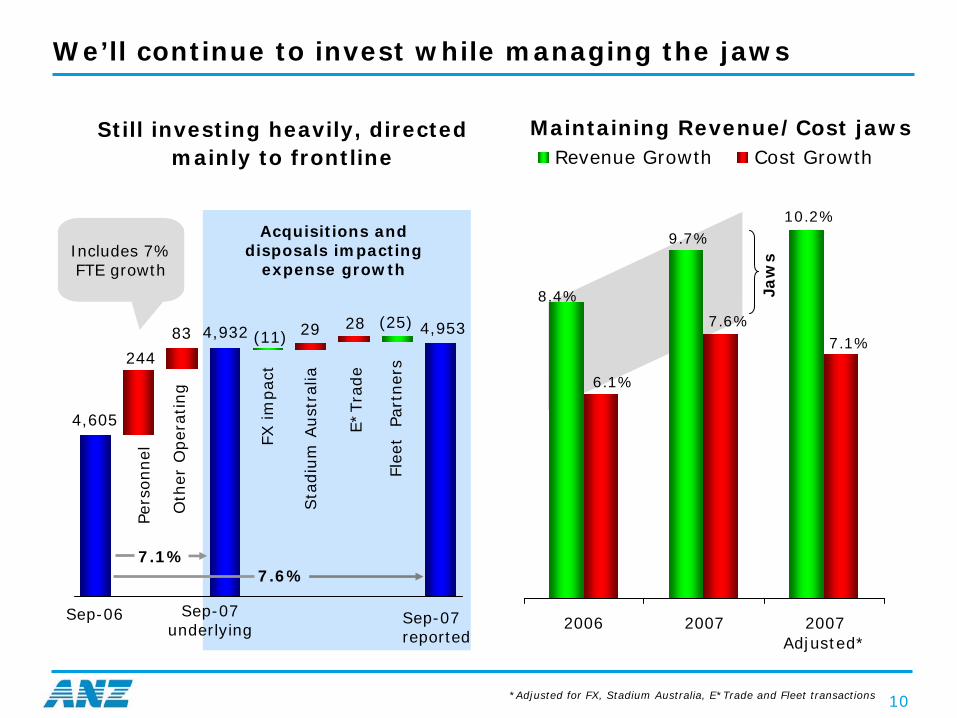
We’ll continue to invest while managing the jaws
Jaw
s
4,605
4,932 4,953(25)2829(11)83
244
Pers
onnel
Oth
er O
per
atin
g
FX im
pac
t
E*Tra
de
Sta
diu
m A
ust
ralia
Sep-07 underlying
Sep-06 Sep-07 reported
Acquisitions and disposals impacting
expense growthIncludes 7% FTE growth
Still investing heavily, directed mainly to frontline
7.6%7.1%
Flee
t P
artn
ers
8.4%
9.7%10.2%
6.1%
7.6%7.1%
2006 2007 2007Adjusted*
Revenue Growth Cost Growth
*Adjusted for FX, Stadium Australia, E*Trade and Fleet transactions
Maintaining Revenue/Cost jaws

11
182197
255
360349
229
0
50
100
150
200
250
300
350
400
FY03 FY04 FY05 FY06 FY07 FY07Plan
Individual Provisions increased in line with expectations
$m
Consumer IPs trending up with volume growth
<5m 5m-10m 10m-20m20m-40m 40m+
80
100
160179
165
0
50
100
150
200
FY03 FY05 FY07
With more normalised levels of commercial writebacks and recoveries
290255
424
347285
0
100
200
300
400
500
FY03 FY04 FY05 FY06 FY07
$m
$m
“New & Increased” commercial IP’s higher as expected…
105
60
1H07 2H07
Unusually large recovery not
repeated
12
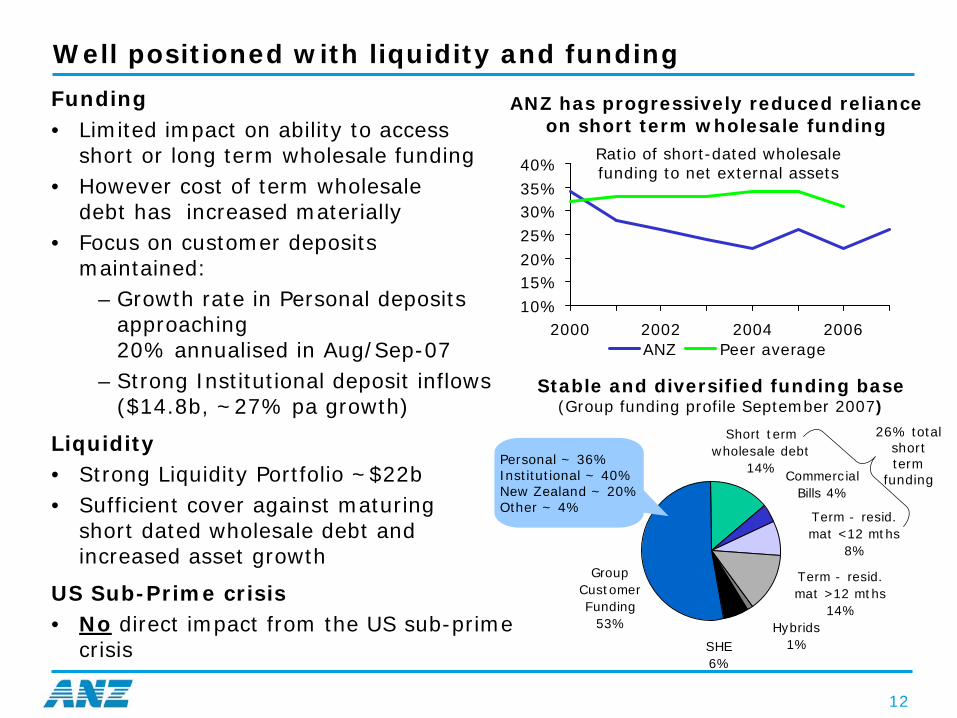
Well positioned with liquidity and funding
Funding• Limited impact on ability to access
short or long term wholesale funding• However cost of term wholesale
debt has increased materially • Focus on customer deposits
maintained:– Growth rate in Personal deposits
approaching 20% annualised in Aug/Sep-07
– Strong Institutional deposit inflows ($14.8b, ~27% pa growth)
Liquidity• Strong Liquidity Portfolio ~$22b • Sufficient cover against maturing
short dated wholesale debt and increased asset growth
US Sub-Prime crisis• No direct impact from the US sub-prime
crisis
10%15%20%25%30%35%40%
2000 2002 2004 2006ANZ Peer average
ANZ has progressively reduced reliance on short term wholesale funding
Ratio of short-dated wholesale funding to net external assets
Group Customer Funding
53%
SHE6%
Short term wholesale debt
14%Commercial
Bills 4%
Term - resid. mat <12 mths
8%
Term - resid. mat >12 mths
14%Hybrids
1%
26% total short term
funding
Personal ~ 36%Institutional ~ 40%New Zealand ~ 20%Other ~ 4%
Stable and diversified funding base(Group funding profile September 2007)

13
-34-29
-7.1
-40
-30
-20
-10
0
AN
ZA
dvance
dIR
B
Aust
Majo
rsA
vera
ge
G10
majo
rbank
avera
ge
QIS 5 results
%
Basel II impacts – reduction in RWA expected in 2008, but how much benefit offset by capital changes?
Reduction in RWAs still unclear
CAPITAL
RWA
Draft prudential standard impacting capital(Tier 1 proposed capital impacts)
Current Tier 1 Adjusted Tier 1 before RWA benefit
Loss
of AIF
RS
tran
sitional
rel
ief
50%
of
“Tota
l Cap
ital
”ded
’nch
anges
Low
er
Hyb
rid
capac
ity
CP d
efer
red
tax
and
Base
l EL
• Downturn LGDs and LGD floors imposed by APRA
• Downturn LGD factors on all exposures, not just those with high PD/LGD correlations
• Subject to final ratification by APRA
=Capital Ratio
Other factorsRating Agency view?
Plus loss of CP in
total capital

14
DRP underwrite – reinstates capital ratios for recent acquisitions and enhances flexibility at low cost
%
4.81 (0.52)
4.29
0.35 4.64
Pro forma
2007 Actual
2007 pre-acquisitions
ACE Ratio
Net
acq
uis
itio
ns
DRP U
nder
write
Preferred operating range
3.00
3.25
3.50
3.75
4.00
4.25
4.50
4.75
5.00
ACE target
The rationale• $1.5b investments in past 12
months funded internally
+• Stronger than expected growth
in RWA towards end of year (~$8b above expectations in past 6 months)
+• Lower expected benefits from
Basel II
+• Enhances strategic flexibility
• Ability to make modest infill acquisitions if opportunities arise (eg E*TRADE & Saigon Securities Incorporation)
• Ability to take advantage of lending opportunities presented by market disruption

15
Summary
9
Digging a little deeper in to where we performed (or not)
Australia New Zealand Asia/Pac Other
Retail
Institutional /Business
Wealth / Asia Partnerships
15%
6%
45%
12% 7% 26% 15%PBP
Growth
% of Group PBP
PBP Growth
15%
11%
33%
13%
-13%
20%
37%
27%
4%
14%
4%
<1%
3%
17%
15%
210%
-27%
1%
3%
1%
Note: excludes Corporate Centre and non-continuing businesses
Insto
Institutional
Corp & Comm 4%
13%
8
Personal – continues to provide superior performance
*Source: Roy Morgan Research – Aust MFI Pop’n aged 14+, % Satisfied (Very or Fairly Satisfied), 6 mth moving average
55
60
65
70
75
80
85
Aug-00
Aug-01
Aug-02
Aug-03
Aug-04
Aug-05
Aug-06
Aug-07
%
ANZ Peer 1 Peer 2Peer 3 Peer 4
A leader in customer satisfaction(Main Financial Institution: 6 months rolling*)
15%
22%
17%17%
14%15%
16%16%
FY04 FY05 FY06 FY07
Profit Before Provisions NPAT
And a track record of strong financial performance
NPAT benefiting from lower
provisioning charge
Personal – great franchise, positive outlook
9
Institutional – a good franchise, needing to lift financial performance
42
46
50
54
58
62
66
70
74
78
82
Institutional lending growth(Institutional Net Lending Assets)
$b
Conduits – now in decline
15.8%
12.7%
Additional $16b in RWA since Mar-07
Sep-06 Mar-07 Jul-07 Aug-07 Sep-07
37 3518 13
54
68
52
6772
54 50
70
44
65 64
47
6460
45 44
37 3718 13
'06 '07 '06 '07 '06 '07 '06 '07
No.1 in 11 categories including:• Most Trusted Adviser • Knows Company's Industry Best • Understands Offshore Banking*
Large Corporate & Institutional Relationship Banking survey^
Transaction Banking survey^
Total customersSignificant customersLead customers
ANZ Peer 1 Peer 3Peer 2
Relationship Market Penetration (%)
• No.1* in 9 categories including:• Transaction banking relationship strength*
• Overall customer service• Trade Services lead relationship
Institutional No. 1 Relationship bank status maintained
^ Peter Lee Associates, 2007 * No.1 of big 4 competitors
10
New Zealand – Very strong market position
10
New Zealand – Very strong market position
11
Asia – Key growth business over 5 year time horizon
Unrealised gains on Asian partnerships
0
500
1,000
1,500
2,000
2,500
3,000
3,500
4,000
A$m
Gai
n o
n lis
ted
part
ners
hip
s
Gai
n o
n n
on-l
iste
dChin
ese
par
tner
ship
s
Gai
n o
n o
ther
part
ner
ship
s
Sig
nific
ant
valu
e cr
eat
ed
for
AN
Z s
har
ehold
ers
Chinese banks now
trading up to ~30x-50x PE
Cas
hIn
vest
ed
Pote
ntial
Val
ue
?China,
Hong Kong, Taiwan,
South Korea, Japan
PacificNorth East Asia
South & South East Asia
Asia Pacific Division
Indonesia, India, Vietnam,
Singapore, Cambodia, Laos,
Malaysia, Thailand, the Philippines
American Samoa, Cook Islands, Fiji, Guam, Kiribati,New Caledonia,
Papua New Guinea, Samoa,
Solomon Islands, Timor Leste, Tonga and Vanuatu.
New Asia Pacific Structure
Retail - Asia Institutional -Asia
Institutional Division
Personal Division
New Zealand – very strong position, solid performance
Institutional – good franchise, upside ahead
Asia/Pacific – performing well, expected to accelerate
Majority of businesses performing very well - underperformance in isolated pockets
Well positioned with capital, liquidity and fundingNo direct impact from the sub-prime crisis
12
Well positioned with liquidity and funding
Funding• Limited impact on ability to access
short or long term wholesale funding• However cost of term wholesale
debt has increased materially • Focus on customer deposits
maintained:– Growth rate in Personal deposits
approaching 20% annualised in Aug/Sep-07
– Strong Institutional deposit inflows ($14.8b, ~27% pa growth)
Liquidity• Strong Liquidity Portfolio ~$22b • Sufficient cover against maturing
short dated wholesale debt and increased asset growth
US Sub-Prime crisis• No direct impact from the sub-prime
crisis
10%15%20%
25%
30%35%40%
2000 2002 2004 2006ANZ Peer average
ANZ has progressively reduced reliance on short term wholesale funding
Ratio of short-dated wholesale funding to net external assets
Group Customer Funding
53%
SHE6%
Short term wholesale debt
14%Commercial
Bills 4%
Term - resid. mat <12 mths
8%
Term - resid. mat >12 mths
14%Hybrids
1%
26% total short term
funding
Personal ~ 36%Institutional ~ 40%New Zealand ~ 20%Other ~ 4%
Stable and diversified funding base(Group funding profile September 2007)
12
Well positioned with liquidity and funding
Funding• Limited impact on ability to access
short or long term wholesale funding• However cost of term wholesale
debt has increased materially • Focus on customer deposits
maintained:– Growth rate in Personal deposits
approaching 20% annualised in Aug/Sep-07
– Strong Institutional deposit inflows ($14.8b, ~27% pa growth)
Liquidity• Strong Liquidity Portfolio ~$22b • Sufficient cover against maturing
short dated wholesale debt and increased asset growth
US Sub-Prime crisis• No direct impact from the sub-prime
crisis
10%
15%20%25%
30%35%40%
2000 2002 2004 2006ANZ Peer average
ANZ has progressively reduced reliance on short term wholesale funding
Ratio of short-dated wholesale funding to net external assets
Group Customer Funding
53%
SHE6%
Short term wholesale debt
14%Commercial
Bills 4%
Term - resid. mat <12 mths
8%
Term - resid. mat >12 mths
14%Hybrids
1%
26% total short term
funding
Personal ~ 36%Institutional ~ 40%New Zealand ~ 20%Other ~ 4%
Stable and diversified funding base(Group funding profile September 2007)
16
The material in this presentation is general background information about the Bank’s activities current at the date of the presentation. It is information given in summary
form and does not purport to be complete. It is not intended to be relied upon as advice to investors or potential investors and does not take into account the investment
objectives, financial situation or needs of any particular investor. These should be considered, with or without professional advice when deciding if an investment is
appropriate.
For further information visit
www.anz.comor contact
Stephen HigginsHead of Investor Relations
ph: (613) 9273 4185 fax: (613) 9273 4091 e-mail: [email protected]