morgan stanley global chemicals, agriculture & packaging
TRANSCRIPT

Morgan Stanley Global Chemicals, Agriculture & Packaging Conference
November 12, 2019
RPM International Inc.
Russell L. Gordon, Vice President & Chief Financial OfficerScott Copeland, Senior Director – Planning and
Financial Analysis
Forward-Looking Statements & Regulation G
This presentation contains “Forward-Looking Statements” as defined in the Private Securities Litigation ReformAct of 1995. Actual results may differ materially from expectations and are subject to certain risks anduncertainties such as those described in RPM’s periodic reports and statements filed with the Securities andExchange Commission and available through the company’s website, www.rpminc.com. We do not undertakeany obligation to publicly update or revise any forward-looking statements to reflect future events, informationor circumstances that arise after the date of this presentation.
This presentation includes certain company data that do not directly conform to generally accepted accountingprinciples, or GAAP, and certain company data that has been restated for improved clarity, understanding andcomparability, or pro forma. All non-GAAP data in this presentation are indicated by footnote. Tablesreconciling such data with GAAP measures are available through our website, www.rpminc.com under InvestorInformation/Presentations.
11/12/2019 2

A world leader in specialty coatings, sealants, building materials and related services.
MANUFACTURING FACILITIES IN 26 COUNTRIESFOUNDED: 1947
HEADQUARTERS: Medina, OH
STOCK LISTING: NYSE(Symbol: RPM)
FISCAL 2019 SALES: $5.6 Billion
SALES LOCATIONS: 171 countries and territories
EMPLOYEES: 15,000
DIVIDEND RECORD
STOCKHOLDERS(percent of total shares)
46consecutive years
of dividend increases
Institutional: 81%693 Institutions
Individual: 19%139,431 Individuals
Q U I C K FA C T S
RPM At A Glance
11/12/2019 3

HISTORY OF ENTREPRENEURIAL
GROWTH
Extraordinary 72-year history
of growth, innovation and value creation with the reputation as best
home for entrepreneurial companies
2020 MAP TO GROWTH
Transforming RPM into a more connected and
efficient company focused on operational
excellence and continuous improvement
BUILDING A BETTER RPM
Combining entrepreneurial legacy
and the discipline of continuous
improvement driving operational excellence
Positioning RPM for the Next Level of Growth & Value Creation
11/12/2019 4

Entrepreneurial Operating Philosophy • Competitive Advantage of Leading Brands • Balance Between Consumer and Industrial Markets • Growth Strategy Balanced Between Internal Investment and
Acquisitions • Connections Creating Value • Sustainable Shared Value
Industrial Segment $2.9 billion (52%)
Consumer Segment $1.9 billion (34%)
Specialty Segment $800 million (14%)
$5.6 billion (May 31, 2019)
World Leader in Coatings, Sealants and Building Materials
11/12/2019 5

CONSUMERGROUP
PERFORMANCECOATINGS GROUP
CONSTRUCTIONPRODUCTS GROUP
SPECIALTYPRODUCTS GROUP
Entrepreneurial Approach to Customers with Leading Brands Driving Innovation and GrowthCenter-Led in Operations and Administration, Driving Efficiency and Continuous Improvement
Value of 168: Transparency, Trust & Respect
FY19 SALES: $5.6 BILLION
Proforma Sales: $1.9 billion - 34%
Proforma Sales: $1.9 billion - 34%
Proforma Sales: $1.1 billion - 20%
Proforma Sales: $0.7 billion - 12%
Operating Groups Drive Growth & Efficiency Through Four Reportable Segments
11/12/2019 6

Construction Products GroupOverview
FISCAL 2019 PROFORMA SALES:
$1.9 BILLION34% of RPM total
PRODUCT CATEGORIES• Construction Sealants &
Adhesives• Coatings & Chemicals• Roofing Systems• Concrete Admixture & Repair
Products• Building Envelope Solutions• Insulated Cladding• Flooring Systems• Waterproofing Solutions
APPLICATIONS
Industrial, commercial and infrastructure
DISTRIBUTION
Sold to distributors, contractors and direct to
end-users
GEOGRAPHIC FOOTPRINT
Worldwide, with particular concentration in the Americas and Europe
BUILDING ENVELOPEAir | Moisture | Thermal
• 6 sides of the Building• Floor (seamless)
• Fire protection
INFRASTRUCTUREConcrete | Concrete Protection
• Bridge• Rail• Transit• Highway
• Tunnel• Water• Power
TARGET MARKETS
11/12/2019 7
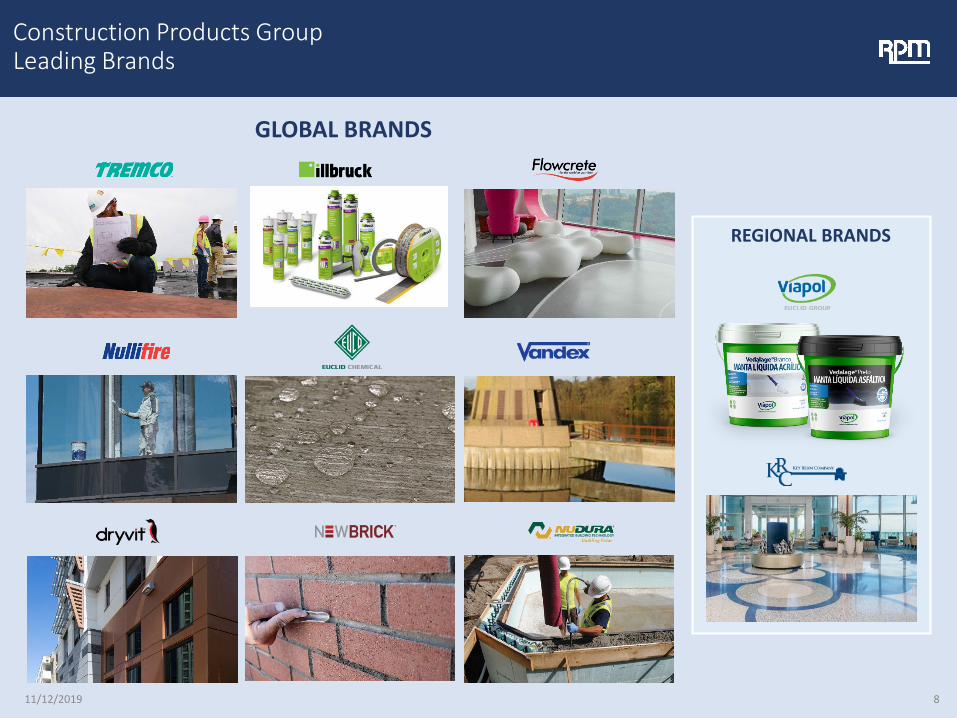
Construction Products GroupLeading Brands
GLOBAL BRANDS
REGIONAL BRANDS
11/12/2019 8

FISCAL 2019 PROFORMA SALES:
$1.1 BILLION20% of RPM total
APPLICATIONS
Industrial and commercial
DISTRIBUTION
Sold to contractors and distributors, as well as directly to
end-users through a unique supply-and-apply model serving
manufacturers, public institutions and commercial
customers
GEOGRAPHIC FOOTPRINT
Worldwide, spanning approximately 120
countries and territories with 55-60% of sales in the
U.S.
Performance Coatings GroupOverview
PRODUCT CATEGORIES:• High-Performance Flooring
Solutions• Corrosion Control &
Fireproofing Coatings• Infrastructure Repair
Systems• Fiberglass Reinforced
Plastic Gratings• Drainage Systems
TARGET MARKETS:• Manufacturing • Bridge & Highway• Food & Beverage• Metals & Mining
• Commercial Spaces• Pharmaceutical• Power• Offshore Oil & Gas
• Petrochemical• Transportation• Marine• Healthcare
• Water Wastewater• Technology• Pulp & Paper• Renewable Energy
11/12/2019 9

Performance Coatings GroupLeading Brands
FIREPROOFING SYSTEMS FLOORS FOR COMMERCIAL SPACES BUILDING MAINTENANCE SERVICES RAILINGS
RESURFACING & REPAIRING BRIDGES FIBERGLASS REINFORCED PLASTIC GRATINGSSANITARY FLOORS FOOD & BEVERAGEPROTECTIVE COATINGS
COATINGS FLOOR SYSTEMS INFRASTRUCTURE FRP GRATING
11/12/2019 10

APPLICATIONS
Home maintenance and improvement
DISTRIBUTION
Sold through home improvement centers,
hardware and paint stores, mass merchants and craft
shops
GEOGRAPHIC FOOTPRINT
Primarily in North America, with an increasing presence in Europe, Australia, South Africa and South America
Consumer GroupOverview
FISCAL 2019 PROFORMA SALES:
$1.9 BILLION34% of RPM total
PRODUCT CATEGORIES:• Small-Project Paints & Coatings• Primers, Caulks & Sealants• Hobby & Craft Products• Specialty Coatings• Wood Stains & Finishes• Wall & Wood Repair Products• Household Cleaners & Stain Removers• Floor Finishing Systems• Plumbing & Water Cleanup Solutions
TARGET MARKETS:• Do-it-Yourself• Makers• Professionals
• Contractors• Architects• Designers
• Industrial• Property & facility
managers
11/12/2019 11

Consumer GroupLeading Brands
#1 Supplier in the Small Project
Paint Category Worldwide
#1 Caulk & Sealant Supplier in North America
Fastest Growing Supplier of Wood Finishes in North
America
#1 Primer Brand in Customer Satisfaction
among Professionals in North America
#1 Brand of Wall Repair and
Spackle in North America
11/12/2019 12

APPLICATIONS
Niche protection, restoration,
improvement and enhancement
DISTRIBUTION
Sold to contractors and distributors, as well as directly to end-users
GEOGRAPHIC FOOTPRINT
Primarily in the United States, with a growing presence
throughout Europe
Specialty Products GroupOverview
FISCAL 2019 PROFORMA SALES:
$0.7 BILLION12% of RPM total
PRODUCT CATEGORIES:• Fluorescent Pigments• Wood Stains, Finishes &
Treatments• Powder Coatings• Marine Coatings• Restoration & Cleaning
Solutions• Specialty OEM Coatings• Edible Coatings
TARGET MARKETS:• Food, Pharm,
Cosmetics• Furniture &
Cabinetry• Packaging, Safety
Equipment, Apparel
• Appliance, Auto, Marine, Construction
• Marine, Fuel, Furniture Protection, Cosmetics
• Agriculture, Forestry, Lumber
• Restoration & Cleaning Equipment & Chemicals
11/12/2019 13

Specialty Products GroupLeading Brands
#1 Supplier of Daylight
Fluorescent Colorants Worldwide
World Leading Distributor of Professional
Restoration and Cleaning Solutions
#1 in North America for Professional Touch-up and
Repair Products for Furniture and
Cabinetry
Global Market Leader in Water-
Based, Antifouling Paints for the
Marine Industry
11/12/2019 14

2020 MAP to Growth Overview
PURPOSETo position RPM for sustained, profitable growth creating superior value for its customers, entrepreneurs, associates and shareholders.
VISIONTo transform RPM into a more connected and efficient company focused on operational excellence and continuous improvement, while maintaining the strengths of its entrepreneurial culture.
Maintain Entrepreneurial Growth Culture
Align to Execute
Increase Operational Efficiency
• $6.25 bb Revenues
• $1.0 bb EBIT on an annualized run rate
• $1.5 bb Return of Capital
GOALSBy May 31, 2021, RPM is
targeting improvements to:
11/12/2019 15

Opportunities to improve: Yields with better package fill control and material composition of finished goods
OEE (Overall Equipment Effectiveness) via engineered availability improvement
Capacity usage and strengthen new product development, service and cost efficiency
Culture by focusing on continuous improvement
Optimize asset base: Fewer and more efficient plants
• Where appropriate, serving multiple companies across RPM operations and across groups
Human capital
Investment capital
Our Manufacturing Has Prioritized Obsessive Customer Service Over Efficiency
– We Can Do Both
Center-Led Manufacturing Strategy
11/12/2019 16

CENTER-LEDA central group to coordinate procurement, leverage spending, set policy, maintain master material lists and share leading practices.
Global Procurement
Operating Group Purchasing
These areas represent over $1.5 billion of addressable spend, presenting significant opportunities for margin improvement
Initiative Categories Key Levers
CHEMICALS Structured sourcing process, value engineering, specification standardization, in-sourcingPACKAGING
OTHER/INDIRECT New suppliers, MRO, facilities, and administrative spend
IN-FLIGHT PROJECTS Distributor consolidation, direct sourcing, price level
Center-Led Procurement Strategy
11/12/2019 17

4 IT CENTERS OF EXCELLENCE AREAS
1 IT EXECUTIVE OVERSIGHT COMMITTEE (ITEOC)
Corporate Driven Center-Led IT Expedite the integration
of our organization from 45 ERP platforms running
on 75 separate instances to 4 primary group centered
ERP systems
Corporate Driven Centralized and Regional Shared Service Centers
Reduce the number of -• Legal entities (364),• Auditable entities (163) and,• Accounting locations (104) to
centralized and regional accounting and administration centers
Center-Led Organizationworking with our
4 operating groups to reduce complexity, become more efficient, and improve
the control environment for finance, accounting and IT
Center-Led Accounting, IT and Administration Strategy
11/12/2019 18

MAP to Growth Wave 1 Key Achievements: Manufacturing
• Identified and executed on targeted $25 mm in annualized savings
• Closed 12 plants• Instituted common reporting process• Instilling continuous improvement culture
MANUFACTURING
11/12/2019 19
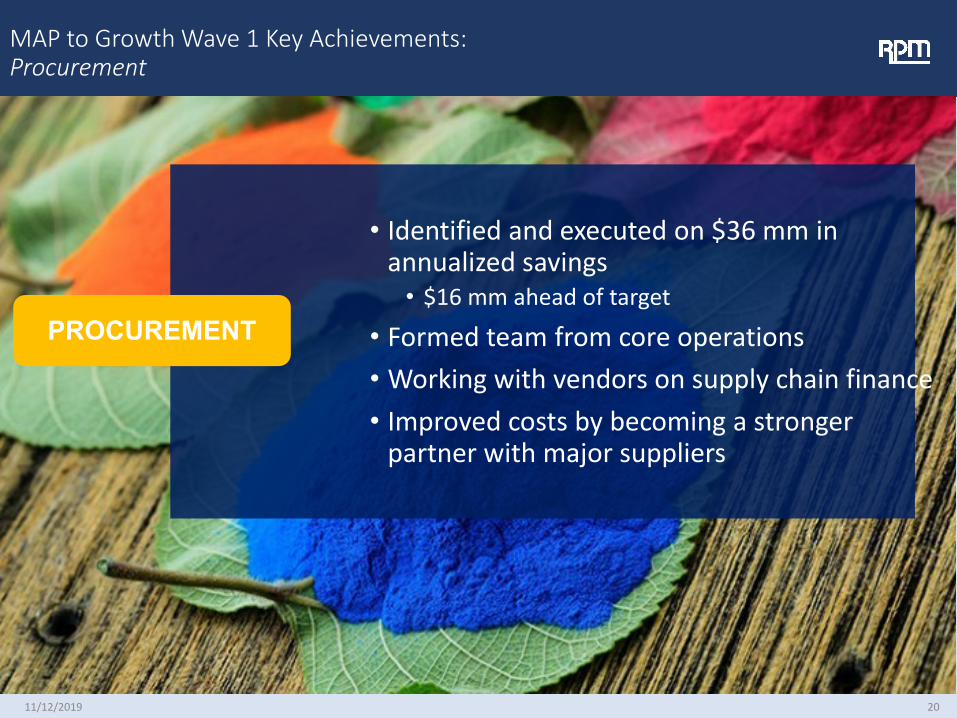
MAP to Growth Wave 1 Key Achievements: Procurement
• Identified and executed on $36 mm in annualized savings
• $16 mm ahead of target
• Formed team from core operations• Working with vendors on supply chain finance• Improved costs by becoming a stronger
partner with major suppliers
PROCUREMENT
11/12/2019 20

G&A
MAP to Growth Wave 1 Key Achievements: G&A
• Identified and executed on $41 mm in annualized savings
• $3 mm ahead of target
• Reduced more than 600 positions*• Closed 20 warehouses and non-plant locations• Implementation of shared service center• One-third of ERP consolidations complete
*Represents reductions across all functional areas
11/12/2019 21

$290
$25$20
$38
$25
$36
$41
WAVE 1Sept 2018 – May 2019
WAVE 2June 2019 – May 2020
WAVE 3June 2020 – Dec 2020 TOTAL
WAVES PLAN MAP 2020
Annualized Run Rate
$ in millions
$83 MM EBIT
Annualized Run Rate to Benefit 2021: $101 MM EBIT
Annualized Run Rate to Benefit 2022: $106 MM EBIT
INITIALTARGET
UPDATEDTARGET
TARGET
Annualized Run Rate to Benefit 2020:
TARGET TARGET
$102 MM EBIT
MANUFACTURING
PROCUREMENT
G&A
$101
$106
• Wave 1 completed ahead of initial target by 23%, or $19 mm• Procurement and G&A ahead of plan; manufacturing on plan• $7 mm originally targeted in manufacturing reclassified to G&A
• Some Wave 2 savings captured early
• Remain confident in total targeted savings of $290 mm
Waves Plan Summary: Wave 1 Exceeds Initial Target by 23%
11/12/2019 22

$53 Million Wave 1 Realized Savings Impact to FY19
Category Q1-Q3 FY 19 Q4 FY19 FY 19
Manufacturing $6 $5 $11
Procurement $4 $4 $8
G&A $22 $12 $34
TOTAL $32 $21 $53
• Figures show actual impact measured by financial performance from completed projects (not annualized run rate)
• $32 million realized during first nine months negated by continuing higher raw material costs that impacted RPM and its peers
$ in millions
11/12/2019 23

Fiscal 2019 Fourth-Quarter Adjusted Results
C O N S O L I D AT E D
Three mos. ended May 31 2019 2018 %
Sales $1,601 $1,558 +2.8%
Gross Profit $694 $656 +5.7%
SG&A $450 $459 (1.9)%
EBIT $241 $197 +22.4%
Net Income $163 $139 +17.5%
Diluted EPS $1.24 $1.02 +21.6%
C O N S U M E R
Three mos. ended May 31 2019 2018 %
Sales $585 $548 +6.7%
EBIT $110 $73 +50.6%
S P E C I A L T Y
Three mos. ended May 31 2019 2018 %
Sales $207 $197 +5.3%
EBIT $32 $34 (4.2)%
I N D U S T R I A L
Three mos. ended May 31 2019 2018 %
Sales $809 $813 (0.5)%
EBIT $116 $109 +5.9%
($ in millions, except per share amounts)SEGMENT RESULTS
• The fourth quarters of fiscal 2019 and 2018 included restructuring and other charges of $36.8 million and $62.2 million, respectively. Excluding the charges in both periods, adjusted EBIT increased 22.4%
• Due to changes in accounting standards for marketable securities, the company excluded the impact of all realized and unrealized gains and losses from investments in marketable equity securities from adjusted EPS for both fiscal 2019 and 2018. Their inherent volatility is outside of management’s control and cannot be predicted with any level of certainty. These investments resulted in a net after-tax loss of $1.7 million for the fourth quarter of fiscal 2019 and an after-tax gain of $3.2 million during the same quarter last year. Excluding the restructuring and other charges, as well as investment gains and losses, adjusted diluted EPS increased 21.6%.
• Recent share repurchases and the retirement of RPM’s 2.25% convertible senior notes due in 2020 resulted in $0.05 per diluted share accretion for the quarter.
• Tables reconciling this non-GAAP data with GAAP measures are available through our website, www.rpminc.com under Investor Information/Presentations.
11/12/2019 24
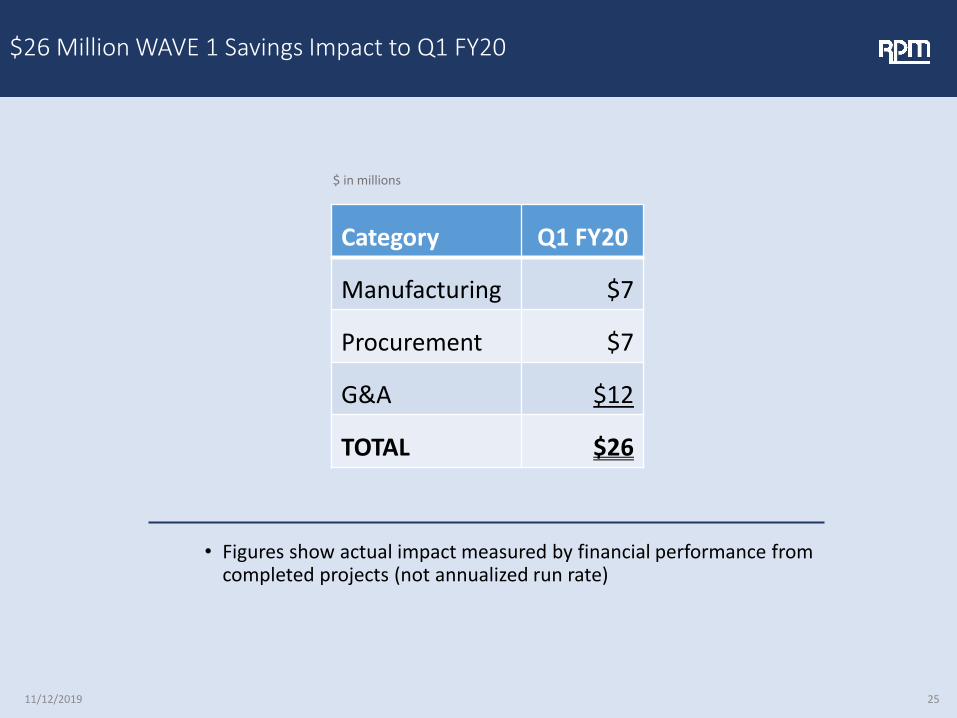
$26 Million WAVE 1 Savings Impact to Q1 FY20
Category Q1 FY20
Manufacturing $7
Procurement $7
G&A $12
TOTAL $26
• Figures show actual impact measured by financial performance from completed projects (not annualized run rate)
$ in millions
11/12/2019 25

C O N S O L I D AT E D
Three mos. ended August 31 2019 2018 %
Sales $1,473 $1,460 +0.9%
Gross Profit $579 $556 +4.2%
SG&A $385 $402 +4.3%
EBIT $193 $154 +25.3%
Net Income $124 $103 +20.1%
Diluted EPS $0.95 $0.76 +25.0%
PERFORMANCE COATINGS GROUP
Three mos. ended August 31 2019 2018 %
Sales $297 $296 +0.3%
EBIT $37 $28 +31.0%
CONSUMER GROUP
Three mos. ended August 31 2019 2018 %
Sales $479 $477 +0.4%
EBIT $62 $52 +18.6%
($ in millions, except per share amounts)CONSTRUCTION PRODUCTS GROUP
Three mos. ended August 31 2019 2018 %
Sales $536 $517 +3.6%
EBIT $87 $71 +23.1%
SPECIALTY PRODUCTS GROUP
Three mos. ended August 31 2019 2018 %
Sales $160 $169 (5.1)%
EBIT $29 $26 +8.5%
SEGMENT RESULTS
• Reflects restructuring and other charges, all of which have been incurred in relation to our 2020 Margin Acceleration Plan initiatives.• Investment returns include realized net gains and losses on sales of investments and unrealized net gains and losses on equity securities, which are adjusted
due to their inherent volatility. Management does not consider these gains and losses, which cannot be predicted with any level of certainty, to be reflective of the company's core business operations.
• Adjusted EPS is provided for the purpose of adjusting diluted earnings per share for items impacting earnings that are not considered by management to be indicative of ongoing operations.
• Tables reconciling this non-GAAP data with GAAP measures are available through our website, www.rpminc.com under Investor Information/Presentations.
Fiscal 2020 First-Quarter Adjusted Results
11/12/2019 26

Reclassification of Shipping Costs Puts RPM SG&A on Par with Peers
• In Fiscal 2020, classified shipping costs to customers as part of COGS instead of SG&A
• Change does not impact EBIT• Puts RPM in line with peers and
other manufacturers
• Provides investors with a better point of comparison
• Had change been in effect in fiscal 2019 -- COGS would have increased by $173.6 million to $3.48 billion, SG&A expenses would have decreased by the same amount to $1.60 billion
• Supports MAP to Growth findings and focus areas
SG&A AS A PERCENT OF SALES
FISC
AL 1
9AS
REP
ORT
ED
FISC
AL 1
9RE
CLAS
SIFI
ED
31.8%
28.7%
GROSS PROFIT MARGIN
FISC
AL 1
9AS
REP
ORT
ED
FISC
AL 1
9RE
CLAS
SIFI
ED
40.6%
37.5%
11/12/2019 27

Why RPM is a Great Investment Opportunity
Values-driven entrepreneurial growth
culture drives innovation, customer
intimacy andmarket responsiveness
Continuous improvement culture focused on greater operational effectiveness
in manufacturing, procurement,
IT and G&A+
Proven strategy delivers sustainable organic and acquisition growth Portfolio of leading brands that customers know and trust Track record of superior long-term returns for shareholders Disciplined capital allocation for growth initiatives and shareholder returns
=Improved
competitiveness in markets served and ability
to generate greater shareholder returns
11/12/2019 28

Premium brand strategy that offers speed, service, customized and advanced formulations
Industry leading technical specialists with a focus on application efficiency and solving unique problems consistently anywhere in the world
Highly trained feet on the street provides the power to create and drive markets
Leverage highly differentiated internal strategic technology platforms across operating segments with mature, emerging and niche markets
Driver of category growth with leading market innovation and customer centric focus
Our Unique Products and Services Along With Deep Diversification Allow More Stable Growth
11/12/2019 29

Global Opportunities for RPM to Continue to Grow
Sustainability: Increasing demand for sustainable products that are user friendly, environmentally safe, stable and provide greater energy efficiency
Technology: Expanding demand for new fire protection and hygienic/sanitary technologies, increased performance and innovative design in commercial and industrial applications
Specialization: Increasing demand for customized formulations and applications
Infrastructure: The strains of population growth and migration, urbanization and climate change offer business opportunities to rehabilitate or repair aging infrastructure
Product Lifecyle: Higher demand for repair and restoration solutions
11/12/2019 30

“Hire the best people you can find. Create an atmosphere
that will keep them. Then let them do their jobs.”
Frank C. Sullivan, 1947
31