more than words - abfer.orgabfer.org/media/abfer-events-2017/annual-conference/international... ·...
TRANSCRIPT

More Than Words A Textual Analysis of Monetary Policy Communication
Pongsak Luangaram Warapong Wongwachara
ABFER & CEBRA Session
May 2017

Central bank (CB) communication is a big deal

• Effective communication widely recognized as key for a successful conduct of monetary policy (Ehrmann and Fratzscher, 2005; Blinder et al., 2008)
• Linguistic analysis gaining more popularity (Hughes and Kesting, 2014; Praet, 2014)
• Computational linguistic tools – Macroeconomic effects of communication (Hansen
& McMahon, 2016) – Impact on financial market volatility of clarity
(Jansen, 2011; Jansen and de Hann, 2010) • Communication strategy (Levin, 2014)
Literature

• Multiple aspects i. Readability – the ease with which a reader can
understand a written text ii. Topics – the key themes iii. Tones – how positive / negative the outlook is in
the central bank’s language assessment • Coverage: Policy statements of Major and Inflation-
targeting (IT) CBs (N = 22) during 2000-2015 (T) • Exploratory & transmission analyses
Our contributions

Analytical framework (1)
‘Overall consumer prices, as measured by the price index for personal consumption expenditures, increased just 1 percent over the 12 months ending in April, up noticeably from its pace through much of last year but still well short of the Committee's 2 percent objective. Much of this shortfall continues to reflect earlier declines in energy prices and lower prices for imports.’
Readability
*Chair Janet L. Yellen Semiannual Monetary Policy Report to the Congress, June 2016
Flesch-Kincaid (FK) Grade Level Educational Testing Service (ETS) TextEvaluator
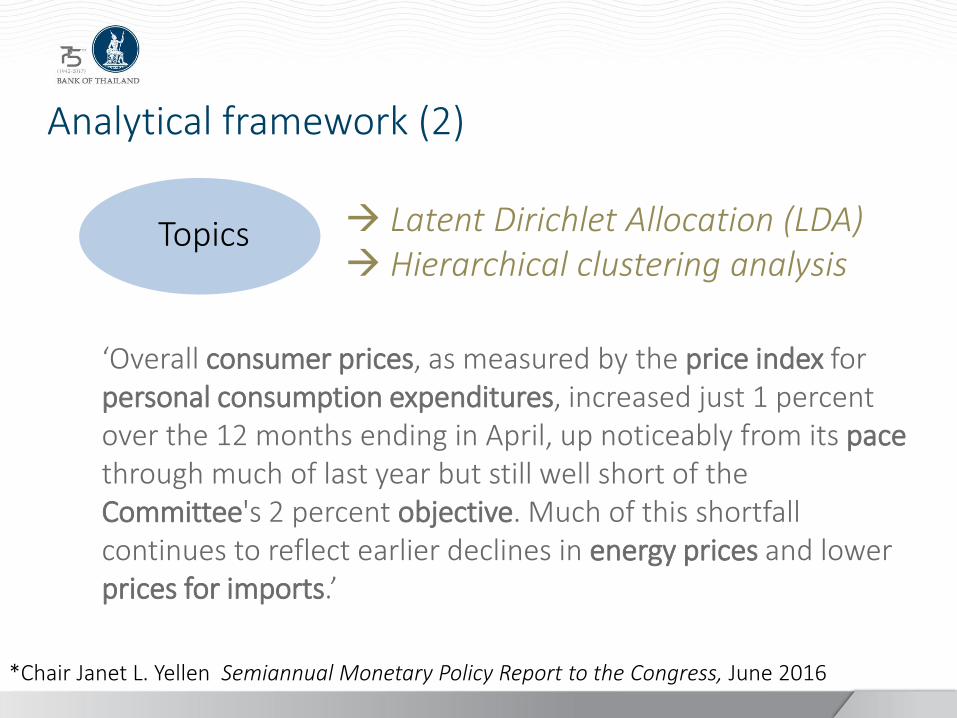
Analytical framework (2)
‘Overall consumer prices, as measured by the price index for personal consumption expenditures, increased just 1 percent over the 12 months ending in April, up noticeably from its pace through much of last year but still well short of the Committee's 2 percent objective. Much of this shortfall continues to reflect earlier declines in energy prices and lower prices for imports.’
Topics
*Chair Janet L. Yellen Semiannual Monetary Policy Report to the Congress, June 2016
Latent Dirichlet Allocation (LDA) Hierarchical clustering analysis

Analytical framework (3)
‘Overall consumer prices, as measured by the price index for personal consumption expenditures, increased just 1 percent over the 12 months ending in April, up noticeably from its pace through much of last year but still well short of the Committee's 2 percent objective. Much of this shortfall continues to reflect earlier declines in energy prices and lower prices for imports.’
Tones
*Chair Janet L. Yellen Semiannual Monetary Policy Report to the Congress, June 2016
Dictionary-based methods “Hawkish vs Dovish”

I. Complicated nature of communication - Advanced reader required
II. Complex decision making process - A fairly large number of issues revealed by
hierarchical clustering analysis III. Significant variation across N and T
- ITs: Inflation matters more than growth - Global topics more prominent since GFC - Tone potentially indicative of future rate decision
IV. Effectiveness of monetary policy transmission enhanced by communication*
Main results
*preliminary

7 Stylised Facts about CB Communication
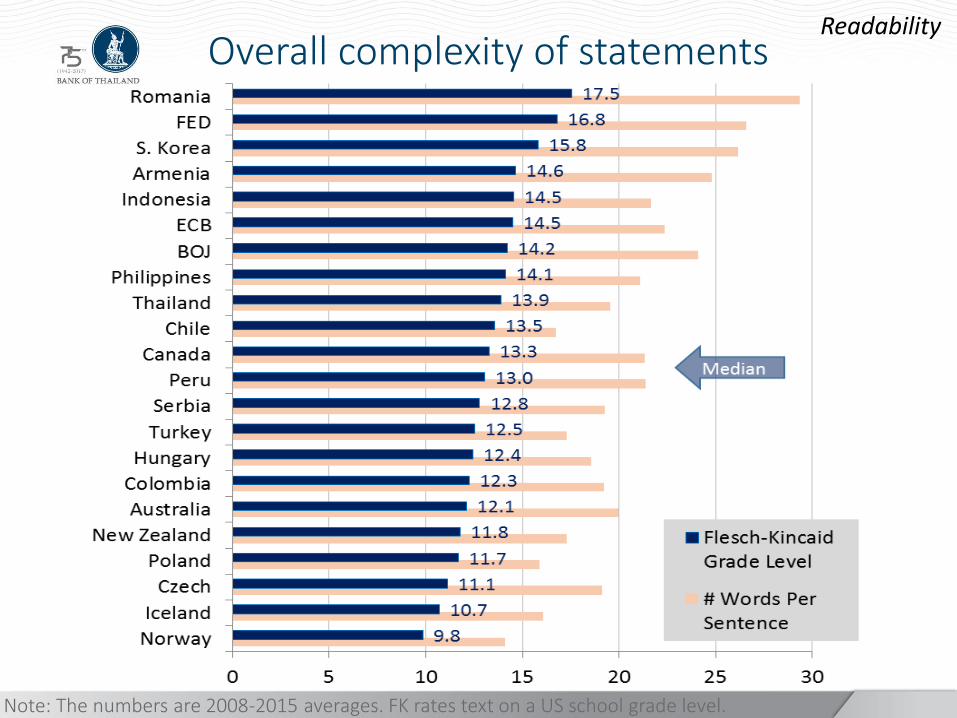
Overall complexity of statements Readability
Note: The numbers are 2008-2015 averages. FK rates text on a US school grade level.
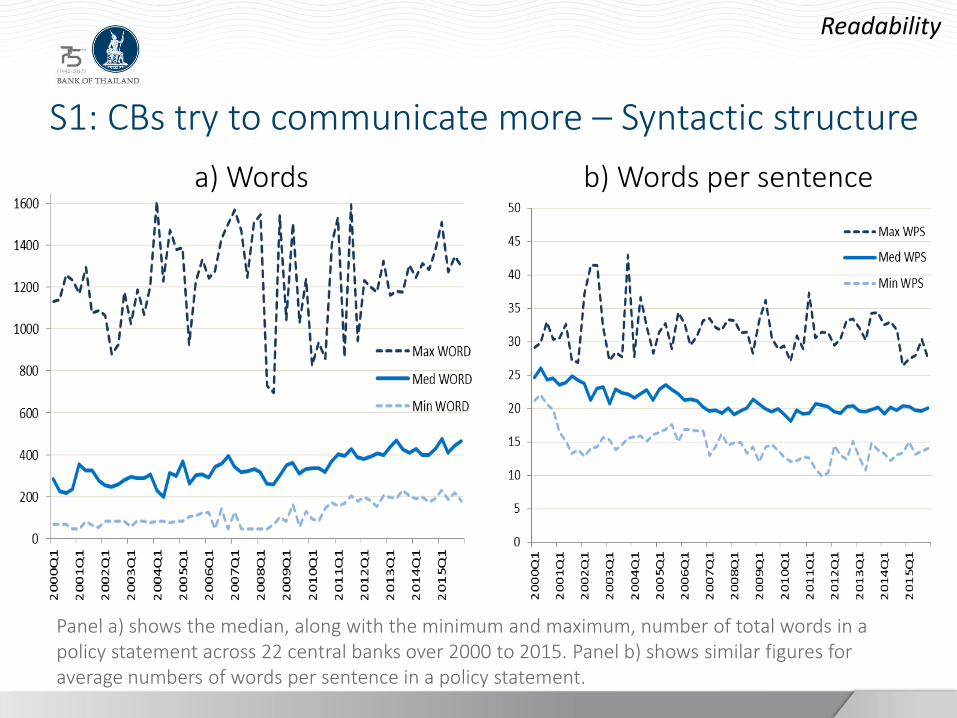
S1: CBs try to communicate more – Syntactic structure
Readability
Panel a) shows the median, along with the minimum and maximum, number of total words in a policy statement across 22 central banks over 2000 to 2015. Panel b) shows similar figures for average numbers of words per sentence in a policy statement.
a) Words b) Words per sentence

S2: Complexity is due largely to the use of ‘big words’
Readability
Panel a) shows the median, along with the minimum and maximum, of ETS Syntactic complexity scores across 22 central banks over 2000 to 2015. Panel b) shows similar figures for Academic words scores.
a) Syntactic complexity b) Academic words score
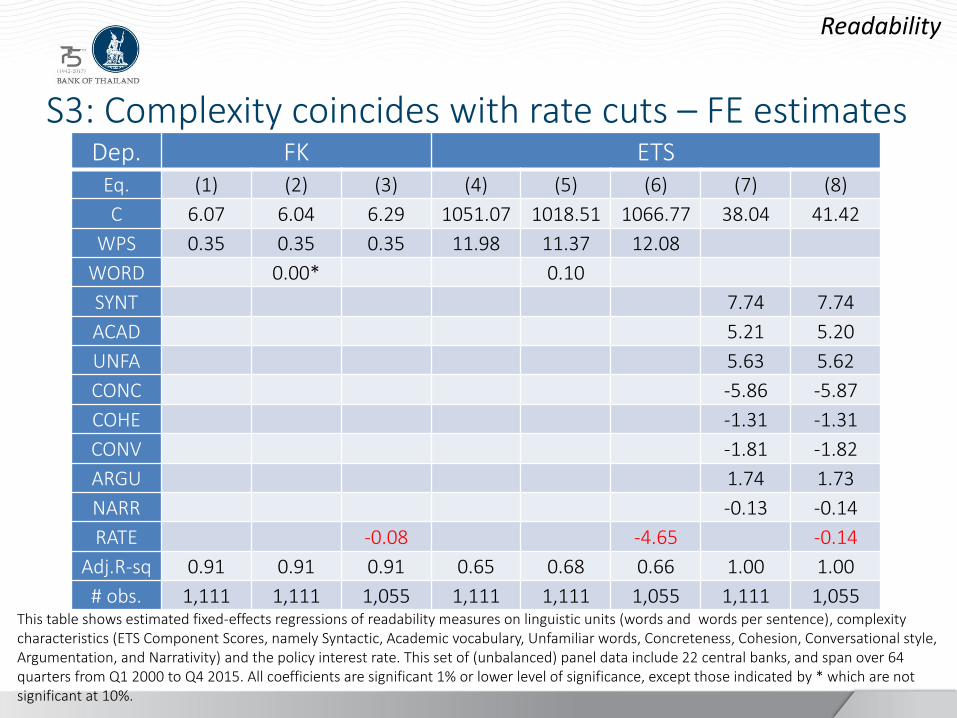
S3: Complexity coincides with rate cuts – FE estimates
Readability
Dep. FK ETS Eq. (1) (2) (3) (4) (5) (6) (7) (8)
C 6.07 6.04 6.29 1051.07 1018.51 1066.77 38.04 41.42
WPS 0.35 0.35 0.35 11.98 11.37 12.08
WORD 0.00* 0.10
SYNT 7.74 7.74
ACAD 5.21 5.20
UNFA 5.63 5.62
CONC -5.86 -5.87
COHE -1.31 -1.31
CONV -1.81 -1.82
ARGU 1.74 1.73
NARR -0.13 -0.14
RATE -0.08 -4.65 -0.14
Adj.R-sq 0.91 0.91 0.91 0.65 0.68 0.66 1.00 1.00
# obs. 1,111 1,111 1,055 1,111 1,111 1,055 1,111 1,055 This table shows estimated fixed-effects regressions of readability measures on linguistic units (words and words per sentence), complexity characteristics (ETS Component Scores, namely Syntactic, Academic vocabulary, Unfamiliar words, Concreteness, Cohesion, Conversational style, Argumentation, and Narrativity) and the policy interest rate. This set of (unbalanced) panel data include 22 central banks, and span over 64 quarters from Q1 2000 to Q4 2015. All coefficients are significant 1% or lower level of significance, except those indicated by * which are not significant at 10%.
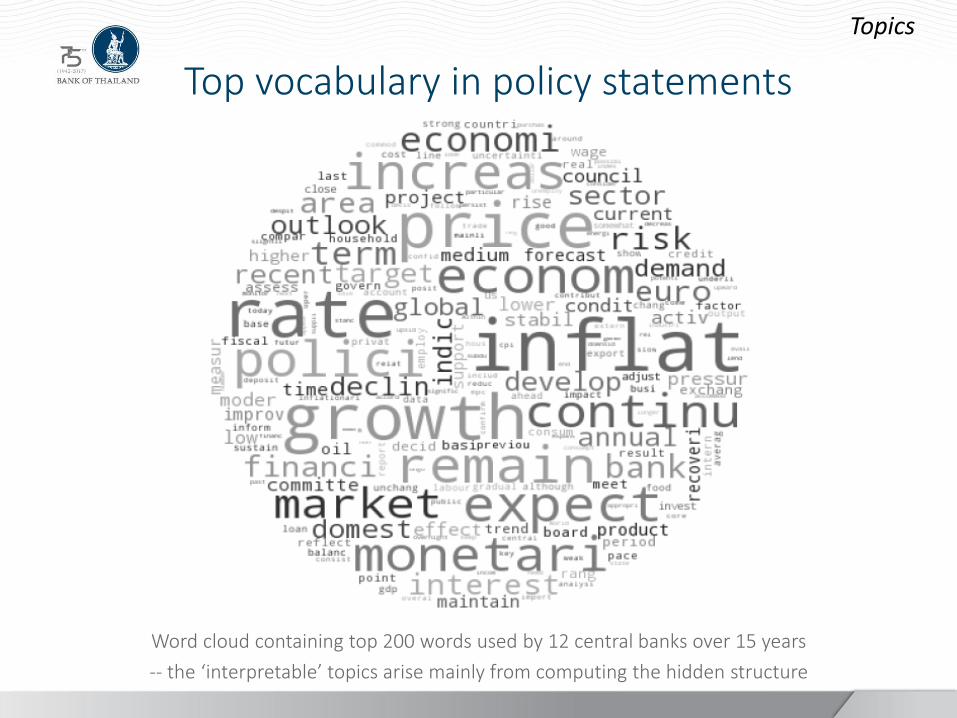
Top vocabulary in policy statements
Topics
Word cloud containing top 200 words used by 12 central banks over 15 years
-- the ‘interpretable’ topics arise mainly from computing the hidden structure
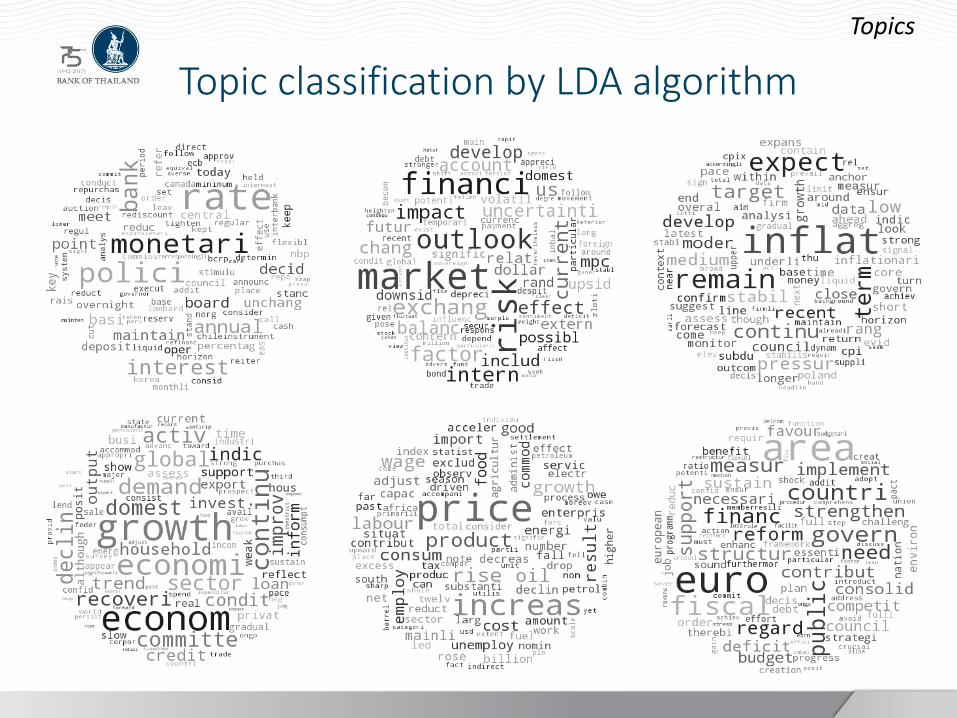
Topic classification by LDA algorithm
Topics

Tree-based hierarchical taxonomy of policy statements
The vertical axis represents Euclidean distance where the lower the height, the more similar are their word-use patterns.
Topics
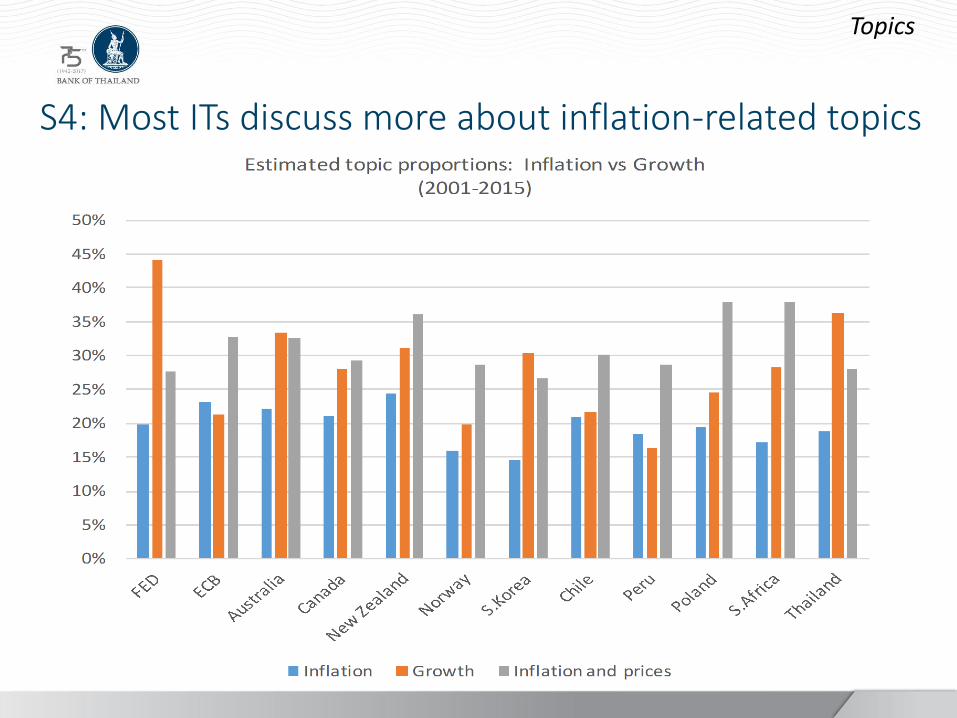
S4: Most ITs discuss more about inflation-related topics
Topics
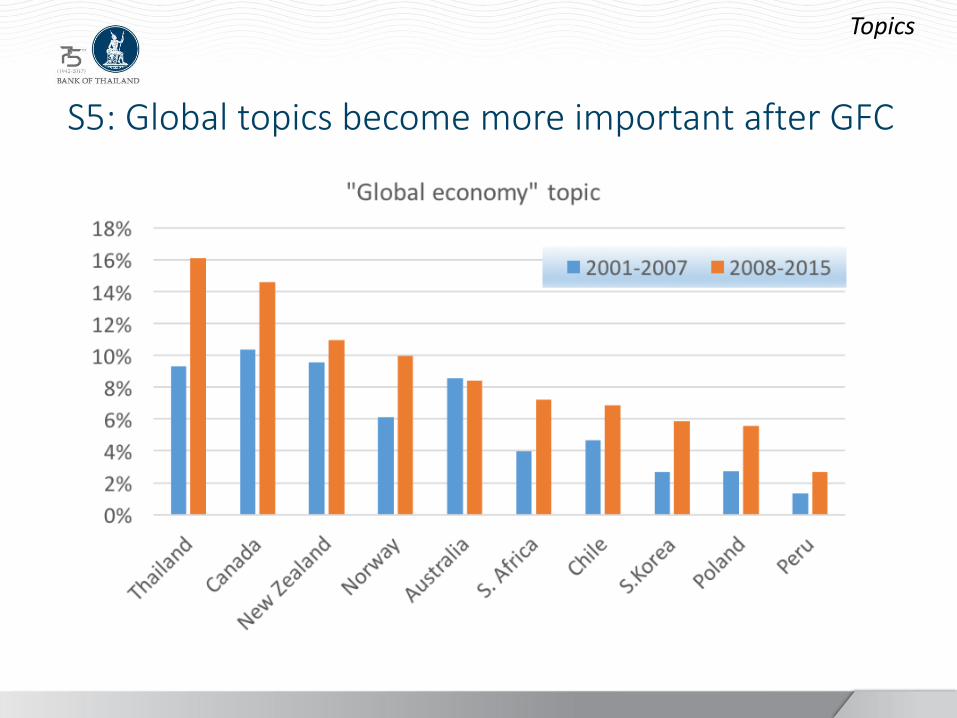
S5: Global topics become more important after GFC
Topics

S6: Uncertainty is prevalent among financial market topics
Topics

Policy rates vs Growth & Inflation tones – FOMC
Tones
-3
-2
-1
0
1
2
3
4
5
6
-.4
-.2
.0
.2
.4
01 02 03 04 05 06 07 08 09 10 11 12 13 14 15
Estimated tone of growth topics (RHS)
Fed funds rate (LHS)
'Shadow' fed funds rate: Wu-Xia (LHS)
Fed funds rate seems to be significantly related to net tone in economic growth topics, but not to net tone of inflation topics.
a) Growth topics b) Inflation topics
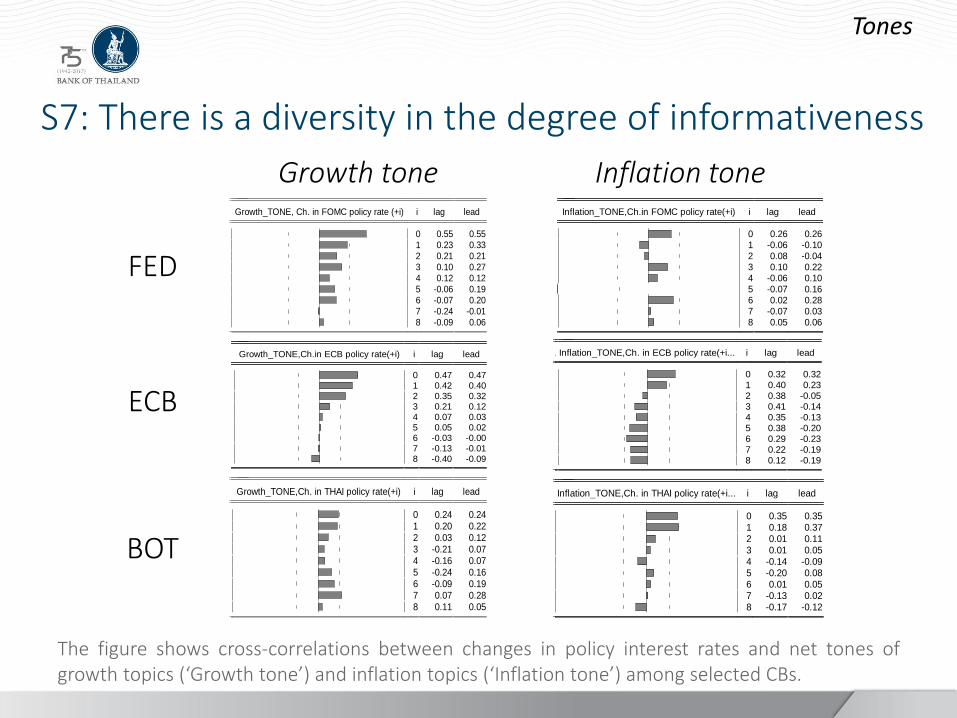
S7: There is a diversity in the degree of informativeness
Tones
The figure shows cross-correlations between changes in policy interest rates and net tones of growth topics (‘Growth tone’) and inflation topics (‘Inflation tone’) among selected CBs.
FED
Inflation_TONE, Ch. in FOMC policy rate(-i... Inflation_TONE,Ch.in FOMC policy rate(+i) i lag lead
0 0.26 0.261 -0.06 -0.102 0.08 -0.043 0.10 0.224 -0.06 0.105 -0.07 0.166 0.02 0.287 -0.07 0.038 0.05 0.06
Growth tone Inflation tone Growth_TONE, Ch. in FOMC policy rate (-i) Growth_TONE, Ch. in FOMC policy rate (+i) i lag lead
0 0.55 0.551 0.23 0.332 0.21 0.213 0.10 0.274 0.12 0.125 -0.06 0.196 -0.07 0.207 -0.24 -0.018 -0.09 0.06
ECB
BOT
Growth_TONE,Ch.in ECB policy rate(-i) Growth_TONE,Ch.in ECB policy rate(+i) i lag lead
0 0.47 0.471 0.42 0.402 0.35 0.323 0.21 0.124 0.07 0.035 0.05 0.026 -0.03 -0.007 -0.13 -0.018 -0.40 -0.09
Inflation_TONE,Ch. in ECB policy rate(-i... Inflation_TONE,Ch. in ECB policy rate(+i... i lag lead
0 0.32 0.321 0.40 0.232 0.38 -0.053 0.41 -0.144 0.35 -0.135 0.38 -0.206 0.29 -0.237 0.22 -0.198 0.12 -0.19
Growth_TONE,Ch. in THAI policy rate(-i) Growth_TONE,Ch. in THAI policy rate(+i) i lag lead
0 0.24 0.241 0.20 0.222 0.03 0.123 -0.21 0.074 -0.16 0.075 -0.24 0.166 -0.09 0.197 0.07 0.288 0.11 0.05
Inflation_TONE,Ch.in THAI policy rate(-i... Inflation_TONE,Ch. in THAI policy rate(+i... i lag lead
0 0.35 0.351 0.18 0.372 0.01 0.113 0.01 0.054 -0.14 -0.095 -0.20 0.086 0.01 0.057 -0.13 0.028 -0.17 -0.12

• Simple VAR of quarterly GDP growth, inflation, policy rate, and nominal effective exchange rate
• Generalised impulse response (Pesaran and Shin, 1998)
• “Switch on-off exercise” (Disyatat and Vongsinsirikul, 2003)
Impact of comm. = IRF with endogenous comm. – IRF with exogenous comm.
• Findings: – Contribution to transmission of monetary policy shocks to
GDP rather weak – Stronger contribution to inflation responses
Transmission analysis*
*preliminary
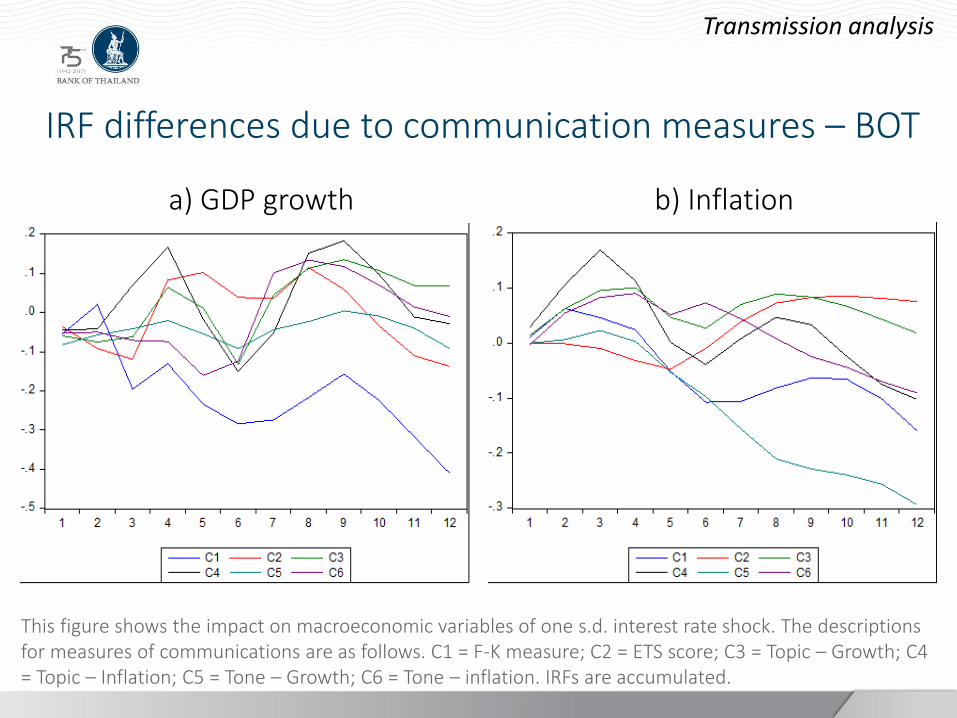
IRF differences due to communication measures – BOT
Transmission analysis
This figure shows the impact on macroeconomic variables of one s.d. interest rate shock. The descriptions for measures of communications are as follows. C1 = F-K measure; C2 = ETS score; C3 = Topic – Growth; C4 = Topic – Inflation; C5 = Tone – Growth; C6 = Tone – inflation. IRFs are accumulated.
a) GDP growth b) Inflation
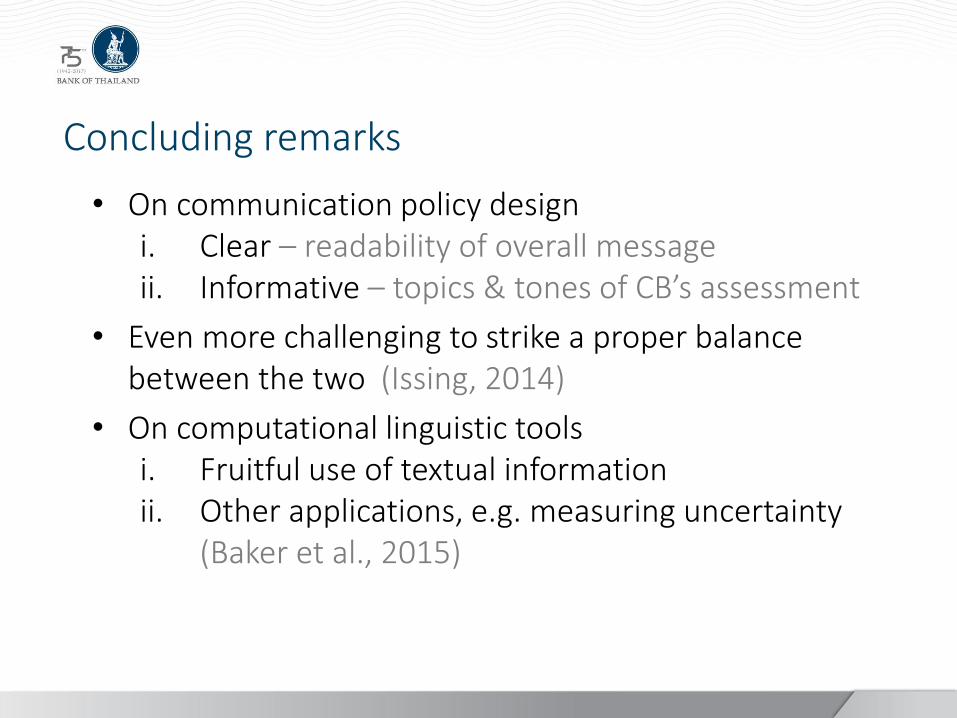
• On communication policy design i. Clear – readability of overall message ii. Informative – topics & tones of CB’s assessment
• Even more challenging to strike a proper balance between the two (Issing, 2014)
• On computational linguistic tools i. Fruitful use of textual information ii. Other applications, e.g. measuring uncertainty
(Baker et al., 2015)
Concluding remarks
Thank you