more on reliabilty - personality-project.org
TRANSCRIPT

Types of reliability Calculating reliabilities 2 6= 1 Intraclass correlations Kappa
More on reliabilty
Telemetrics lab
Department of PsychologyNorthwestern UniversityEvanston, Illinois USA
October, 2010

Types of reliability Calculating reliabilities 2 6= 1 Intraclass correlations Kappa
Outline
1 Types of reliabilityAlpha and its alternatives
2 Calculating reliabilitiesCongeneric measuresHierarchical structures
3 2 6= 1Multiple dimensions - falsely labeled as oneUsing score.items to find reliabilities of multiple scales
4 Intraclass correlationsICC of judges
5 KappaCohen’s kappaWeighted kappa

Types of reliability Calculating reliabilities 2 6= 1 Intraclass correlations Kappa
Types of reliability
Internal consistency
αωhierarchical
ωtotal
β
Intraclass
Agreement
Test-retest, alternateform
Generalizability
Internal consistency
alpha,score.itemsomegaiclust
icc
wkappa,cohen.kappa
cor
aov

Types of reliability Calculating reliabilities 2 6= 1 Intraclass correlations Kappa
Alpha and its alternatives
Alpha and its alternatives
Reliability = σ2t
σ2x
= 1− σ2e
σ2x
If there is another test, then σt = σt1t2 (covariance of test X1
with test X2 = Cxx)
But, if there is only one test, we can estimate σ2t based upon
the observed covariances within test 1
How do we find σ2e ?
The worst case, (Guttman case 1) all of an item’s variance iserror and thus the error variance of a test X withvariance-covariance Cx
Cx = σ2e = diag(Cx)
λ1 = Cx−diag(Cx )Cx
A better case (Guttman case 3, α) is that that the averagecovariance between the items on the test is the same as theaverage true score variance for each item.
Cx = σ2e = diag(Cx)
λ3 = α = λ1 ∗ nn−1 = (Cx−diag(Cx ))∗n/(n−1)
Cx

Types of reliability Calculating reliabilities 2 6= 1 Intraclass correlations Kappa
Alpha and its alternatives
Guttman 6: estimating using the Squared Multiple Correlation
Reliability = σ2t
σ2x
= 1− σ2e
σ2x
Estimate true item variance as squared multiple correlationwith other items
λ6 = (Cx−diag(Cx )+Σ(smci )Cx
This takes observed covariance, subtracts the diagonal, andreplaces with the squared multiple correlationSimilar to α which replaces with average inter-item covariance
Squared Multiple Correlation is found by smc and is justsmci = 1− 1/R−1
ii

Types of reliability Calculating reliabilities 2 6= 1 Intraclass correlations Kappa
Congeneric measures
Alpha and its alternatives: Case 1: congeneric measures
First, create some simulated data with a known structure> set.seed(42)
> v4 <- sim.congeneric(N=200,short=FALSE)
> str(v4) #show the structure of the resulting object
List of 6
$ model : num [1:4, 1:4] 1 0.56 0.48 0.4 0.56 1 0.42 0.35 0.48 0.42 ...
..- attr(*, "dimnames")=List of 2
.. ..$ : chr [1:4] "V1" "V2" "V3" "V4"
.. ..$ : chr [1:4] "V1" "V2" "V3" "V4"
$ pattern : num [1:4, 1:5] 0.8 0.7 0.6 0.5 0.6 ...
..- attr(*, "dimnames")=List of 2
.. ..$ : chr [1:4] "V1" "V2" "V3" "V4"
.. ..$ : chr [1:5] "theta" "e1" "e2" "e3" ...
$ r : num [1:4, 1:4] 1 0.546 0.466 0.341 0.546 ...
..- attr(*, "dimnames")=List of 2
.. ..$ : chr [1:4] "V1" "V2" "V3" "V4"
.. ..$ : chr [1:4] "V1" "V2" "V3" "V4"
$ latent : num [1:200, 1:5] 1.371 -0.565 0.363 0.633 0.404 ...
..- attr(*, "dimnames")=List of 2
.. ..$ : NULL
.. ..$ : chr [1:5] "theta" "e1" "e2" "e3" ...
$ observed: num [1:200, 1:4] -0.104 -0.251 0.993 1.742 -0.503 ...
..- attr(*, "dimnames")=List of 2
.. ..$ : NULL
.. ..$ : chr [1:4] "V1" "V2" "V3" "V4"
$ N : num 200
- attr(*, "class")= chr [1:2] "psych" "sim"

Types of reliability Calculating reliabilities 2 6= 1 Intraclass correlations Kappa
Congeneric measures
A congeneric model
> f1 <- fa(v4\$model)> fa.diagram(f1)
Factor Analysis
V1
V2
V3
V4
MR1
0.8
0.7
0.6
0.5
> v4$modelV1 V2 V3 V4
V1 1.00 0.56 0.48 0.40V2 0.56 1.00 0.42 0.35V3 0.48 0.42 1.00 0.30V4 0.40 0.35 0.30 1.00
> round(cor(v4$observed),2)V1 V2 V3 V4
V1 1.00 0.55 0.47 0.34V2 0.55 1.00 0.38 0.30V3 0.47 0.38 1.00 0.31V4 0.34 0.30 0.31 1.00

Types of reliability Calculating reliabilities 2 6= 1 Intraclass correlations Kappa
Congeneric measures
Find α and related stats for the simulated data
> alpha(v4$observed)
Reliability analysis
Call: alpha(x = v4$observed)
raw_alpha std.alpha G6(smc) average_r mean sd
0.71 0.72 0.67 0.39 -0.036 0.72
Reliability if an item is dropped:
raw_alpha std.alpha G6(smc) average_r
V1 0.59 0.60 0.50 0.33
V2 0.63 0.64 0.55 0.37
V3 0.65 0.66 0.59 0.40
V4 0.72 0.72 0.64 0.46
Item statistics
n r r.cor r.drop mean sd
V1 200 0.80 0.72 0.60 -0.015 0.93
V2 200 0.76 0.64 0.53 -0.060 0.98
V3 200 0.73 0.59 0.50 -0.119 0.92
V4 200 0.66 0.46 0.40 0.049 1.09

Types of reliability Calculating reliabilities 2 6= 1 Intraclass correlations Kappa
Hierarchical structures
A hierarchical structure
cor.plot(r9)
Correlation plot
0
0.12
0.25
0.38
0.5
0.62
0.75
0.88
1
V1 V2 V3 V4 V5 V6 V7 V8 V9 key
V9
V8
V7
V6
V5
V4
V3
V2
V1
> set.seed(42)
> r9 <- sim.hierarchical()
> round(r9,2)
V1 V2 V3 V4 V5 V6 V7 V8 V9
V1 1.00 0.56 0.48 0.40 0.35 0.29 0.30 0.25 0.20
V2 0.56 1.00 0.42 0.35 0.30 0.25 0.26 0.22 0.18
V3 0.48 0.42 1.00 0.30 0.26 0.22 0.23 0.19 0.15
V4 0.40 0.35 0.30 1.00 0.42 0.35 0.24 0.20 0.16
V5 0.35 0.30 0.26 0.42 1.00 0.30 0.20 0.17 0.13
V6 0.29 0.25 0.22 0.35 0.30 1.00 0.17 0.14 0.11
V7 0.30 0.26 0.23 0.24 0.20 0.17 1.00 0.30 0.24
V8 0.25 0.22 0.19 0.20 0.17 0.14 0.30 1.00 0.20
V9 0.20 0.18 0.15 0.16 0.13 0.11 0.24 0.20 1.00

Types of reliability Calculating reliabilities 2 6= 1 Intraclass correlations Kappa
Hierarchical structures
α of the 9 hierarchical variables
> alpha(r9)
Reliability analysis
Call: alpha(x = r9)
raw_alpha std.alpha G6(smc) average_r
0.76 0.76 0.76 0.26
Reliability if an item is dropped:
raw_alpha std.alpha G6(smc) average_r
V1 0.71 0.71 0.70 0.24
V2 0.72 0.72 0.71 0.25
V3 0.74 0.74 0.73 0.26
V4 0.73 0.73 0.72 0.25
V5 0.74 0.74 0.73 0.26
V6 0.75 0.75 0.74 0.27
V7 0.75 0.75 0.74 0.27
V8 0.76 0.76 0.75 0.28
V9 0.77 0.77 0.76 0.29
Item statistics
r r.cor
V1 0.72 0.71
V2 0.67 0.63
V3 0.61 0.55
V4 0.65 0.59
V5 0.59 0.52
V6 0.53 0.43
V7 0.56 0.46
V8 0.50 0.39
V9 0.45 0.32

Types of reliability Calculating reliabilities 2 6= 1 Intraclass correlations Kappa
Multiple dimensions - falsely labeled as one
An example of two different scales confused as one
Correlation plot
-1
-0.71
-0.43
-0.14
0.14
0.43
0.71
1
V1 V2 V3 V4 V5 V6 V7 V8 key
V8
V7
V6
V5
V4
V3
V2
V1
> set.seed(17)
> two.f <- sim.item(8)
> round(cor(two.f),2)
V1 V2 V3 V4 V5 V6 V7 V8
V1 1.00 0.29 0.05 0.03 -0.38 -0.38 -0.06 -0.08
V2 0.29 1.00 0.03 -0.02 -0.35 -0.33 0.02 -0.04
V3 0.05 0.03 1.00 0.34 -0.02 -0.10 -0.40 -0.39
V4 0.03 -0.02 0.34 1.00 -0.01 0.06 -0.36 -0.37
V5 -0.38 -0.35 -0.02 -0.01 1.00 0.33 0.03 0.05
V6 -0.38 -0.33 -0.10 0.06 0.33 1.00 0.04 0.03
V7 -0.06 0.02 -0.40 -0.36 0.03 0.04 1.00 0.37
V8 -0.08 -0.04 -0.39 -0.37 0.05 0.03 0.37 1.00
> cor.plot(cor(two.f),zlim=c(-1,1),colors=TRUE)

Types of reliability Calculating reliabilities 2 6= 1 Intraclass correlations Kappa
Multiple dimensions - falsely labeled as one
α of two scales confused as one
Note the use of the keys parameter to specify how some itemsshould be reversed.> alpha(two.f,keys=c(rep(1,4),rep(-1,4)))
Reliability analysis
Call: alpha(x = two.f, keys = c(rep(1, 4), rep(-1, 4)))
raw_alpha std.alpha G6(smc) average_r mean sd
0.62 0.62 0.65 0.17 -0.0051 0.27
Reliability if an item is dropped:
raw_alpha std.alpha G6(smc) average_r
V1 0.59 0.58 0.61 0.17
V2 0.61 0.60 0.63 0.18
V3 0.58 0.58 0.60 0.16
V4 0.60 0.60 0.62 0.18
V5 0.59 0.59 0.61 0.17
V6 0.59 0.59 0.61 0.17
V7 0.58 0.58 0.61 0.17
V8 0.58 0.58 0.60 0.16
Item statistics
n r r.cor r.drop mean sd
V1 500 0.54 0.44 0.33 0.063 1.01
V2 500 0.48 0.35 0.26 0.070 0.95
V3 500 0.56 0.47 0.36 -0.030 1.01
V4 500 0.48 0.37 0.28 -0.130 0.97
V5 500 0.52 0.42 0.31 -0.073 0.97
V6 500 0.52 0.41 0.31 -0.071 0.95
V7 500 0.53 0.44 0.34 0.035 1.00
V8 500 0.56 0.47 0.36 0.097 1.02

Types of reliability Calculating reliabilities 2 6= 1 Intraclass correlations Kappa
Using score.items to find reliabilities of multiple scales
Score as two different scales
First, make up a keys matrix to specify which items should bescored, and in which way> keys <- make.keys(nvars=8,keys.list=list(one=c(1,2,-5,-6),two=c(3,4,-7,-8)))
> keys
one two
[1,] 1 0
[2,] 1 0
[3,] 0 1
[4,] 0 1
[5,] -1 0
[6,] -1 0
[7,] 0 -1
[8,] 0 -1

Types of reliability Calculating reliabilities 2 6= 1 Intraclass correlations Kappa
Using score.items to find reliabilities of multiple scales
Now score the two scales and find α and other reliability estimates
> score.items(keys,two.f)
Call: score.items(keys = keys, items = two.f)
(Unstandardized) Alpha:
one two
alpha 0.68 0.7
Average item correlation:
one two
average.r 0.34 0.37
Guttman 6* reliability:
one two
Lambda.6 0.62 0.64
Scale intercorrelations corrected for attenuation
raw correlations below the diagonal, alpha on the diagonal
corrected correlations above the diagonal:
one two
one 0.68 0.08
two 0.06 0.70
Item by scale correlations:
corrected for item overlap and scale reliability
one two
V1 0.57 0.09
V2 0.52 0.01
V3 0.09 0.59
V4 -0.02 0.56
V5 -0.58 -0.05
V6 -0.57 -0.05
V7 -0.05 -0.58
V8 -0.09 -0.59
Types of reliability Calculating reliabilities 2 6= 1 Intraclass correlations Kappa
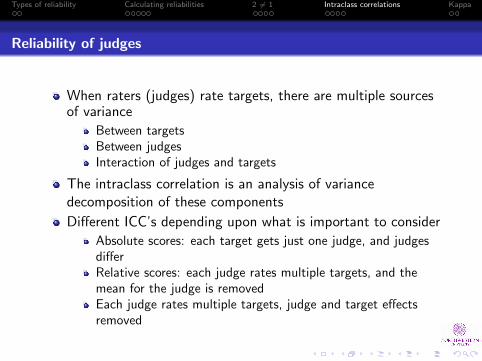
Reliability of judges
When raters (judges) rate targets, there are multiple sourcesof variance
Between targetsBetween judgesInteraction of judges and targets
The intraclass correlation is an analysis of variancedecomposition of these components
Different ICC’s depending upon what is important to consider
Absolute scores: each target gets just one judge, and judgesdifferRelative scores: each judge rates multiple targets, and themean for the judge is removedEach judge rates multiple targets, judge and target effectsremoved

Types of reliability Calculating reliabilities 2 6= 1 Intraclass correlations Kappa
ICC of judges
Ratings of judges
What is the reliability of ratings of different judges across ratees?It depends. Depends upon the pairing of judges, depends upon thetargets. ICC does an Anova decomposition.
> Ratings
J1 J2 J3 J4 J5 J6
1 1 1 6 2 3 6
2 2 2 7 4 1 2
3 3 3 8 6 5 10
4 4 4 9 8 2 4
5 5 5 10 10 6 12
6 6 6 11 12 4 8
> describe(Ratings,skew=FALSE)
var n mean sd median trimmed mad min max range se
J1 1 6 3.5 1.87 3.5 3.5 2.22 1 6 5 0.76
J2 2 6 3.5 1.87 3.5 3.5 2.22 1 6 5 0.76
J3 3 6 8.5 1.87 8.5 8.5 2.22 6 11 5 0.76
J4 4 6 7.0 3.74 7.0 7.0 4.45 2 12 10 1.53
J5 5 6 3.5 1.87 3.5 3.5 2.22 1 6 5 0.76
J6 6 6 7.0 3.74 7.0 7.0 4.45 2 12 10 1.53
1 1
1
1
1
1
1 2 3 4 5 6
24
68
1012
judge
Ratings
2 2
2
2
2
2
3 3
3
3
3
3
4 4
4
4
4
4
5 5
5 5
5
5
6 6
6
6
6
6

Types of reliability Calculating reliabilities 2 6= 1 Intraclass correlations Kappa
ICC of judges
Sources of variances and the Intraclass Correlation Coefficient
Table: Sources of variances and the Intraclass Correlation Coefficient.
(J1, J2) (J3, J4) (J5, J6) (J1, J3) (J1, J5) (J1 ... J3) (J1 ... J4) (J1 ... J6)Variance estimates
MSb 7 15.75 15.75 7.0 5.2 10.50 21.88 28.33MSw 0 2.58 7.58 12.5 1.5 8.33 7.12 7.38MSj 0 6.75 36.75 75.0 0.0 50.00 38.38 30.60MSe 0 1.75 1.75 0.0 1.8 0.00 .88 2.73
Intraclass correlationsICC(1,1) 1.00 .72 .35 -.28 .55 .08 .34 .32ICC(2,1) 1.00 .73 .48 .22 .53 .30 .42 .37ICC(3,1) 1.00 .80 .80 1.00 .49 1.00 .86 .61ICC(1,k) 1.00 .84 .52 -.79 .71 .21 .67 .74ICC(2,k) 1.00 .85 .65 .36 .69 .56 .75 .78ICC(3,k) 1.00 .89 .89 1.00 .65 1.00 .96 .90
1 1
1
1
1
1
1 2 3 4 5 6
24
68
1012
judge
Ratings
2 2
2
2
2
2
3 3
3
3
3
3
4 4
4
4
4
4
5 5
5 5
5
5
6 6
6
6
6
6

Types of reliability Calculating reliabilities 2 6= 1 Intraclass correlations Kappa
ICC of judges
ICC is done by calling anova
aov.x <- aov(values ~ subs + ind, data = x.df)
s.aov <- summary(aov.x)
stats <- matrix(unlist(s.aov), ncol = 3, byrow = TRUE)
MSB <- stats[3, 1]
MSW <- (stats[2, 2] + stats[2, 3])/(stats[1, 2] + stats[1,
3])
MSJ <- stats[3, 2]
MSE <- stats[3, 3]
ICC1 <- (MSB - MSW)/(MSB + (nj - 1) * MSW)
ICC2 <- (MSB - MSE)/(MSB + (nj - 1) * MSE + nj * (MSJ - MSE)/n.obs)
ICC3 <- (MSB - MSE)/(MSB + (nj - 1) * MSE)
ICC12 <- (MSB - MSW)/(MSB)
ICC22 <- (MSB - MSE)/(MSB + (MSJ - MSE)/n.obs)
ICC32 <- (MSB - MSE)/MSB

Types of reliability Calculating reliabilities 2 6= 1 Intraclass correlations Kappa
ICC of judges
Intraclass Correlations using the ICC function
> print(ICC(Ratings),all=TRUE) #get more output than normal
$results
type ICC F df1 df2 p lower bound upper bound
Single_raters_absolute ICC1 0.32 3.84 5 30 0.01 0.04 0.79
Single_random_raters ICC2 0.37 10.37 5 25 0.00 0.09 0.80
Single_fixed_raters ICC3 0.61 10.37 5 25 0.00 0.28 0.91
Average_raters_absolute ICC1k 0.74 3.84 5 30 0.01 0.21 0.96
Average_random_raters ICC2k 0.78 10.37 5 25 0.00 0.38 0.96
Average_fixed_raters ICC3k 0.90 10.37 5 25 0.00 0.70 0.98
$summary
Df Sum Sq Mean Sq F value Pr(>F)
subs 5 141.667 28.3333 10.366 1.801e-05 ***
ind 5 153.000 30.6000 11.195 9.644e-06 ***
Residuals 25 68.333 2.7333
---
Signif. codes: 0 O***~O 0.001 O**~O 0.01 O*~O 0.05 O.~O 0.1 O ~O 1
$stats
[,1] [,2] [,3]
[1,] 5.000000e+00 5.000000e+00 25.000000
[2,] 1.416667e+02 1.530000e+02 68.333333
[3,] 2.833333e+01 3.060000e+01 2.733333
[4,] 1.036585e+01 1.119512e+01 NA
[5,] 1.800581e-05 9.644359e-06 NA
$MSW
[1] 7.377778
$Call
ICC(x = Ratings)
$n.obs
[1] 6
$n.judge
[1] 6

Types of reliability Calculating reliabilities 2 6= 1 Intraclass correlations Kappa
Cohen’s kappa
Cohen’s kappa and weighted kappa
When considering agreement in diagnostic categories, withoutnumerical values, it is useful to consider the kappa coefficient.
Emphasizes matches of ratingsDoesn’t consider how far off disagreements are.
Weighted kappa weights the off diagonal distance.
Diagnostic categories: normal, neurotic, psychotic

Types of reliability Calculating reliabilities 2 6= 1 Intraclass correlations Kappa
Weighted kappa
Cohen kappa and weighted kappa
> cohen
[,1] [,2] [,3]
[1,] 0.44 0.07 0.09
[2,] 0.05 0.20 0.05
[3,] 0.01 0.03 0.06
> cohen.weights
[,1] [,2] [,3]
[1,] 0 1 3
[2,] 1 0 6
[3,] 3 6 0
> cohen.kappa(cohen,cohen.weights)
Call: cohen.kappa1(x = x, w = w, n.obs = n.obs, alpha = alpha)
Cohen Kappa and Weighted Kappa correlation coefficients and confidence boundaries
lower estimate upper
unweighted kappa -0.92 0.49 1.9
weighted kappa -10.04 0.35 10.7
see the other examples in ?cohen.kappa